Larval Production and Mortality of Pacific Saury, Cololabis saira,
13
Larval Production and Mortality of Pacific Saury, Cololabis saira, in the Northwestern Pacific Ocean' Yoshiro Watanabe and Nancy C. H. Lo ABSTRACT: Because quantitative samples of saury eggs are difficult to obtain owing to their adhesive nature, reproductive level of the Pacific saury, Cololabis saira, has been estimated from the standing stock of the larvae and juveniles in Japan. Mortality curves were constructed and daily larval production at hatching was estimated for combined data from 1972 to 1986 and for consecutive individ- ual years within this period. Durations of size classes were estimated from a growth curve and used to calculate fish production at age. Because number of fish captured by a net tow (area = 401.3 mZ) showed a diel cycle due to fish behaviors, such as net frame evasion and diel vertical movement, the average mortality curve for 15 years was based on data collected at night. We used an exponential decay model to describe the mortality of saury lar- vae and juveniles. The daily instantaneous mortal- ity rate was 0.078, and the larval production at hatching was 1.255 larva/tow/day. Mortality curves for the individual years were based on data col- lected throughout the day and night after correc- tion by size- and time-specific retention rates. Daily larval production at hatching fluctuated among in- dividual years ranging from 0.154 to 5.176. Daily instantaneous mortality rates positively correlated with larval production at hatching, which might indicate the presence of a density-dependent pro- cess in larval mortality. Together with the Japanese sardine, Sardinops melanostieta, and the mackerels, Scomber japonicus and S. australasicus, the Pacific saury, Cololabis saira (Brevoort), is one of the most important offshore pelagic fishes in Japan. Although total catch of the saury in Japan (210,000 t [metric tons] in 1984) was much small- er than that of the sardine (4,180,000 t) or the mackerels (810,000 t) (Statistics and Information 'Contribution No. 432 from Tohoku Regional Fisheries Research Laboratory, Fisheries Agency, Shiogama. Miyagi, Japan. Yoshiro Watanabe, Tohoku Regional Fisheries Research Laboratory, Fisheries Agency. 3-27-5 Shinhama. ShiOgamd. Miyagi 985, Japan. Nancy C. H. Lo, Southwest Fisheries Center La Jolla Lab- oratory, National Marine Fisheries Service. NOAA. P.O. Box 271, La Jolla, CA 92038. I2.S.A. Department, Japan 1986), more than 95% of the catch is destined for human consumption (Japan Saury Fishery Association 1985). In sharp con- trast, the sardine (81%) and the mackerel (4070) catches (Fisheries Agency 1985) are procesed for animal foods. Saury fishermen in Japan expect to have a reliable fishing forecast provided by the Tohoku Regional Fisheries Research Laboratory, Fish- eries Agency of Japan, every summer before the beginning of the fishing season. The forecast in- cludes the expected catch in the coming season and the potential fishing grounds. The expected catch depends on fish stock size, and the location and size of the fishing grounds are a function of fish migration in relation to oceanographic condi- tions. Fish stock size is determined by both reproductive level and mortality rates of devel- opmental stages from postspawning through re- cruitment. Since the saury grows rapidly and becomes an adult within one year (Watanabe et al. 1988), larval production and mortality rate in young stages are believed to be more or less directly related to recruitment and catchable stock size. Matsumiya and Tanaka (1978) sug- gested from their intensive study of population dynamics of the northwestern Pacific saury that the fluctuations of population size are seriously affected by reproductive success. An egg survey may be the best method for estimating the reproduction level of pelagic fishes. However, it is difficult to conduct a quan- titative egg survey of the saury by towing plank- ton nets because the eggs attach by filaments to floating objects such as drifting kelp. We there- fore have been conducting larval and juvenile surveys to estimate the reproductive level. We use catch/tow (number of fishinet tow) values of several size classes as abundance indices. The year-to-year changes of the indices may reflect the fluctuation of reproductive level. The apparent number of larvae in a size class is influenced by the duration of growth through that size class. If growth is slow, the duration will be extended; conversely, if growth is fast, the duration will be short. The duration of growth through a size class thus defines the 601 Manuscript accepted November 19%. Fishery Bulletin, U.S. 78601-613.
Transcript of Larval Production and Mortality of Pacific Saury, Cololabis saira,
Larval Production and Mortality of Pacific Saury, Cololabis saira, in the Northwestern Pacific Ocean'
Yoshiro Watanabe and Nancy C. H. Lo
ABSTRACT: Because quantitative samples of saury eggs are difficult to obtain owing to their adhesive nature, reproductive level of the Pacific saury, Cololabis saira, has been estimated from the standing stock of the larvae and juveniles in Japan. Mortality curves were constructed and daily larval production at hatching was estimated for combined data from 1972 to 1986 and for consecutive individ- ual years within this period. Durations of size classes were estimated from a growth curve and used to calculate fish production at age. Because number of fish captured by a net tow (area = 401.3 mZ) showed a diel cycle due to fish behaviors, such as net frame evasion and diel vertical movement, the average mortality curve for 15 years was based on data collected a t night. We used an exponential decay model to describe the mortality of saury lar- vae and juveniles. The daily instantaneous mortal- ity rate was 0.078, and the larval production at hatching was 1.255 larva/tow/day. Mortality curves for the individual years were based on data col- lected throughout the day and night after correc- tion by size- and time-specific retention rates. Daily larval production a t hatching fluctuated among in- dividual years ranging from 0.154 to 5.176. Daily instantaneous mortality rates positively correlated with larval production at hatching, which might indicate the presence of a density-dependent pro- cess in larval mortality.
Together with the Japanese sardine, Sardinops melanostieta, and the mackerels, Scomber japonicus and S. australasicus, the Pacific saury, Cololabis saira (Brevoort), is one of the most important offshore pelagic fishes in Japan. Although total catch of the saury in Japan (210,000 t [metric tons] in 1984) was much small- er than that of the sardine (4,180,000 t) or the mackerels (810,000 t) (Statistics and Information
'Contribution No. 432 from Tohoku Regional Fisheries Research Laboratory, Fisheries Agency, Shiogama. Miyagi, Japan.
Yoshiro Watanabe, Tohoku Regional Fisheries Research Laboratory, Fisheries Agency. 3-27-5 Shinhama. ShiOgamd. Miyagi 985, Japan. Nancy C. H. Lo, Southwest Fisheries Center La Jolla Lab- oratory, National Marine Fisheries Service. NOAA. P.O. Box 271, La Jolla, CA 92038. I2.S.A.
Department, Japan 1986), more than 95% of the catch is destined for human consumption (Japan Saury Fishery Association 1985). In sharp con- trast, the sardine (81%) and the mackerel (4070) catches (Fisheries Agency 1985) are procesed for animal foods.
Saury fishermen in Japan expect to have a reliable fishing forecast provided by the Tohoku Regional Fisheries Research Laboratory, Fish- eries Agency of Japan, every summer before the beginning of the fishing season. The forecast in- cludes the expected catch in the coming season and the potential fishing grounds. The expected catch depends on fish stock size, and the location and size of the fishing grounds are a function of fish migration in relation to oceanographic condi- tions. Fish stock size is determined by both reproductive level and mortality rates of devel- opmental stages from postspawning through re- cruitment. Since the saury grows rapidly and becomes an adult within one year (Watanabe et al. 1988), larval production and mortality rate in young stages are believed to be more or less directly related to recruitment and catchable stock size. Matsumiya and Tanaka (1978) sug- gested from their intensive study of population dynamics of the northwestern Pacific saury that the fluctuations of population size are seriously affected by reproductive success.
An egg survey may be the best method for estimating the reproduction level of pelagic fishes. However, it is difficult to conduct a quan- titative egg survey of the saury by towing plank- ton nets because the eggs attach by filaments to floating objects such as drifting kelp. We there- fore have been conducting larval and juvenile surveys to estimate the reproductive level. We use catch/tow (number of fishinet tow) values of several size classes as abundance indices. The year-to-year changes of the indices may reflect the fluctuation of reproductive level.
The apparent number of larvae in a size class is influenced by the duration of growth through that size class. If growth is slow, the duration will be extended; conversely, if growth is fast, the duration will be short. The duration of growth through a size class thus defines the
601 Manuscript accepted November 19%. Fishery Bulletin, U.S. 78601-613.
F I S H E R Y BULLETIN: VOL. 87. NO. 3. 1989
part was 0.33 mm. Samples were washed down after the 5 min tow and preserved in 10% unbuf- fered formalin. Larvae and juveniles of saury were measured to the nearest 0.1 mm knob length (KnL), the distance from the tip of the lower jaw t o the posterior end of a muscular knob at the base of the caudal peduncle. They were then grouped into 11 size classes from 7.5 mm (including 5.0-9.9 mm) up to 57.5 mm (55.0-59.9 mm). The midpoint and both limits of each class were then converted into the capture size before preservation, using a shrinkage fac- tor by formalin preservation (0.97) reported by Theilacker (1980) for northern anchovy. The midpoint of each size class was used to represent the class, though it is not a mean age of the class. The capture size was converted to age, and dura- tion of each size class was obtained using the growth model developed by Watanabe et al. (1988). The growth equation from hatching to a 100 mm juvenule is
amount of time that larvae or juveniles are vul- nerable to capture. Because the growth rate is not constant over the size range of the young fish sampled in this study, we must correct for this bias. The production of larvae by age is defined as the abundance of larvae by size divided by the duration of growth through the size class, which is expressed as catch/tow/day. This allows us to calculate instantaneous mortality rate (IMR), and thus, construct a mortality curve. We need to know age and growth rate of saury to calcu- late production at age and mortality rates.
In northern anchovy, Engraulis mordax, there have been extensive studies of eggs and larvae, and the methods to calculate the produc- tion and mortality rate were established (Zweifel and Smith 1981; Lasker 1985; Lo 1985; 1986). Ichthyoplankton survey data, embryonic incuba- tion times, and larval growth rates are the es- sential parameters for this method. Further, one needs to have information on possible biases of tow data. For the Pacific saury, we have 15 years of larval net-tow data, a newly developed growth model based upon otolith growth incre- ments (Watanabe et al. 1988), and information on bias correction of tow data for day and night differences. All these make it possible to com- pute fish production at different ages and mor- talities. Extending the mortality curve to age 0, we can calculate larval production at hatching, which might be the best index of reproductive level so far available. In this paper we selected the exponential decay mortality curve and used it to calculate the larval production at hatching and the daily IMR of Pacific saury in the north- western Pacific Ocean for 1972-86.
METHODS Data Source
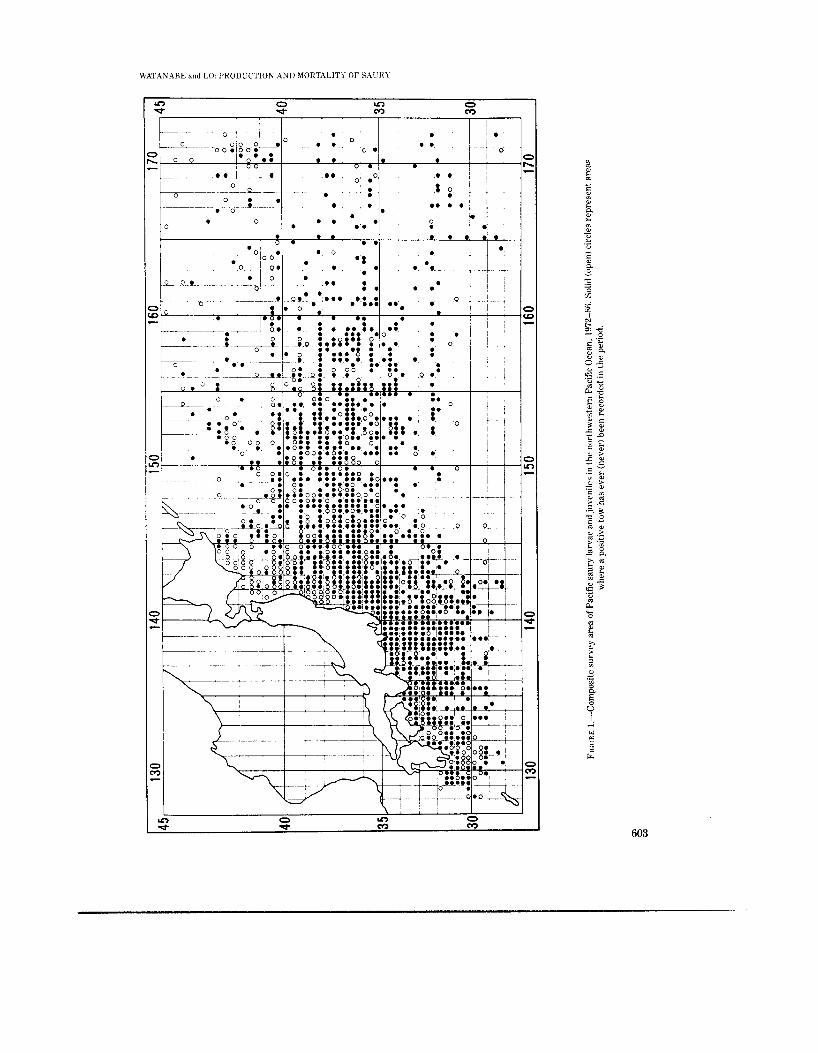
The Pacific saury spawns nearly all year round in the entire northwestern Pacific Ocean. The sampling areas and seasons were somewhat dif- ferent from year-to-year, but our data set of 15 years (1972-86) included around-the-clock sam- ples taken all year from a large area of the north- western Pacific, lat. 29-45'", long. 129-174"E (Fig. 1).
Saury larvae and juveniles were collected by a surface ring net that was towed for 5 minutes at 2 knots. The mouth diameter was 1.3 m, and therefore the surface area covered by one tow was 401.3 m2. A mesh size of the 3.0 m forward part of the net was 2.0 mm, and the 1.5 m rear
KnL = 5.90 exp((0.086510.0293)
x (1 - exp(-0.0293 t ) ) )
where KnL is the fish knob !ength in mm after capture (before preservation) and t is the age in days from hatching.
Bias Corrections An ichthyoplankton survey is essential for
most pelagic fish research (Smith and Richard- son 1977), but it is not bias free. The most com- mon biases in catch of fish eggs and larvae are extrusion of eggs and larvae through net mesh and evasion of a net frame by fish. For the Pa- cific saury, the mesh size of the anterior part of the net, 2.0 mm, might be large enough to lose larvae by extrusion. Vulnerability of the fish to a net tow varies throughout a day due to changes in evasion abilities. Availability of the fish to a tow changes as well due to diel vertical move- ment. These factors result in differences in num- bers of fish captured by net tows during the day and night. For the analysis, we defined 10 diel time periods based upon angles between the cen- ter of the sun and the celestial horizon. We used four periods in the morning-DAWN (DWN), MORNING TWILIGHT (MTW), SUNRISE (SRS), and MORNING (MRN)-and another four periods in the evening-AFTERNOON (AFT), SUNSET (SST), EVENING TWI- LIGHT (ETW), and DUSK (DSK). Time dura-
602
U'AT.4N.4RE and LO. PRODUCTION AND MORTALITY OF SAL'Rl
I \ I rc) 0 rc) 0 d d m c-7
W 1 P [r
603

FISHERY BULLETIN 1'01. X i . N O :3, 19x9
1000-
z I-
B
g500-
U w m
z
tion between the end of MRN and the beginning of AFT was named DAYTIME (DAY), and the time duration between the end of DSK and the beginning of DWN was named NIGHTTIME (NIT). We examined the data collection of 15 years (1972-86) and estimated size- and time- specific retention rates. Changes of these values are due to the fish behaviors such as net frame evasion and vertical migration. The rates were calculated by taking ratios of catchitow in each time category and that of the NIT (Table 1). Extrusion of larvae was examined as well, com- paring observed numbers of fish with predicted numbers calculated from a mortality curve (see results section for detail).
To reduce the seasonal effect of larval produc- tion and mortality, we also considered the bias on average catchitow within a year from unpro- portional sampling efforts among months. Net tows were concentrated between February and May; the percentage of juvenile fish in the total catch was low in winter and increased in spring and early summer (Fig. 2). Thus, we divided 12 months of the year into 4 seasons based upon the abundance of saury larvae and juveniles: Jan-
lai- J F
n
FIGURE ?.-Number of tows (columns) and percentage of juvenile Pacific sauries (dots) in total fish captured by months.
uary to March as the main spawning season, April to June as the late spawning season, July and August as the off spawning season, and Sep-
TABLE 1 .-Annual average of Pacific saury catchitow (cit) and size- and time-specific correction factors (CF) of size classes in 10 time cateaories.
Size class (mm): 7.5 12.5 17.5 22.5 27.5 32.5 37.5 42.5 47.5 52.5 57.5
Time category (# tows)
SRS c/t 1.115 1.495 0.330 0.065 0.260 0.021 0.011 0.005 0.026 0.021 0.058 (92) CF 0.864 0.724 0.220 0.072 0.475 0.064 0.050 0.029 0.215 0.158 0.450 MRN cit 1.588 2.281 0.521 0.352 0.154 0.043 0.039 0.028 0.019 0.003 0.000
DAY c/t 1.400 1.134 0.509 0.209 0.098 0.042 0.034 0.008 0.002 0.002 0.016 (165) CF 1.231 1.104 0.348 0.390 0.282 0.131 0.176 0.165 0.157 0.023 -
(1,517) CF 1.085 0.549 0.343 0.232 0.179 0.128 0.154 0.047 0.017 0.015 0.124 AFT Cit 2.090 2.004 1.022 0.403 0.176 0.039 0.018 0 0 0 0.003 (199) CF 1.620 0.970 0.682 0.447 0.322 0.119 0.081 - - - 0.023 SST C/t 1.486 1.175 0.937 0.501 0.524 0.189 0.006 0 0 0 0 (97) CF 1.152 0.569 0.626 0.555 0.958 0.578 0.027 - - - - ETW C/t 0.422 0.782 0.393 0.218 0.133 0.079 0.070 0.031 0.017 0.014 0.007 (132) CF 0.327 0.379 0.262 0.242 0.243 0.242 0.317 0.182 0.140 0.105 0.054 DSK c/t 1.425 1.700 1.354 0.867 0.641 0.268 0.340 0.428 0.192 0.121 0.084 (218) CF 1.105 0.823 0.904 0.961 1.172 0.820 1.538 2.518 1.582 0.910 0.651 NIT c/t 1.290 2.066 1.498 0.902 0.547 0.327 0.221 0.170 0.121 0.133 0.129 (1,805) CF 1.000 1.000 1.000 1.000 1.000 1.000 1.000 1.000 1.000 1.000 1.000 DWN cit 0.803 1.465 1.285 0.750 0.499 0.313 0.205 0.152 0.082 0.088 0.053 (203) CF 0.622 0.709 0.858 0.831 0.912 0.957 0.928 0.894 0.678 0.662 0.411 MTW cit 0.568 0.610 0.434 0.250 0.158 0.053 0.026 0.046 0.020 0.092 0.020 (80) CF 0.440 0.295 0.290 0.277 0.289 0.162 0.118 0.271 0.165 0.692 0.155
'SRS = SUNRISE; MRN = MORNING; DAY = DAYTIME; AFT = AFTERNOON; SST = SUNSET, ETW = EVENING TWILIGHT; DSK = DUSK; NIT = NIGHTTIME; DWN = DAWN; MTW = MORNING TWILIGHT
604
WATANABE and LO. PRODUCTION A N D MORTALITY OF SAURY
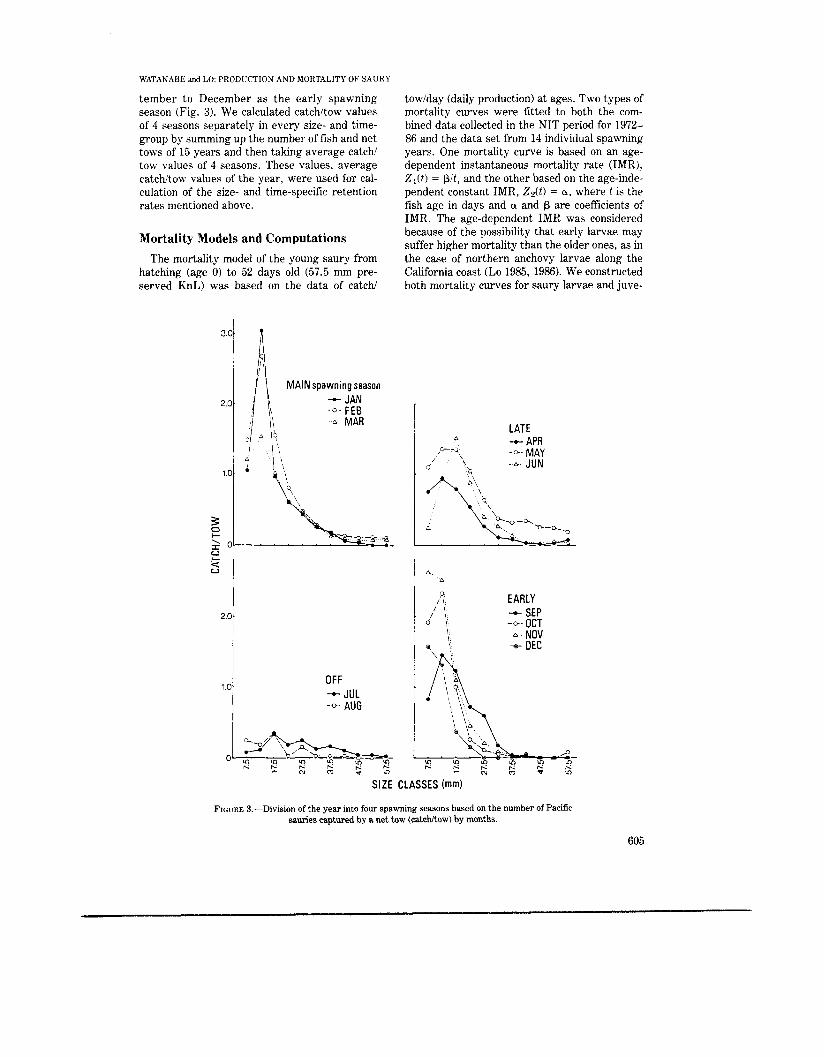
tember to December as the early spawning season (Fig. 3). We calculated catchitow values of 4 seasons separately in every size- and time- group by summing up the number of fish and net tows of 15 years and then taking average catchi tow values of 4 seasons. These values, average catchitow values of the year, were used for cal- culation of the size- and time-specific retention rates mentioned above.
Mortality Models and Computations The mortality model of the young saury from
hatching (age 0) to 52 days old (57.5 mm pre- served KnL) was based on the data of catchi
3.
2.
1.
3 0 I- -. X u k 0
2
M A I N spawning season - JAN -0- FEE
A MAR
k I ‘1,
1.01 O F F - JUL -0. AUG
towiday (daily production) a t ages. TWO types of mortality curves were fitted to both the com- bined data collected in the NIT period for 1972- 86 and the data set from 14 individual spawning years. One mortality curve is based on an age- dependent instantaneous mortality rate (IMR), Z,(t ) = P/t , and the other based on the age-inde- pendent constant IMR, Z,(t) = a, where t is the fish age in days and Q and P are coefficients of IMR. The age-dependent IMR was considered because of the possibility that early larvae may suffer higher mortality than the older ones, as in the case of northern anchovy larvae along the California coast (Lo 1985, 1986). We constructed both mortality curves for saury larvae and juve-
LATE -+ APA -0 MAY
0
,- -2
s / ‘, - & JUN
EARLY - SEP -0- OCT --o.. NOV -s- OEC
SIZE CLASSES (mm)
FIGURE 3.-Division of the year into four spawning seasons based on the number of Pacific sauries captured by a net tow (catchkow) by months.
605
FISHERY BULLETIN VOL 87. NO 3, 1989
The catch/tow value of each size class was further divided by the duration of the corre- sponding size class. This provided the production rate (catchitowiday), which was used for the computation of larval production at hatching and mortality. The parameters, larval production at hatching (P,,) and daily IMR, are estimated by using a nonlinear program (Par (Dixon et al. 1985)).
niles. The mortality curves based on Z,(f) fitted the larval and juvenile data better than Z,( t ) , and therefore, we chose Z,(f) to describe the fate of young sauries. The mortality curve with a constant IMR takes the form of the exponential mortality curve,
P , = Po exp(-at)
where Pt is the daily fish production at age t , t is the age in days from hatching, Po is the daily larval production at hatching, and CL is the daily IMR.
For the computation of larval production and mortality rate averages of 15 years, we used the data of the NIT category. For the computations of individual years, however, the number of NIT samples were not sufficient; therefore, we had to use the data from all the time periods. The data sets of individual years were classified into 10 time periods of 11 size classes and were cor- rected by dividing numbers of fish by their spe- cific retention rates (Table 1). The corrected numbers of fish were summed up in each size class and divided by the total number of tows of the year to calculate catch/tow values as the abundance index of each size class.
We used the catch data of the early, main, late, and off spawning seasons (from September to August of the following year) as a unit of a spawning year instead of the calendar year. Ac- cording to the recent growth model by Watanabe et al. (19881, the saury becomes adult within a year, so, we supposed that the larvae produced in a spawning year constitute the major part of the year class of the current year.
RESULTS
The Overall Mortality Curve for 1972-86
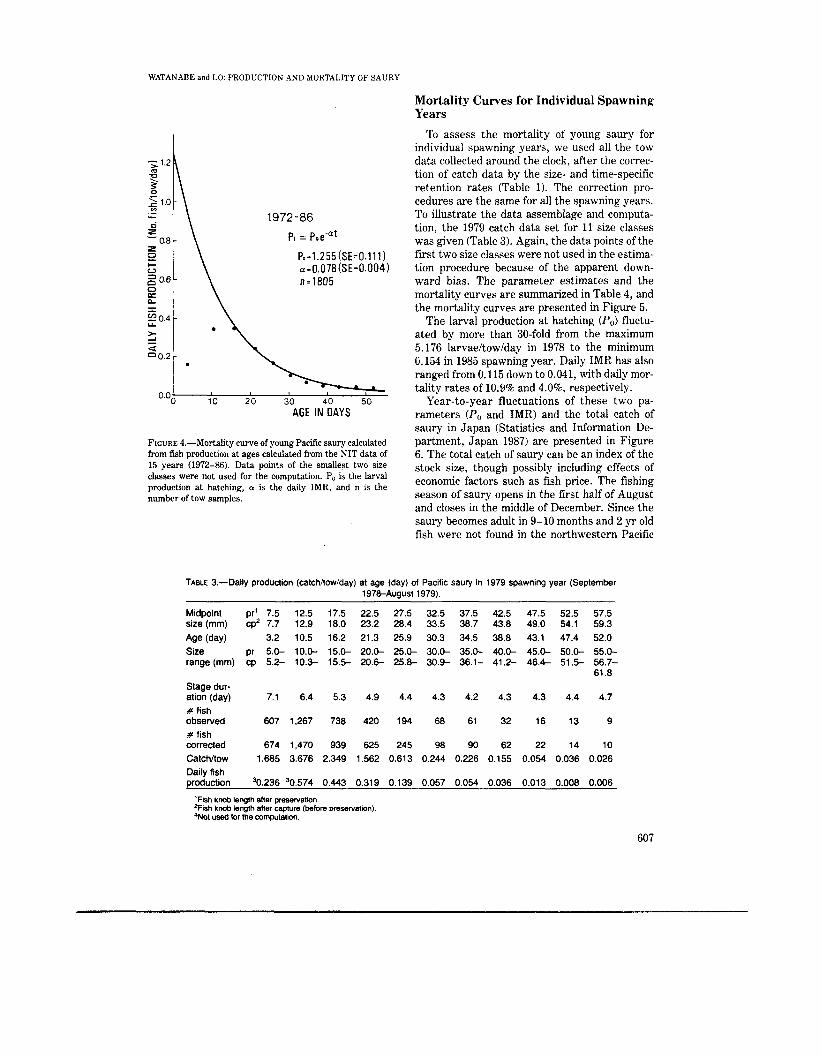
To understand the fate of young sauries from 1972 to 1986, the average catchitowiday from the NIT samples (Table 2) was used to estimate the larval production at hatching and the IMR. All the fish were first grouped into 11 size classes, ranging from 7.5 mm (5.0-9.9 mm) t o 67.5 mm (55.0-59.9 mm), and the midpoint of each size classes was converted to age. The data from the first two size classes (7.5 mm and 12.5 mm) were excluded from the analysis because the catchi towiday in these two size classes was lower than the next older larvae. The downward bias could be due to extrusion of the larvae through the mesh. The estimates of the larval production at hatching (P,,) and daily IMR were 1.255 larvae/ towiday (SE = 0.111) and 0.078 (SE = 0.0041, respectively (Fig. 4). The total daily mortality rate ( (P,+l - Pt)/P,+l = 1 - (exp(-a))) was 7.54 from the newly hatched larvae to the 52 d old juvenile.
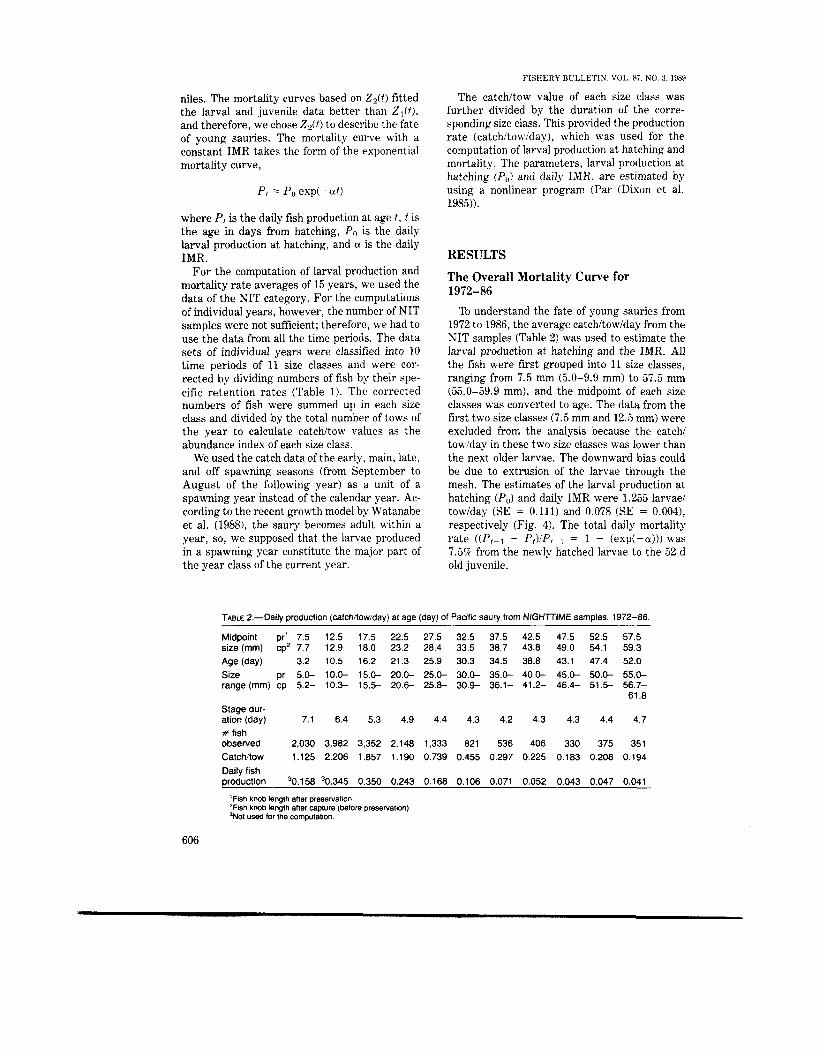
TABLE 2.-Daily production (calch/tow/day) at age (day) of Pacific saury from N I G H n I M E samples, 1972-86.
Midpoint pr’ 7.5 12.5 17.5 22.5 27.5 32.5 37.5 42.5 47.5 52.5 57.5 size (rnm) cp2 7.7 12.9 18.0 23.2 28.4 33.5 38.7 43.8 49.0 54.1 59.3 Age (day) 3.2 10.5 16.2 21.3 25.9 30.3 34.5 38.8 43.1 47.4 52.0 Size pr 5.0- 10.0- 15.0- 20.0- 25.0- 30.0- 35.0- 40.0- 45.0- 50.0- 55.0- range (rnrn) cp 5.2- 10.3- 15.5- 2 0 . 6 25.8- 30.9- 36.1- 41.2- 46.4- 51.5- 56.7-
61.8 Stage dur- ation (day) 7.1 6.4 5.3 4.9 4.4 4.3 4.2 4.3 4.3 4.4 4.7 # fish observed 2,030 3,982 3,352 2,148 1,333 821 536 406 330 375 351 Catchltow 1.125 2.206 1.857 1.190 0.739 0.455 0.297 0.225 0.183 0.208 0.194 Daily fish production 30.158 30.345 0.350 0.243 0.168 0.106 0.071 0.052 0.043 0.047 0.041
‘Fisn Knob length alter preservatton 2Fish mob length alter capture (before preservation) 3 N ~ I used tor the computation
606
WATANABE and LO: PRODUCTION AND MORTALITY OF SAURY
z 2 I- o 2 0.6 - 0 L I
U 2 0.4 -
2 a =0.2 - .
. 10 20 30 40 50 o.oo
AGE IN DAYS
FIGURE 4.-Mortality curve of young Pacific saury calculated from fish production at ages calculated from the NIT data of 15 years (1972-86). Data points of the smallest two size classes were not used for the computation. Po is the larval production at hatching, a is the daily IMR, and n is the number of tow samples.
Mortality Curves for Individual Spawning Years
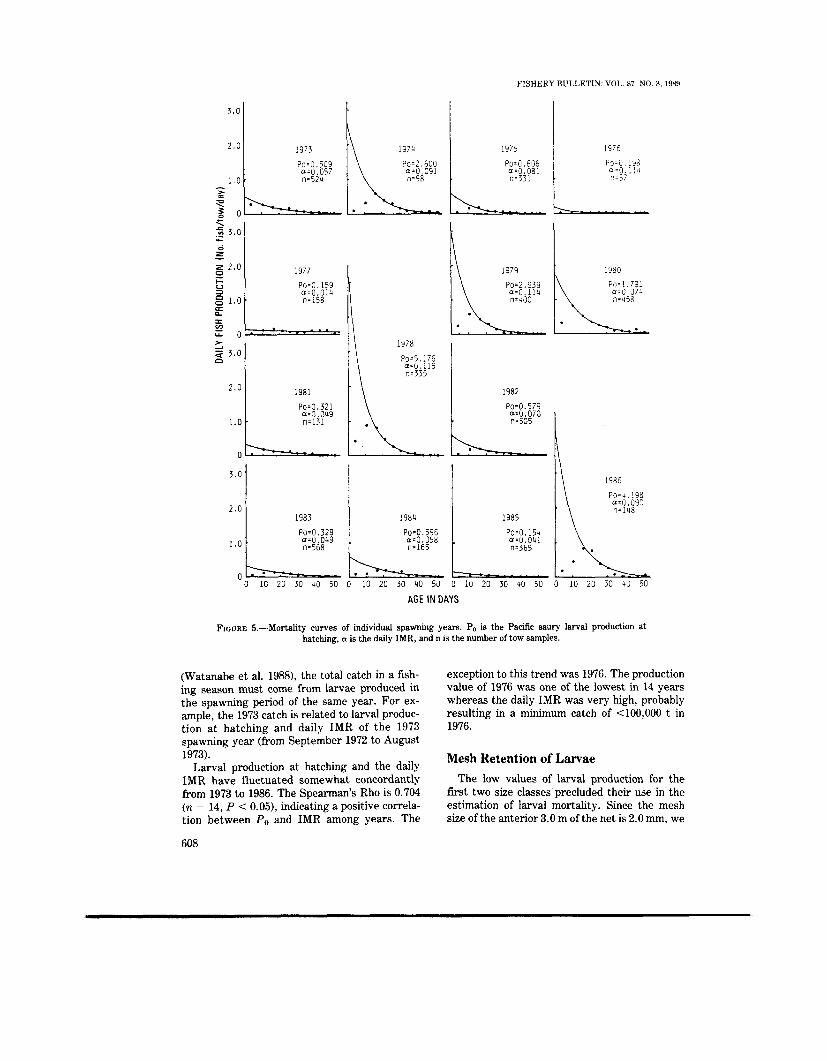
TO assess the mortality of young saury for individual spawning years, we used all the tow data collected around the clock, after the correc- tion of catch data by the size- and time-specific retention rates (Table 1). The correction pro- cedures are the same for all the spawning years. To illustrate the data assemblage and computa- tion, the 1979 catch data set for 11 size classes was given (Table 3). Again, the data points of the first two size classes were not used in the estima- tion procedure because of the apparent down- ward bias. The parameter estimates and the mortality curves are summarized in Table 4, and the mortality curves are presented in Figure 5.
The larval production at hatching (Po) fluctu- ated by more than 30-fold from the maximum 5.176 larvae/tow/day in 1978 to the minimum 0.154 in 1985 spawning year. Daily IMR has also ranged from 0.115 down to 0.041, with daily mor- tality rates of 10.9% and 4.0’7~~ respectively.
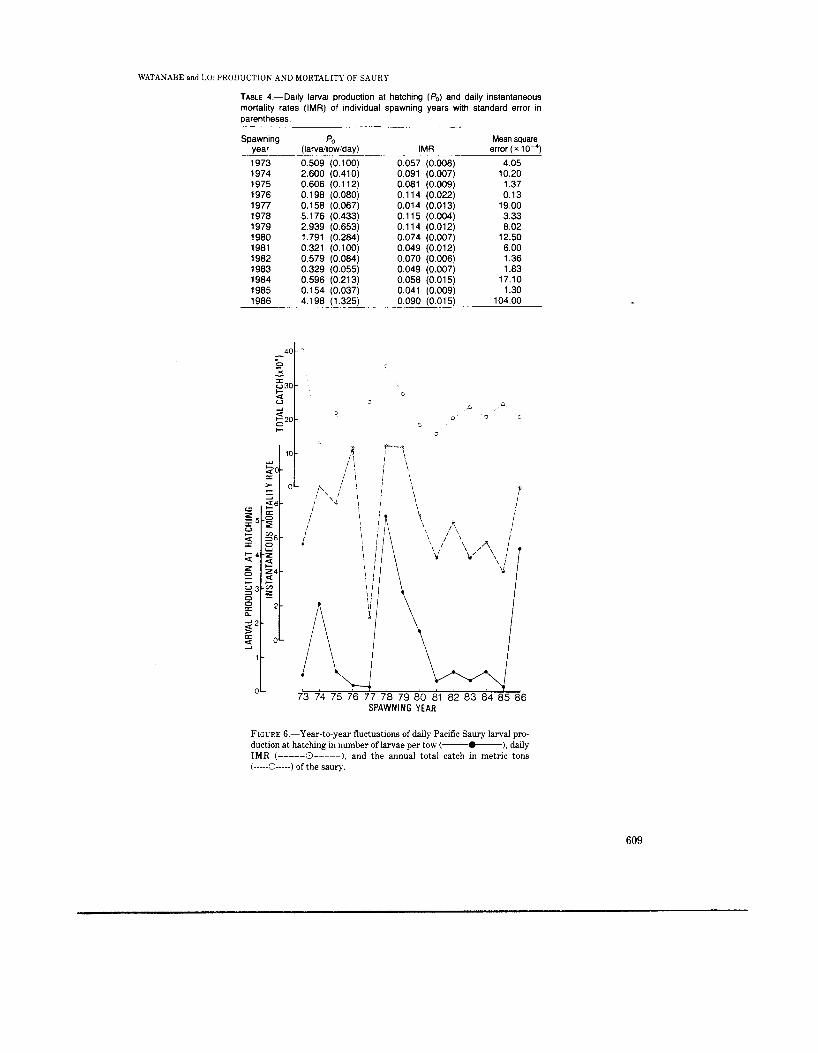
Year-to-year fluctuations of these two pa- rameters (Po and IMR) and the total catch of saury in Japan (Statistics and Information De- partment, Japan 1987) are presented in Figure 6. The total catch of saury can be an index of the stock size, though possibly including effects of economic factors such as fish price. The fishing season of saury opens in the first half of August and closes in the middle of December. Since the saury becomes adult in 9-10 months and 2 yr old fish were not found in the northwestern Pacific
TABLE 3.-Daily production (catch/tow/day) at age (day) of Pacific saury in 1979 spawning year (September 197@-Augusfl979).
Midpoint pr’ 7.5 12.5 17.5 22.5 27.5 32.5 37.5 42.5 47.5 52.5 57.5 size (mm) cp2 7.7 12.9 18.0 23.2 28.4 33.5 38.7 43.8 49.0 54.1 59.3 Age (day) 3.2 10.5 16.2 21.3 25.9 30.3 34.5 38.8 43.1 47.4 52.0 Size pr 5.0- 10.0- 15.0- 20.0- 25.0- 30.0- 35.0- 40.0- 45.0- 50.0- 55.0- range (mm) cp 5.2- 10.2- 15.5- 20.6- 25.8- 30.9- 36.1- 41.2- 46.4- 51.5- 56.7-
61.8 Stage dur- ation (day) 7.1 6.4 5.3 4.9 4.4 4.3 4.2 4.3 4.3 4.4 4.7 # fish observed 607 1,267 738 420 194 68 61 32 16 13 9 # fish corrected 674 1,470 939 625 245 98 90 62 22 14 10 Catch/tow 1.685 3.676 2.349 1.562 0.613 0.244 0.226 0.155 0.054 0.036 0.026 Daily fish production 30.236 30.574 0.443 0.319 0.139 0.057 0.054 0.036 0.013 0.008 0.006
’Fish knob length alter preselvation ‘Fish knob length alter capture (before preservatm) 3 ~ ~ t used for the cornputahon.
607
FISHERY BULLETIN: VOL. 87. NO. 3. 1989
2 . 0
Po=0.509 Po=2,500 a=O, 057 a.0.091
1.0
PO.!, 791
3.0
2 . 0
1 . 0
1983
Po=0.329 a=0.049 n.568
1984
Po=0.596 a=0.058 11~165
1985
Po=0.154 a=0.041 n.365
1986 Po=4 .1%
n.148 a.0.090
-- - 0 ' -- 0 10 20 30 40 50 0 10 20 30 40 53 0 10 20 30 40 50 0 10 20 30 411 50
AGE IN DAYS
FIGURE 5.-Mortality curves of individual spawning years. Po is the Pacific saury larval production at hatching, a is the daily IMR, and n is the number of tow samples.
(Watanabe et al. 1988), the total catch in a fish- ing season must come from larvae produced in the spawning period of the same year. For ex- ample, the 1973 catch is related to larval produc- tion at hatching and daily IMR of the 1973 spawning year (from September 1972 to August 1973).
Larval production at hatching and the daily IMR have fluctuated somewhat concordantly from 1973 to 1986. The Spearman's Rho is 0.704 (n = 14, P < 0.05), indicating a positive correla- tion between Po and IMR among years. The
608
exception to this trend was 1976. The production value of 1976 was one of the lowest in 14 years whereas the daily IMR was very high, probably resulting in a minimum catch of <100,000 t in 1976.
Mesh Retention of Larvae The low values of larval production for the
first two size classes precluded their use in the estimation of larval mortality. Since the mesh size of the anterior 3.0 m of the net is 2.0 mm, we
WATANABE and LO: PRODUCTION A N D MORTALITY OF SAURY
TABLE 4.-Daily larval production at hatching (Po) and daily instantaneous mortality rates (IMP.) of individual spawning years with standard error in parentheses.
Spawning PO Mean square year (larvaltowiday) IMR error ( x 1 0-4)
1973 0.509 (0,100) 0.057 (0.008) 4.05 1974 2.600 (0.410) 0.091 (0.007) 10.20 1975 1976 1977 1978 1979 1980 1981 1982 1983
0.606 (0.1 12)
0.158 (0.067) 5.176 (0.433) 2.939 (0.653) 1.791 (0.284) 0.321 (0.100) 0.579 (0.084) 0.329 10.055)
0.198 (0.080) 0.081 (0.009) 0.1 14 (0.022) 0.014 (0.013) 0.1 15 (0.004) 0.114 (0.012) 0.074 (0.007) 0.049 (0,012) 0.070 (0.006) 0.049 (0.007)
1.37 0.13
19.00 3.33 8.02
12.50 6.00 1.36 1.83
1984 0.596 i0.213j 0.058 io.oi5j 17.10 1985 0.154 (0.037) 0.041 (0,009) 1.30 1986 4.198 (1.325) 0.090 (0.015) 104.00
0 3
3
3
3
0
SPAWNING YEAR
FIGURE 6.-Year-to-year fluctuations of daily Pacific Saury larval pro- duction at hatching in number of larvae per tow (-), daily IMR (-----El-----), and the annual total catch in metric tons (-----O-----) of the saury.
609
FISHERY BULLETIK VOL 8 i . NO 3. 1989
from 26-30 mm t o 46-50 mm. We used the growth model by Watanabe et a]. (1988), which shows that sauries grow from 27.5 mm to 47.5 mm in 17.2 days (1.16 mmid). This was 1.7 times faster than growth rate of Sablin. We recalcu- lated monthly mortality rates using the Sablin IMRs and the Watanabe et al. growth rate of 1.16 mmid producing estimates close to ours, 73.4-94.1% with an average of 86.5%.
The absolute value of total annual production of newly hatched larvae of the Pacific saury can be calculated from oilr results using the assump- tions that 1) all fish in a vertical water column are in the upper one meter, and 2) those in a volume of water strained are captured by the net during the NIT period. The values of larval pro- duction at age 0 are on daily basis over the area covered by a net tow. Thus, the annual total production of the hatched larvae can be com- puted as below:
think that the downward bias is due to extrusion through the mesh. The mesh retention rate of larvae in the first two size classes could be esti- mated from the ratio of the observed catchitowi day and the predicted larval production com- puted from the overall average mortality curve of 15 years. The estimate of mesh retention rate for larvae of 7.5 mm (3.2 days old) is,
Observed: 0.158 (larvaeitowiday) Predicted: 0.978 (larvaeitowiday) = 1.255
exp(-0.078 X 3.2) Retention rate: 0.16 = 0.15810.978
and for larvae of 12.5 mm (10.5 days old) is,
Observed: 0.345 (larvaeltowiday) Predicted: 0.553 (larvaeitowiday) = 1.255
exp(-0.078 X 10.5) Retention rate: 0.62 = 0.34510.553.
DISCUSSION Production and mortality rates of fish larvae
and juveniles cannot be obtained without good growth models, which are indispensable in calcu- lating stage durations. A new growth model based on growth increments of otoliths has re- cently been established (Watanabe et al. 1988) enabling calculation of mortality rates. The c'x- rent results are virtually the first attempt to calculate larval production at hatching. These should provide the best index of reproductive level ever obtained.
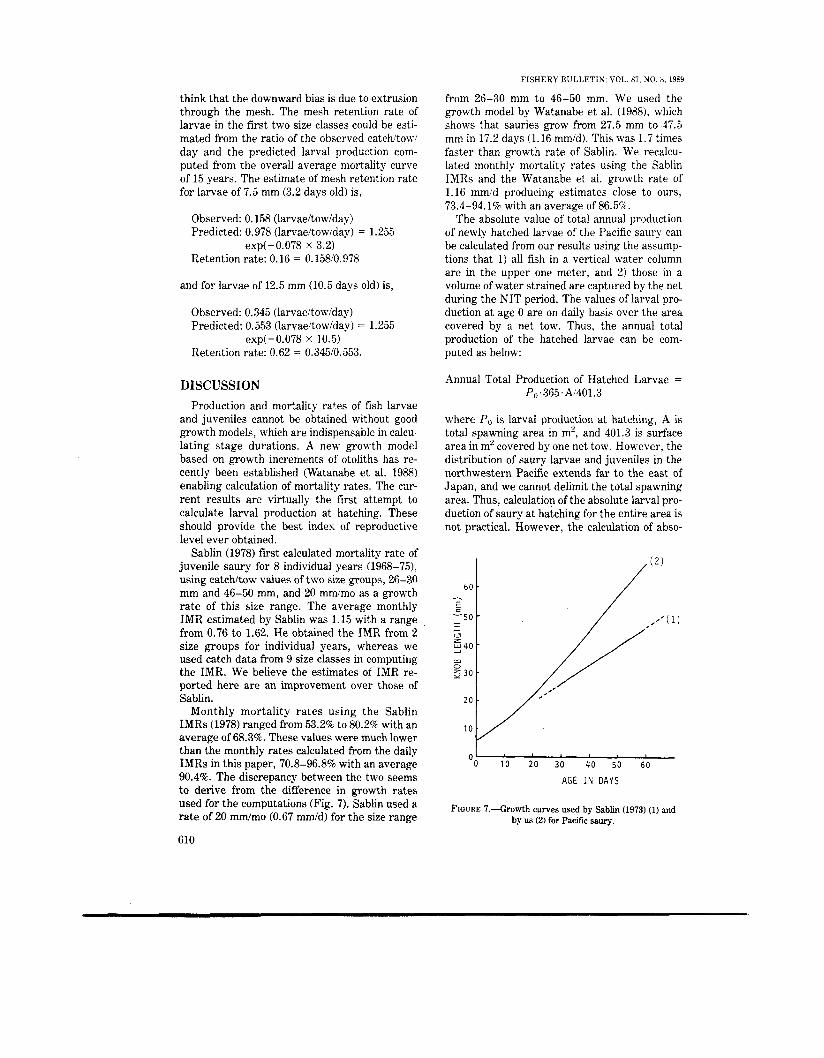
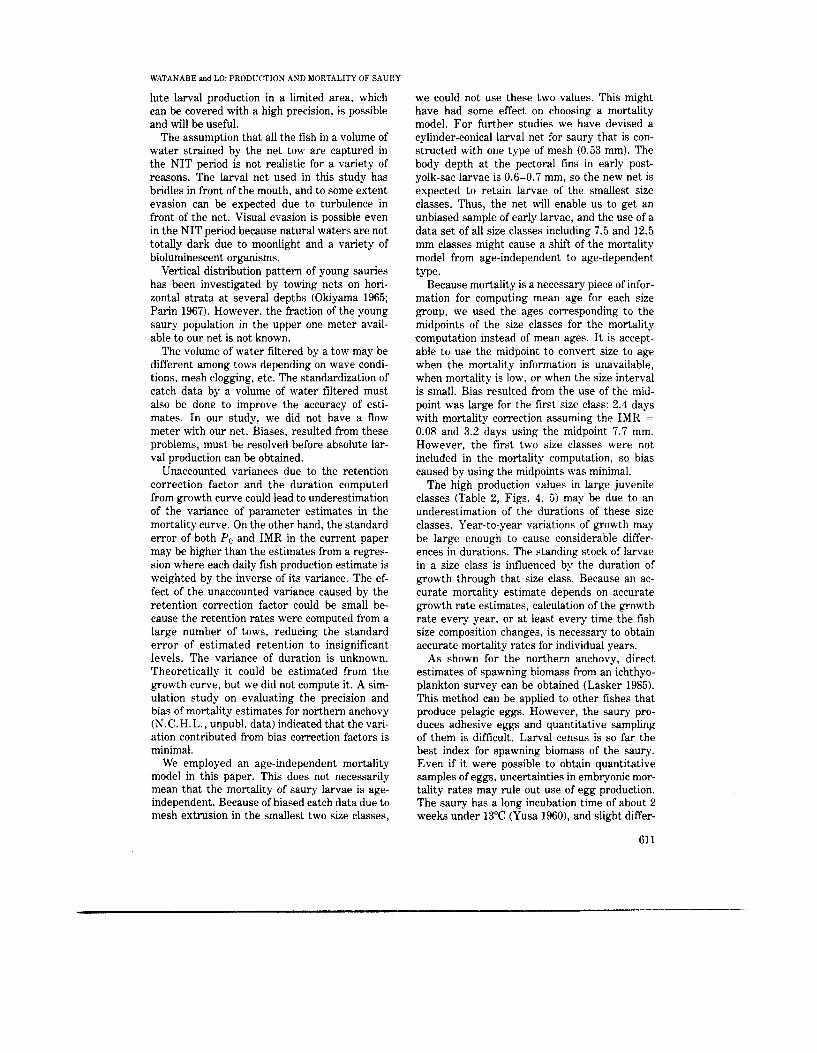
Sablin (1978) first calculated mortality rate of juvenile saury for 8 individual years (1968-75), using catchltow values of two size groups, 26-30 mm and 46-50 mm, and 20 mrdmo as a growth rate of this size range. The average monthly IMR estimated by Sablin was 1.15 with a range from 0.76 to 1.62. He obtained the IMR from 2 size groups for individual years, whereas we used catch data from 9 size classes in computing the IMR. We believe the estimates of IMR re- ported here are an improvement over those of Sablin.
Monthly mortality rates using the Sablin IMRs (1978) ranged from 53.28 to 80.2% with an average of 68.3%. These values were much lower than the monthly rates calculated from the daily IMRs in this paper, 70.8-96.8% with an average 90.4%. The discrepancy between the two seems to derive from the difference in growth rates used for the computations (Fig. 7 ) . Sablin used a rate of 20 mm/mo (0.67 mm/d) for the size range
610
Annual Total Production of Hatched Larvae = Po. 365. Ai401.3
where Po is larval production at hatching, A is total spawning area in m', and 401.3 is surface area in m2 covered by one net tow. However, the distribution of saury larvae and juveniles in the northwestern Pacific extends far to the east of Japan, and we cannot delimit the total spawning area. Thus, calculation of the absolute larval pro- duction of saury at hatching for the entire area is not practical. However, the calculation of abso-
0: 1'0 io 3b i o sb 6b AGE I N DAYS
FIGURE 7 . 4 h w t h curves used by Sablin (1973) (1) and by us (2) for Pacific saury.
WATANABE and LO: PRODUCTION AND MORTALITY OF SAURY
lute larval production in a limited area, which can be covered with a high precision, is possible and will be useful.
The assumption that all the fish in a volume of water strained by the net tow are captured in the NIT period is not realistic for a variety of reasons. The larval net used in this study has bridles in front of the mouth, and to some extent evasion can be expected due to turbulence in front of the net. Visual evasion is possible even in the NIT period because natural waters are not totally dark due to moonlight and a variety of bioluminescent organisms.
Vertical distribution pattern of young sauries has been investigated by towing nets on hori- zontal strata at several depths (Okiyama 1965; Parin 1967). However, the fraction of the young saury population in the upper one meter avail- able to our net is not known.
The volume of water filtered by a tow may be different among tows depending on wave condi- tions, mesh clogging, etc. The standardization of catch data by a volume of water filtered must also be done to improve the accuracy of esti- mates. In our study, we did not have a flow meter with our net. Biases, resulted from these problems, must be resolved before absolute lar- val production can be obtained.
Unaccounted variances due to the retention correction factor and the duration computed from growth curve could lead to underestimation of the variance of parameter estimates in the mortality curve. On the other hand, the standard error of both Po and IMR in the current paper may be higher than the estimates from a regres- sion where each daily fish production estimate is weighted by the inverse of its variance. The ef- fect of the unaccounted variance caused by the retention correction factor could be small be- cause the retention rates were computed from a large number of tows, reducing the standard error of estimated retention to insignificant levels. The variance of duration is unknown. Theoretically it could be estimated from the growth curve, but we did not compute it. A sim- ulation study on evaluating the precision and bias of mortality estimates for northern anchovy (N.C.H.L., unpubl. data) indicated that the vari- ation contributed from bias correction factors is minimal.
We employed an age-independent mortality model in this paper. This does not necessarily mean that the mortality of saury larvae is age- independent. Because of biased catch data due to mesh extrusion in the smallest two size classes,
we could not use these two values. This might have had some effect on choosing a mortality model. For further studies we have devised a cylinder-conical larval net for saury that is con- structed with one type of mesh (0.53 mm). The body depth at the pectoral fins in early post- yolk-sac larvae is 0.6-0.7 mm, so the new net is expected to retain larvae of the smallest size classes. Thus, the net will enable us to get an unbiased sample of early larvae, and the use of a data set of all size classes including 7.5 and 12.5 mm classes might cause a shift of the mortality model from age-independent to age-dependent type.
Because mortality is a necessary piece of infor- mation for computing mean age for each size group, we used the ages corresponding t o the midpoints of the size classes for the mortality computation instead of mean ages. It is accept- able to use the midpoint to convert size to age when the mortality information is unavailable, when mortality is low. or when the size interval is small. Bias resulted from the use of the mid- point was large for the first size class: 2.4 days with mortality correction assuming the IMR =
0.08 and 3.2 days using the midpoint 7.7 mm. However, the first two size classes were not included in the mortality computation, so bias caused by using the midpoints was minimal.
The high production values in large juvenile classes (Table 2, Figs. 4, 5) may be due to an underestimation of the durations of these size classes. Year-to-year variations of growth may be large enough to cause considerable differ- ences in durations. The standing stock of larvae in a size class is influenced by the duration of growth through that size class. Because an ac- curate mortality estimate depends on accurate growth rate estimates, calculation of the growth rate every year, or at least every time the fish size composition changes, is necessary to obtain accurate mortality rates for individual years.
As shown for the northern anchovy, direct estimates of spawning biomass from an ichthyo- plankton survey can be obtained (Lasker 1985). This method can be applied to other fishes that produce pelagic eggs. However, the saury pro- duces adhesive eggs and quantitative sampling of them is difficult. Larval census is so far the best index for spawning biomass of the saury. Even if it were possible to obtain quantitative samples of eggs, uncertainties in embryonic mor- tality rates may rule out use of egg production. The saury has a long incubation time of about 2 weeks under 13°C (Yusa 1960), and slight differ-
611
ences in the daily mortality rates of embryonic stages, rather than egg production, could have profound influence on larval production at hatch- ing. In other words, larval production at hatch- ing may not necessarily be accurately related to egg production without knowing mortality rates of embryonic stages. Although crude estimation of spawning biomass by conventional plankton tows might be possible (Smith et al. 1970), a radical departure from the egg sampling method using information on vertical and horizontal dis- tribution patterns of the eggs is required to de- vise an egg production method for the saury.
Lo (1985) calculated the time series of egg production at fertilization of the northern an- chovy in 1951-82. Year-to-year difference in the egg production was more than 1,000-fold, which is much larger than the difference in saury larval production at hatching in our study, about 33- fold. She also calculated mean yolk-sac larval abundance for the years that showed a difference of more than 1,000-fold. Annual fluctuation of reproductive level in the saury seemed to be smaller than the northern anchovy. This might be related to the differences in spawning ecology of these two species. The saury is reported to be a multiple spawner that spawns in 2 mo intervals in the spawning season (Hatanaka 1955) with a batch fecundity of 500-3,000 egg/female (Hata- naka 1953). The spawning frequency is 3-5 times/yr and the annual fecundity is estimated to be 1,500-15,000. In contrast, time between spawning incidence of the northern anchovy off southern California is 6-8 days and the batch fecundity is 389 eggs/g of ovary free female body weight (Hunter and Goldberg 1980). The saury is less fecund than the northern anchovy and seems to be less variable in its annual fecundity owing to a long maturation period of ovarian eggs. Small year-to-year differences in the reproduc- tive level in the saury might be the result of less variable spawning effort.
The correlation of the larval production at hatching and the daily IMR in the individual years may indicate that the mortality of young saury is density dependent. Watanabe (1987) showed an inverse correlation between the egg abundance and the overall survival rate of larval and juvenile Japanese sardine up to 1 yr old. He further examined correlations between the egg abundance and the biomass of larvae of the 40 mm size class, and between the biomasses of the 40 mm size class and of the 1 yr recruit size class. He found that egg abundance and survival rate up to 40 mm size class are inversely correlated,
612
FISHERY BULLETIK: VOL. S i . NO. 3, 1989
whereas the biomass of the 40 mm and 1 yr size class are positively correlated. His conclusion was that the mortality rate of larval sardine is density dependent up to 40 mm. Thus, in some pelagic fish, mortality rates of early life stages could be density dependent.
ACKNOWLEDGMENT We thank the late R. Lasker and P. E. Smith
of the Southwest Fisheries Center of National Marine Fisheries Service, NOAA, for reading the manuscript. Y. Watanabe would like to thank the Science and Technology Agency of Japan for funding his stay at the Southwest Fisheries Center.
LITERATURE CITED Dixon, W. J., M. B. Brown, L. Engelman, J. W. Frane, M.
1985. BMDP Statistical software. Univ. Calif. Press, A. Hill, R. I. Jennrich, and J. D. lbporek.
Berkeley. Fisheries Agency.
(summary). Tokyo, 38 p.
1985. Annual report on Japan’s fisheries, fiscal 1985 Minist. Agric., For. Fish., Gov. Jpn.,
Hatanaka, M. 1955. Biological studies on the population of the saury,
Cololabis saim (BREVOORT). Part 1 Reproduction and growth. Tohoku J. Agric. Res. 4527-269.
Hatanaka, M., T. Watanabe, K. Sekino, M. Kosaka, and K.
Studies on the reproduction of the saury, Colo- labis saira (BREVOORT), of the Pacific coast of Japan. Tohoku J. Agric. Res. 2:293-302.
Kimura. 1953.
Hunter, .I. R., and S. R. Goldberg. 1980. Spawning incidence and batch fecundity in
northern anchovy, Engmlclis mordas. Fish. Bull., U.S. 77:641-652.
Japan Saury Fishery Association. 1985. Sanma bouke-ami gyogyo kankei shiryo (Sta-
(In tistics of the saury stick-held dip net fishery). Jpn.) Jpn. Saury Fish. Assoc. 23:l-56.
Lasker. R. 1985. An egg production method for estimating spawn-
ing biomass of pelagic fish: Application to the northern anchovy, Engmulis murdax. U.S. Dep. Commer., NOAA Tech. Rep. NMFS 36, 99 p.
Lo, N. C. H. 1985. Egg production of the central stock of northern
anchovy, Engraulis mordar, 1951-82. Fish. Bull., U.S. 83137-150.
1986. Modeling life-stage-specific instantaneous mor- tality rates, an application to northern anchovy, Engraulis mordax, eggs and larvae. Fish. Bull., U.S. 84:395-408.
Matsumiya, Y., and S. Tanaka. 1978. Dynamics of the saury population in the Pacific
Ocean off northern Japan - 111. Reproductive rela- tions of large and medium sized fish. Bull. Jpn. Soc. Sci. Fish. 44:451-455.
WATANABE and LO: PRODUCTION AND MORTALITY OF SAURY
Okiyama. M. 1965. A preliminary study on the fish eggs and larvae
occurring in the Sado Strait, Japan Sea, with some remarks on the vertical distribution of some fishes. ( I n Jpn . ) Bull. Jpn. Sea Reg. Fish. Res. Lab. 15:13-37.
Parin, N. V. 1967. Diurnal variations in the larval occurrence of
some oceanic fishes near the ocean surface. Ocean- ology 7:115-121.
Sablin, V. V. 1978. Smertnost' sajry Cololabzs saim (Brevoort) na
rannikh stadiyakh zhizni (The mortality of the saury Cololabis saim (Brevoort) at early life stages). (In Russ.) Izv. TINRO 102:72-75.
Smith, P. E., E. H. Ahlstrom, and H. D. Casey. 1970. The saury as a latent resource of the California
Current. Calif. Mar. Res. Comm., CalCOFI Rep. 14:88-130.
Smith, P. E., and S. L. Richardson, 1977. Standard techniques for pelagic fish egg and
larva surveys. FA0 Fish. Tech. Pap. 175, 100 p. Statistics and Information Department, Japan.
1986. Showa 60 nen gyogyo to shokugyo seisan tokei
nenpo (Annual report of fisheries and aquaculture statistics, 1985). ( In Jpn.) Minist. Agric.. For. Fish., Agric. Stat. Assoc., Tokyo, 288 p.
Theilacker, G. H. 1980. Change in body measurements of larval northern
anchovy. Engraulis mordas, and other fishes due to handling and preservation. Fish. Bull., U.S., 78685-692.
Watanabe, T. 1987. Appearance of the dominant 1980 year-class of
Japanese sardine. (In Jpn.) Bull. Jpn. Sac. Fish. Oceanogr. 5134-38.
Watanabe, Y., J. L. Butler, and T. Mori. 1988. Growth of saury, Cololabis sazra, in the north-
Fish. Bull., eastern and northwestern Pacific Ocean. US. 86489-498.
Yusa, T. 1960. Embryonic development of the saury Cololabis
Bull. Tohoku Reg. Fish. Res. sairu (BREVOORT). Lab. 17:l-14.
Zweifel, J. R., and P. E. Smith. 1981. Estimates of abundance and mortality of larval
Rapp. P.-v. Reun. Cons. int. anchovy (1951-1975). Explor. Mer 178248-259.
613