Larval connectivity along the Oregon coast
12
Project Title: Realized and Potential larval connectivity along the Oregon Coast Hal Batchelder 1 , Bill Peterson 2 , & Jennifer Fisher 2 With Contributions from John Osborne (CEOAS Grad. Student) 1 1 CEOAS, 104 CEOAS Admin Bldg, OSU, Corvallis, OR 2 CIMRS, Hatfield Marine Science Center, Newport, OR
-
Upload
oregon-sea-grant -
Category
Technology
-
view
433 -
download
0
Transcript of Larval connectivity along the Oregon coast
Project Title: Realized and Potential larval connectivity along the Oregon
CoastHal Batchelder1, Bill Peterson2, & Jennifer Fisher2
With Contributions from John Osborne (CEOAS Grad. Student) 1
1CEOAS, 104 CEOAS Admin Bldg, OSU, Corvallis, OR
2CIMRS, Hatfield Marine Science Center, Newport, OR
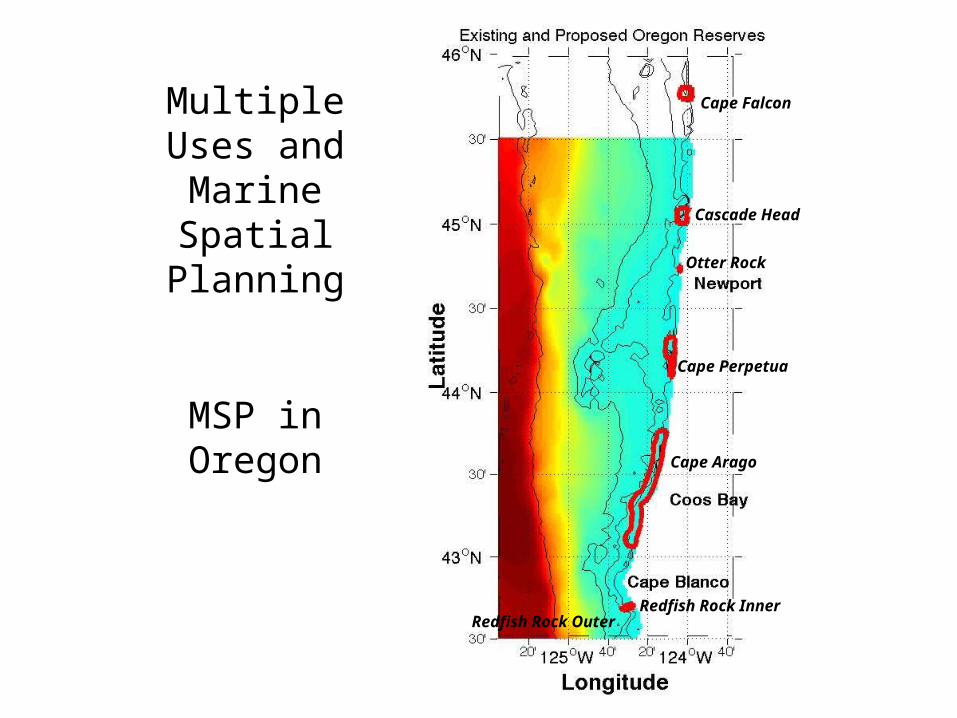
Otter Rock
Cascade Head
Cape Arago
Cape Perpetua
Redfish Rock OuterRedfish Rock Inner
Cape FalconMultiple Uses and Marine
Spatial Planning
MSP in Oregon
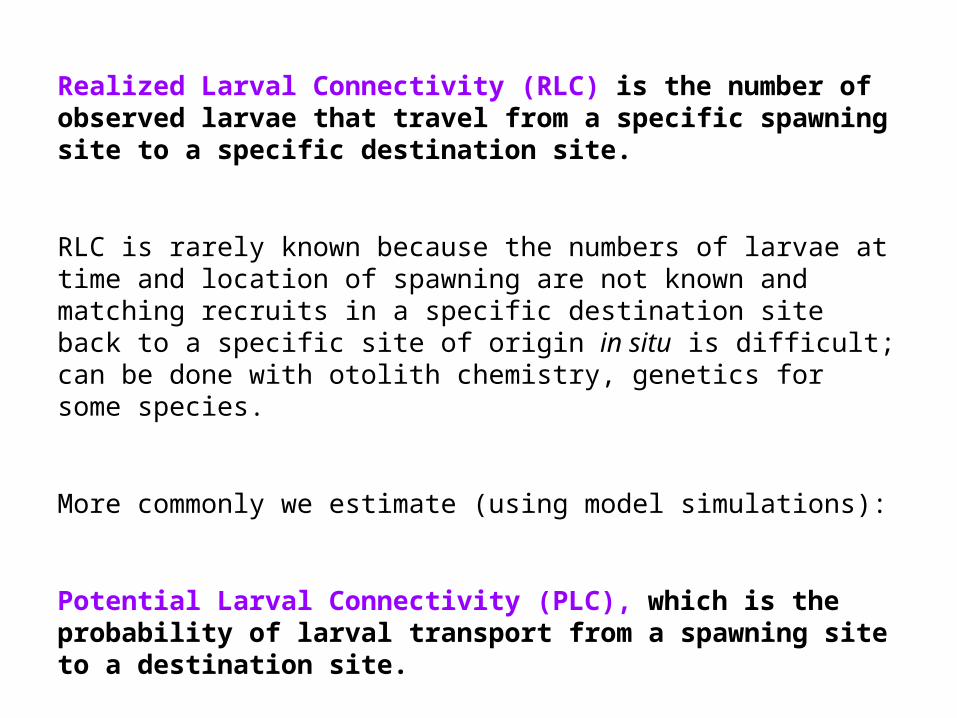
Realized Larval Connectivity (RLC) is the number of observed larvae that travel from a specific spawning site to a specific destination site.
RLC is rarely known because the numbers of larvae at time and location of spawning are not known and matching recruits in a specific destination site back to a specific site of origin in situ is difficult; can be done with otolith chemistry, genetics for some species.
More commonly we estimate (using model simulations):
Potential Larval Connectivity (PLC), which is the probability of larval transport from a spawning site to a destination site.
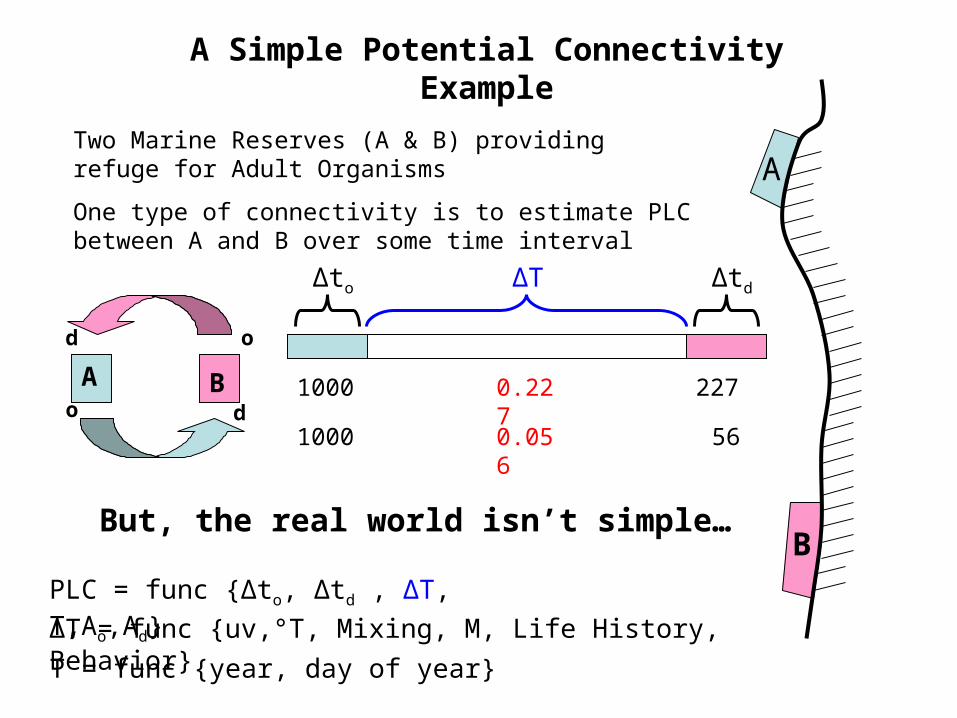
A Simple Potential Connectivity Example
Two Marine Reserves (A & B) providing refuge for Adult Organisms A
B
A B
PLC = func {Δto, Δtd , ΔT, T,Ao,Ad}
ΔT = func {uv,°T, Mixing, M, Life History, Behavior}
T = func {year, day of year}
o d
od
ΔtdΔto ΔT
But, the real world isn’t simple…
One type of connectivity is to estimate PLC between A and B over some time interval
1000
1000 56
2270.227
0.056
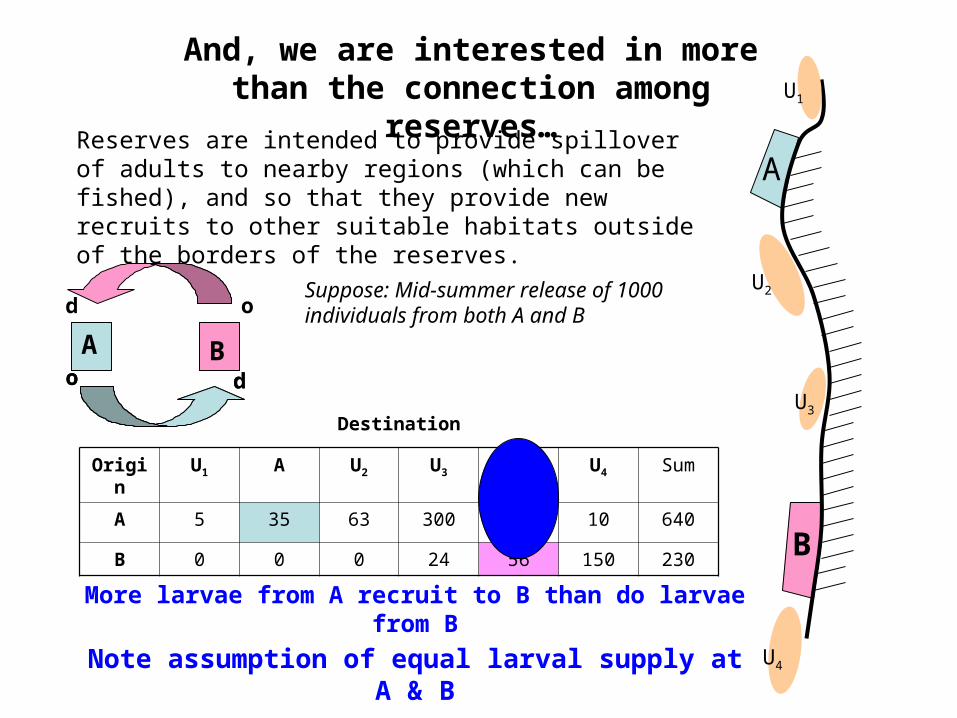
And, we are interested in more than the connection among
reserves…Reserves are intended to provide spillover of adults to nearby regions (which can be fished), and so that they provide new recruits to other suitable habitats outside of the borders of the reserves.
A
B
A Bo d
od
o dU3
U2
U4
U1
Origin
U1 A U2 U3 B U4 Sum
A 5 35 63 300 227 10 640
B 0 0 0 24 56 150 230
Destination
Suppose: Mid-summer release of 1000 individuals from both A and B
Note assumption of equal larval supply at A & B
More larvae from A recruit to B than do larvae from B
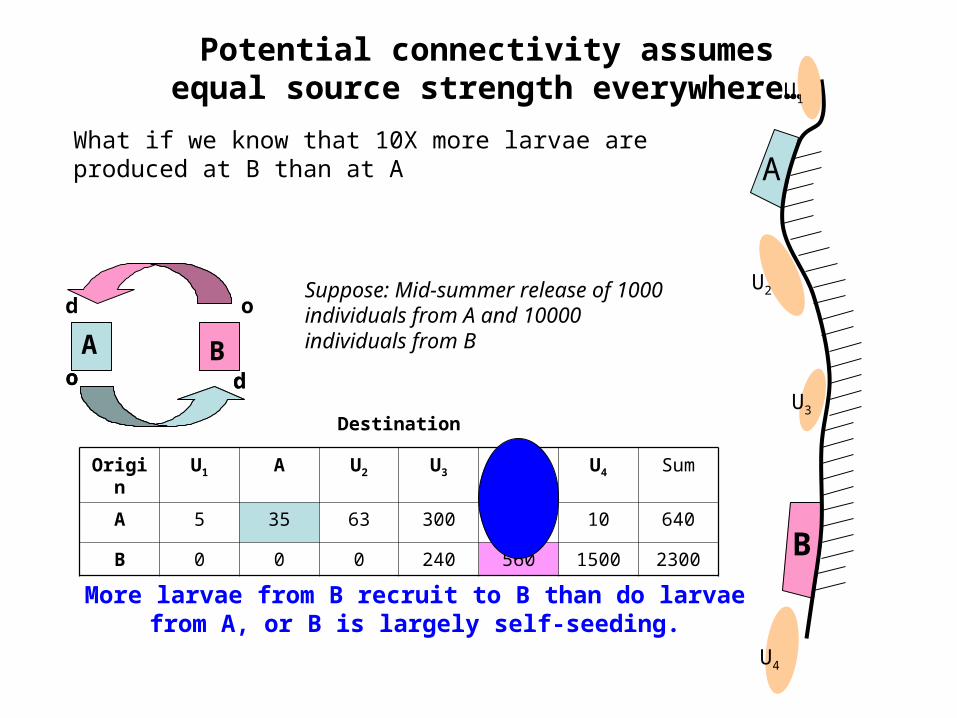
Potential connectivity assumes equal source strength everywhere…
What if we know that 10X more larvae are produced at B than at A A
B
A Bo d
od
o dU3
U2
U4
U1
Origin
U1 A U2 U3 B U4 Sum
A 5 35 63 300 227 10 640
B 0 0 0 240 560 1500 2300
Destination
Suppose: Mid-summer release of 1000 individuals from A and 10000 individuals from B
More larvae from B recruit to B than do larvae from A, or B is largely self-seeding.
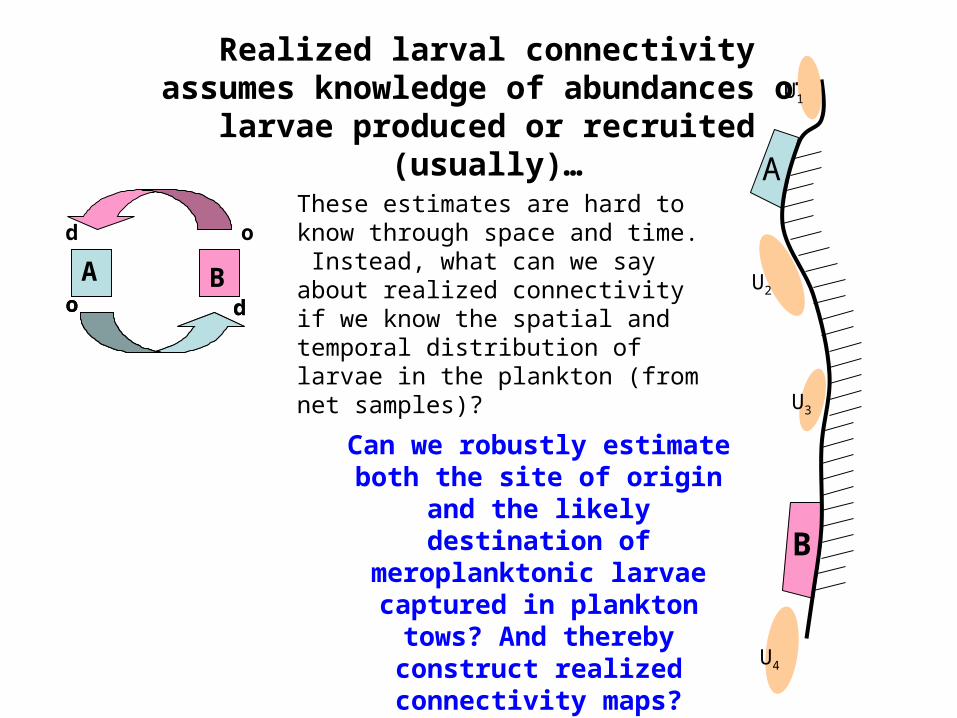
Realized larval connectivity assumes knowledge of abundances of larvae produced or recruited (usually)…
These estimates are hard to know through space and time. Instead, what can we say about realized connectivity if we know the spatial and temporal distribution of larvae in the plankton (from net samples)?
A
B
A Bo d
od
o d
U3
U2
U4
U1
Can we robustly estimate both the site of origin
and the likely destination of meroplanktonic larvae
captured in plankton tows? And thereby construct realized connectivity maps?
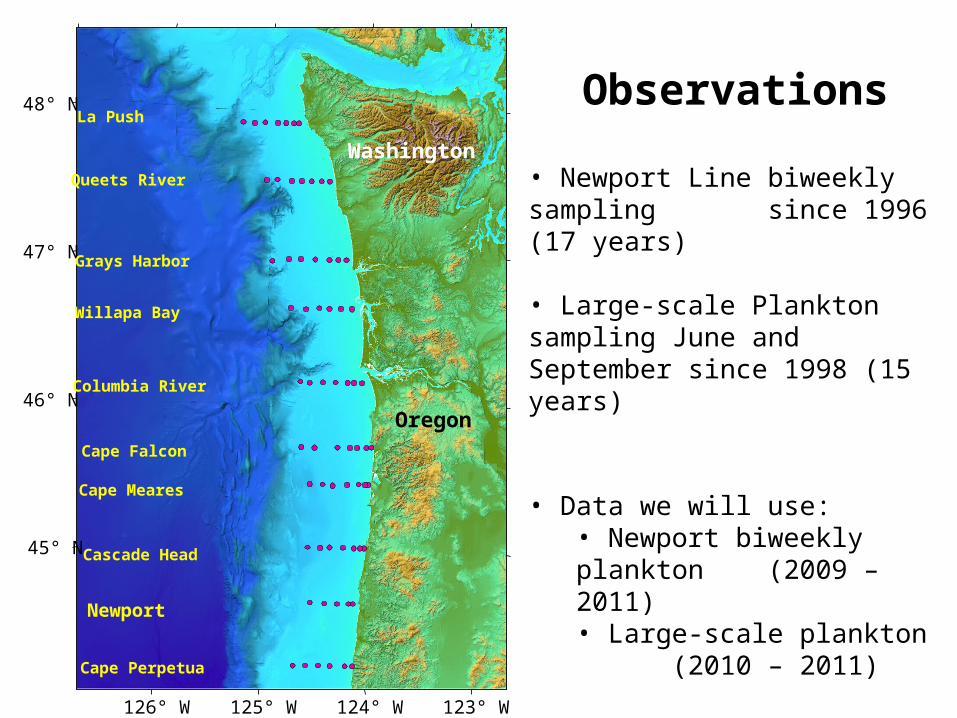
Observations
126° W 125° W 124° W 123° W
45° N
46° N
47° N
48° NLa Push
Queets River
Grays Harbor
Willapa Bay
Columbia River
Cape Meares
Cascade Head
_̂
Cape Falcon
Cape Perpetua
Newport
Washington
Oregon
• Newport Line biweekly sampling since 1996 (17 years)
• Large-scale Plankton sampling June and September since 1998 (15 years)
• Data we will use:• Newport biweekly plankton (2009 – 2011)• Large-scale plankton
(2010 – 2011)
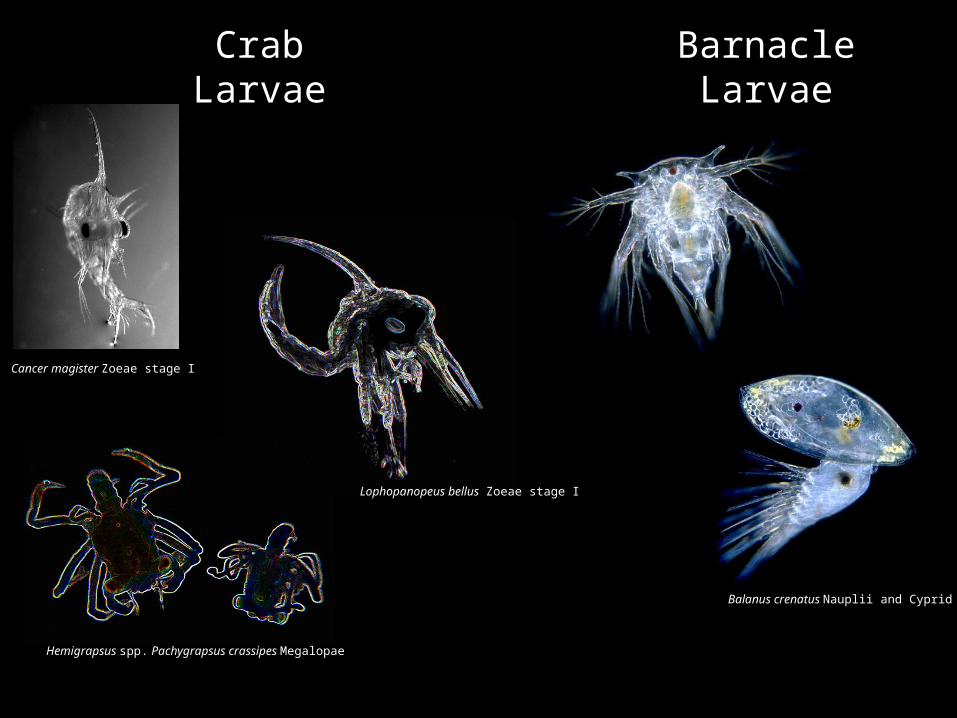
Crab Larvae Barnacle Larvae
Lophopanopeus bellus Zoeae stage I
Hemigrapsus spp. Pachygrapsus crassipes Megalopae
Cancer magister Zoeae stage I
Balanus crenatus Nauplii and Cyprid
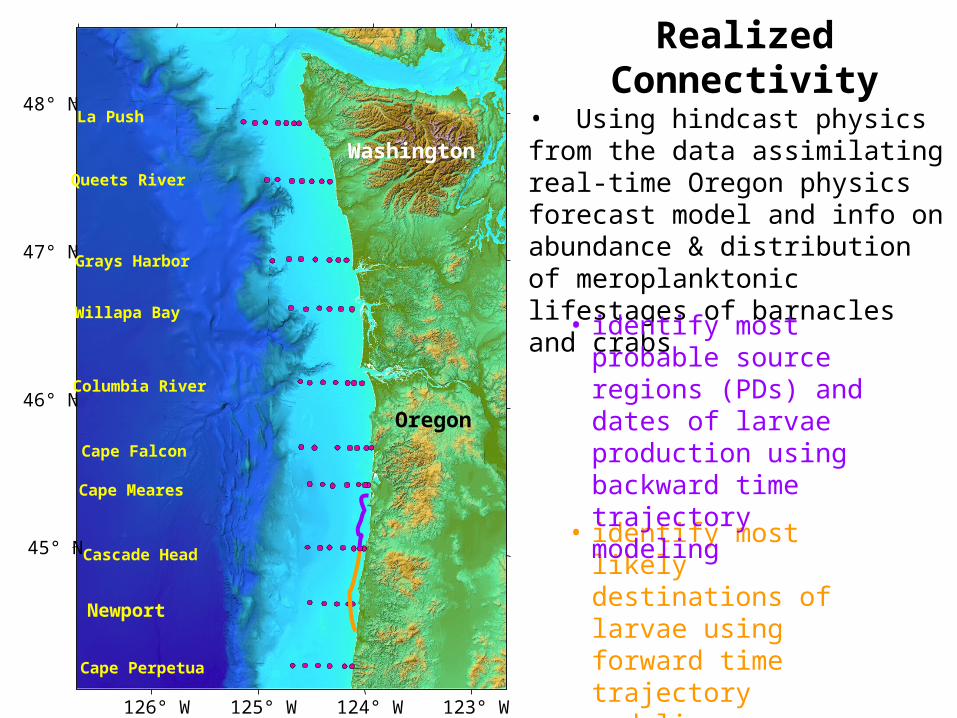
Realized Connectivity
126° W 125° W 124° W 123° W
45° N
46° N
47° N
48° NLa Push
Queets River
Grays Harbor
Willapa Bay
Columbia River
Cape Meares
Cascade Head
_̂
Cape Falcon
Cape Perpetua
Newport
Washington
Oregon
• Using hindcast physics from the data assimilating real-time Oregon physics forecast model and info on abundance & distribution of meroplanktonic lifestages of barnacles and crabs
• identify most likely destinations of larvae using forward time trajectory modeling
• identify most probable source regions (PDs) and dates of larvae production using backward time trajectory modeling
Outcomes
1) Identification of source and probable destinations of larvae using particle-tracking methods, robust physical representations of ocean circulation, and life history information (incl. depth behaviors of larvae).
2) Results will provide guidance to monitoring and assessment efforts to characterize the the efficacy of OR MR/MPA network. Identification of gaps that might inhibit successful MR/MPA networks.
3) Informal collaboration with CA SG funded PIs (Steve Morgan/Chris Edwards) on similar connectivity project will extend understanding of factors driving larval dispersal, supply and connectivity to most of the CCLME.
Outreach planDissemination of results
• Working with Jeff Feldner, we will determine the most effective avenue for communicating our results• Meetings with targeted resource managers, public
meetings, etc.
HMSC exhibit• We will consult with Bill Hanshumaker on the
development of a display about coastal connectivity and marine reserves; it will compliment the existing exhibit on larval dispersal of oysters in Yaquina Bay (Emily Lemagie and Jim Lerczak)
• Fall 2012- a static display along with hands-on ‘activities’ will be installed
• FY2013- an intern will evaluate the efficacy of our display and will outline deficiencies and ways to better overlap with the existing exhibits
• FY2013- improvements to the display will be made and an intern will assist in transitioning from a static display to a video display