
Larry Benson, Michaele Kashgarian, Robert Rye, Steve Lund, Fred Paillet, Joseph Smoot, Cynthia...
35
HOLOCENE MULTIDECADAL AND MULTICENTENNIAL DROUGHTS AFFECTING NORTHERN CALIFORNIA AND NEVADA Larry Benson, Michaele Kashgarian, Robert Rye, Steve Lund, Fred Paillet, Joseph Smoot, Cynthia Kester, Scott Mensing, Dave Meko, Susan Lindström Presentation by: Kelly Hughes Assistance from: Matt Poole 13NOV2012
-
Upload
myra-norris -
Category
Documents
-
view
224 -
download
0
Transcript of Larry Benson, Michaele Kashgarian, Robert Rye, Steve Lund, Fred Paillet, Joseph Smoot, Cynthia...

HOLOCENE MULTIDECADAL AND MULTICENTENNIAL DROUGHTS
AFFECTING NORTHERN CALIFORNIA AND NEVADALarry Benson, Michaele Kashgarian, Robert Rye, Steve Lund, Fred Paillet, Joseph Smoot,
Cynthia Kester, Scott Mensing, Dave Meko, Susan Lindström
Presentation by: Kelly HughesAssistance from: Matt Poole13NOV2012

HOLOCENE: TRIPARTITE STRUCTURE
11,600 ka 8,000 ka 3,000 ka present
100 yr
His
tori
cal Pe
riod

DROUGHT
Middle Holocene ~ Times when Lake Tahoe didn’t overflow
Late Holocene ~ Times of persistent lake size decline
Historical Period ~ Water shortage affected humans adversely

STUDY AREAS OF THE GREAT BASIN

HYDROLOGIC BALANCE OF THE LAST 100 YRS
Fig. 1. Annual discharge of the Truckee River at Farad, California, and monthly elevation of Lake Tahoe at Tahoe City, California, since 1900. Only minor consumptive losses of Truckee River water occur upstream of the Farad gage (Fig. 5). Solid areas in top panel indicate times that Lake Tahoe did not overflow to the Truckee River. Solid areas in lower panel indicate times when flow of the Truckee was less than the historical mean-annual rate of 0.70 km3 yr-1. Note that most minima in lake level correspond to minima in discharge rates.
Dust Bowl of ‘30s
7 yrs of drought from late ‘80s to early ‘90s
TREE STUMPS
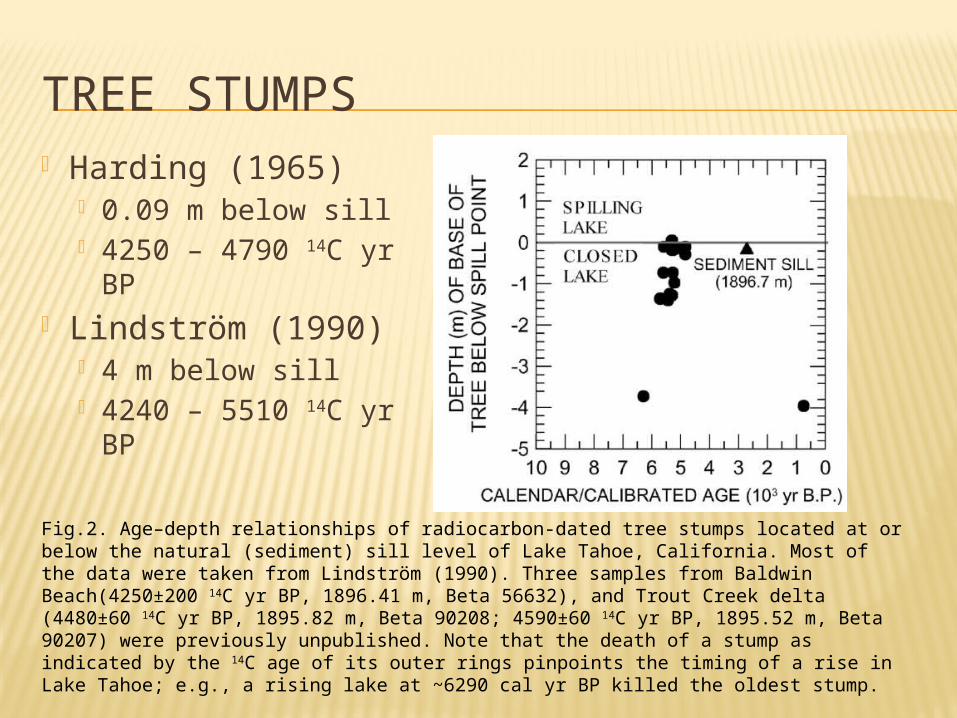
Fig.2. Age–depth relationships of radiocarbon-dated tree stumps located at or below the natural (sediment) sill level of Lake Tahoe, California. Most of the data were taken from Lindström (1990). Three samples from Baldwin Beach(4250±200 14C yr BP, 1896.41 m, Beta 56632), and Trout Creek delta (4480±60 14C yr BP, 1895.82 m, Beta 90208; 4590±60 14C yr BP, 1895.52 m, Beta 90207) were previously unpublished. Note that the death of a stump as indicated by the 14C age of its outer rings pinpoints the timing of a rise in Lake Tahoe; e.g., a rising lake at ~6290 cal yr BP killed the oldest stump.
Harding (1965) 0.09 m below sill 4250 – 4790 14C
yr BP Lindström (1990)
4 m below sill 4240 – 5510 14C
yr BP

LINDSTRÖM (1990)
Lake Tahoe Avg depth = 1000 ft (8th deepest in the
world) 100 input streams Single output = Truckee River
Emory Kristof, © National Geographic Society

Lindström (1990)
OTHER INDICATORS OF WARM, ARID CLIMATE DURING MIDDLE HOLOCENE IN GREAT BASIN Lowered sedimentation rates in NV marshes Decreased species richness
Well-dated small mammal fauna Absent black mats in south Great Basin Sediment hiatus in Owens Lake High tree-line elevations Disappearance of pikas from low elevations Warm summer species of plants more common Scarce archaeological textiles Owens Lake TIC oscillations and desiccation

GRAYSON (1993, 2000)
Fig. 4. Histogram of dates on archaeological textiles from the western Great Basin (from data base compiled by Susan McCabe and Eugene Hattori). Multiple dates on samples from a single time horizon have been eliminated.

WARM, DRY CLIMATE SUMMARY
Climate change may not have occurred synchronously across Great Basin
Each indicator is imperfect, possessing its own response to climate variability

TRUCKEE RIVER – PYRAMID LAKE SYSTEM

TRUCKEE RIVER – PYRAMID LAKE SYSTEM
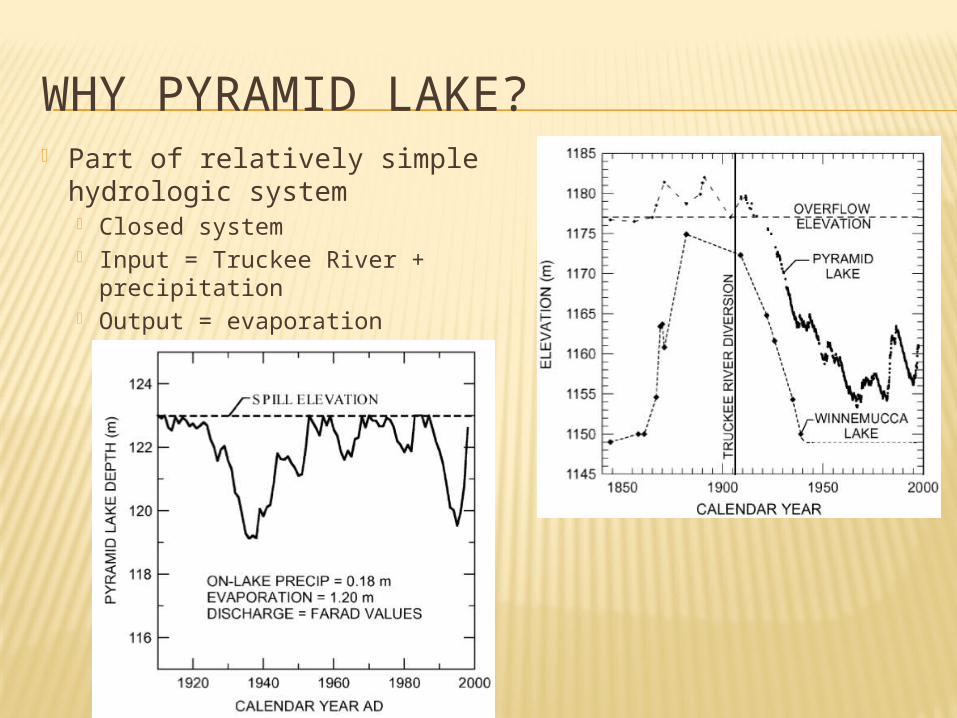
WHY PYRAMID LAKE? Part of relatively simple
hydrologic system Closed system Input = Truckee River +
precipitation Output = evaporation

WHY PYRAMID LAKE, CONTINUED Change in hydrologic
balance is transferable to rivers that drain both flanks of the northern Sierra Nevada Yuba correlates to
Truckee, etc More south, however,
correlation weakens

Nature's Window by briantravelman
WHY PYRAMID LAKE, CONTINUED
Deepest lake in Great Basin and sediments accumulate rapidly Less susceptible to
desiccation and deflation
Resolve hydrologic balance changes at sub-decadal scale

CORING OF PYRAMID LAKE
PLB98-2PLC98-4
PLC97-1
VIRGIN
IA MO
UNTAIN
S
LAKE R
AN
GE

Matt Poole
AGE CONTROL BY 137CESIUM, MERCURY, AND PALEOMAGNETIC SECULAR VARIATION

METHODS
Sampling interval: every 1 cm (0.5 cm for top of PLB98-2) Sample integration on order of 5 to 10 yr
Sample prep δ13C and δ18O – MS TIC and TC – CO2 coulometer
TOC by difference X-ray diffraction Hg – cold-vapor atomic fluorescence spectrometry 14C – contracted out to CAMS Magnetic susceptibility
Long-core: every 2 cm on day of collection NRM and magnetic susceptibilities measured on sample cubes
every 2.5 cm for PLC97-1

DELTA-18O AS A HYDROLOGIC INDICATOR
δ 18Olake =δ 18Oin − 18α H2O(l)−H2O(v)
Where δ 18 Olake = steady state δ 18 O value for lake water,
δ 18 Oin = volume-weighted δ 18 O value of discharge and on-lake precip,18α H2O(l )−H2O(v) is the fractionation factor between the lake surface and water vapor
δ 18 Oin ≈ −11000 on average, for historical Truckee River-Pyramid Lake System
18α H2O(l )−H2O(v) ≈ −13000 (Benson, 1994b)
∴ δ 18Olake ≈ 2 000 at hydrologic and isotopic steady states

DELTA-18O AS A HYDROLOGIC INDICATOR Hydrologic & isotopic steady states (SS)
are never fully achieved Wet periods: input of “light” river water
> loss of “light” evaporated water As volume of closed basin , δ18Olake
Dry periods: loss of “light” evaporated water > input of “light” river water As volume of lake , δ18Olake

DELTA-18O AS A HYDROLOGIC INDICATOR A simple constant relationship between lake volume
and δ18Olake does not exist δ18Olake for overflowing lake is proportional to Vspill/Vlake
4 processes keep δ18Olake from being an effective indicator of the absolute intensities of dry and wet periods, but it does record the duration of a climate oscillation Overflow: part of discharge flows directly to Winnemucca,
not mixing w/ epilimnion of lake Natural driftwood dams, diverting flow Sediment focusing from shallow-water to deep-water Bioturbation smoothes δ18Olake record
TIC AS A HYDROLOGIC INDICATOR
Fuzzy indicator of lake-size change Indicates transitions from closed to open systems
Useful for assessing abrupt changes to hydrologic balance
Dissolved Ca2+ precips as Aragonite (CaCO3) Ca2+ is linear function of discharge Siliciclastic material (suspended load) is exponential
function of discharge Thus, TIC fraction w/ discharge (lake volume)
But, persistent drought ( in lake size) can lead to reworking and messes up this relationship; hence its use for rapid changes only

MAGNETIC SUSCEPTIBILITY
Magnetic susceptibility of surface sediments linearly with depth in lake (fig 18)
Magnetite, denser than avg sediment, is retained in shallow water
lake size, distance between shore & deep basin Greater proportion of magnetite-rich seds
reach deep basin

Fig. 25. Magnetic susceptibility, δ13C, TIC, and δ18O records from PLB98-2 plotted against Pyramid Lake volume since 1900. Dashed lines connect nearly simultaneous excursions in the TIC and δ18O records associated with abrupt changes in the size of Pyramid Lake.

MODEL SIMULATION OF PYRAMID LAKE
Stable-isotope hydrologic-balance model Variable inputs:
Initial depth & δ18Olake
Annual TR discharges Annual precipitation on lake Annual rates of evaporation TR δ18Oin value:
δ18O of snowmelt δ18O of Lake Tahoe

MODEL SIMULATION OF PYRAMID LAKE
Fixed inputs for calculation of fractionation during evap: Monthly relative humidities Monthly air & water temps Monthly δ18O and fraction of advected air
in the boundary layer above the lake Measured wind speeds were used to set
isotopic kinetic fractionation factor

MODEL SIMULATION OF PYRAMID LAKE Lake Tahoe
Allowed to spill - discharge δ18O calculated by combining:
1 part Lake Tahoe water (δ18O = –5.5m) 2 parts snowmelt runoff (δ18O = –14.5m)
Not allowed to spill (ceased overflowing) – discharge δ18O was assigned pure snowmelt runoff value

MODEL COMPARED TO MEASURED VOLUME
Model captures all measured changes in lake volume
Using: Mean-annual
historic discharges from Nixon gage
Mean evap and precip rates

VARIABLE DISCHARGE
Simulated δ18O values as a function of variable Truckee River discharge (DTR)
discharge & overflow to Winnemucca = δ18O SS values
Smaller discharge = greater transient response amplitude
Closed system = same SS δ18O value of 2.2 permil no matter Vin
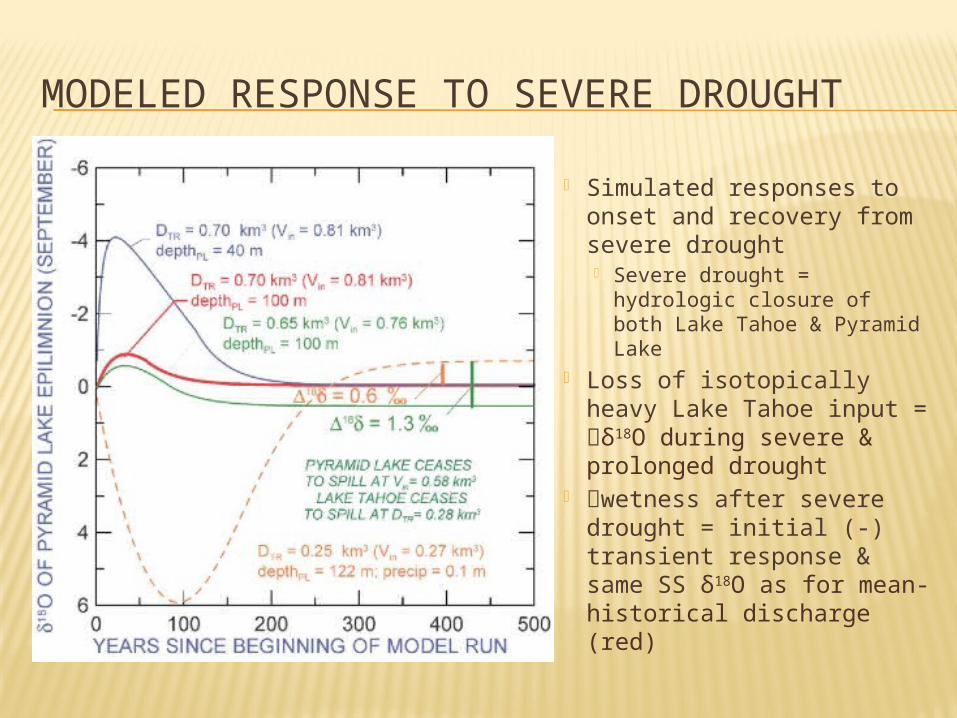
MODELED RESPONSE TO SEVERE DROUGHT
Simulated responses to onset and recovery from severe drought Severe drought =
hydrologic closure of both Lake Tahoe & Pyramid Lake
Loss of isotopically heavy Lake Tahoe input = δ18O during severe & prolonged drought
wetness after severe drought = initial (-) transient response & same SS δ18O as for mean-historical discharge (red)


REGIONAL COMPARISON OF DROUGHTS

LESSONS FROM PYRAMID LAKE mag sus + TIC reflect lake depth @ 6.7 ka
From 7.6 – 6.5 ka: highly fluctuating mag sus & δ18O = shallow lake + large/abrupt hydrologic-balance changes
Shift to more positive δ18O values reflect colder wetter climate beginning 3.1 ka
Stable-isotope hydrologic-balance model suggests Lake Tahoe didn’t overflow during much of the middle Holocene Implying that runoff to Lake Tahoe by 30%
Oscillations in δ18O exist through middle-Holocene On average every 150 yr Reflect multidecadal droughts as frequent as every 80 yrs
Human-induced diversion of Truckee River will cause Pyramid Lake to reach new SS depth of only 64 m Human-imposed drought will have greater impact on size of
Pyramid Lake than some of droughts of the past 2000 yrs
REFERENCES
Lindström, S., 1990. Submerged tree stumps as indicators of Mid-Holocene aridity in the Lake Tahoe basin. Journal of California and Great Basin Anthropology 12, 146–157.
Google Earth imagery, 2012. Benson, L. et al., 2002. Holocene
multidecadal and multicentennial droughts affecting Northern California and Nevada. Quaternary Science Reviews. 21, 659-682.


