Larimer County 2011 Indicators Report
77
United Way of Larimer County Larimer County Human Services Department 2011 Community Indicators Report Larimer County, Colorado Economic Civic Environmental Social
-
Upload
deborah-campbell -
Category
Documents
-
view
215 -
download
0
description
A report on the important issues facing Larimer County, Colorado
Transcript of Larimer County 2011 Indicators Report

United Way of Larimer County
Larimer County Human Services Department
2011
Community Indicators Report
Larimer County, Colorado
Economic Civic
Environmental Social

1
Larimer County Indicators Report
Past, Present and Future
Introduction
Welcome to the first edition of the Larimer County Indicators Report. This report is a supplement to the
COMPASS of Larimer County website, a collaborative effort beginning in 2000 between United Way of
Larimer County and Larimer County Department of Human Services.
Eight broad categories and 80 individual indicators were chosen for this report representing a cross section
of areas important to the quality of life for County residents: Demographics, Economy, Housing, Education
& Early Childhood, Health, Natural Resources, Public Safety, and Travel & Transportation.
As community leaders address the myriad issues affecting all County residents, it is our hope that this
report will be used to support informed decision making in an effort to make Larimer County the best place
to live, work, and raise a family.
We believe there is much useful information contained within this report and we encourage you to use it in
your strategic planning discussions. If you feel an important indicator has been overlooked, please contact
us. We encourage and appreciate feedback regarding what you found useful and informative. For more
information, contact the COMPASS of Larimer County project manager, Deborah Campbell. She can be
reached at 970.498.7619 or by email at [email protected].
Intr
oducti
on

2
Table of Contents
Introduction .................................................................................................................................. 1
County Profile .............................................................................................................................. 6
Demographics ............................................................................................................................. 10
Age .................................................................................................................... 11
Diversity .......................................................................................................... 12
Population and Migration .................................................................................13
Economy ....................................................................................................................................... 14
Gross Domestic Product .................................................................................... 15
Labor Force ...................................................................................................... 17
Wages .............................................................................................................. 19
Businesses ....................................................................................................... 21
Unemployment Rate ........................................................................................ 22
National Rankings ........................................................................................... 23
Assessed Valuations ......................................................................................... 24
Income Distribution ......................................................................................... 25
Childcare Costs ................................................................................................ 28
Poverty Rates ................................................................................................... 29
Public Assistance ..............................................................................................31
Free or Reduced School Lunch ......................................................................... 32
Food Bank ........................................................................................................ 33
Housing ....................................................................................................................................... 34
Affordability .................................................................................................... 35
Housing Foreclosures ...................................................................................... 37
Building Permits .............................................................................................. 38
Median Sales Price – Single Family Homes ...................................................... 39

3
Homelessness .................................................................................................. 40
Education & Early Childhood ................................................................................................. 41
CSAP Scores ..................................................................................................... 42
ACT Scores ....................................................................................................... 43
High School Graduation Rates ......................................................................... 44
Educational Attainment ................................................................................... 45
Libraries .......................................................................................................... 46
Preschool Attendance ...................................................................................... 47
Health .......................................................................................................................................... 49
Health Insurance Coverage .............................................................................. 50
Tobacco Use ...................................................................................................... 51
Sexually Transmitted Infections – Chlamydia .................................................. 52
Chronic Disease ............................................................................................... 53
Diabetes ........................................................................................................... 54
Obesity ............................................................................................................. 55
Physical Activity ............................................................................................... 56
Mental Health .................................................................................................. 57
Child Abuse ...................................................................................................... 58
Out-of-Home Placements ................................................................................. 59
Unintentional Injuries ..................................................................................... 60
Natural Resources ..................................................................................................................... 61
Water Quality................................................................................................... 62
Air Quality ....................................................................................................... 63
Managed Waste ................................................................................................ 64
Land Use/Conservation.................................................................................... 65

4
Public Safety ............................................................................................................................... 67
Crime Rate ....................................................................................................... 68
Juvenile Crime ................................................................................................. 69
Detention Center .............................................................................................. 70
Impaired Driving .............................................................................................. 71
Travel & Transportation ..........................................................................................................73
Commuting ...................................................................................................... 74
Public Transportation ...................................................................................... 75
Motor Vehicle Mortality Rates ......................................................................... 76

5

6
Larimer County is located in Northern Colorado, with Boulder County
to the south, Jackson and Grand Counties to the west, Weld County to
the east, and Wyoming to the north. It is the seventh most populous
county in the state and consists of eight incorporated communities and
several unincorporated areas.
POPULATION
Growth
In 2010, the state‟s demography office
estimated Larimer County‟s population at
302,600.
During the last decade, the population of
Larimer County has grown nearly 16%.1
Over the last two decades, the county‟s
population growth has averaged 2.4% per
year.2
Fort Collins is the largest city in Larimer
County with an estimated population of
139,587 in 2010. The city‟s population has
increased 13.5% over the last decade.3
The county‟s population is estimated to grow
to nearly 550,000 by the year 2040.4
Components of Population Change
Since the 1970s, migration has outpaced natural increase (births minus deaths) as the county‟s principal source
of growth.5
Over the last decade, net migration has averaged 3,096 per year, compared to an average natural increase of
1,532 per year.6
The state demography office estimates that net migration will continue as the principal source of growth,
averaging nearly 4,700 new residents per year, through 2040.
County Profile

7
Race/Ethnicity
In 2009, 84.8% of Larimer
County residents self-identified
as Non-Hispanic White,
compared to 10.2% Hispanic.7
Hispanic is an ethnicity, so they
may be of any race.
Approximately 5% of residents
residing in Larimer County in
2009 were foreign born.8
Among residents over the age of
5, 10% speak a language other
than English in the home.9
Of those, the majority (67%)
speak Spanish, and 3% of the
total population report they
speak English „less than very
well.‟10
Age
Larimer County‟s median age was 35
years in 2009.11
In 2009, 25% of the population was
under the age of 18 and 12% was over the
age of 65.12
Projections from 2011 through 2040
anticipate a 177% increase in the
population over the age of 65, compared
to an increase of 63% for all ages.13
The percentage of the population over the
age of 65 is expected to grow from 11% in
2011 to 19% in 2040.14
In comparison, although the number of
children under the age of 18 is expected to
increase by 56% between 2011 and 2040,
the percentage of the population in this
age group is anticipated to change only
marginally, from 25% of the entire
population in 2011 to 24% in 2040.15
Vital Statistics - 5-year Average (2005-2009)
Colorado Larimer
Total Population 4,896,051 288,062
Number of Births 69,819 3,490
Birth Rate (per 1,000 population) 70.1 82.5
Fertility Rate (per 1,000 population) 68.3 54.5
Percentage of:
Low birthweight babies 9% 8%
Received 1st trimester prenatal care 77% 80%
Medicaid paid for prenatal care 32% 31%
Births to teen mothers (15-19) 2% 1%
Births to unmarried women 24% 25%
Births to women with less than HS education 21% 16%
Deaths 30,232 1,620
Death Rate (per 1,000 population) 61.8 56.2
Source: Colorado Department of Public Health and Environment
County
Pro
file

8
EMPLOYMENT
Larimer County‟s economy is diverse but changing:
In 2009, it‟s estimated there were in excess of 188,000 jobs in Larimer County, representing a 10.7% increase from 2001.16
Between 2001 and 2009, 18,214 jobs were added in Larimer County. The majority of those jobs were in the Retail Trade and
Government sectors. Construction (-1,571 or -10.6%) and Manufacturing (-6,598 or -35.4%) were the big losers, positions
that tend to pay higher average wages.17
The largest labor sectors in 2009 included Accommodation & Food Services, Professional and Business Services, Health Care,
Retail Trade and Government. No one sector comprised more than 15% of the labor market.18
Small businesses do well in Larimer County:
More than 75% of employees in the county are employed by firms with fewer than 10 employees.19
Between 2000 and 2008 small businesses with fewer than 10 employees added an estimated 3,041 jobs to the economy.20
Larimer County‟s unemployment rate is lower than national and state averages:
Unemployment is the highest it‟s been in 20 years – 6.6% in 2010 and 8.4% as of January 2011.21
Although historically high, Larimer County‟s 2010 annual unemployment rate was well below the national average of 9.6%
and the state average of 8.9%.22
HOUSING
As of January 2010, there were 132,157 housing units available in Larimer County23:
Two-thirds (66%) of occupied units are owner-occupied compared to one-third (34%) renter-occupied.24
In 2009, 98% of building permits issued in Larimer County were for single-family homes, compared to 94% in 2008.25
Over the last decade, building permits have declined 87% from a high of 2,835 in 2000 to a low of 369 in 2009.26
As of 2009, the average household size in Larimer County was 2.2 persons27:
Berthoud has the highest household size in the county (2.5).28
In addition to Berthoud, three other Larimer County communities have household sizes higher than the county average:
Loveland (2.4), Timnath-Wellington (2.4) and Fort Collins (2.3).29
LAND USE
Larimer County covers 2,640 square miles:
A substantial portion (39%) is occupied by the
Roosevelt National Forest.30
One-quarter of the County is devoted to
agricultural use.31
Approximately 10% is used for residential
purposes.32
GROSS DOMESTIC PRODUCT (GDP)
Out of 366 Metropolitan Statistical Areas (MSAs)
within the United States, Fort Collins-Loveland
ranked 157th in GDP in 2009.33
STATE AND LOCAL FINANCES
Larimer County has the 7th highest average mill
levy in the state, behind Adams, Broomfield,
Douglas, Jefferson, Arapahoe, and Pueblo
counties34:
In Larimer County, the largest percentage of property taxes supports public schools (52%).35
Just over 26% of collected property taxes go to Larimer County.36
According to the U.S. Census Bureau, Larimer County‟s property taxes rank 641 out of 792 counties in the country, with #1
being the highest tax as a percentage of the home‟s value.
County
Pro
file

9
SOURCES
1Colorado State Demography Office 2Ibid. 3Ibid. 4Ibid. 5Ibid. 6Ibid. 7U.S. Census, 2009 American Community Survey 8Ibid. 9Ibid. 10Ibid. 11Ibid. 12Ibid. 13Ibid. 1
14Ibid. 15Ibid. 16Bureau of Economic Analysis 17Ibid. 18Ibid. 19U.S. Census – County Business Patterns 20Ibid. 21Bureau of Labor Statistics 22Ibid. 23Colorado Department of Local Affairs 24Ibid. 7
25U.S. Census Bureau 26Ibid. 27U.S. Census Bureau, 2005-2009 American Community Survey, Five-Year Estimates 28Ibid. 29Ibid. 30U.S. Forest Service 31Colorado State University 32Ibid. 33Ibid. 16
34Ibid. 23
35Ibid. 36Ibid.

10
Key Findings
In Larimer County:
The population over the age of 65 is increasing;
Although the county is not racially diverse, the Hispanic population continues to grow;
Overall, the population of the county is increasing, with more people moving in than
leaving.
Demographics

11
Age
Description of Indicators The following indicators look at the changing
composition of the demographics within
Larimer and Weld Counties.
Why is this important? Understanding the demographic composition of
the County helps community leaders and
decision makers plan for future needs and
allocation of resources.
How is Larimer County doing?
Age
The median age in Larimer County went from
33.9 in 2005 to 35.1 in 2009, a 3.5% increase.
There were fewer school age children in Larimer
County in 2009 than 20 years ago, while the
population over the age of 65 continues to grow.
Dem
ogra
phic
s
The median age of Larimer and Weld County residents is increasing. The median
age of Larimer County residents is slightly higher than the median age of Weld
County residents.

12
Diversity
Diversity
Population by Race/Ethnicity - 2009
% of Total
Larimer County
White 91.8%
Hispanic 10.2%
Black/African American 0.9%
American Indian 0.6%
Asian 2.0%
Two or More Races 2.3%
Weld County
White 90.7%
Hispanic 27.6%
Black/African American 0.5%
American Indian 0.8%
Asian 1.1%
Two or More Races 3.4%
Source: U.S. Census
Although the Hispanic population
has increased 55% in the last 20
years, there has been little
diversification with respect to other
minorities.
The percentage of Hispanic
students enrolled in the public
schools in Larimer County has
grown substantially over the last
decade: Park (169.0%), Thompson
(86.6%) and Poudre (47.2%).
Dem
ogra
phic
s
Although Larimer and Weld Counties are predominantly White, the
Hispanic populations are steadily increasing.

13
Population and Migration
Migration Over the last decade, more people have moved into Larimer and Weld Counties than have moved out of the area. Net migration
in Weld County has been steadily declining since 2005.
Dem
ogra
phic
s
The populations of Larimer and Weld Counties continue increasing as
more people are moving into the area than are leaving.

14
Key Findings
According to the Milkin Institute, in 2010, Fort Collins-Loveland ranked higher in overall economic
performance than Boulder, Colorado Springs, Denver or Greeley.
On average, wages in Larimer County remained flat between 2001 and 2009, with the exception of the
“Management of Companies” and “Professional and Business Services” sectors. These two sectors accounted
for 8.7% of total Larimer County jobs in 2009.
More than 75% of businesses in Larimer County employ fewer than 10 employees.
Although the unemployment rate has been on the rise since 2007, it still remains below the unemployment
rate for the state and nation.
Full-time child care for an infant now costs more than resident tuition at Colorado State University.
An increasing number of County residents now require some sort of public assistance to make ends meet.
Economy

15
Gross Domestic Product
Description of Indicator Gross Domestic Product (GDP) is the total market value of all final goods and services produced in a specific area in a given year,
equal to total consumer, investment and government spending, plus the value of exports, minus the value of imports. In 2009,
nominal GDP (in current dollars) in the Fort Collins-Loveland MSA was $11,189M.
Why is this important? GDP is a good indicator of whether the local economy is growing, shrinking or holding steady.
How is Larimer County doing? Real GDP, or GDP adjusted for inflation, increased more than 17% between 2001 and 2009. Because of the countrywide
recession, real GDP in Larimer County decreased slightly in 2009 (2.3%). For individual sectors, Manufacturing produced the
highest percentage of the county‟s GDP (17%), followed by Government (15%) and Real Estate (12%). Manufacturing,
Professional & Business Services, and Healthcare all increased productivity since 2001, whereas Government, Real Estate, and
Construction all decreased.
Econom
y
The Gross Domestic Product (GDP) increased every year in the Fort
Collins-Loveland Metropolitan Statistical Area (MSA) since 2001
before declining slightly in 2009.

16
Gross Domestic Product - continued
Of the 366 Metropolitan Service Areas (MSAs) in the United States, Fort Collins-Loveland
MSA‟s GDP ranked 160 in 2008. Between 2007 and 2008, GDP in the area increased 4.2% (in
Real GDP) and was ranked 30th out of 366 MSAs.
Colorado MSA U.S.
Ranking 2007 to 2008
% Growth in Real GDP
Grand Junction 1 12.3% Fort Collins-Loveland 30 4.2% Pueblo 38 3.6% Colorado Springs 48 3.2% Boulder 49 3.2% Denver-Aurora-Broomfield 97 2.0% Greeley 102 1.9%
Econom
y

17
Labor Force
Description of Indicators The following indicators look at the total number of jobs available, the type of jobs and the average wage for those jobs in
Larimer and Weld Counties.
Why is this important? The health of the economy depends on providing a sufficient number of living wage jobs for the workforce.
How is Larimer County doing? No one sector employed more than 15% of the County‟s workforce in 2009:
The Government sector employed the largest percentage of workers in Larimer County (14.9%).
In Larimer County, Retail Trade employed 11.4%, followed by Health Services (10.1%), Professional & Business Services
(8.7%), and Accommodation & Food Services (8.1%).
Number of Jobs per Sector
Larimer County Weld County
2001 2009 2001 2009 Agriculture, Forestry, Fishing & Hunting 457 624 1,076 902 Mining 701 1,368 1,648 3,845 Utilities 232 270 223 249 Construction 14,862 13,291 9,460 10,387 Manufacturing 18,635 12,037 11,893 11,120 Wholesale Trade 3,612 3,791 3,795 4,064 Retail Trade 20,141 21,437 10,610 9,901 Transportation & Warehousing 3,102 2,905 3,009 3,174 Information 3,483 3,555 1,229 1,347 Finance & Insurance 5,681 8,791 4,533 6,528 Real Estate, Rental & Leasing 7,933 10,899 3,465 5,035 Professional & Business Services 12,560 16,375 3,885 4,756 Management of Companies & Enterprises 232 515 721 984 Administrative & Waste Services 9,957 10,584 5,441 5,892 Educational Services 1,941 2,753 607 1,101 Health Care & Social Assistance 13,221 18,931 8,064 9,673 Arts, Entertainment & Recreation 3,664 5,264 1,372 2,022 Accommodation & Food Services 13,598 15,162 5,568 6,372 Other Services (exc. Public Administration) 8,298 9,602 4,966 5,939 Government 25,672 28,027 12,858 15,642
Total employment 170,056 188,270 100,461 115,069
Source: Bureau of Economic Analysis
Econom
y
The total number of jobs in Larimer and Weld Counties has increased,
however a large number of high paying manufacturing jobs have been
lost.

18
Labor Force – continued
Larimer County had a net gain of 18,214 jobs between 2001 and 2009:
The majority of those jobs were in the Health Care, Professional & Business Services and Finance & Insurance sectors.
Three sectors lost jobs – Transportation & Warehousing, Construction and Manufacturing. Historically, the Manufacturing sector
has paid the highest wages.
Weld County gained a total of 14,608 jobs during this same time, the majority of which were in the Government sector.
Weld County also lost jobs in the Manufacturing, Retail Trade, and Agriculture sectors, but not nearly as many as in Larimer County.
Econom
y

19
Wages
Larimer County saw no increase in average wages between 2001 and 2009 when adjusted for inflation:
The Real Estate, Health Care, Professional & Business Services and Accommodation sectors all saw increases in average wages
between 2001 and 2009.
Just over one-half of the sectors listed above paid more than the average wage in 2009. Of those 11 sectors, Health Care and
Professional & Business Services employed nearly 20% of the County‟s workforce.
Average Wage per Job by Industry Adjusted to 2009 Dollars
Larimer County Weld County
2001 2009 2001 2009 Agriculture, Forestry, Fishing & Hunting $26,520 $28,444 $26,832 $30,056 Mining $42,432 $43,992 $56,992 $62,816 Utilities $56,524 $60,476 $70,928 $70,252 Construction $43,576 $44,720 $42,536 $46,592 Manufacturing $70,408 $67,912 $48,620 $42,016 Wholesale Trade $46,748 $51,272 $47,424 $53,560 Retail Trade $25,948 $23,556 $27,040 $25,116 Transportation & Warehousing $33,748 $35,308 $39,416 $41,496 Information $47,944 $48,932 $47,164 $43,368 Finance & Insurance $50,128 $49,764 $49,244 $47,892 Real Estate, Rental & Leasing $30,680 $31,200 $30,212 $31,720 Professional & Business Services $51,480 $71,552 $38,844 $47,112 Management of Companies & Enterprises $53,664 $64,636 n/a $80,444 Administrative & Waste Services $27,508 $29,952 $22,308 $27,716 Educational Services $25,116 $24,596 $26,312 $22,828 Health Care & Social Assistance $39,364 $42,432 $36,348 $40,560 Arts, Entertainment & Recreation $15,496 $15,236 $13,728 $14,768 Accommodation & Food Services $13,728 $14,092 $11,336 $12,532 Other Services (exc. Public Administration) $25,948 $27,144 $26,208 $26,780 Government $44,512 $45,708 $35,880 $37,024
Average for All Industries $40,248 $40,248 $36,400 $37,648
Source: Colorado Department of Labor
Econom
y
When adjusted for inflation, wages in Larimer County have remained
flat since 2001. Weld County wages have increased a moderate 3.2%
since 2001.

20
Wages – continued
Only four employment sectors in Larimer County (Professional & Business Services, Manufacturing, Management of Companies, and
Utilities paid an average wage high enough to provide self-sufficiency for a family of four. Those four sectors, combined, employed an
estimated 16% of the total Larimer County workforce in 2009.
Econom
y
Highest/Lowest Average Wage in 2009

21
Businesses
Description of Indicators The following indicators look at the total number of businesses by employee size, and the number of financial institutions and
their holdings.
Why is this important? The more diverse the economy, the better the County is able to weather downturns. The number of financial institutions and the
value of their deposits are a leading indicator of a community‟s economic activity and strength.
How is Larimer County doing? In 2009, the large majority of business in Larimer County
employed fewer than 10 employees:
More than 75% of businesses in the County
employed fewer than 10 employees in 2008.
There was a loss of a total of 40 businesses
in 2008 over 2007.
But there were 683 more small businesses
in the County between 2003 and 2008.
In the last decade, Larimer County added 7 more
financial institutions and increased total bank deposits
by 42.5% when adjusted for inflation.
In comparison, Weld County‟s financial institutions
increased total bank deposits by 35.7% when adjusted
for inflation.
Deposits of All FDIC-Insured Institutions
Larimer County
Weld County
Number of Institutions
Bank deposits
Year-to- year growth
Number of Institutions
Bank deposits
Year-to- year growth
FY2000
25
$2,551,450
25
$1,671,970
FY2001
25
$2,798,375
9.7%
24
$1,783,587
6.7%
FY2002
28
$3,079,794
10.1%
26
$1,845,181
3.5%
FY2003
27
$3,363,641
9.2%
28
$2,015,692
9.2%
FY2004
27
$3,446,943
2.5%
27
$2,236,438
11.0%
FY2005
32
$3,718,050
7.9%
29
$2,604,410
16.5%
FY2006
30
$3,958,649
6.5%
28
$2,989,000
14.8%
FY2007
33
$4,229,735
6.8%
28
$3,603,905
20.6%
FY2008
34
$4,412,234
4.3%
28
$3,856,448
7.0%
FY2009
33
$4,655,907
5.5%
27
$3,043,274
-21.1%
FY2010
32
$4,673,402
0.4%
26
$2,916,331
-4.2%
Source: Federal Deposit Insurance Corporation
Econom
y
The number of businesses in Larimer and Weld Counties continues
to increase, with the majority employing fewer than 10 employees.

22
Unemployment Rate
Description of Indicator The following indicator looks at the
annual unemployment rate in
Colorado compared to Larimer and
Weld Counties.
Why is this important? Family well-being is dependent on
gainful employment. The
unemployment rate is a good
measure of the local economy‟s
ability to provide employment
opportunities to those who are able
and willing to work. Additionally, an
increased demand for social services
often goes hand in hand with higher
unemployment rates.
How is Larimer County
doing? Larimer County‟s unemployment
rate has been lower than the rate in
Weld County and Colorado:
Colorado‟s unemployment rate
was 8.3% in 2009, compared to
6.6% in Larimer County and 8.7%
in Weld County.
When comparing Larimer
County‟s rate with 10 comparable
communities around the country,
only 3 communities had lower rates in 2009: Amarillo, TX, Boulder, CO, and Lincoln, NE.
Historical Annual Unemployment Rates
2001 2002 2003 2004 2005 2006 2007 2008 2009 Amarillo, TX 3.9 4.6 4.8 4.3 4.0 3.7 3.4 3.6 5.3 Beaumont-Port Arthur, TX 7.2 7.9 8.7 8.2 7.6 5.9 5.3 6.5 9.6 Boulder, CO 3.7 5.8 5.8 4.9 4.5 3.8 3.4 4.2 6.4 Corpus Christi, TX 5.5 6.3 6.7 6.4 5.6 4.9 4.4 4.7 7.2 Eugene-Springfield, OR 6.8 7.1 8.0 7.3 6.2 5.4 5.2 6.7 11.9 Fort Collins-Loveland, CO 3.2 4.7 5.1 4.7 4.5 4.0 3.5 4.2 6.6 Fort Smith, AR 4.2 5.0 5.5 5.2 4.5 4.8 5.1 4.9 7.9 Gainesville, FL 3.5 4.0 3.7 3.4 2.9 2.7 3.0 4.3 7.2 Greeley, CO 3.5 5.2 5.9 5.7 5.6 4.8 4.2 5.2 8.7 Green Bay, WI 4.1 5.1 5.5 4.9 4.7 4.7 4.6 4.7 8.1 Lincoln, NE 2.7 3.2 3.7 3.5 3.6 2.8 2.8 3.0 4.3
Source: Bureau of Labor Statistics
Econom
y
The unemployment rate continues increasing. Larimer County‟s
unemployment rate has been consistently lower than the rate in
Colorado and Weld County.

23
National Rankings
Milkin Institute National Rankings Best Performing Cities Index
2003 2004 2005 2006* 2007 2008 2009 2010
Boulder 92 99 92 - 93 95 44 56
Fort Collins-Loveland 80 133 46 - 75 48 22 50
Colorado Springs 36 87 71 - 96 111 101 99
Denver 89 130 105 - 106 44 55 63
Greeley 104 141 31 - 29 20 20 101
*No report produced in 2006 Source: Milkin Institute
The Milkin Institute is a non-profit, independent economic think tank that publishes the annual “Best
Performing Cities: Where America‟s Jobs are Created and Sustained.” This report ranks cities by their
success in job creation and retention, the quality of those jobs, as well as their overall economic performance.
The table above shows where the largest metropolitan areas in Colorado ranked out of the 200 largest areas
in the United States. The Fort Collins-Loveland area ranked in the top 80 for 6 of the 7 years shown, with
2009 being the best ranking at 22nd.
Econom
y
In 2010, Fort Collins-Loveland ranked higher than Boulder, Colorado
Springs, Denver or Greeley in the Milkin Institute‟s Best Performing
Cities Index. Greeley ranked the lowest of the five Colorado cities.

24
Assessed Valuations
Description of Indicator The following indicator looks at the diversity of county-level tax assessments.
Why is this important? The more diverse the county‟s tax assessments, the more likely it is to weather fluctuations in the economy.
How is Larimer County doing? In 2009, the average mill levy in Larimer County was higher than in Weld County:
In Larimer County, the majority of property taxes were derived from residential taxes (52%).
Education collects the largest share of property taxes in Larimer and Weld Counties (52.2% and 40.7%, respectively).
Assessed Valuations by Property Class, 2009
Larimer County Weld County
$4,268,029,157 Total Assessed Value $5,779,693,520 Total Assessed Value $361,791,133 Total Revenue $386,779,350 Total Revenue
84.768 Average Mill Levy 66.920 Average Mill Levy
Property Tax by Taxing Authority Property Tax by Taxing Authority
School Districts $189,018,155 52.2% School Districts $157,368,384 40.7% Junior Colleges $1,901 0.0% Junior Colleges $31,120,999 8.0% County Government $95,663,385 26.4% County Government $96,972,420 25.1% City/Town Government $30,453,159 8.4% City/Town Government $28,804,105 7.4% Special Districts $46,654,534 12.9% Special Districts $72,513,442 18.7% Total $361,791,134 100.0% Total $386,779,350 100.0%
Source: Colorado Department of Local Affairs
Econom
y
In 2005, the average mill levy in Larimer County was 81.878 and
72.259 in Weld County. Larimer County‟s mill levy was higher in
2009, whereas Weld County‟s mill levy was lower.

25
Income Distribution
Description of Indicators The following indicators look at family income distribution. Median Family Income (MFI) is the point at which one-half of
incomes fall below that point and one-half are above that point. The Gini Index measures the degree of income inequality,
where 0 corresponds to perfect equality (everyone has the same income) and 1 corresponds to perfect inequality (one person has
all the income). Per Capita Income is calculated by dividing the total population by the total income of an area. A higher Gini
Index will often skew Per Capita Income.
Why is this important? Median Family Income is a commonly used indicator of current family economic status, since it depicts pooled resources. It is
also commonly used to determine housing affordability. As for income inequality, it‟s likely to affect workers‟ health and
productivity the larger the gap grows.
How is Larimer County doing? According to the 2009 American Community Survey, 52.3% of Larimer County families had family income less than $75,000
In 2010, Larimer County‟s MFI was higher than Colorado‟s MFI ($71,000) and the United State‟s MFI ($64,400).
Historically, Larimer County‟s MFI has been higher than the MFI in Mesa, Pueblo, and Weld Counties.
When adjusted for inflation, Larimer County‟s MFI has increased 0.9% since 2006.
Median Family Income
2006 2007 2008 2009 2010
Boulder $81,600 $82,500 $85,000 $89,100 $89,600
Larimer $68,600 $68,200 $75,000 $75,200 $74,900
Mesa $50,100 $49,800 $55,000 $57,200 $60,100
Pueblo $46,800 $48,000 $48,700 $51,300 $50,700
Weld $57,800 $59,800 $64,000 $64,300 $65,000
Source: U.S. Department of Housing and Urban Development
Econom
y
When adjusted for inflation, Larimer County‟s Median Family
Income (MFI) has increased 0.9% since 2006 compared to a
3.8% increase in Weld County.

26
Income Distribution - continued
In 2008, Median Family Income (MFI) in Larimer County was $75,000. More than half of Larimer County families (52%) earned
less than the MFI between 2005 and 2009.
An even higher percentage (59%) of Weld County families earned less than $75,000 during this same period, although Weld County‟s
MFI was $64,000 in 2008.
Generally speaking, income inequality in Larimer County is similar to that of the state and country (see table below). Income
inequality has been increasing over the last several decades and is considered quite high among industrialized societies. As a
comparison, according to the United Nations, Denmark has the greatest income equality (24.7) and Namibia has the greatest income
inequality (74.3).
Caution should be taken when considering the Gini Index presented below because of the relatively high margin of error. For
example, in 2008, the Gini Index in Larimer County was reported as 47.0, yet when considering the margin of error, it could have
been anywhere between 45.0 and 49.0.
Gini Index
United States Colorado Larimer Weld
2006 46.4 45.0 45.1 42.7
2007 46.7 45.2 44.6 42.9
2008 46.9 45.7 47.0 40.9
2009 46.9 45.3 44.6 42.4
Source: American Community Survey
Econom
y

27
Income Distribution – continued
In 2008, per capita income in Larimer County was less than in the U.S. or Colorado:
Per capita income in Larimer County remained fairly flat between 2000 and 2008; however there was an 11% decrease in
Weld County during this time period.
Larimer County saw a larger percentage increase in per capita income between 1970 and 2008 (115.3%) than the United
States (77.2%), Colorado (91.9%) or Weld County (43.5%).
Econom
y

28
Childcare Costs
Description of Indicator The following indicator looks at the childcare cost to families in order for them to work.
Why is this important? Without affordable childcare, parents are unable to work full-time in order to support their families.
How is Larimer County doing? As childcare costs in Larimer County have risen over the last decade, the number of children helped by the Child Care Assistance
Program (CCAP) has decreased:
In 2001, an average of 1,656 children per month was provided with child care assistance through the CCAP program. In 2010, that
number decreased to 1,076, a 35% decrease.
In the last decade, the average CCAP cost per household went from $472 per month to $709 per month, a 50% increase.
CCAP funding over the last decade has varied, but the current trend indicates that income thresholds for eligibility are being lowered.
As of January 2011, eligibility is limited to those with family incomes at or below 150% of the Federal Poverty Level.
Larimer County Childcare Cost, 2010
Full-time cost in child care centers
Age Minimum Weekly
Maximum Weekly
Average Weekly
0-12 months $200 $305 $265
1-2 years $170 $383 $241
2-5 years $140 $338 $208
5-6 years $112 $338 $182
6+ years before/after school $103 $140 $119
Full-time cost in family child care homes
Age Minimum Weekly
Maximum Weekly
Average Weekly
0-12 months $90 $275 $164
1-2 years $90 $275 $162
2-5 years $30 $250 $153
5-6 years $65 $225 $148
6+ years before/after school $35 $225 $85
Source: Early Childhood Council of Larimer County
Econom
y
In 2010, average childcare costs for an infant ($13,780) were
approximately double the cost of resident tuition at Colorado State
University ($6,985).

29
Poverty Rates
Description of Indicators The following indicators describe the percentage/number of residents living below the poverty level, followed by those being
aided by the social safety nets provided to the disadvantaged residents of Larimer County.
Why is this important? The overall health of the economy is often ascertained by the number of people requiring social services assistance. In 2009, a
family of four with a household income of $22,050 or less was considered to be living in poverty.
Federal Poverty Guidelines for 48 Contiguous States and D.C.
Persons in Family
Unit 2005 2006 2007 2008 2009
1 $9,570 $9,800 $10,210 $10,400 $10,830
2 $12,830 $13,200 $13,690 $14,000 $14,570
3 $16,090 $16,600 $17,170 $17,600 $18,310
4 $19,350 $20,000 $20,650 $21,200 $22,050
5 $22,610 $23,400 $24,130 $24,800 $25,790
6 $25,870 $26,800 $27,610 $28,400 $29,530
7 $29,130 $30,200 $31,090 $32,000 $33,270
8 $32,390 $33,600 $34,570 $35,600 $37,010
Each additional person, add $3,260 $3,400 $3,480 $3,600 $3,740
Source: U.S. Department of Health and Human Services
Econom
y
In 2000, 9.2% of Larimer County residents were living in poverty. By
2009, an estimated 15.6% of residents were living in poverty and
26.3% were living below 185% of the Federal Poverty Guidelines.

30
Poverty Rates - continued
How is Larimer County doing? Poverty rates in Larimer County have
increased over
the last decade:
Prior to 2009, Larimer County‟s poverty rate
was lower than the poverty rate of Colorado
and the nation.
A 13.7% poverty rate translates to an
estimated 41,000 Larimer County residents
living in poverty.
Since 2000, the number of children under
the age of 18 living in poverty has increased
68.5%, and the number of seniors 65 and
older living in poverty has increased 53.2%
As of 2009, an estimated average of 7,918
children and 2,156 seniors are living in
poverty in Larimer County.
Children (0-17) Living in Poverty
2000 2005-2009
United States 16.6% 18.6%
Colorado 11.3% 15.7%
Larimer County 7.3% 12.3%
Source: U.S. Census Bureau
Seniors (65+) Living in Poverty
2000 2005-2009
United States 9.9% 9.8%
Colorado 7.4% 8.5%
Larimer County 4.4% 6.7%
Source: U.S. Census Bureau
Econom
y

31
Public Assistance
Larimer County Public Assistance
Average Monthly Number of Households Receiving Assistance
2006 2007 2008 2009 2010
Food Stamps 4,759 4,790 5,324 7,028 8,592
TANF 549 380 247 366 496
Source: Larimer County Dept. of Human Services
Average Monthly Number of Unique Clients
2006 2007 2008 2009 2010
Medicaid n/a n/a 16,684 19,596 24,173
Source: Colorado Department of Health Care Policy and Financing
The number of households receiving public assistance increased
substantially in Larimer County as the recession deepened in
2008.
In Larimer County, the
average number of households
receiving Food Stamps
increased 81% in the last 5
years.
In the last 3 years, the average
number of individuals on
Medicaid increased 45%.
The Earned Income Tax Credit
(EITC) is a refundable tax credit
primarily for workers with
qualifying children.
In 2000, 8.3% of tax returns
filed by Larimer County
residents received an EITC,
compared to 10.1% in 2007.
The average EITC for Larimer
County residents increased
28% between 2000 and 2009.
Econom
y

32
Free or Reduced School Lunch
The number of students who qualify for the free and reduced school lunch program is a good indicator of the economic health of the
community:
Historically, the school districts in Larimer County have had a lower percentage of students qualifying for the free and reduced school
lunch program than the state.
Nearly a third (31%) of students attending school districts in Larimer County qualified for the free and reduced school lunch program
in 2010-11.
The percentage of students qualifying for the free and reduced school lunch program in Larimer County increased much faster than
the state average between 2001-02 and 2010-11.
Park School District saw the greatest percentage increase (108.8%) in students qualifying for the program between 2001-02 and
2010-11, followed by Thompson (65.1%) and Poudre (64.3%).
The number of students receiving free or reduced school lunches
has steadily increased over the past decade.
Econom
y

33
Food Bank
The number of individuals served by the Food Bank for Larimer County increased 51.6% between 2006 and 2010.
The number of children being served meals at the Kids Café sites in the County increased 85.4% during this same period.
According to the Food Bank for Larimer County, 1.3 million pounds of food were distributed to approximately 70 nonprofit
agencies in FYE2010, an 18.2% increase since FYE2006.
The number of residents utilizing the Food Bank for Larimer
County has steadily increased since 2006.
Econom
y

34
Key Findings
More than half of renters in Larimer County (54.5%) paid in excess of 30% of their income for housing in
2009.
Foreclosure filings have risen 403.4% since 2001.
In 2001, 3,664 building permits were issued in Larimer County compared to 451 in 2009.
On average, the median sales price for a single-family home in Larimer County increased approximately 2%
per year over the last decade.
The majority (54%) of the homeless in Fort Collins are households with children.
Homelessness is on the rise as the economy worsens and the number of affordable housing units falls short.
Housing

35
Affordability
Description of Indicators The following indicators look at the affordability of housing
in Larimer County, whether it‟s home ownership or renting.
Why is this important? Affordable housing, whether it‟s home ownership or renting,
is key to raising a family and providing stability for the
economy.
How is Larimer County doing? The Housing Affordability Index (HOI) is a standard
established by the National Association of Realtors that
gauges the ability to afford a home based on the median
family income (MFI). A score of 100 means a family earning
the MFI could afford a typical single-family home with a 20%
down payment.
Since 2003, housing in Loveland and Fort Collins has been
more affordable than in the nation as a whole.
Generally speaking, housing in Loveland and Fort Collins
is becoming more affordable, although in 2010, a family
earning the MFI of $74,900 would not have sufficient
income to purchase a typical single-family home.
In 2009, more than half (54.5%) of renters and almost a
third (31.4%) of homeowners in Larimer County paid in
excess of 30% of their income for housing.
Housi
ng
In 2010, home affordability in Larimer County decreased for the
first time since 2006.
36
Affordability – continued
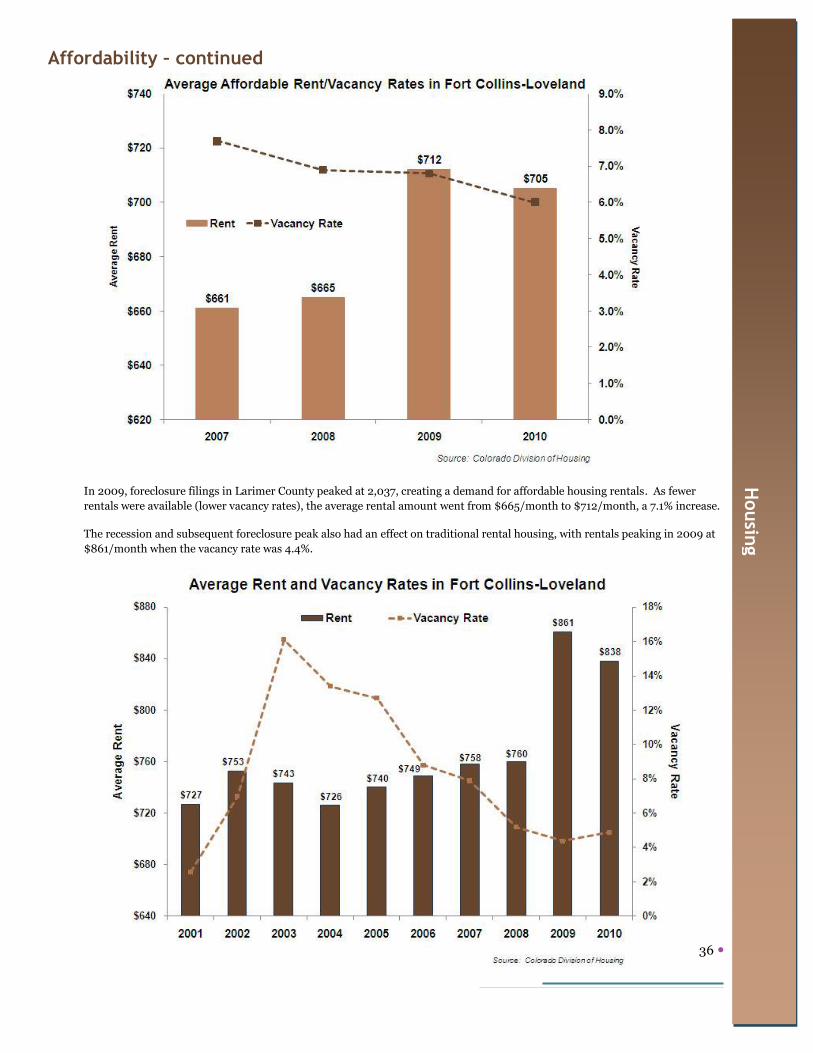
In 2009, foreclosure filings in Larimer County peaked at 2,037, creating a demand for affordable housing rentals. As fewer
rentals were available (lower vacancy rates), the average rental amount went from $665/month to $712/month, a 7.1% increase.
The recession and subsequent foreclosure peak also had an effect on traditional rental housing, with rentals peaking in 2009 at
$861/month when the vacancy rate was 4.4%.
Housin
g

37
Housing Foreclosures
Description of Indicator The following indicator looks at the number of foreclosure filings in Larimer County.
Why is this important? High foreclosure rates often correlate with high unemployment rates and low wages. Foreclosures also negatively affect new
home construction, weaken the real estate market and decrease the value of home prices, which in turn, lower the amount
collected in property taxes.
How is Larimer County doing? Foreclosure filings in Larimer County have risen dramatically since 2001:
Although there was 275 fewer foreclosure filings in 2010, compared to 2009, it is widely assumed this was due to the
mortgage industry voluntarily halting foreclosures while legal matters were resolved.
Since 2001, foreclosures have increased 403.4%.
Housi
ng
Between 2001 and 2009, foreclosure filings have steadily increased.
There were fewer filings in 2010 due to a voluntary suspension by the
mortgage industry. Industry experts anticipate another increase in 2011.

38
Building Permits
Description of Indicators The following indicators look at
the number and type of building
permits issued in Larimer and
Weld Counties.
Why is this important? Building permits, in conjunction
with housing starts, is a leading
economic indicator and is often
seen as a gauge for future real
estate supply levels. Growing
economies are often accompanied
by an increase in the number of
building permits issued.
How is Larimer County
doing? Over the last decade, the trend in
the number of building permits
issued has been downward:
Between 2001 and 2009, the
number of building permits
issued in Larimer County
decreased 88%.
In 2001, a total of 3,664 permits were issued, compared to 451 in 2009.
In 2010, the number of permits issued increased to 1,156, a 156% increase over the previous year.
Housin
g
The trend over the past decade has been a decrease in the number
of building permits issued.

39
Median Sales Price – Single Family Homes
Description of Indicator The following indicator looks at the median sales price
for a single family home in Larimer County. The
median sales price represents the point where half the
sales are of lower value and half the sales are of higher
value. In general, the median sales price is less biased
than the average sales price because it is less influenced
by a few sales of very expensive homes.
Why is this important? The median sales price of single family homes often
indicates if housing in the community is keeping up or
doing better than inflation. If real estate is seen as
doing better than inflation, real estate is viewed as a
good investment. However, if prices rise too quickly,
too many potential homeowners may be priced out of
the market.
How is Larimer County doing? Median sales prices in the County have generally
trended upward over the last decade:
In 7 of the last 10 years, median sales prices in Estes Park exceeded inflation.
In the Loveland-Berthoud area, prices didn‟t do quite as well and exceeded inflation 50% of the time.
The Fort Collins area saw the least amount of growth in that prices exceeded inflation in only 4 of the last 10 years.
Median Sales Price Increase vs. Inflation Rate
Estes Park
Fort Collins
Loveland/ Berthoud
Inflation Rate
2001 12.0%
9.1%
13.1%
2.83%
2002 2.6%
4.6%
5.1%
1.59%
2003 4.8%
2.6%
2.9%
2.27%
2004 3.1%
0.2%
10.2%
2.68%
2005 1.8%
4.3%
5.6%
3.24%
2006 10.1%
0.0%
2.8%
3.39%
2007 -1.5%
2.2%
-4.9%
2.85%
2008 7.6%
-0.9%
-4.7%
3.85%
2009 -11.5%
-3.0%
-5.5%
-0.34%
2010 5.0%
2.7%
4.9%
1.64%
Source: InflationData.com
Housi
ng
The median sales price for a single-family home has been somewhat
volatile throughout Larimer County during the last decade. On
average, the median sales price has increased approximately 2% per
year.

40
Homelessness
Description of Indicators The following indicators attempt to define the homeless community in
Larimer County. Counting the homeless is a difficult task because
many homeless people do not wish to be counted. In addition, the
number of homeless changes frequently.
Why is this important? Homelessness affects communities in a variety of ways, including an
increased financial burden to provide services for temporary housing,
medical care, food assistance, domestic violence, and policing of
criminal activity. It is also a reflection on the availability of affordable
housing. Children living with homelessness often do poorly in school,
are often truant, and are at risk of becoming juvenile delinquents
and/or graduating into adult criminal activity.
How is Larimer County doing? More Larimer County residents have become homeless or are at risk of homelessness as the economy has worsened:
The House of Neighborly Service in Loveland has seen an 81% increase in homelessness between 2006 and 2010.
A homeless point-in-time study, conducted in March 2010 by Homeward 2020, admittedly underestimated the homeless population
in Fort Collins at 518, with an additional 617 at risk of being homeless.
Of the estimated homeless in Fort Collins, 54% were in households with children and 46% were households without children. In
addition, only 11% of those counted were chronically homeless.
The plurality of those counted as homeless in 2010 (43%) reported the reason for their homelessness was due to losing a job or not
being able to find work.
Counting homeless students is problematic because of the stigma associated with homelessness. Students dealing with homelessness
often stay with friends or other family members and choose not to inform school authorities.
Housin
g
Homelessness is on the rise in Larimer County as the economy
worsens and the number of affordable housing units falls short.

41
Key Findings
Students in Larimer County generally score higher than the state average on standardized tests.
Since 2006, the general trend has seen slightly fewer Larimer County students graduating from high school.
In 2009, approximately 41% of Larimer County residents held a bachelor‟s degree or higher.
On average, 53% of Larimer County‟s 3- and 4-year olds attended preschool between 2005 and 2009,
compared to 45% of Colorado‟s 3- and 4-year olds and 47% of the nation‟s 3- and 4-year olds.
Education & Early Childhood

42
CSAP Scores
Description of Indicators The following indicators look at how students in Larimer County school districts score on standardized tests. The first CSAP
tests were given in 1996-97 and have been given every year since to students in grades 3 through 10. The tests are subject-based
(reading, writing, mathematics, and science) and all 4 tests are given to 5th-, 8th-, and 10th-grade students only. In the remaining
grades, students are tested in reading and writing.
Why is this important? Preparing today‟s students for the future is an important investment made by the community and is funded with taxpayer
dollars. Standardized testing provides a mechanism for evaluating the efficacy of the school districts‟ curriculum. Critics of
standardized testing point out that this type of testing doesn‟t measure creativity, initiative, imagination, and a host of other
valuable attributes.
How is Larimer County doing? Students in all three school districts within Larimer County historically score higher than the state average on the CSAP tests:
Third grade students attending schools in the Poudre School District often scored higher on the reading test than students in
the other districts.
Over the last 5 years, there was more variability
in scores in the Park School District . This is
often attributed to the smaller class size and the
larger number of students entering and leaving
the district.
On average, Larimer County 10th graders score
significantly higher on the math test than the
state average (30%); however 60% of Larimer
County 10th graders are unable to meet the state‟s
math standards.
CSAP (Achievement Scores)
Percent of Students Meeting/Exceeding Standards
3rd Grade Reading
Colorado Poudre Thompson Park
2006 71% 80% 80% 80%
2007 70% 80% 76% 75%
2008 71% 71% 78% 66%
2009 70% 81% 73% 80%
2010 73% 81% 75% 56%
Average 71% 79% 76% 71%
Percent of Students Meeting/Exceeding Standards
10th Grade Math
Colorado Poudre Thompson Park
2006 30% 45% 40% 29%
2007 30% 45% 37% 43%
2008 30% 45% 37% 43%
2009 30% 39% 37% 37%
2010 30% 42% 38% 37%
Average 30% 43% 38% 38%
Source: Colorado Department of Education
Educati
on &
Earl
y C
hildhood
Students in Larimer County tend to score higher on Colorado‟s
standardized tests than the state average.

43
ACT Scores
As of 2000-01, all 11th-grade students
in Larimer County are required to
take the ACT tests in English,
reading, mathematics, and science
reasoning:
Larimer County students scored
higher than the state average on
the ACT reading test; however
students didn‟t consistently score
high enough to meet the ACT
Benchmark.
In the last 5 years, Larimer County
students scored higher on the ACT
math test than those in the state as
a whole with the one exception of
Thompson School District in
2008.
ACT math scores have been significantly
lower than the ACT Benchmark
throughout the state over the last
5 years.
Educatio
n &
Early
Child
hood
Larimer County students consistently score higher than the state
average in reading and math. Some school districts failed to meet the
ACT Reading Benchmark and none of the districts met the ACT Math
Benchmark for the years shown.

44
High School Graduation Rates
Description of Indicator The following indicator looks at the percentage of high school students in Larimer County who graduate from high school. As of
2005-06, the method used to calculate graduation rates changed. Prior to 2005, students who dropped out of school to pursue a
GED certificate did not affect the graduation rate. Starting in 2005, students who are pursuing a GED certificate are considered
dropouts, thus lowering the graduation rate.
Why is this important? High school dropouts are more likely to require public assistance, to get in trouble legally, to suffer more negative health effects,
and will earn significantly less income throughout their lives. In today‟s society, a good education is a necessity to becoming a
productive member of the community.
How is Larimer County doing? Graduation rates in all three school districts within Larimer County have been higher than the state average over the last 5
years:
Poudre School District has the highest graduation rates in Larimer County. For the Class of 2010, the graduation rate was
82.4. Some of the 17.6 percent of students who did not graduate with their class may have transferred to other schools, moved
out of the country, and/or earned a GED certificate.
In the last 5 years, Thompson School District has seen the most variability in graduation rates, from a high of 88.1 in 2006 to
a low of 77.9 in 2008.
Educati
on &
Earl
y C
hildhood
Although all three school districts located in Larimer County have
higher high school graduation rates than the state average, the
general trend is downward.

45
Educational Attainment
Description of Indicator The following indicator looks at the
educational level of adults over the age of
25 in Larimer and Weld Counties.
Why is this important? A highly educated workforce is a major
draw for businesses that are considering
relocating to Larimer County. An
educated workforce often means higher
wages and a higher standard of living for
the community.
How is Larimer County doing? Since 1990, a larger percentage of
Larimer County residents are more
educated:
The number of residents in the County
without a HS diploma has decreased
41% since 1990.
The number of residents whose
education ended with high school
declined by 20% since 1990.
Those residents earning an associate degree,
bachelor‟s degree or graduate/
professional degree increased by 16%, 21%
and 38%, respectively, during the same
time period.
Educatio
n &
Early
Child
hood
In 2009, 41% of Larimer County residents held a bachelor‟s degree or
higher, compared to 25% of Weld County residents. This represents an
increase since 1990 of 27% and 35%, respectively.

46
Libraries
Description of Indicators The following indicators look at library use
within the County. The number of materials
circulated per capita is often a factor of the
funding available to purchase a wide range of
materials.
Why is this important? Public libraries are often viewed as societal
equalizers. They provide Internet access to
those looking for jobs, they introduce the
world of learning to young people, and they
provide a place for the community to gather
and socialize.
How is Larimer County doing? According to the Hennen Report, in 2009,
the average number of materials circulated
per capita was 8.5 and the average number of
library visits per capita was 6.2:
All Larimer County libraries, with the exception
of Berthoud, met or exceeded the national
average of 8.5 circulations per capita.
Poudre River Library District (Fort Collins)
and Estes Valley Public Library District
saw the highest circulations per capita in
2009. They also receive the highest
funding of libraries within Larimer County.
Two of the six libraries in Larimer County
(Berthoud and Poudre River) had fewer
visits per capita than the national average
of 6.2.
Educati
on &
Earl
y C
hildhood
Four of six libraries saw more materials checked out per capita
over the last five years, whereas four of six libraries saw visits
per capita decrease during this same period.

47
Preschool Attendance
Description of Indicator The following indicator looks at the percentage of 3- and 4-year old children in Larimer County who were attending preschool in March
of the years shown.
Why is this important? According to the National Institute for Early Education Research (NIEER), "children who attend high-quality preschool enter
kindergarten with better pre-reading skills, richer vocabularies, and stronger basic math skills than those who do not." Many child
development professionals believe the first 5 years of a child‟s life are crucial to success later in life and preschool attendance often puts
children on a lifelong path to academic and personal achievement.
How is Larimer County doing? Overall, the general trend is more 3- and 4-year olds are attending preschool in Larimer County. Over the last 5 years, an average of
53% of Larimer County‟s 3- and 4-year olds attended preschool, compared to 45% of Colorado‟s 3- and 4-year olds and 47% of the
nation‟s 3- and 4-year olds.
According to Qualistar Colorado, there are 58 preschools in Larimer County. Eight of them accept Colorado Child Care subsidies and
five accept sliding scale fees. The majority of preschools (35) are located in Fort Collins, followed by Loveland (13). Berthoud and
Wellington each have 3 and Estes Park, Wellington, LaPorte, Bellevue, and Red Feather Lakes each have 1.
Educatio
n &
Early
Child
hood
On average, approximately 53% of 3- and 4-year olds in Larimer County
attended a preschool program between 2005 and 2009. That number
is expected to drop when the economy is poor and one or both parents
are without employment.

48

49
Key Findings
The percentage of Larimer County residents who use tobacco has been declining since 2001, but remains
above the Healthy People 2010 objective of 12%.
Since 2003, the Chlamydia rate in the United States, Colorado, and Larimer County has been steadily
increasing.
The mortality rates for the top 3 causes of death in Larimer County (cancer, heart disease, and stroke) have
been steadily decreasing since 2000.
The nationwide diabetes epidemic has arrived in Larimer County and is well above the Healthy People 2010
objective of 2.5%.
From 2006 through 2009, the percentage of obese adults in Larimer County has been above the Healthy
People 2010 objective of 15%.
Health

50
Health Insurance Coverage
Description of Indicator This indicator measures the percentage of
residents, by age group, estimated to be
without any health insurance coverage.
Why is this important? Those lacking health insurance coverage are
vulnerable to a wide variety of health and
financial crises.
How is Larimer County doing? In all age groups, Larimer County has a lower
percentage of residents without health
insurance than the average for the state of
Colorado. Working adults -- those between
the ages of 18 and 64 – are the least likely age
group to be covered by health insurance.
Percent With No Health Insurance Coverage by Age Group
2008 2009
Colorado Larimer Colorado Larimer
Under 18 3.6% 1.4% 2.5% 1.6%
18 to 64 13.5% 10.1% 13.1% 12.4%
65+ 0.2% 0.1% 0.1% 0.0%
Total Population 17.2% 11.6% 15.8% 14.0%
Source: U.S. Census Bureau
Healt
h
The percentage of Larimer County residents without health
insurance coverage increased in 2009.

51
Tobacco Use
Description of Indicator The following indicator looks at the percentage of adults over the age of 18 who smoke cigarettes on a regular basis.
Why is this important? According to the Centers for Disease Control, smoking harms nearly every organ in the body, causes many diseases, and reduces the
health of smokers in general. In Colorado, tobacco use continues to be the leading preventable cause of death and the single greatest
driver of health care costs. In Colorado, an estimated $1.31 billion will be spent annually on health care directly caused by smoking.
How is Larimer County doing? One of the Healthy People 2010 objectives aimed at reducing the percentage of chronic smokers in a population to 12% or less.
Although the overall trend in Larimer County over the last decade has been a reduction in the percentage of smokers, 2008 was the
only year the County met the Healthy People 2010 objective.
The Centers for Disease Control (CDC) recommends that Colorado spend $54.5 million on tobacco prevention programs. For FY2011,
Colorado will spend $7 million (or 12.9% of the CDC‟s recommended amount) of the $296 million tobacco-generated revenue on
tobacco prevention programs. (Source: Campaign for Tobacco-Free Kids)
Health
The percentage of Larimer County adults who report smoking
cigarettes is declining. The Healthy People 2010 Objective of 12%
was achieved in 2008, but was exceeded in all other years
represented.
What is Healthy People 2010? Healthy People 2010 is a national health promotion and
disease prevention initiative establishing national
objectives to improve the health of all Americans, to
eliminate disparities, and to increase the years and quality
of life.

52
Sexually Transmitted Infections – Chlamydia
Description of Indicator The following indicator looks at the number of individuals, per 100,000 residents, diagnosed with Chlamydia each year.
Why is this important? According to the Centers for Disease Control (CDC), Chlamydia is the most frequently reported bacterial sexually transmitted
disease in the United States, and if left untreated, often leads to serious reproductive health problems, including infertility.
Chlamydia is also more common in women under the age of 25. It is unclear whether the rise in diagnosed Chlamydia cases is
due to increased testing, a rise in the actual number of infections, or a combination of the two.
How is Larimer County doing? The percentage of County residents being diagnosed with Chlamydia has increased more than 30% since 2003. Although the
number of diagnosed cases continues to increase, the rate is still significantly lower than the rate in Colorado and the nation.
Healt
h
The overall trend in Larimer County, Colorado and the United
States shows an increase in the number of diagnosed Chlamydia
cases.

53
Chronic Disease
Description of Indicator The following indicator compares the top 10 causes of death in Colorado and Larimer County.
Why is this important? Of the top 10 causes of death in Larimer County, all but 3 (unintentional injuries, suicide and influenza/pneumonia) were chronic
diseases in 2009. In fact, close to 89% of Larimer County deaths in 2009 were attributable to chronic diseases.
How is Larimer County doing? A significantly higher percentage of Larimer County residents died from cerebrovascular disease (stroke) and kidney disease in 2009
than the state average.
Health
In 2000, the mortality rates for the top three causes of death in
Larimer County were: cancer (164.4), heart disease (183.9) and
cerebrovascular diseases (59.0). All three had dropped
significantly by 2009.

54
Diabetes
Description of Indicator The following indicator looks at the percentage of Larimer County adults living with diabetes and compares it to the Healthy
People 2010 objective.
Why is this important? Diabetes, one of the leading causes of death in Larimer County, is associated with a large number of other serious chronic health
problems, such as heart disease, stroke, blindness, kidney failure, and lower extremity amputations.
How is Larimer County doing? The incidence of diabetes in Larimer County adults is increasing and has been well above the Healthy People objective of 2.5% of
the adult population since 2005.
Healt
h
The incidence of diabetes in Larimer County adults is on the
rise and well above the Healthy People 2010 objective of 2.5%.
What is Healthy People 2010? Healthy People 2010 is a national health promotion and
disease prevention initiative establishing national
objectives to improve the health of all Americans, to
eliminate disparities, and to increase the years and quality
of life.

55
Obesity
Description of Indicator The following indicator looks at the percentage of Larimer County obese adults over the age of 20 and compares that with the Healthy
People 2010 objective.
Why is this important? Obesity often increases the risks for many of the leading causes of death, such as heart disease, diabetes, cancer and stroke. An increase
in chronic diseases also increases the community‟s overall health care costs and often leads to a reduction in productivity.
How is Larimer County doing? Larimer County last met the Healthy People 2010 objective of 15% of the population categorized as obese in 2005. Since then the
percentage of obese adults over the age of 20 has averaged 17.5%.
Health
The percentage of obese Larimer County adults is on the rise and has
been above the Healthy People 2010 objective of 15% since 2006.
What is Healthy People 2010? Healthy People 2010 is a national health promotion and
disease prevention initiative establishing national
objectives to improve the health of all Americans, to
eliminate disparities, and to increase the years and quality
of life.

56
Physical Activity
Description of Indicator The following indicator looks at the percentage of County residents who are regularly physically active and compares it to the
Healthy People 2010 objective. The percentages below represent those who practice regular, moderate physical activity at least
5 times per week for a minimum of 30 minutes or those who performed vigorous exercise 3 or more times per week for at least
20 minutes.
Why is this important?
Being physically active improves overall health and reduces the risks of obesity and its associated illnesses such as heart
disease, diabetes and some types of cancers (breast and colon, for example).
How is Larimer County doing? The Colorado Department of Public Health and Environment surveys Colorado residents every other year with respect to the
amount of physical exercise they received. Since 2005, a significantly higher percentage of County residents met the minimum
requirements for physical activity as outlined under the “Description of Indicator” above.
Healt
h
The percentage of Larimer County adults who are regularly physically
active is on the rise and is well above the Healthy People 2010
objective of 30%.
What is Healthy People 2010? Healthy People 2010 is a national health promotion and
disease prevention initiative establishing national
objectives to improve the health of all Americans, to
eliminate disparities, and to increase the years and quality
of life.
57
Mental Health
Description of Indicators The following indicators look at the number of
County residents seeking mental health
treatment as well as the number of suicides per
100,000 residents.
Why is this important? Mental health problems, including suicide, have
a lasting affect on a community and family
members. According to the Centers for Disease
Control, men are more likely to commit suicide,
whereas women more often attempt suicide, but
are unsuccessful.
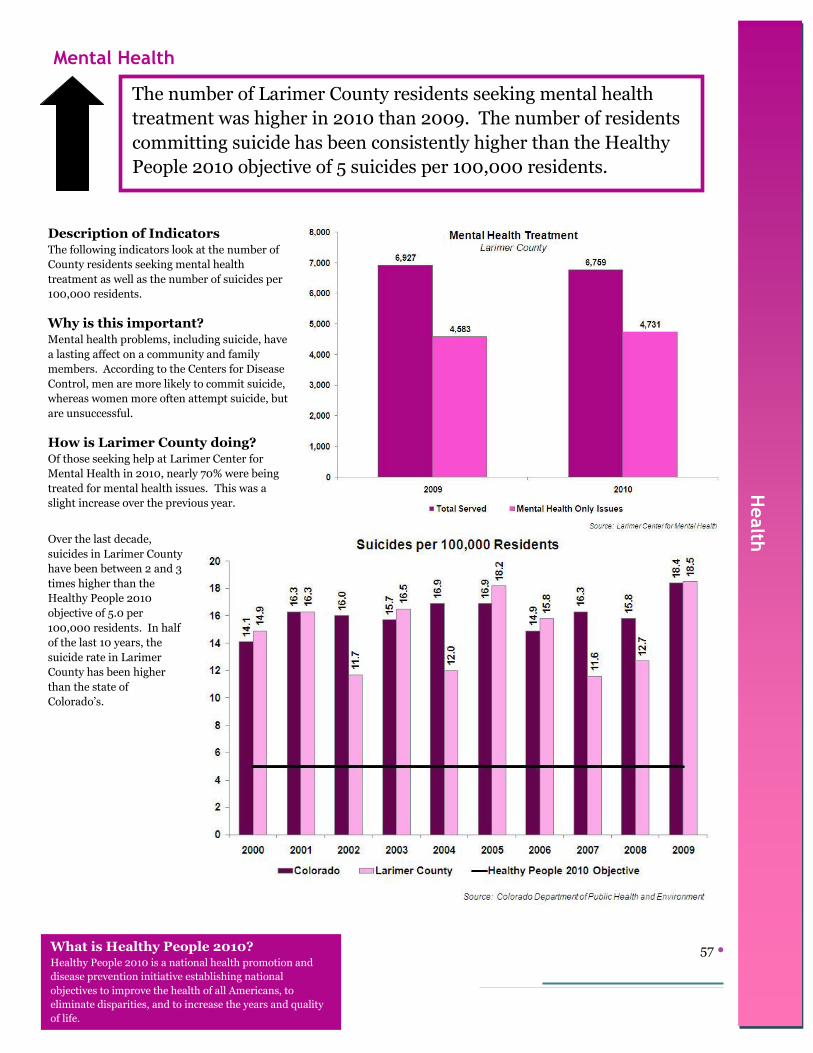
How is Larimer County doing? Of those seeking help at Larimer Center for
Mental Health in 2010, nearly 70% were being
treated for mental health issues. This was a
slight increase over the previous year.
Over the last decade,
suicides in Larimer County
have been between 2 and 3
times higher than the
Healthy People 2010
objective of 5.0 per
100,000 residents. In half
of the last 10 years, the
suicide rate in Larimer
County has been higher
than the state of
Colorado‟s.
Health
The number of Larimer County residents seeking mental health
treatment was higher in 2010 than 2009. The number of residents
committing suicide has been consistently higher than the Healthy
People 2010 objective of 5 suicides per 100,000 residents.
What is Healthy People 2010? Healthy People 2010 is a national health promotion and
disease prevention initiative establishing national
objectives to improve the health of all Americans, to
eliminate disparities, and to increase the years and quality
of life.

58
Child Abuse
Description of Indicator The following indicator compares the rates (per 100,000 children) of reported child abuse cases with those chosen for
investigation and, of those investigated, the number of substantiated reports of child abuse.
Why is this important? Child abuse and neglect can have long ranging, devastating effects on families and society. Some of the problems associated
with child abuse/neglect include impaired brain development, poor physical health, poor mental and emotional health, cognitive
and social difficulties, juvenile delinquency, and alcohol and drug abuse. In 2001, Prevent Child Abuse America estimated the
nation‟s indirect costs of child abuse/neglect at $69 billion per year.
How is Larimer County doing? The rate (per 100,000 residents) of initial child abuse reports, investigations and substantiated cases has all decreased over the
last 5 years. In 2010, approximately 7% of initial reports resulted in substantiated child abuse, compared to 13% in 2006. Of
those reports deemed worthy of investigation, 15% of cases in 2010 resulted in substantiated child abuse, compared to 24% in
2006.
Healt
h
The rate of substantiated child abuse cases per 100,000
children has declined by nearly 53% since 2006.

59
Out-of-Home Placements
Description of Indicators The following indicators look at the
average number of Larimer County
children in out-of-home placements as
well as the average rate of placements
per 1,000 children.
Why is this important? Removing a child from the home is a
traumatic experience for the child and
the family unit. Every effort is made to
keep families intact; however there are
times when a child must be removed for
safety reasons.
How is Larimer County
doing? Out-of-home placements peaked in
2005 at 327 and have been declining
dramatically ever since.
In FY2010, the cost per child for the
most common forms of placement
ranged from a high of $4,954 per month
for a residential treatment facility, to a low
of $833 per month for a placement with other
family members (kinship placement).
Children in Out-of-Home Placement - Larimer County
Number Rate per 1,000 Children
2001 299
4.9
2002 272
4.4
2003 287
4.6
2004 316
5.1
2005 327
5.3
2006 317
5.1
2007 284
4.5
2008 254
4.0
2009 223
3.5
2010 190
2.9
Source: Larimer County Department of Human Services
The total number of out-of-home placements in Larimer County
has decreased by 36% since 2001.
Health
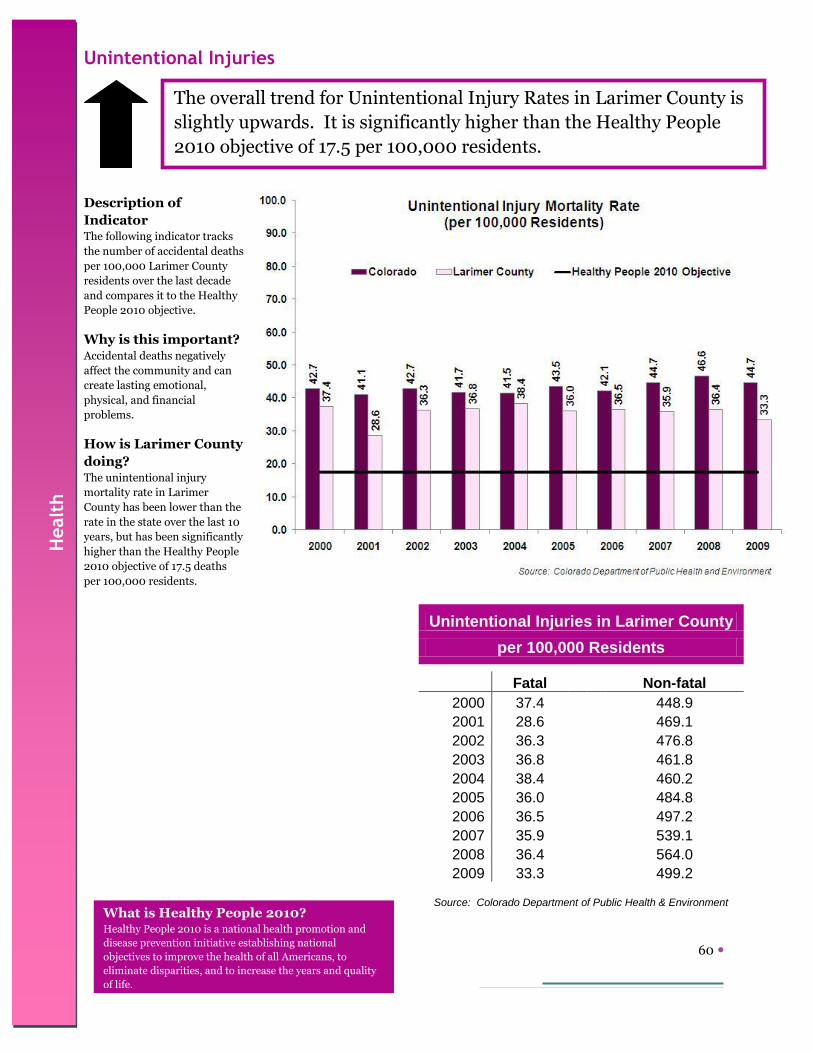
60
Unintentional Injuries
Description of
Indicator The following indicator tracks
the number of accidental deaths
per 100,000 Larimer County
residents over the last decade
and compares it to the Healthy
People 2010 objective.
Why is this important? Accidental deaths negatively
affect the community and can
create lasting emotional,
physical, and financial
problems.
How is Larimer County
doing? The unintentional injury
mortality rate in Larimer
County has been lower than the
rate in the state over the last 10
years, but has been significantly
higher than the Healthy People
2010 objective of 17.5 deaths
per 100,000 residents.
Unintentional Injuries in Larimer County
per 100,000 Residents
Fatal Non-fatal
2000 37.4
448.9
2001 28.6
469.1
2002 36.3
476.8
2003 36.8
461.8
2004 38.4
460.2
2005 36.0
484.8
2006 36.5
497.2
2007 35.9
539.1
2008 36.4
564.0
2009 33.3
499.2
Source: Colorado Department of Public Health & Environment
The overall trend for Unintentional Injury Rates in Larimer County is
slightly upwards. It is significantly higher than the Healthy People
2010 objective of 17.5 per 100,000 residents.
Healt
h
What is Healthy People 2010? Healthy People 2010 is a national health promotion and
disease prevention initiative establishing national
objectives to improve the health of all Americans, to
eliminate disparities, and to increase the years and quality
of life.

61
Key Findings
Less solid waste is entering the Larimer County landfill and more waste is being recycled.
Air quality (fine particulate) is good and has met the EPA standard since 2002.
60% of land in Larimer County is held for government/public use, compared to 10% for housing.
Natural Resources

62
Water Quality
Description of Indicator Precipitation acidity (pH) is considered normal when it
falls between 4.5 and 5.6 with an average value of 5.0.
(The lower the reading, the more acidic the moisture.)
The burning of coal and fossil fuels is often associated with
acid rain.
Why is this important? Acidic precipitation or “Acid Rain” is known to negatively
affect soil quality, aquatic life and vegetation.
How is Larimer County doing? Acid pH levels recorded in Rocky Mountain National Park
have ranged from a low of 5.0 in 2000 to a high of 5.4 in
2007 and 2009. These levels are well within the normal
range given above.
Precipitation
Annual precipitation amounts varied widely in Larimer
County over the past two decades. The driest year in Fort
Collins occurred in 2002 (9.2”) compared to the wettest
year when 25.2” fell (1997). Loveland‟s wettest year was
also 1997 when 20.0” of precipitation was recorded,
compared to the driest year when only 8.8” of precipitation
fell in 2000.
Over the last 20 years, the average precipitation level
recorded in Fort Collins was 16.2”, compared to 15.0” in
Loveland.
Natu
ral R
eso
urc
es
Over the last decade, acid pH levels in moisture at Rocky Mountain
National Park have been within the normal range of between 4.5
and 5.6. Over the last two decades, annual rainfall has varied
between a low of 8.8” in 2000 (Loveland) and a high of 25.2” in
1997 (Fort Collins).

63
Air Quality
Description of Indicators The following indicators look at the air
quality in Larimer County. PM2.5 measures
fine particulates (those 2.5 micrometers or
smaller) suspended in the air and is
measured at 251 Edison Drive in Fort
Collins. Readings that fall at the 98th
percentile and higher are selected and
averaged over a 3-year period.
Why is this important? According to the EPA, health studies have
shown an association between exposure to
fine particulates and an increase in death
from heart and lung disease.
How is Larimer County doing? Since 2002, Larimer County‟s air quality
has exceeded EPA standards for fine
particulates.
Air Quality PM2.5 Monitoring Results
2002-04 2003-05 2004-06 2005-07 2006-08 2007-09 2008-10
24-hr. 98th Percentile in
Micrograms/Cubic Meter (3-year averages) 20 20 22 22 23 22 22
EPA Standard 65 65 65 * * 35 35
*Standard dropped from 65 to 35 in 2007
Source: EPA
Natu
ral R
eso
urc
es
Air quality in Larimer County has improved over the last decade with
less toxic materials being disposed of or released into the
environment and fine particulate levels (PM2.5) measuring below the
EPA standard.

64
Managed Waste
Description of Indicators The following indicators look at the amount of
waste entering the Larimer County landfill:
hazardous, solid, and recycled.
Why is this important? Diverting recyclables and yard waste reduces
the amount of solid waste entering the landfill.
This, in turn, extends the life of the landfill
and reduces the need for expensive
alternatives while reducing the environmental
impact. Removing household hazardous
waste from the waste stream also helps
protect public health and the environment.
How is Larimer County doing? Over the last decade, an average of 902 tons of
hazardous waste has been collected at the
Larimer County landfill each year. Over this
same time period, there has been a 35%
increase in the amount of recycled waste
diverted from the landfill and a 31% reduction in
the amount of solid waste added to the landfill.
Natu
ral R
eso
urc
es
The overall trend for solid waste entering the landfill is de-
clining, whereas more waste is being recycled.

65
Land Use/Conservation
Description of Indicators The following indicators look at the
distribution of land use in Larimer
County and the number of acres
devoted to open space.
Why is this important? Many quality of life issues are affected
by land use, such as air and water
quality, biodiversity, degradation of
infrastructure, traffic congestion, and
the ability to attract and retain
businesses paying a living wage.
As more land is devoted to
development, demands increase for
services such as wastewater treatment,
energy production, schools, etc.
How is Larimer County
doing? Larimer County is the state‟s seventh
most
populous county and the ninth largest
county by area.
In 2009, nearly 60% of land in Larimer County
was owned by the government or
devoted to public use and not available
for development. An additional 10%
was devoted to housing.
With only 3.2% of the county‟s land
available for development, it‟s likely
some of the nearly 25% of land being
used for agriculture will be used for
development sometime in the future.
In 1996, voters in Larimer County
approved a ¼¢ open space sales and
use tax that has raised $114 million
through 2009. The tax continues
through 2018, and is not imposed on
food or prescription drugs.
As of 2010, the Larimer County Open
Lands program has acquired 44,633
acres or nearly 70 square miles.
Natu
ral R
eso
urc
es
The number of acres acquired by the Open Lands program in
Larimer County has increased 266% since 2000.

66

67
Key Findings
The overall crime rate in Larimer County decreased 16.4% between 2000 and 2009.
Between 2005 and 2009, the average juvenile arrest rate was 77.1 arrests per 1,000 youths.
The number of Larimer County offenders participating in alternative sentencing increased 41% between 2001
and 2010. In 2010, the majority of those offenders (58.6%) were sentenced to community service.
Over the last decade, Larimer County exceeded the Health People 2010 objective of 4.0 alcohol-related
fatalities per 100,000 residents in all but 2 years (2001 and 2003).
Public Safety

68
Crime Rate
Description of Indicator The following indicator looks at the number of violent and property crimes committed in Larimer County per 1,000 residents.
Why is this important? The crime rate can have both a perceived and real affect on community safety and can have a negative effect on business
investment if the rate is considered too high.
How is Larimer County doing? The overall crime rate has decreased 16.4% between 2000 and 2009. Property crimes have decreased nearly 20% over that
time, whereas violent crimes have averaged 10.7 per 1,000 residents.
Public S
afe
ty
The crime rate has been steadily decreasing over the past
decade.

69
In 3 of the last 5 years shown, the
juvenile arrest rate has been lower than
the 5-year average of 77.1 arrests per
1,000 youth.
In 2008-09 and 2009-10, Larimer
County schools had a lower expulsion
rate (1.8 per 1,000) than the statewide
average of 2.6 per 1,000.
Juvenile Crime
Description of Indicators The following indicators look at the number of
juveniles arrested per 1,000 youth ages 10 to 17 and
the number of students expelled from school per
1,000 student enrollment.
Why is this important? Although juvenile arrests constitute a small
percentage of overall arrests, criminal justice experts
believe early intervention of at-risk youths will often
reduce criminal activity in their adulthood.
How is Larimer County doing?
School Crime
Students are often expelled from school for violent or dangerous behavior, or for drug or firearm violations on school property. Since the shootings at Columbine HS in 1999, schools have adopted a zero tolerance policy.
Expulsions per 1,000 Enrolled Students
in Larimer County Schools
2004-05 1.3
2005-06 1.7
2006-07 2.6
2007-08 1.9
2008-09 1.8
Source: Colorado Department of Education
Public
Safe
ty
Between 2005 and 2009, the overall trend in the juvenile arrest rate
has been upward. More data are needed to determine if this trend will
persist.

70
Detention Center
Description of Indicators The following indicators look at the breakdown of
detainees by age group and the breakdown of
offenders participating in alternative sentencing
programs.
Why is this important? The Larimer County Detention Center has been
operating at capacity since 2003 making it
necessary to question who should be incarcerated
and who should participate in alternative
sentencing.
How is Larimer County doing? In 2010, 77% of those incarcerated in the Larimer
County Detention Center were 40 years old or
younger.
Offenders convicted of nonviolent crimes are often
sentenced to one of four alternative sentences:
workender, work release, home detention or
community service. Offenders sentenced to
community service or home detention are not
housed in the Detention Center. In 2010, nearly 60%
of offenders receiving alternative sentences participated
in the community service program.
Public S
afe
ty
Although the Detention Center has been operating at capacity since
January 2003, the total number of offenders participating in
alternative sentencing has increased from 4,781 in 2001 to 6,720 in
2010.

71
Impaired Driving
Description of Indicator The following indicator looks at the rate of motor vehicle fatalities related to alcohol and compares it to the Healthy People 2010
objective.
Why is this important? According to the National Highway Traffic Safety Administration (NHTSA) in 2008, an average of one alcohol-impaired driving fatality
occurred every 45 minutes. It is also estimated that the average alcohol-related traffic fatality in the United States costs $3.5 million:
$1.1 million in monetary costs and $2.4 million in quality of life losses.
How is Larimer County doing? Larimer County has exceeded the Healthy People 2010 objective of 4.0 alcohol-related fatalities per 100,000 residents in 8 of the last
10 years.
Public
Safe
ty
The number of alcohol-related motor vehicle fatalities has been
declining. Since 2004, the rate has met the Healthy People 2010
objective of 4.0 alcohol-related fatalities per 100,000 residents.
What is Healthy People 2010? Healthy People 2010 is a national health promotion and
disease prevention initiative establishing national
objectives to improve the health of all Americans, to
eliminate disparities, and to increase the years and quality
of life.

72

73
Key Findings
In 2009, approximately 80% of Larimer County workers spent less than 30 minutes getting to work and
roughly 74% did not carpool.
Since 2000, the number of workers in Larimer County working from home increased 40%.
Public transit use has steadily increased since 2001, especially as fuel prices have increased.
For 3 of the last 10 years, the motor vehicle mortality rate in Larimer County has met the Healthy People 2010
objective of 9.2 deaths per 100,000 residents.
Travel & Transportation

74
Commuting
Description of Indicators The following indicators look at how long it
takes to commute to and from work and the
number of commuters who carpool or work
from home.
Why is this important? Congestion on the roads is often cited as
contributing to a lower quality of life in a
community. In addition, the fewer people who
carpool or use an alternative means of
transportation, the greater the likelihood of air
pollution and damage to street pavement.
How is Larimer County doing? Since 2000, the percentage of commuters with
commute times 60 minutes or longer has
decreased by 50% and the percentage of
commuters with commute times less than 30
minutes has increased slightly.
Nearly two-thirds of commuters in Larimer
County (74%) did not carpool in 2009; the
percentage of commuters who did carpool has
increased 43% since 2000, and the percentage
working from home increased 40%.
Tra
vel &
Tra
nsp
ort
ati
on
The percentage of Larimer County commuters with commute times
over 30 minutes has been declining since 2000 and more workers are
working from home.
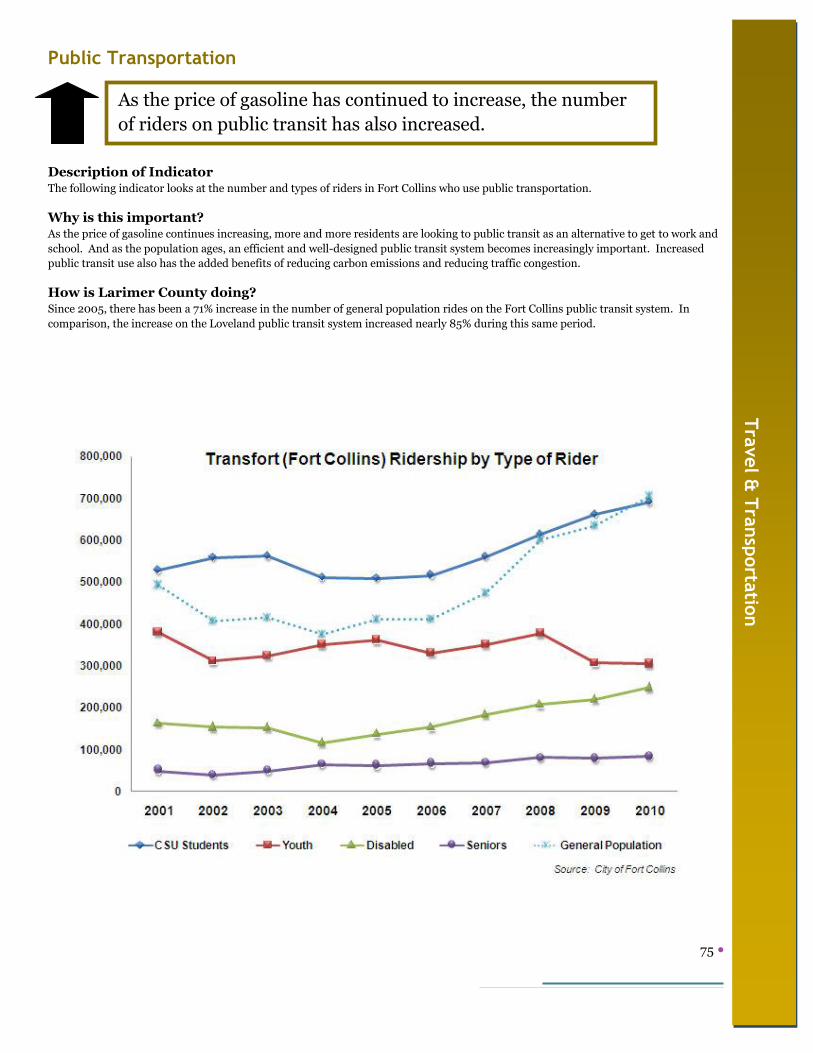
75
Public Transportation
Description of Indicator The following indicator looks at the number and types of riders in Fort Collins who use public transportation.
Why is this important? As the price of gasoline continues increasing, more and more residents are looking to public transit as an alternative to get to work and
school. And as the population ages, an efficient and well-designed public transit system becomes increasingly important. Increased
public transit use also has the added benefits of reducing carbon emissions and reducing traffic congestion.
How is Larimer County doing? Since 2005, there has been a 71% increase in the number of general population rides on the Fort Collins public transit system. In
comparison, the increase on the Loveland public transit system increased nearly 85% during this same period.
Tra
vel &
Tra
nsp
orta
tion
As the price of gasoline has continued to increase, the number
of riders on public transit has also increased.

76
Motor Vehicle Mortality Rates
Description of Indicator The motor vehicle mortality rate represents the number of deaths caused by motor vehicle accidents per 100,000 residents. A
rate is used in order to compare from year-to-year in relation to a changing population.
Why is this important? According to the Centers for Disease Control, motor vehicle injury prevention was named as a public health issue that is a
“winnable battle.” In the United States, motor vehicle–related injuries are the leading cause of death for people ages 1–34, and
nearly 5 million people sustain injuries that require an emergency room visit.
How is Larimer County doing? After peaking in 2003 at 17.1 deaths per 100,000 residents, the rate dropped significantly the following year to 10.9 per 100,000
residents and has been below the Healthy People 2010 target of 9.2 deaths per 100,000 since 2007.
Tra
vel &
Tra
nsp
ort
ati
on
The motor vehicle mortality rate has been trending downwards.
Since 2007, the rate in Larimer County has been below the Healthy
People 2010 objective of 9.2 per 100,000 residents.
What is Healthy People 2010? Healthy People 2010 is a national health promotion and
disease prevention initiative establishing national
objectives to improve the health of all Americans, to
eliminate disparities, and to increase the years and quality
of life.