Large Scale Graph Analysis
71
Large Scale Graph Analysis Erik Saule HPC Lab Biomedical Informatics The Ohio State University February 19, 2013 UNC Charlotte Erik Saule Ohio State University, Biomedical Informatics HPC Lab http://bmi.osu.edu/hpc Large Scale Graph Analysis :: 1 / 39
Transcript of Large Scale Graph Analysis
Large Scale Graph Analysis
Erik Saule
HPC LabBiomedical Informatics
The Ohio State University
February 19, 2013UNC Charlotte
Erik SauleOhio State University, Biomedical Informatics
HPC Lab http://bmi.osu.edu/hpcLarge Scale Graph Analysis
:: 1 / 39

Outline
1 Introduction
2 theadvisorCitation Analysis for Document RecommendationA High Performance Computing ProblemResult Diversification
3 CentralityCompression and ShatteringStorage format for GPU accelerationIncremental Algorithms
4 Data Management
5 Conclusion
Erik SauleOhio State University, Biomedical Informatics
HPC Lab http://bmi.osu.edu/hpcLarge Scale Graph Analysis
:: 2 / 39
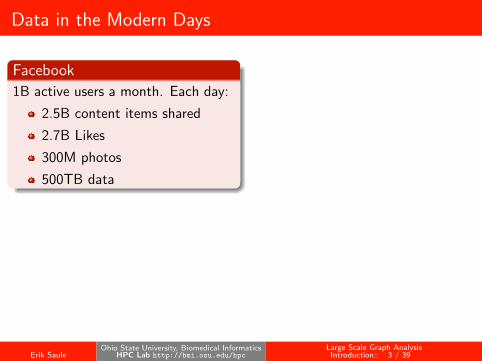
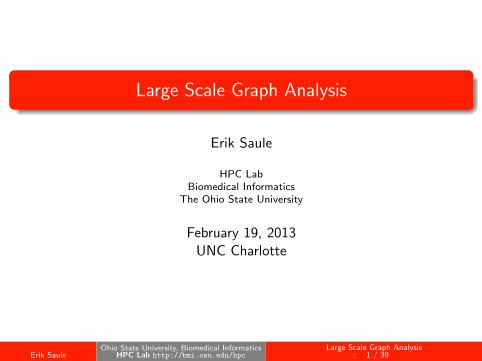
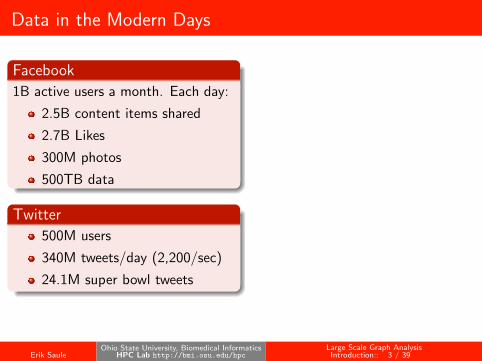
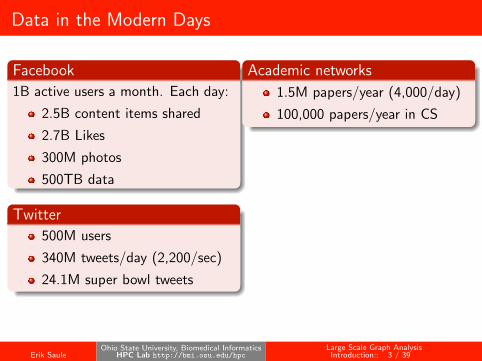
Data in the Modern Days
1B active users a month. Each day:
2.5B content items shared
2.7B Likes
300M photos
500TB data
500M users
340M tweets/day (2,200/sec)
24.1M super bowl tweets
Academic networks
1.5M papers/year (4,000/day)
100,000 papers/year in CS
Transportation
10M trips in Paris publictransportation/day
2.5M registered vehicles in LA
1.2M used for commuting/day
Compositing
Problems can also come frommultiple sources, e.g., identifycoauthors in Facebook.
Erik SauleOhio State University, Biomedical Informatics
HPC Lab http://bmi.osu.edu/hpcLarge Scale Graph Analysis
Introduction:: 3 / 39
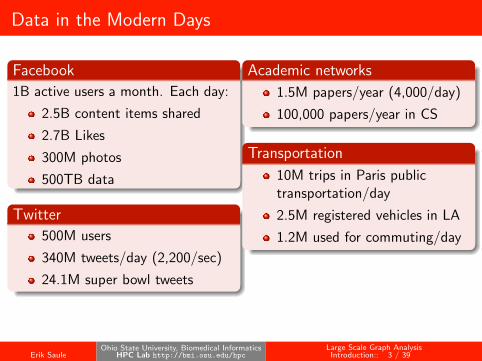
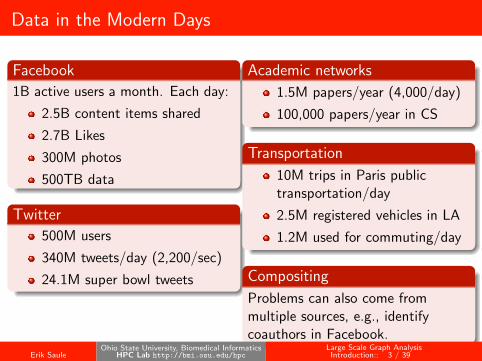
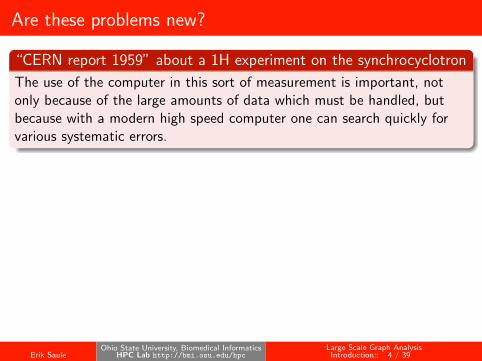
Are these problems new?
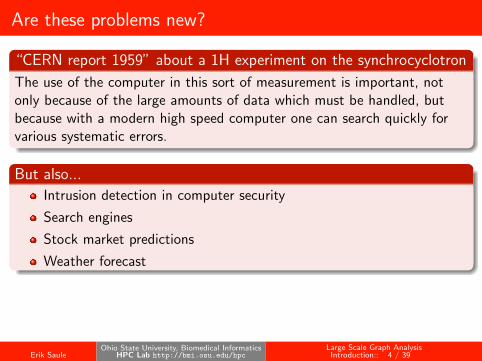
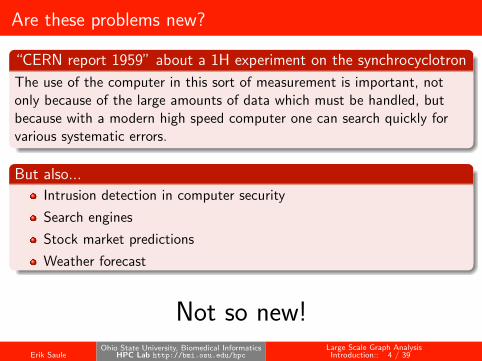
“CERN report 1959” about a 1H experiment on the synchrocyclotron
The use of the computer in this sort of measurement is important, notonly because of the large amounts of data which must be handled, butbecause with a modern high speed computer one can search quickly forvarious systematic errors.
But also...
Intrusion detection in computer security
Search engines
Stock market predictions
Weather forecast
Not so new!
Erik SauleOhio State University, Biomedical Informatics
HPC Lab http://bmi.osu.edu/hpcLarge Scale Graph Analysis
Introduction:: 4 / 39
Are these problems new?
“CERN report 1959” about a 1H experiment on the synchrocyclotron
The use of the computer in this sort of measurement is important, notonly because of the large amounts of data which must be handled, butbecause with a modern high speed computer one can search quickly forvarious systematic errors.
But also...
Intrusion detection in computer security
Search engines
Stock market predictions
Weather forecast
Not so new!
Erik SauleOhio State University, Biomedical Informatics
HPC Lab http://bmi.osu.edu/hpcLarge Scale Graph Analysis
Introduction:: 4 / 39
So why is it important now?
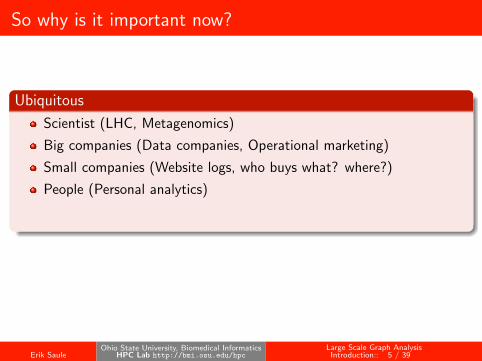
Ubiquitous
Scientist (LHC, Metagenomics)
Big companies (Data companies, Operational marketing)
Small companies (Website logs, who buys what? where?)
People (Personal analytics)
In brief, everybody has Big Data problems now!
None of these data can be manually analyzed. Automatic analysis ismandatory.
Erik SauleOhio State University, Biomedical Informatics
HPC Lab http://bmi.osu.edu/hpcLarge Scale Graph Analysis
Introduction:: 5 / 39

So why is it important now?
Ubiquitous
Scientist (LHC, Metagenomics)
Big companies (Data companies, Operational marketing)
Small companies (Website logs, who buys what? where?)
People (Personal analytics)
In brief, everybody has Big Data problems now!
None of these data can be manually analyzed. Automatic analysis ismandatory.
Erik SauleOhio State University, Biomedical Informatics
HPC Lab http://bmi.osu.edu/hpcLarge Scale Graph Analysis
Introduction:: 5 / 39

The Three Attributes of Big Data
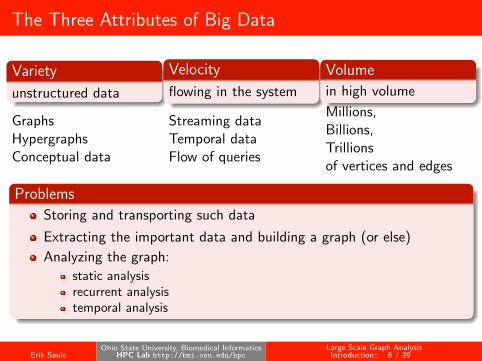
Variety
unstructured data
Velocity
flowing in the system
Volume
in high volume
GraphsHypergraphsConceptual data
Streaming dataTemporal dataFlow of queries
Millions,Billions,Trillionsof vertices and edges
Problems
Storing and transporting such data
Extracting the important data and building a graph (or else)
Analyzing the graph:
static analysisrecurrent analysistemporal analysis
Erik SauleOhio State University, Biomedical Informatics
HPC Lab http://bmi.osu.edu/hpcLarge Scale Graph Analysis
Introduction:: 6 / 39

The Three Attributes of Big Data
Variety
unstructured data
Velocity
flowing in the system
Volume
in high volume
GraphsHypergraphsConceptual data
Streaming dataTemporal dataFlow of queries
Millions,Billions,Trillionsof vertices and edges
Problems
Storing and transporting such data
Extracting the important data and building a graph (or else)
Analyzing the graph:
static analysisrecurrent analysistemporal analysis
Erik SauleOhio State University, Biomedical Informatics
HPC Lab http://bmi.osu.edu/hpcLarge Scale Graph Analysis
Introduction:: 6 / 39

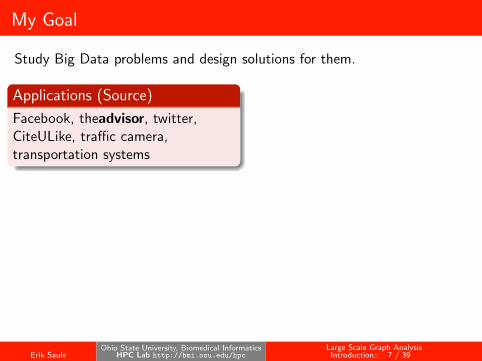
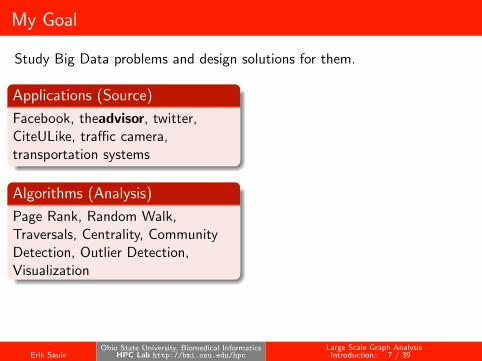
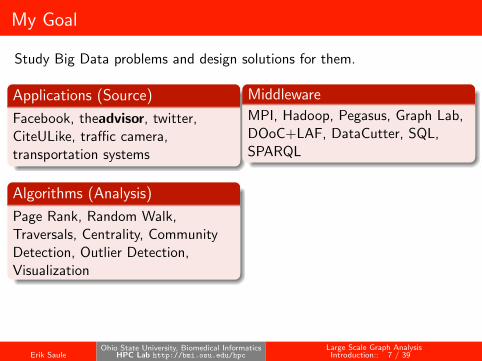
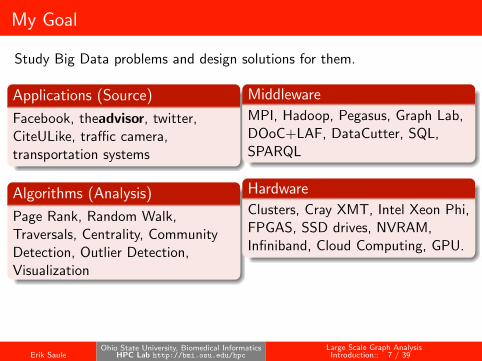
My Goal
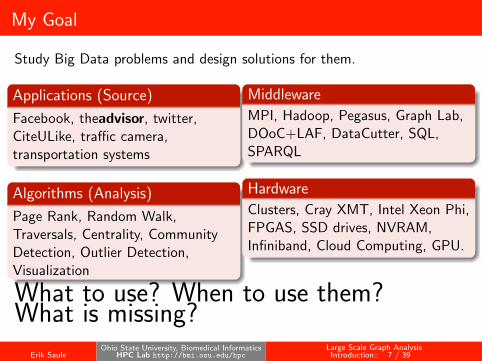
Study Big Data problems and design solutions for them.
Applications (Source)
Facebook, theadvisor, twitter,CiteULike, traffic camera,transportation systems
Algorithms (Analysis)
Page Rank, Random Walk,Traversals, Centrality, CommunityDetection, Outlier Detection,Visualization
Middleware
MPI, Hadoop, Pegasus, Graph Lab,DOoC+LAF, DataCutter, SQL,SPARQL
Hardware
Clusters, Cray XMT, Intel Xeon Phi,FPGAS, SSD drives, NVRAM,Infiniband, Cloud Computing, GPU.
What to use? When to use them?What is missing?
Erik SauleOhio State University, Biomedical Informatics
HPC Lab http://bmi.osu.edu/hpcLarge Scale Graph Analysis
Introduction:: 7 / 39
My Goal
Study Big Data problems and design solutions for them.
Applications (Source)
Facebook, theadvisor, twitter,CiteULike, traffic camera,transportation systems
Algorithms (Analysis)
Page Rank, Random Walk,Traversals, Centrality, CommunityDetection, Outlier Detection,Visualization
Middleware
MPI, Hadoop, Pegasus, Graph Lab,DOoC+LAF, DataCutter, SQL,SPARQL
Hardware
Clusters, Cray XMT, Intel Xeon Phi,FPGAS, SSD drives, NVRAM,Infiniband, Cloud Computing, GPU.
What to use? When to use them?What is missing?
Erik SauleOhio State University, Biomedical Informatics
HPC Lab http://bmi.osu.edu/hpcLarge Scale Graph Analysis
Introduction:: 7 / 39

Outline
1 Introduction
2 theadvisorCitation Analysis for Document RecommendationA High Performance Computing ProblemResult Diversification
3 CentralityCompression and ShatteringStorage format for GPU accelerationIncremental Algorithms
4 Data Management
5 Conclusion
Erik SauleOhio State University, Biomedical Informatics
HPC Lab http://bmi.osu.edu/hpcLarge Scale Graph Analysis
theadvisor:: 8 / 39

A Use Case
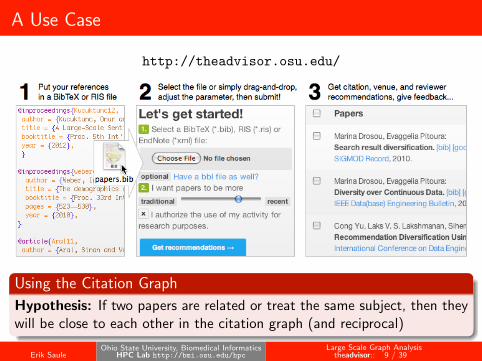
http://theadvisor.osu.edu/
Using the Citation Graph
Hypothesis: If two papers are related or treat the same subject, then theywill be close to each other in the citation graph (and reciprocal)
Erik SauleOhio State University, Biomedical Informatics
HPC Lab http://bmi.osu.edu/hpcLarge Scale Graph Analysis
theadvisor:: 9 / 39
A Use Case
http://theadvisor.osu.edu/
Using the Citation Graph
Hypothesis: If two papers are related or treat the same subject, then theywill be close to each other in the citation graph (and reciprocal)
Erik SauleOhio State University, Biomedical Informatics
HPC Lab http://bmi.osu.edu/hpcLarge Scale Graph Analysis
theadvisor:: 9 / 39
Global Approches: PageRank
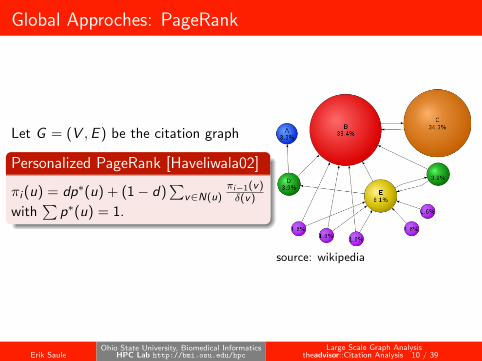
Let G = (V ,E ) be the citation graph
Personalized PageRank [Haveliwala02]
πi (u) = dp∗(u) + (1− d)∑
v∈N(u)πi−1(v)δ(v)
with∑
p∗(u) = 1.
source: wikipedia
Erik SauleOhio State University, Biomedical Informatics
HPC Lab http://bmi.osu.edu/hpcLarge Scale Graph Analysis
theadvisor::Citation Analysis 10 / 39

Direction Awareness [DBRank12]
Time exploration
What if we are interested in searching papers per years. Recent papers?Traditional papers?
Let Q be a set of known relevant papers.
Direction Aware Random Walk with Restart
πi (u) = dp∗(u) + (1− d)(κ∑
v∈N+(u)πi−1(v)δ−(v) + (1− κ)
∑v∈N−(u)
πi−1(v)δ+(v) )
d ∈ (0 : 1) is the damping factor.
κ ∈ (0 : 1).
p∗(u) = 1|Q| , if u ∈ Q, p∗(u) = 0, otherwise
a b c d
restartedge
reference edge back-reference(citation) edgev
d (1-κ)δ+(v)
d κδ-(v)
(1-d)m
qm
Erik SauleOhio State University, Biomedical Informatics
HPC Lab http://bmi.osu.edu/hpcLarge Scale Graph Analysis
theadvisor::Citation Analysis 11 / 39

Analysis: Time and Accuracy
0 0.2 0.4 0.6 0.8 1κ
0.1 0.2 0.3 0.4 0.5 0.6 0.7 0.8 0.9
1
d
1980
1985
1990
1995
2000
2005
2010
aver
age
publ
icat
ion
year
hide random hide recent hide earliermean interval mean interval mean interval
DaRWR 48.00 46.80 49.20 42.22 40.95 43.50 60.64 59.48 61.80P.R. 56.56 55.31 57.80 38.75 37.50 40.00 58.93 57.76 60.10Katzβ 46.33 45.16 47.50 34.56 33.42 35.70 44.19 42.97 45.40Cocit 44.60 43.39 45.80 14.22 13.25 15.20 55.97 54.64 57.30Cocoup 17.28 16.36 18.20 17.56 16.61 18.50 2.93 2.57 3.30CCIDF 18.05 17.11 19.00 18.97 17.94 20.00 3.55 3.10 4.00
Erik SauleOhio State University, Biomedical Informatics
HPC Lab http://bmi.osu.edu/hpcLarge Scale Graph Analysis
theadvisor::Citation Analysis 12 / 39

A Sparse Matrix-Vector Multiplication (SpMV)
Rewriting DaRWR
πi (u) = dp∗(u) + (1− d)
κ∑
v∈N+(u)
πi−1(v)
δ−(v)+ (1− κ)
∑v∈N−(u)
πi−1(v)
δ+(v)
πi (u) = dp∗(u) +
∑v∈N+(u)
(1− d)κ
δ−(v)πi−1(v) +
∑v∈N−(u)
(1− d)(1− κ)
δ+(v)πi−1(v)
πi = dp∗ + A−πi−1 + A+πi−1
πi = dp∗ + Aπi−1 (CRS Full)
πi = dp∗ + B−(
(1− d)κ
δ−πi−1
)+ B+
((1− d)(1− κ)
δ+πi−1
)(CRS Half)
Erik SauleOhio State University, Biomedical Informatics
HPC Lab http://bmi.osu.edu/hpcLarge Scale Graph Analysis
theadvisor::A HPC computing problem 13 / 39

Partitioning and Ordering
Erik SauleOhio State University, Biomedical Informatics
HPC Lab http://bmi.osu.edu/hpcLarge Scale Graph Analysis
theadvisor::A HPC computing problem 14 / 39
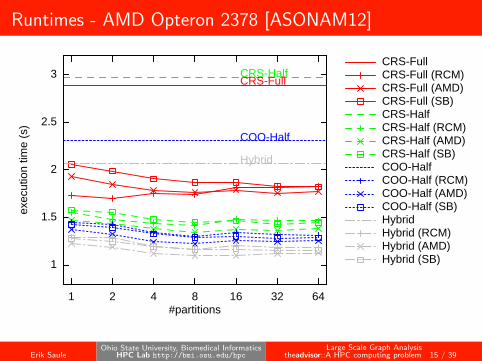
Runtimes - AMD Opteron 2378 [ASONAM12]
1
1.5
2
2.5
3
1 2 4 8 16 32 64
exec
utio
n tim
e (s
)
#partitions
CRS-FullCRS-Full (RCM)CRS-Full (AMD)CRS-Full (SB)CRS-HalfCRS-Half (RCM)CRS-Half (AMD)CRS-Half (SB)COO-HalfCOO-Half (RCM)COO-Half (AMD)COO-Half (SB)HybridHybrid (RCM)Hybrid (AMD)Hybrid (SB) 1
1.5
2
2.5
3
1 2 4 8 16 32 64
exec
utio
n tim
e (s
)
#partitions
CRS-FullCRS-Full (RCM)CRS-Full (AMD)CRS-Full (SB)CRS-HalfCRS-Half (RCM)CRS-Half (AMD)CRS-Half (SB)COO-HalfCOO-Half (RCM)COO-Half (AMD)COO-Half (SB)HybridHybrid (RCM)Hybrid (AMD)Hybrid (SB)
CRS-FullCRS-Half
COO-Half
Hybrid
Erik SauleOhio State University, Biomedical Informatics
HPC Lab http://bmi.osu.edu/hpcLarge Scale Graph Analysis
theadvisor::A HPC computing problem 15 / 39

Diversification: Principle
Erik SauleOhio State University, Biomedical Informatics
HPC Lab http://bmi.osu.edu/hpcLarge Scale Graph Analysis
theadvisor::Result Diversification 16 / 39
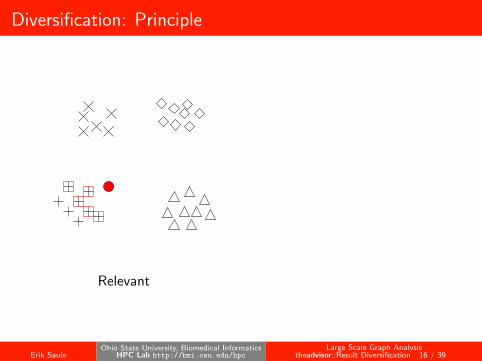
Diversification: Principle
Relevant
Erik SauleOhio State University, Biomedical Informatics
HPC Lab http://bmi.osu.edu/hpcLarge Scale Graph Analysis
theadvisor::Result Diversification 16 / 39

Diversification: Principle
Relevant Relevant Diverse
Erik SauleOhio State University, Biomedical Informatics
HPC Lab http://bmi.osu.edu/hpcLarge Scale Graph Analysis
theadvisor::Result Diversification 16 / 39
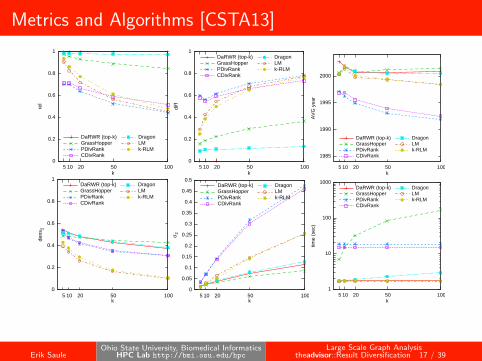
Metrics and Algorithms [CSTA13]
0
0.2
0.4
0.6
0.8
1
5 10 20 50 100
rel
k
DaRWR (top-k)GrassHopperPDivRankCDivRank
DragonLMk-RLM
0
0.2
0.4
0.6
0.8
1
5 10 20 50 100di
ffk
DaRWR (top-k)GrassHopperPDivRankCDivRank
DragonLMk-RLM
1985
1990
1995
2000
5 10 20 50 100
AVG
yea
r
k
DaRWR (top-k)GrassHopperPDivRankCDivRank
DragonLMk-RLM
0
0.2
0.4
0.6
0.8
1
5 10 20 50 100
dens
2
k
DaRWR (top-k)GrassHopperPDivRankCDivRank
DragonLMk-RLM
0
0.05
0.1
0.15
0.2
0.25
0.3
0.35
0.4
0.45
0.5
5 10 20 50 100
σ 2
k
DaRWR (top-k)GrassHopperPDivRankCDivRank
DragonLMk-RLM
1
10
100
1000
5 10 20 50 100
time
(sec
)
k
DaRWR (top-k)GrassHopperPDivRankCDivRank
DragonLMk-RLM
k-RLM is good.
Erik SauleOhio State University, Biomedical Informatics
HPC Lab http://bmi.osu.edu/hpcLarge Scale Graph Analysis
theadvisor::Result Diversification 17 / 39
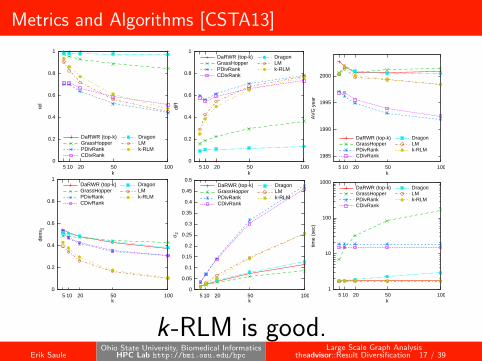
Metrics and Algorithms [CSTA13]
0
0.2
0.4
0.6
0.8
1
5 10 20 50 100
rel
k
DaRWR (top-k)GrassHopperPDivRankCDivRank
DragonLMk-RLM
0
0.2
0.4
0.6
0.8
1
5 10 20 50 100di
ffk
DaRWR (top-k)GrassHopperPDivRankCDivRank
DragonLMk-RLM
1985
1990
1995
2000
5 10 20 50 100
AVG
yea
r
k
DaRWR (top-k)GrassHopperPDivRankCDivRank
DragonLMk-RLM
0
0.2
0.4
0.6
0.8
1
5 10 20 50 100
dens
2
k
DaRWR (top-k)GrassHopperPDivRankCDivRank
DragonLMk-RLM
0
0.05
0.1
0.15
0.2
0.25
0.3
0.35
0.4
0.45
0.5
5 10 20 50 100
σ 2
k
DaRWR (top-k)GrassHopperPDivRankCDivRank
DragonLMk-RLM
1
10
100
1000
5 10 20 50 100
time
(sec
)
k
DaRWR (top-k)GrassHopperPDivRankCDivRank
DragonLMk-RLM
k-RLM is good.Erik Saule
Ohio State University, Biomedical InformaticsHPC Lab http://bmi.osu.edu/hpc
Large Scale Graph Analysistheadvisor::Result Diversification 17 / 39
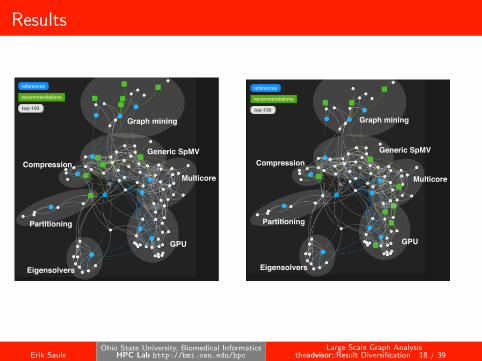
Results
GPU
Multicore
Generic SpMV
Eigensolvers
Partitioning
Compression
Graph mining
references
recommendations
top-100
Multicore
GPU
Multicore
Generic SpMV
Eigensolvers
Partitioning
Compression
Graph mining
references
recommendations
top-100
Erik SauleOhio State University, Biomedical Informatics
HPC Lab http://bmi.osu.edu/hpcLarge Scale Graph Analysis
theadvisor::Result Diversification 18 / 39

A Modelization problem [WWW13]
0
0.2
0.4
0.6
0.8
1
0 0.2 0.4 0.6 0.8 1
dens
2
rel
10-RLMBC1BC1VBC2BC2VBC1100BC11000BC150BC2100BC21000BC250CDivRankDRAGON
GRASSHOPPERGSPARSEIL1IL2LMPDivRankPRk-RLMtop-90%+randomtop-75%+randomtop-50%+randomtop-25%+randomAll Random
0
0.2
0.4
0.6
0.8
1
0 0.2 0.4 0.6 0.8 1
dens
2
rel
10-RLMBC1BC1VBC2BC2VBC1100BC11000BC150BC2100BC21000BC250CDivRankDRAGON
GRASSHOPPERGSPARSEIL1IL2LMPDivRankPRk-RLMtop-90%+randomtop-75%+randomtop-50%+randomtop-25%+randomAll Random
better
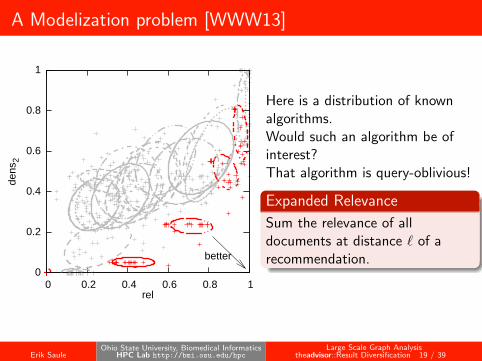
Here is a distribution of knownalgorithms.
Would such an algorithm be ofinterest?That algorithm is query-oblivious!
Expanded Relevance
Sum the relevance of alldocuments at distance ` of arecommendation.
Erik SauleOhio State University, Biomedical Informatics
HPC Lab http://bmi.osu.edu/hpcLarge Scale Graph Analysis
theadvisor::Result Diversification 19 / 39

A Modelization problem [WWW13]
0
0.2
0.4
0.6
0.8
1
0 0.2 0.4 0.6 0.8 1
dens
2
rel
10-RLMBC1BC1VBC2BC2VBC1100BC11000BC150BC2100BC21000BC250CDivRankDRAGON
GRASSHOPPERGSPARSEIL1IL2LMPDivRankPRk-RLMtop-90%+randomtop-75%+randomtop-50%+randomtop-25%+randomAll Random
0
0.2
0.4
0.6
0.8
1
0 0.2 0.4 0.6 0.8 1
dens
2
rel
10-RLMBC1BC1VBC2BC2VBC1100BC11000BC150BC2100BC21000BC250CDivRankDRAGON
GRASSHOPPERGSPARSEIL1IL2LMPDivRankPRk-RLMtop-90%+randomtop-75%+randomtop-50%+randomtop-25%+randomAll Random
better
Here is a distribution of knownalgorithms.Would such an algorithm be ofinterest?
That algorithm is query-oblivious!
Expanded Relevance
Sum the relevance of alldocuments at distance ` of arecommendation.
Erik SauleOhio State University, Biomedical Informatics
HPC Lab http://bmi.osu.edu/hpcLarge Scale Graph Analysis
theadvisor::Result Diversification 19 / 39
A Modelization problem [WWW13]
0
0.2
0.4
0.6
0.8
1
0 0.2 0.4 0.6 0.8 1
dens
2
rel
10-RLMBC1BC1VBC2BC2VBC1100BC11000BC150BC2100BC21000BC250CDivRankDRAGON
GRASSHOPPERGSPARSEIL1IL2LMPDivRankPRk-RLMtop-90%+randomtop-75%+randomtop-50%+randomtop-25%+randomAll Random
0
0.2
0.4
0.6
0.8
1
0 0.2 0.4 0.6 0.8 1
dens
2
rel
10-RLMBC1BC1VBC2BC2VBC1100BC11000BC150BC2100BC21000BC250CDivRankDRAGON
GRASSHOPPERGSPARSEIL1IL2LMPDivRankPRk-RLMtop-90%+randomtop-75%+randomtop-50%+randomtop-25%+randomAll Random
better
Here is a distribution of knownalgorithms.Would such an algorithm be ofinterest?That algorithm is query-oblivious!
Expanded Relevance
Sum the relevance of alldocuments at distance ` of arecommendation.
Erik SauleOhio State University, Biomedical Informatics
HPC Lab http://bmi.osu.edu/hpcLarge Scale Graph Analysis
theadvisor::Result Diversification 19 / 39
Outline
1 Introduction
2 theadvisorCitation Analysis for Document RecommendationA High Performance Computing ProblemResult Diversification
3 CentralityCompression and ShatteringStorage format for GPU accelerationIncremental Algorithms
4 Data Management
5 Conclusion
Erik SauleOhio State University, Biomedical Informatics
HPC Lab http://bmi.osu.edu/hpcLarge Scale Graph Analysis
Centrality:: 20 / 39
Centralities - Concept
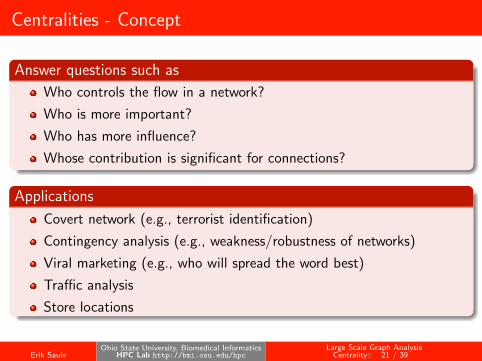
Answer questions such as
Who controls the flow in a network?
Who is more important?
Who has more influence?
Whose contribution is significant for connections?
Applications
Covert network (e.g., terrorist identification)
Contingency analysis (e.g., weakness/robustness of networks)
Viral marketing (e.g., who will spread the word best)
Traffic analysis
Store locations
Erik SauleOhio State University, Biomedical Informatics
HPC Lab http://bmi.osu.edu/hpcLarge Scale Graph Analysis
Centrality:: 21 / 39

Centralities - Definition
Let G = (V ,E ) be a graph with the vertex set V and edge set E .
closeness centrality: cc[v ] = 1far [v ] , where the farness is defined as
far [v ] =∑
u∈comp(v) d(u, v). d(u, v) is the shortest path lengthbetween u and v .
betweenness centrality: bc(v) =∑
s 6=v 6=t∈Vσst(v)σst
, where σst is thenumber shortest paths between s and t, and σst(v) is the number ofthem passing through v .
Both metrics care about the structure of the shortest path graph.Brandes algorithm computes the shortest path graph rooted in each vertexof the graph. O(|E |) per source. O(|V ||E |) in total.Believed to be asymptotically optimal [Kintali08].
Erik SauleOhio State University, Biomedical Informatics
HPC Lab http://bmi.osu.edu/hpcLarge Scale Graph Analysis
Centrality:: 22 / 39

Compression and Shattering
A B
A B
+|B|
+|A|
x2
Erik SauleOhio State University, Biomedical Informatics
HPC Lab http://bmi.osu.edu/hpcLarge Scale Graph Analysis
Centrality::Shattering 23 / 39

BADIOS [SDM2013]
0
0.2
0.4
0.6
0.8
1
1.2
1.4
Epinions Gowalla bcsstk32 NotreDame RoadPA Amazon0601 Google WikiTalk
Rela
tive t
ime
1Phase 1Phase 2Preproc
36m14m
1h38m1h
12m41s
2h17m
1d8h20h
12h10h
1d18h8h
5d5h16h
Erik SauleOhio State University, Biomedical Informatics
HPC Lab http://bmi.osu.edu/hpcLarge Scale Graph Analysis
Centrality::Shattering 24 / 39
Matrix Representations for GPUs
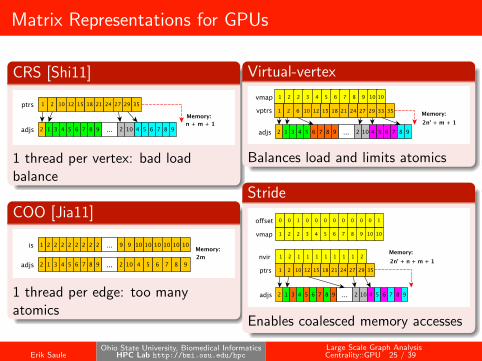
CRS [Shi11]
1 thread per vertex: bad loadbalance
COO [Jia11]
1 thread per edge: too manyatomics
Virtual-vertex
Balances load and limits atomics
Stride
Enables coalesced memory accesses
Erik SauleOhio State University, Biomedical Informatics
HPC Lab http://bmi.osu.edu/hpcLarge Scale Graph AnalysisCentrality::GPU 25 / 39
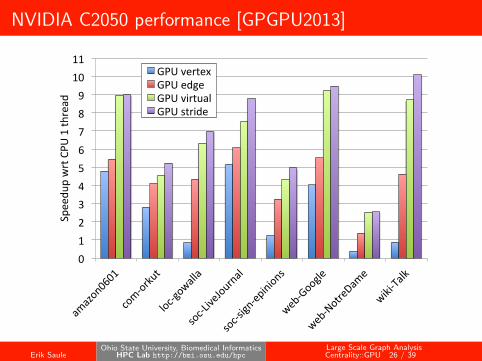
NVIDIA C2050 performance [GPGPU2013]
0 1 2 3 4 5 6 7 8 9 10 11
Speedu
p wrt CPU
1 th
read
GPU vertex GPU edge GPU virtual GPU stride
Erik SauleOhio State University, Biomedical Informatics
HPC Lab http://bmi.osu.edu/hpcLarge Scale Graph AnalysisCentrality::GPU 26 / 39
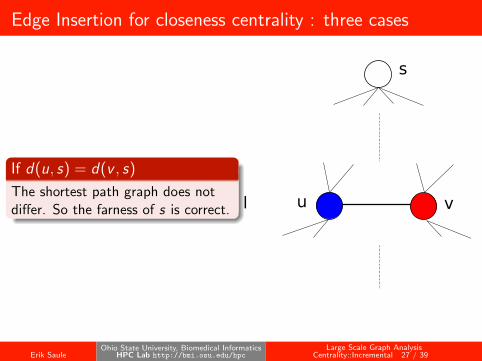
Edge Insertion for closeness centrality : three cases
If d(u, s) = d(v , s)
The shortest path graph does notdiffer. So the farness of s is correct.
s
u vl
Erik SauleOhio State University, Biomedical Informatics
HPC Lab http://bmi.osu.edu/hpcLarge Scale Graph Analysis
Centrality::Incremental 27 / 39

Edge Insertion for closeness centrality : three cases
If d(u, s) = d(v , s)
The shortest path graph does notdiffer. So the farness of s is correct.
If d(u, s) + 1 = d(v , s)
The shortest path graph differs byexactly one edge. The levels staythe same. So the farness of s is stillcorrect.
s
u
v
l
l+1
Erik SauleOhio State University, Biomedical Informatics
HPC Lab http://bmi.osu.edu/hpcLarge Scale Graph Analysis
Centrality::Incremental 27 / 39
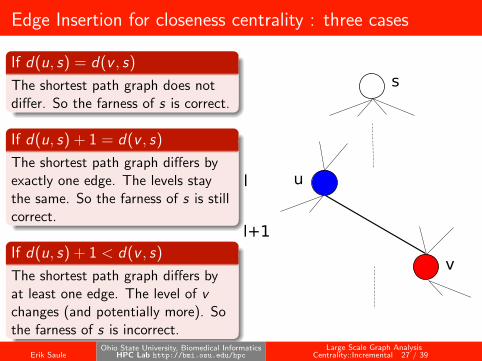
Edge Insertion for closeness centrality : three cases
If d(u, s) = d(v , s)
The shortest path graph does notdiffer. So the farness of s is correct.
If d(u, s) + 1 = d(v , s)
The shortest path graph differs byexactly one edge. The levels staythe same. So the farness of s is stillcorrect.
If d(u, s) + 1 < d(v , s)
The shortest path graph differs byat least one edge. The level of vchanges (and potentially more). Sothe farness of s is incorrect.
s
u
v
l
l+1
Erik SauleOhio State University, Biomedical Informatics
HPC Lab http://bmi.osu.edu/hpcLarge Scale Graph Analysis
Centrality::Incremental 27 / 39
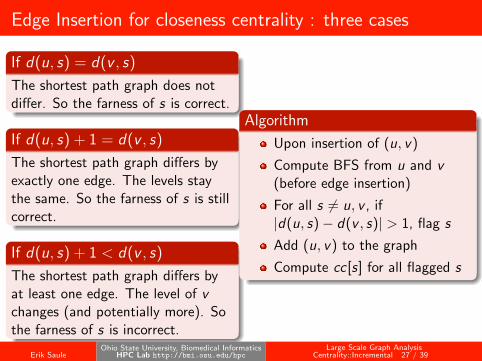
Edge Insertion for closeness centrality : three cases
If d(u, s) = d(v , s)
The shortest path graph does notdiffer. So the farness of s is correct.
If d(u, s) + 1 = d(v , s)
The shortest path graph differs byexactly one edge. The levels staythe same. So the farness of s is stillcorrect.
If d(u, s) + 1 < d(v , s)
The shortest path graph differs byat least one edge. The level of vchanges (and potentially more). Sothe farness of s is incorrect.
Algorithm
Upon insertion of (u, v)
Compute BFS from u and v(before edge insertion)
For all s 6= u, v , if|d(u, s)− d(v , s)| > 1, flag s
Add (u, v) to the graph
Compute cc[s] for all flagged s
Erik SauleOhio State University, Biomedical Informatics
HPC Lab http://bmi.osu.edu/hpcLarge Scale Graph Analysis
Centrality::Incremental 27 / 39

Results : Speedup
Graph CC-B CC-BL
soc-sign-epinions 3.0 37.8loc-gowalla edges 1.8 17.1bcsstk32 1.0 5,493.0web-NotreDame 4.9 23.9roadNet-PA 1.6 3.0amazon0601 1.2 27.6web-Google 3.0 26.6wiki-Talk 6.8 69.8
Geometric mean 2.39 43.58
Erik SauleOhio State University, Biomedical Informatics
HPC Lab http://bmi.osu.edu/hpcLarge Scale Graph Analysis
Centrality::Incremental 28 / 39
Outline
1 Introduction
2 theadvisorCitation Analysis for Document RecommendationA High Performance Computing ProblemResult Diversification
3 CentralityCompression and ShatteringStorage format for GPU accelerationIncremental Algorithms
4 Data Management
5 Conclusion
Erik SauleOhio State University, Biomedical Informatics
HPC Lab http://bmi.osu.edu/hpcLarge Scale Graph Analysis
Data Management:: 29 / 39
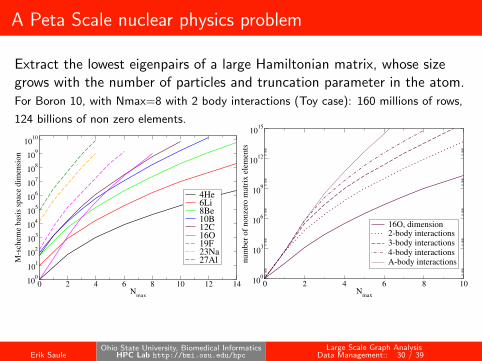
A Peta Scale nuclear physics problem
Extract the lowest eigenpairs of a large Hamiltonian matrix, whose sizegrows with the number of particles and truncation parameter in the atom.For Boron 10, with Nmax=8 with 2 body interactions (Toy case): 160 millions of rows,
124 billions of non zero elements.
0 2 4 6 8 10 12 14N
max
100
101
102
103
104
105
106
107
108
109
1010
M-s
chem
e b
asis
sp
ace
dim
ensi
on
4He6Li8Be10B12C16O19F23Na27Al
0 2 4 6 8 10N
max
100
103
106
109
1012
1015
nu
mb
er o
f n
on
zero
mat
rix
ele
men
ts
16O, dimension2-body interactions3-body interactions4-body interactionsA-body interactions
Two options: use a really large machine or use Out-of-Core (SSD).
Erik SauleOhio State University, Biomedical Informatics
HPC Lab http://bmi.osu.edu/hpcLarge Scale Graph Analysis
Data Management:: 30 / 39

DOoC+LAF
LAF
DOoC
Compute Node - 3
Storage Service
Data Chunks
Data Chunks
Data Chunks
SpMM
InData
OutData
InData
dot
InData
InData
OutDataLocal Scheduler
Exec
Compute Node - 2
Storage Service
Data Chunks
Data Chunks
Data Chunks
SpMM
InData
OutData
InData
dot
InData
InData
OutDataLocal Scheduler
Exec
LOBPCG End-User Code
…
SymSpMM(H, psi)dot(phiT, phi)
...
LOBPCG.cpp
Primitive Conversion
Compute Node - 1
Storage Service
Data Chunks
Data Chunks
Data Chunks
SpMM
InData
OutData
InData
dot
InData
InData
OutDataLocal Scheduler
Exec
Req Data
Global Task Graph Global Scheduler
Req Data
Req Data
Erik SauleOhio State University, Biomedical Informatics
HPC Lab http://bmi.osu.edu/hpcLarge Scale Graph Analysis
Data Management:: 31 / 39
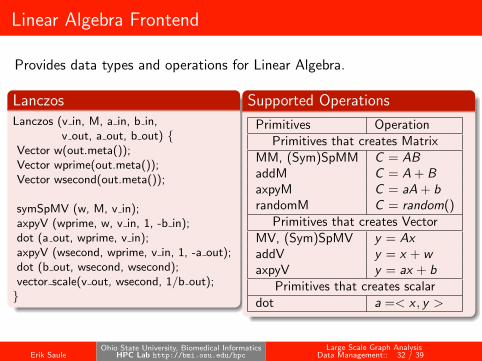
Linear Algebra Frontend
Provides data types and operations for Linear Algebra.
LanczosLanczos (v in, M, a in, b in,
v out, a out, b out) {Vector w(out.meta());Vector wprime(out.meta());Vector wsecond(out.meta());
symSpMV (w, M, v in);axpyV (wprime, w, v in, 1, -b in);dot (a out, wprime, v in);axpyV (wsecond, wprime, v in, 1, -a out);dot (b out, wsecond, wsecond);vector scale(v out, wsecond, 1/b out);}
Supported Operations
Primitives OperationPrimitives that creates Matrix
MM, (Sym)SpMM C = ABaddM C = A + BaxpyM C = aA + brandomM C = random()
Primitives that creates VectorMV, (Sym)SpMV y = AxaddV y = x + waxpyV y = ax + b
Primitives that creates scalardot a =< x , y >
Erik SauleOhio State University, Biomedical Informatics
HPC Lab http://bmi.osu.edu/hpcLarge Scale Graph Analysis
Data Management:: 32 / 39

5 Lanczos iterations at NERSC [Cluster12]
Erik SauleOhio State University, Biomedical Informatics
HPC Lab http://bmi.osu.edu/hpcLarge Scale Graph Analysis
Data Management:: 33 / 39
Outline
1 Introduction
2 theadvisorCitation Analysis for Document RecommendationA High Performance Computing ProblemResult Diversification
3 CentralityCompression and ShatteringStorage format for GPU accelerationIncremental Algorithms
4 Data Management
5 Conclusion
Erik SauleOhio State University, Biomedical Informatics
HPC Lab http://bmi.osu.edu/hpcLarge Scale Graph Analysis
Conclusion:: 34 / 39
Other things I do
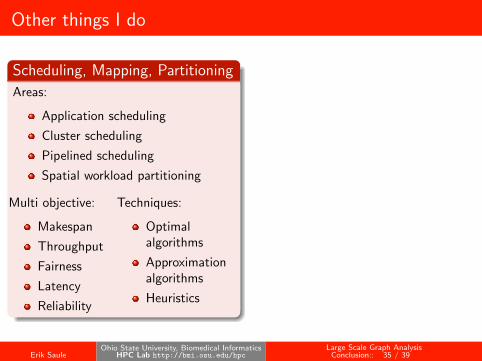
Scheduling, Mapping, Partitioning
Areas:
Application scheduling
Cluster scheduling
Pipelined scheduling
Spatial workload partitioning
Multi objective:
Makespan
Throughput
Fairness
Latency
Reliability
Techniques:
Optimalalgorithms
Approximationalgorithms
Heuristics
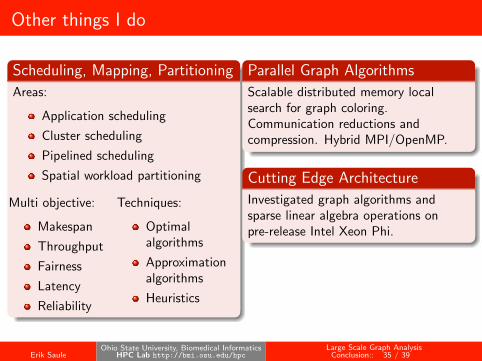
Parallel Graph Algorithms
Scalable distributed memory localsearch for graph coloring.Communication reductions andcompression. Hybrid MPI/OpenMP.
Cutting Edge Architecture
Investigated graph algorithms andsparse linear algebra operations onpre-release Intel Xeon Phi.
Dataflow middleware
Auto tuning component for spatialdivisible workload on heterogeneoussystems.
Erik SauleOhio State University, Biomedical Informatics
HPC Lab http://bmi.osu.edu/hpcLarge Scale Graph Analysis
Conclusion:: 35 / 39

Other things I do
Scheduling, Mapping, Partitioning
Areas:
Application scheduling
Cluster scheduling
Pipelined scheduling
Spatial workload partitioning
Multi objective:
Makespan
Throughput
Fairness
Latency
Reliability
Techniques:
Optimalalgorithms
Approximationalgorithms
Heuristics
Parallel Graph Algorithms
Scalable distributed memory localsearch for graph coloring.Communication reductions andcompression. Hybrid MPI/OpenMP.
Cutting Edge Architecture
Investigated graph algorithms andsparse linear algebra operations onpre-release Intel Xeon Phi.
Dataflow middleware
Auto tuning component for spatialdivisible workload on heterogeneoussystems.
Erik SauleOhio State University, Biomedical Informatics
HPC Lab http://bmi.osu.edu/hpcLarge Scale Graph Analysis
Conclusion:: 35 / 39

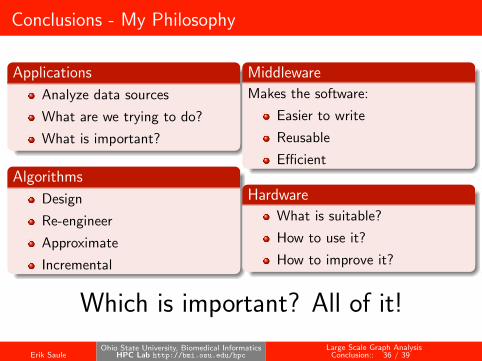
Conclusions - My Philosophy
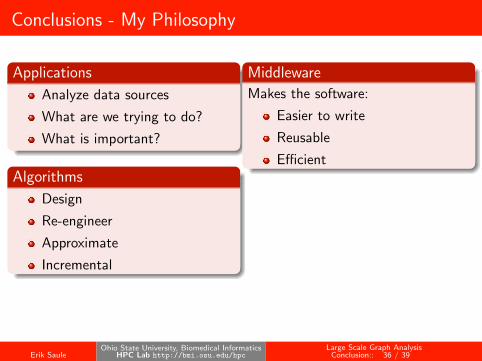
Applications
Analyze data sources
What are we trying to do?
What is important?
Algorithms
Design
Re-engineer
Approximate
Incremental
Middleware
Makes the software:
Easier to write
Reusable
Efficient
Hardware
What is suitable?
How to use it?
How to improve it?
Which is important? All of it!
Erik SauleOhio State University, Biomedical Informatics
HPC Lab http://bmi.osu.edu/hpcLarge Scale Graph Analysis
Conclusion:: 36 / 39

Conclusions - My Philosophy
Applications
Analyze data sources
What are we trying to do?
What is important?
Algorithms
Design
Re-engineer
Approximate
Incremental
Middleware
Makes the software:
Easier to write
Reusable
Efficient
Hardware
What is suitable?
How to use it?
How to improve it?
Which is important? All of it!
Erik SauleOhio State University, Biomedical Informatics
HPC Lab http://bmi.osu.edu/hpcLarge Scale Graph Analysis
Conclusion:: 36 / 39
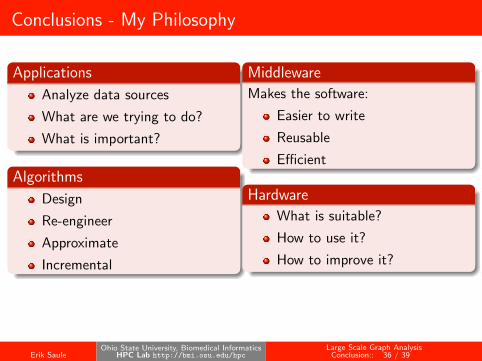

What’s Next?
Applications
Multi-graph
Author Venue Paper
Personal analytics
Cross social network application
Algorithms
Streaming
Community detection
Temporal analysis
Middleware
High Level Query
Cluster with Accelerator GraphMiddleware
The MATLAB of graphs
Hardware
Cluster with ComputationalAccelerator (GPU, Xeon Phi)
Cluster with StorageAccelerator (SSD)
Both! (Beacon project)
Erik SauleOhio State University, Biomedical Informatics
HPC Lab http://bmi.osu.edu/hpcLarge Scale Graph Analysis
Conclusion:: 37 / 39

Active Coauthors
The Ohio State University:
Umit V. Catalyurek
Kamer Kaya
Onur Kucuktunc
Ahmet Erdem Saryıuce
Grenoble University, France:
Denis Trystram
Gregory Mounie
Pierre-Francois Dutot
Jean-Francois Mehaut
Guillaume Huard
INRIA, France:
Yves Robert
Anne Benoit
Emmanuel Jeannot
Alain Girault
Lawrence Berkely National Lab:
Esmond G. Ng
Chao Yang
Hasan Metin Aktulga
University of Tennessee:
Jack Dongarra
University of Luxembourg:
Johnatan Pecero-Sanchez
Vanderbilt University:
Zhiao Shi
Iowa State University:
James Vary
Pieter Maris
Erik SauleOhio State University, Biomedical Informatics
HPC Lab http://bmi.osu.edu/hpcLarge Scale Graph Analysis
Conclusion:: 38 / 39

Thank you
More information
contact : [email protected]: http://bmi.osu.edu/~esaule
http://bmi.osu.edu/hpc/
Research at HPC lab is supported by
Erik SauleOhio State University, Biomedical Informatics
HPC Lab http://bmi.osu.edu/hpcLarge Scale Graph Analysis
Conclusion:: 39 / 39