
LARGE-SCALE FLOW STRUCTURE IN TURBULENT NONPREMIXED …
14
AIAA-2001-0628 American Institute of Aeronautics and Astronautics 1 LARGE-SCALE FLOW STRUCTURE IN TURBULENT NONPREMIXED FLAMES UNDER NORMAL- AND LOW-GRAVITY CONDITIONS C. A. Idicheria * , I. G. Boxx * and N. T. Clemens † Center for Aeromechanics Research Department of Aerospace Engineering and Engineering Mechanics The University of Texas at Austin Austin, TX 78712-1085 Abstract A new experimental investigation has been initiated to study the structure of transitional and turbulent nonpremixed flames under both normal- and low-gravity conditions. Of particular interest is the effect of weak levels of buoyancy on flame characteristics such as the large-scale structure and flame-tip dynamics. In this preliminary study, low-gravity conditions were obtained by dropping a newly developed combustion-box in the UT-Austin 1.25 second drop tower. The flames studied were piloted ethylene jet nonpremixed flames at source Reynolds number ranging from 2,500 to 10,500. The principal diagnostic employed was time- resolved imaging of the visible soot luminosity. Our preliminary results suggest that the lower Reynolds number flames take longer to reach a steady state, but all of the flames reach a steady state in less than a few hundred milliseconds. Furthermore, at lower Reynolds numbers, the low-gravity flames have a lower flame tip oscillation-frequency than the normal-gravity flames. However closer to the momentum dominated regime the flame tip behavior is not significantly different. Volume rendering of sequential images is used to visualize the evolution of large-scale structure in the flame and to study the influence of large-scale motion on flame tip oscillation. Strong coupling between the large-scale structures and the flame tip oscillations is observed. Introduction It is well known that buoyancy has a major influence on the flow structure of turbulent nonpremixed jet flames. Buoyancy acts by inducing baroclinic torques, which generate large-scale vortical structures that can dominate the flowfield when buoyancy forces are large as compared to the momentum flux. The presence of these large-scale structures, and the resulting increased entrainment of ambient air, is the cause of the shorter flame lengths that have been reported in normal gravity as compared to micro-gravity conditions. 1,2,3 It has also been observed that buoyancy can substantially influence the large-scale structure of even nominally momentum-driven flames, since the low velocity flow outside of the flame will be more susceptible to buoyancy effects. 4 Even subtle buoyancy effects may be important because changes in the large-scale structure has implications for the fluctuating strain rate, which influences the structure of the reaction zone. For example, flame-tip burnout dynamics have been shown to be related to the large- scale organization of the jet flame, 5 and are strongly affected by buoyancy. 6 To date, the actual nature of the large-scale structure organization of round jet flames is not known, although there is evidence for both axisymmetric and helical structures. 3,5,6 The low-gravity environment offers a particularly important means of studying these issues, because momentum-driven jet flames can be achieved even at low Reynolds numbers. In experiments at normal gravity, comparisons of jet flames with different levels of buoyancy are usually complicated by concomitant changes in the Reynolds number. It then becomes an issue as to whether the differences observed are due to buoyancy or Reynolds number effects. Bahadori et al. 1 have made extensive studies of nonpremixed flames in the laminar, transitional and turbulent regimes. They studied propylene flames in the transitional and turbulent region and report that micro-gravity flames have significantly different characteristics than normal- gravity flames. For example, they observe micro-gravity propylene flames to be taller than normal-gravity flames, and that in transitional micro-gravity flames, disturbances start at the base of the flame and are convected to the tip, whereas in normal-gravity the transition is initiated at the tip of the flame. Hegde et al. 2 imaged the visible emission from propane flames in micro- * Graduate Research Assistant † Associate Professor, Senior Member AIAA Copyright © 2001 by C.A. Idicheria, I.G. Boxx and N.T. Clemens. Published by the American Institute of Aeronautics and Astronautics, Inc., with permission.
Transcript of LARGE-SCALE FLOW STRUCTURE IN TURBULENT NONPREMIXED …

AIAA-2001-0628
American Institute of Aeronautics and Astronautics
1
LARGE-SCALE FLOW STRUCTURE IN TURBULENT NONPREMIXED FLAMES UNDER NORMAL- AND LOW-GRAVITY CONDITIONS
C. A. Idicheria*, I. G. Boxx* and N. T. Clemens†
Center for Aeromechanics Research Department of Aerospace Engineering and Engineering Mechanics
The University of Texas at Austin Austin, TX 78712-1085
Abstract
A new experimental investigation has been initiated to study the structure of transitional and turbulent nonpremixed flames under both normal- and low-gravity conditions. Of particular interest is the effect of weak levels of buoyancy on flame characteristics such as the large-scale structure and flame-tip dynamics. In this preliminary study, low-gravity conditions were obtained by dropping a newly developed combustion-box in the UT-Austin 1.25 second drop tower. The flames studied were piloted ethylene jet nonpremixed flames at source Reynolds number ranging from 2,500 to 10,500. The principal diagnostic employed was time-resolved imaging of the visible soot luminosity. Our preliminary results suggest that the lower Reynolds number flames take longer to reach a steady state, but all of the flames reach a steady state in less than a few hundred milliseconds. Furthermore, at lower Reynolds numbers, the low-gravity flames have a lower flame tip oscillation-frequency than the normal-gravity flames. However closer to the momentum dominated regime the flame tip behavior is not significantly different. Volume rendering of sequential images is used to visualize the evolution of large-scale structure in the flame and to study the influence of large-scale motion on flame tip oscillation. Strong coupling between the large-scale structures and the flame tip oscillations is observed.
Introduction
It is well known that buoyancy has a major influence on the flow structure of turbulent nonpremixed jet flames. Buoyancy acts by inducing baroclinic torques, which generate large-scale vortical structures that can dominate the flowfield when buoyancy forces are large as compared to the momentum flux. The presence of these large-scale structures, and the resulting increased entrainment of ambient air, is the cause of the shorter flame lengths that have been reported in normal gravity as compared to micro-gravity conditions.1,2,3
It has also been observed that buoyancy can substantially influence the large-scale structure of even nominally momentum-driven flames, since the low velocity flow outside of the flame will be more susceptible to buoyancy effects.4 Even subtle buoyancy effects may be important because changes in the large-scale structure has implications for the fluctuating strain rate, which influences the structure of the reaction zone. For example, flame-tip burnout
dynamics have been shown to be related to the large-scale organization of the jet flame,5 and are strongly affected by buoyancy.6 To date, the actual nature of the large-scale structure organization of round jet flames is not known, although there is evidence for both axisymmetric and helical structures.3,5,6 The low-gravity environment offers a particularly important means of studying these issues, because momentum-driven jet flames can be achieved even at low Reynolds numbers. In experiments at normal gravity, comparisons of jet flames with different levels of buoyancy are usually complicated by concomitant changes in the Reynolds number. It then becomes an issue as to whether the differences observed are due to buoyancy or Reynolds number effects.
Bahadori et al.1 have made extensive studies of nonpremixed flames in the laminar, transitional and turbulent regimes. They studied propylene flames in the transitional and turbulent region and report that micro-gravity flames have significantly different characteristics than normal- gravity flames. For example, they observe micro-gravity propylene flames to be taller than normal-gravity flames, and that in transitional micro-gravity flames, disturbances start at the base of the flame and are convected to the tip, whereas in normal-gravity the transition is initiated at the tip of the flame. Hegde et al.2 imaged the visible emission from propane flames in micro-
*Graduate Research Assistant †Associate Professor, Senior Member AIAA Copyright © 2001 by C.A. Idicheria, I.G. Boxx and N.T. Clemens. Published by the American Institute of Aeronautics and Astronautics, Inc., with permission.

AIAA-2001-0628
American Institute of Aeronautics and Astronautics
2
gravity using a video camera that operated at 30 frames per second. They observed what appeared to be helical large-scale structures at transitional Reynolds numbers.
Hegde et al.7 studied laminar flames (methane, propane, propylene) in micro- and normal-gravity condition. They noticed substantial difference in the flame shape and flame height between flames in normal- and micro-gravity environment. The micro-gravity flames were taller and wider than the normal-gravity flames in all cases. They also report to have noticed the same trend in transitional and turbulent flames, and at no instance did they find the flame height to be the same for the various fuels and range of Reynolds numbers investigated.
The overall objective of this study is to explore these issues further by investigating the flow structure of transitional / turbulent nonpremixed flames under both low- and normal-gravity conditions. The overall study will utilize the drop tower facilities at NASA Glenn Research Center (GRC), but a preliminary study is being conducted using the 1.25-second drop tower located at the University of Texas at Austin. This preliminary study is the focus of the present paper.
Experimental facilities and apparatus
Drop-rig
The drop-rig is enclosed within a standard NASA-GRC 2.2-second drop tower frame, as shown in Figure 1. The aluminum frame measures 38" long by 16" wide and stands 36" tall. The frame is covered on each open side with 0.08" aluminum sheet-metal to minimize flow disturbances during the drops. The sheets have hinged panels to allow access to internal equipment. The rig weighs approximately 260lbs when fully loaded.
This study used a piloted ethylene, round jet diffusion flame issuing into quiescent air. Ethylene was chosen for its high luminosity and ability to burn at high Reynolds numbers without lifting. A premixed methane-air pilot flame was used to ignite the flame and to further forestall flame liftoff.
The ethylene jet issued from a 0.069" (inner diameter) stainless steel tube, surrounded by a 1" diameter concentric, premixed, methane-air flat-flame pilot. The pilot flame was run near stoichiometric condition and was stabilized on a stainless steel perforated plate. Air for the pilot flame was supplied by a 5V-DC micro-blower (of the sort used in microchip heat sinks).
Fuel for the jet flame and pilot burner were stored in two onboard, 18.3 in3 stainless steel
pressure vessels. Flow rates were controlled with line pressure regulators upstream of choked micro-metering valves. Line pressures were recorded using Omega PX-236 pressure transducers installed upstream of the micro-metering valves and read into the onboard computer. Solenoid valves, connected via solid-state relays to the digital I/O card of the onboard computer, were used to start and stop the flow.
Flame luminosity was imaged using a Pulnix TM-6710 progressive scan CCD camera. The camera operates at 120 frames per second (fps) in full frame mode with 512x480 pixel resolution, or up to 350fps in partial frame mode with 512x145 pixel resolution. The latter was used in this study. The camera was electronically shuttered to 1/500 or 1/350 second, depending on flame luminosity. The camera was fitted with a 6mm focal length, f/16 CCTV lens, chosen to maximize the field of view. The camera was controlled by an Imaging Technologies PC-DIG frame-grabber card, together with CAP_PUL software designed by Speedvision Technologies installed in the onboard computer.
The drop-rig is fully automated through an onboard computer. The computer is a custom configured, passive back-plane type machine from CyberResearch Inc. It has an Intel Celeron 466 MHz CPU card with 256MB of RAM and is equipped with a 512MB solid-state flash memory module in place of a hard disk. The back-plane PCI expansion slots hold an Imaging Technologies PC-DIG frame grabber card and a National Instruments PCI-6023E analog/digital I/O data acquisition (DAQ) card. The DAQ card interfaces with the experiment through an SCB-68 breakout panel. The computer runs on the Windows NT operating system and is mounted in a rugged chassis on the floor of the drop rig.
Since the onboard computer has no monitor or keyboard due to space constraints in the rig, it was controlled remotely from a Dell Inspiron notebook computer via a crossover cable. A crossover cable, unlike an ethernet cable connects two computers together through their ethernet ports without using a HUB. The onboard computer was then configured as a server using a freeware called Virtual Network Computing developed by AT&T Laboratories and the notebook was set as the client. With this software we were able to mimic all the functions of a monitor, keyboard and mouse, without actually having to install them in the tightly constrained volume of the drop-rig.
A program developed in LabVIEW is used for timing and control of the experiment sequence. This program drives the DAQ card in the computer to control the experiment sequence, which consists of

AIAA-2001-0628
American Institute of Aeronautics and Astronautics
3
triggering the camera, opening and closing the solenoid valves and acquiring data from the pressure transducers and accelerometer.
Power for the rig is supplied by two onboard 24V - 20A battery packs and routed through a generic power distribution module developed by NASA GRC.
UT-Drop Tower
Figure 2 shows a schematic of the 1.25 second drop tower at the University of Texas at Austin. It is 35ft tall, with a 8.3ft square cross-sectional area and is equipped with a ladder and a work platform at the top.
The tower is equipped with a two-ton capacity electric hoist. The hoist is mounted on a movable trolley suspended from a steel I-beam at the top of the shaft. We have fastened an Eastman Aircraft Corporation helicopter cargo quick-release hook to the end of the hoist's chain. This quick-release mechanism may be operated electrically but we found it more convenient to operate manually.
At the base of the drop tower is a deceleration mechanism consisting of a 6ft deep container of flame retardant, HR-24 polyurethane foam cubes. The container measures 67" long by 44" wide. Its floor is lined with two, 6" thick sheets of foam and the rest of the container is filled with 6" foam cubes. The wall panels of the container are made from expanded metal to ensure visibility from outside.
After allowing for the space taken up by the electric hoist and deceleration mechanism, the drop tower has a 25ft free-fall section. This allows for approximately 1.25 seconds of low gravity time per drop.
Accelerometer data were acquired during each drop in this tower in order to characterize the low gravity conditions. A Kistler model 8304-B2 “K-Beam” capacitive accelerometer and a Model 5210 power supply mounted inside the drop rig were used for this purpose. The accelerometer was sampled at 1-kHz using the on-board data acquisition system.
A representative accelerometer data set from one drop is shown in Figure 3. After smoothing each (1000-point) data set with a 150 point running average, we found the background acceleration is initially 10milli-g (mg) and rises almost linearly (due to aerodynamic drag on the falling rig) to a peak of 30mg just prior to impact. As can be seen in the figure, during the first 0.1 seconds of each drop structural vibration of the drop-rig (caused by initial release from the drop tower and by solenoid valves being activated) overwhelms the low-gravity
environment. The high frequency “noise” soon damps out but a small-amplitude low-frequency vibration persists throughout the free fall.
A Kistler Model 8303-A50 “K-Beam” capacitive accelerometer was used to measure deceleration of the drop-rig on impact at the end of each drop. Using this accelerometer we measured an impact loading of 25-30g. This is comparable to the loading at the NASA-GRC 2.2 second drop-tower and well within the design limitations of all on-board equipment.
Experimental procedure
A typical low-gravity experiment is conducted as follows. Two banana plugs, which are connected to the release mechanism, are inserted into a socket at the top of the rig. Between the two plugs is a simple ON-OFF switch. This switch completes a circuit, which allows the onboard computer to sense when it is connected to the release mechanism.
An access panel is then opened and the onboard gas cylinders are charged with their respective fuels. The onboard computer is then connected via its crossover cable to the notebook computer and the LabVIEW control program and CAP_PUL software are initialized. The crossover cable is then disconnected, the access panel closed and the rig is hoisted to the top of the shaft.
At the top, prior to release, the onboard computer is notified of the impending drop via a toggle of the on-off switch and it opens the solenoid valve to the pilot flame, which we manually ignite through an access panel. The drop-rig is then released and the banana plugs pull loose from the rig, notifying it to begin the rest of the sequence. The computer immediately triggers the camera, followed by the jet fuel solenoid valve. For the next one second, the computer acquires data from the accelerometer and pressure transducers. It simultaneously grabs images from the Pulnix camera at 350fps for 1.4 seconds. The images are saved temporarily in the RAM. Immediately prior to impact, the solenoid valves are closed to extinguish the flame.
The drop-rig is retrieved from the foam-deceleration container with the hoist. The notebook computer is reconnected via the crossover cable and the images and transducer / accelerometer data files are retrieved for storage and analysis.
Experimental conditions and considerations
Table 1 shows the range of conditions over which the piloted ethylene jet flame was operated.

AIAA-2001-0628
American Institute of Aeronautics and Astronautics
4
Table 1. Flow conditions
Case Fuel U0(m/s) ReD ξL
1 Ethylene 12.4 2,500 8.5
2 Ethylene 24.8 5,000 6.6
3 Ethylene 37.2 7,500 4.6
4 Ethylene 52.2 10,500 3.7
The Reynolds number (ReD=U0D/ν) in Table 1 is based on the jet exit diameter D, jet exit velocity U0 and the kinematic viscosity of ethylene at room temperature.
Becker and Yamazaki8 suggest a parameter ξL to quantify the effect of buoyancy on the entrainment of turbulent jet flames. This buoyancy parameter is defined as ξL=Ris
1/3Lf/Ds, where Ris is the source Richardson number (Ris=gDs/Us
2) based on the source diameter Ds=D(ρ0/ρ∞)½, and source velocity Us=U0 for a top-hat velocity profile, round jet. Lf is the average visible flame length, g is the acceleration due to gravity, ρ0 is the jet fluid density and ρ∞ is the ambient density. As the source momentum flux increases, ξL tends to zero and the flame becomes momentum dominated. Various authors have suggested values for ξL below which a jet flame may be defined as momentum dominated. Mungal et al.6 suggest a value of 2, whereas Becker and Yamazaki8 suggest a value of unity. By changing the gravitational environment we alter the buoyancy parameter ξL while maintaining the same Reynolds number. This enables us to separate Reynolds number effects from buoyancy effects.
The field of view for all the cases was 16.25 in and the maximum average flame length was about 14 in. We were able to capture the visible flame tip in all cases. The flame was faint blue at the base and bright yellow downstream. In all the images acquired, 3 in from the base of the nozzle exit is not included since luminosity at the base is low compared to farther downstream. During each drop a total of 488 images were acquired. The high framing rate (350 fps) ensured time resolved images of our jet flame in all cases.
Data analysis and discussion
Jet startup
Figure 4 shows sample image sequences of the flame startup for low- and normal-gravity at two Reynolds numbers. Figure 4a shows a low-gravity startup sequence at ReD=2,500, where every sixth frame is presented, whereas in the normal-gravity case (Figure 4b) every other frame is shown. This is done to present the startup to steady-state transient in approximately the same number of images. Similarly for the case of ReD=7,500 (Figure 4c and 4d), every 6th and 4th frames are used in the low- and normal-gravity cases respectively. From the image sequences in Fig. 4 it can be seen that flames developing in low-gravity take a longer time to reach steady state than the ones in standard-gravity.
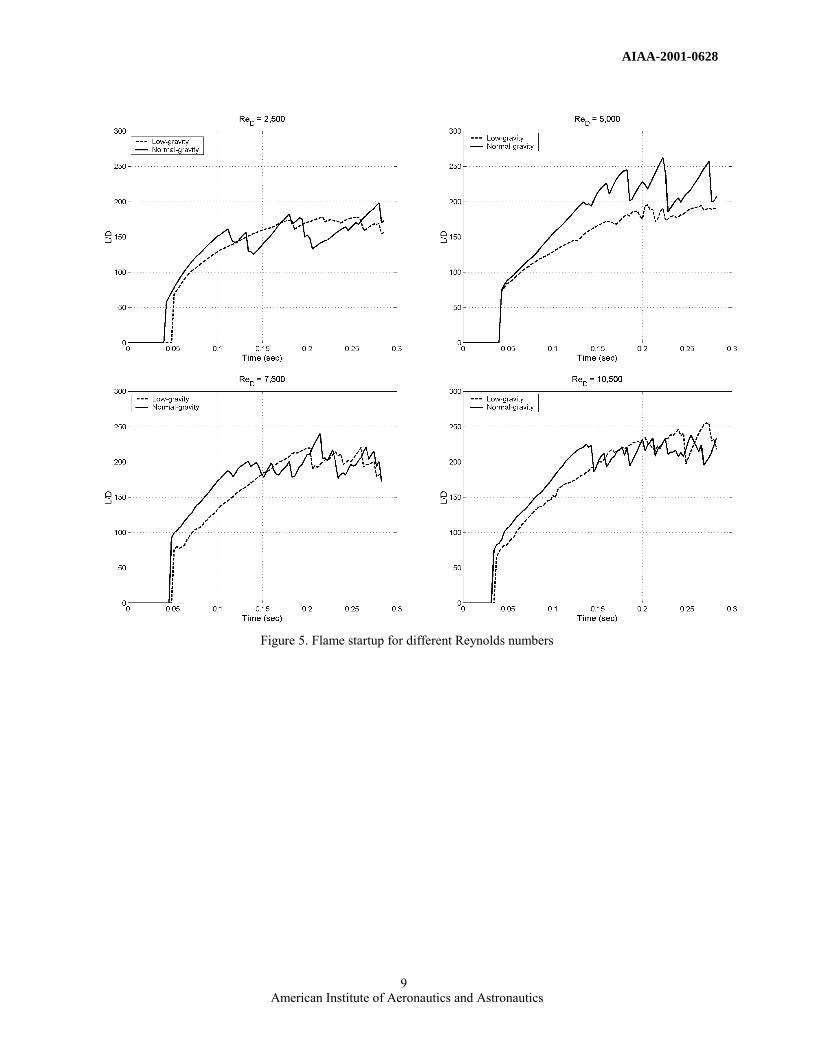
This can be shown more quantitatively by analyzing the instantaneous flame tip location as a function of time. Figure 5 shows the flame length variation (normalized by the exit diameter) with time (as obtained from individual frames) for different Reynolds numbers. The instantaneous flame tip was located by converting the raw image to a binary image by applying a threshold. The threshold was set to be 20%, i.e. pixels with intensity less than 20% of the maximum was set to black and others to white. From this binary image the perimeter of the visible flame was computed. The pixel farthest from the base in the perimeter image was picked to be the flame tip. From these plots it is clearer that the low-gravity flame takes a longer time to reach steady state. But the difference is not high even in the low Reynolds number cases (2500 and 5000) and is of the order of 200 ms. At the higher Reynolds number, the startup behavior becomes more comparable with the difference being of the order of 100 ms.
These observations indicate that buoyancy has an observable effect on jet flame startup but tends to diminish, as the flame becomes momentum dominated.
Steady state observations
Figure 6 shows sample image sequences when the flame has reached steady state. We define steady state when we see quasi-periodic oscillations of the flame tip. In all cases this occurred less than 0.3 seconds from the start of image acquisition. These frames are used for obtaining mean flame characteristics and flame tip oscillations, which are discussed in the following sections.
Significant differences in the shape and large-scale structures can be observed in the low
AIAA-2001-0628
American Institute of Aeronautics and Astronautics
5
Reynolds number case (Figure 6a and 6b). Consistent with the reports of Bahadori et al.1 we do see disturbances starting at the base of the flame and moving up to the tip, for low-gravity flames at the low Reynolds number case (ReD=2,500). We also see what might be helical instabilities (similar to that reported by Hegde et al.2). However we are limited by the 2-D images to make a strong claim about helical instability, which are inherently three-dimensional. Also we do not see evidence of helical structures at higher Reynolds number (ReD=7,500) as is evident from Figure 6 c) and d).
Mean flame characteristics
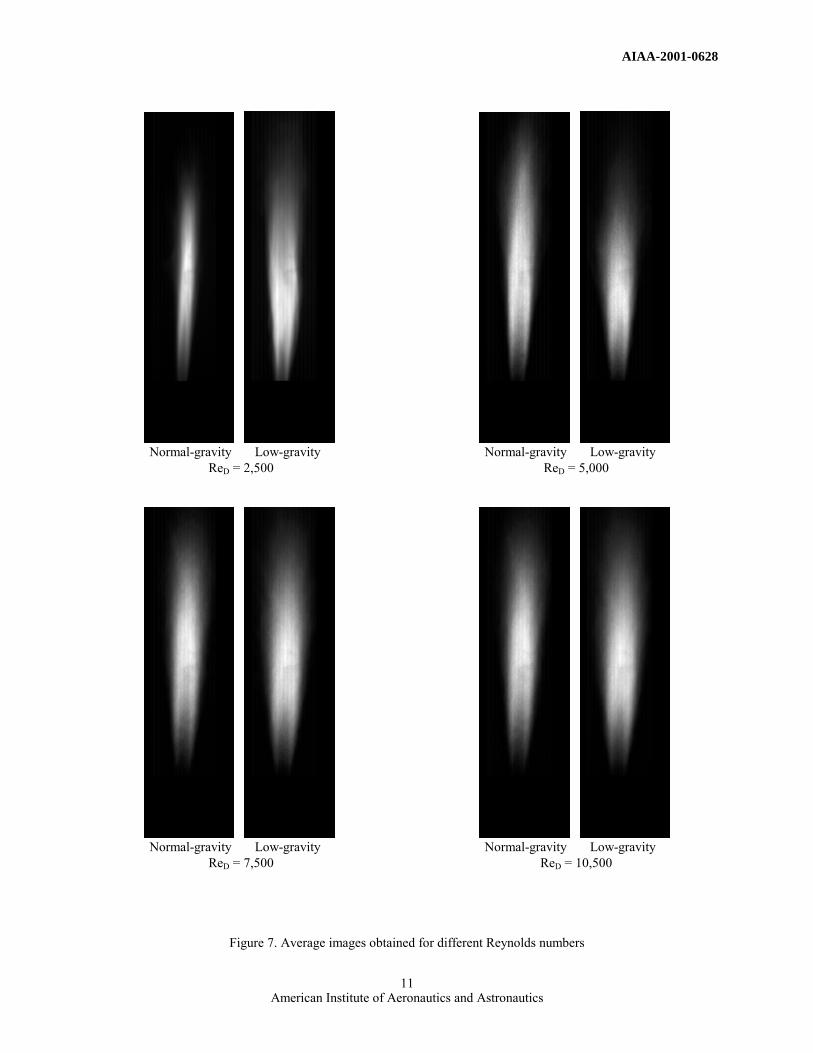
In order to compare the mean characteristics of turbulent flames under different levels of gravity, average images were computed from the image sequences acquired. Care was taken not to include images of the jet startup and shutoff. The steady state frames were chosen as described above and the ensemble average image was computed. A full-scale contrast stretch was performed on these average images and the flame tip was found as described in the Jet startup section. The length corresponding to the flame tip location was defined as the average visible flame length (Lf). Corresponding frame numbers were selected from the normal- and low-gravity sequences. Sample average images for each Reynolds number is presented in Figure 7.
In all of the cases studied, there is little difference in the average visible flame lengths measured under normal- and low-gravity conditions. The variation of L/D (ratio of the average visible flame length to exit diameter of the nozzle) with Reynolds number is shown in Figure 8. The maximum difference was of the order of 20 exit diameters at ReD=5,000. Interestingly, for ReD=5000, the normal gravity flame is longer than the low-gravity case. In all the other cases the low-gravity flame is taller than the normal-gravity case, but the difference is not considerable. The low gravity flames appear to be wider than the normal-gravity flames in all cases.
We expect momentum dominated turbulent flames to have similar characteristics (like flame length, width) whether under normal- or low-gravity conditions. This trend is illustrated in Figure 8. A comparison of the buoyancy parameter (ξL) for the flames studied is shown in Figure 9. The buoyancy parameter for low-gravity cases is calculated based on a g-level of 20mg. Since all the low-gravity flames have a ξL≤1, except ReD=2,500, they are purely momentum driven and the insignificant
difference between the normal- and low-gravity flame characteristics shows how weak the buoyancy effects are.
Large-scale dynamics
Mungal et al.6 suggests flame tip oscillation in turbulent jet flames is strongly coupled to large scale organized motion in the far field of the jet. This claim motivated us to investigate the difference in flame tip oscillation between flames in normal-and low-gravity conditions.
Figure 10 shows the flame tip oscillation for the various cases studied. The flame tips were obtained from individual frames as explained in the Jet startup section. In each case, sets of 200 frames were considered and the starting frame was arbitrarily assigned to be at time t=0. The increment in each frame corresponds to an increase in time of 1/350 second.
Comparing the normal- and low-gravity flame tip oscillations show that at low Reynolds numbers the frequency in low-gravity condition is lower than in normal-gravity. As the Reynolds number increases, the oscillation-frequency in normal- and low-gravity environment appears to be very similar. This observation also suggests that buoyancy will have very limited effect on momentum-dominated flows.
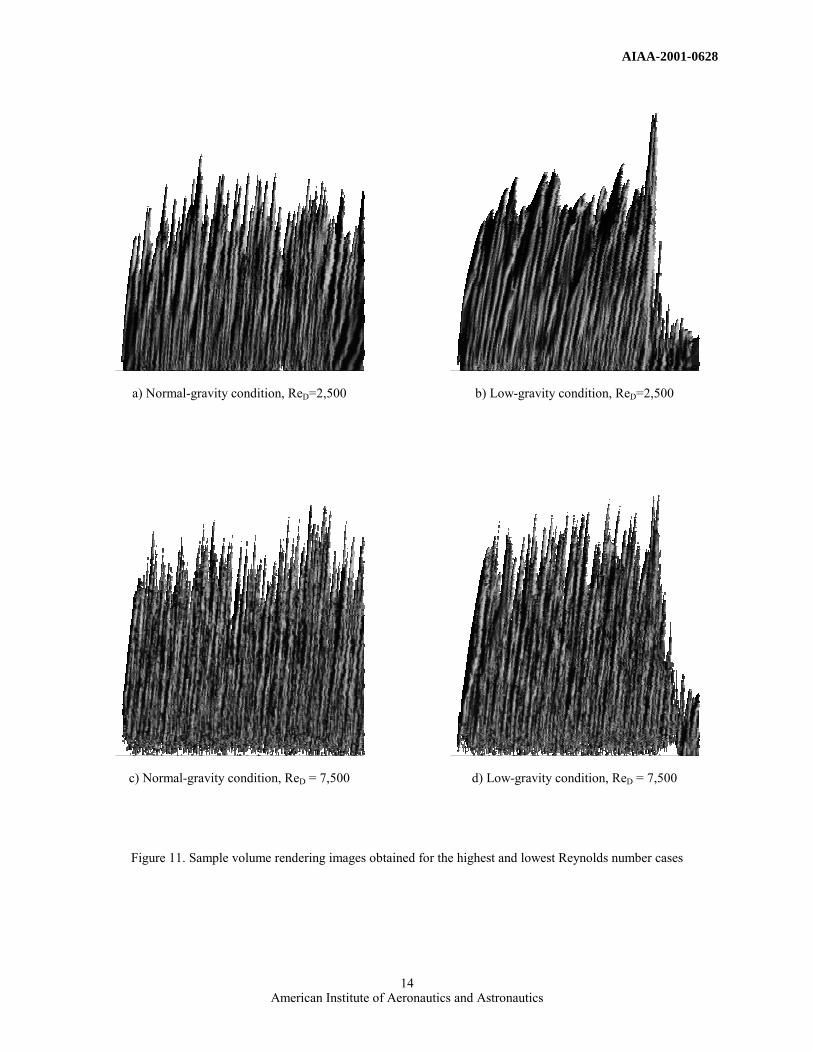
We also investigated the evolution of the large-scale structures in the flames using volume rendering of image sequences. This technique, discussed by Mungal et al.6, gives good visual information on the flow evolution between frames in an image sequence. In this technique a sequence of two-dimensional images (x-y) are stacked one behind the other along the z-axis and a three dimensional volume (x-y-t) is generated via image processing. The surface of this 3-D model is an isocontour corresponding to the (x,y,t) coordinates of the visible flame edge in each image. This technique allows us to quickly and systematically track changes in the visible flame edge from one frame to another. Volume rendering also highlights features which are not immediately apparent in the still images or movies sequences.
The renderings were computed with a commercially available software package (Slicer Dicer) running on a Pentium III computer with 1 GB of RAM. Sample renderings are shown in Figure 11. The figures presented are viewed 90 degrees from the time axis, with time progressing from left to right. In these images, convection of large-scale structures appears as wrinkles traveling up and to the right on the surface of the volume. The slope of these
AIAA-2001-0628
American Institute of Aeronautics and Astronautics
6
wrinkles can be used as a qualitative estimate of the large-scale structure convection velocity.
Consistent with the work of Mungal et al.6, we saw a strong coupling of large-scale motion of the visible flame edge with flame tip oscillation. Furthermore, we observed this correlation in both the normal- and low gravity conditions. Like Mungal et al.6, we also observe what appear to be large structure pairings, formed when structures form close to the base of the flame and convect downstream into structures formed earlier. Again, we observe this at both low- and normal-gravity.
Conclusions
We have described preliminary results from a new study that aims to investigate the effects of weak levels of buoyancy on the structure of turbulent nonpremixed jet flames. Piloted ethylene jet flames were studied under both normal- and milli-gravity conditions by imaging the natural flame luminosity with a high-speed video camera. Correlated image sequences were analyzed to show that the flames reached a steady state in less than a few hundred milliseconds. The mean flame lengths inferred from the visible emission were found to differ little under low- and normal-gravity conditions, over Reynolds numbers ranging from 2,500 to 10,500. Analysis of the flame tip dynamics suggests that the oscillation-frequency is buoyancy dependent, and is consistent with the increased flow velocities that are expected for the buoyancy-influenced flames. Our results have also shown that volume rendering of the image sequences will be useful for examining the evolution of the global structure of the flames. Our future work will be directed at studying a wider range of conditions and conducting analyses that will better quantify our observations.
Acknowledgements
This work is supported by NASA cooperative agreement NCC3-677. The authors also wish to thank Dr. Z. G. Yuan of NCMR and Andrew Jenkins of NASA Glenn for their invaluable input into the design and fabrication of the drop-rig.
References
1. Bahadori, M.Y., Stocker, D.P., Vaughan, D.F., Zhou, L. and Edelman, R.B., “Effects of Buoyancy on Laminar, Transitional and Turbulent Gas Jet Diffusion Flames,” Modern Developments
in Energy, Combustion and Spectroscopy, Pergamon Press, pp. 49-66.
2. Hegde, U., Yuan, Z.G., Stocker, D.P. and Bahadori, M.Y., “Temperature and Radiation Correlations in Microgravity Turbulent Diffusion Flames,” AIAA paper 2000-0697 (2000).
3. Hegde, U., Yuan, Z.G., Stocker, D.P. and
Bahadori, M.Y., “Characteristics of Non-Premixed Turbulent Flames in Microgravity,” Fifth International Microgravity combustion Workshop, May (2000).
4. Roquemore, W.M., Chen, L.-D., Goss, L.P. and
Lynn, W.F. “The Structure of Jet Diffusion Flames,” in Lecture notes in Engineering Vol. 40, R. Borghi and S.N.B. Murthy, Eds., Springer-Verlag, pp. 49-63 (1989).
5. Mungal, M.G. and O’Neil, J.M., “Visual
Observation of a Turbulent Diffusion Flame,” Combustion and Flame, Vol. 78, pp. 377-389 (1989).
6. Mungal, M.G., Karasso, P.S. and Lozano, A.,
“The Visible Structure of Turbulent Jet Diffusion Flames: Large-Scale Organization and Flame Tip Oscillation,” Combustion Science & Technology, Vol. 76, pp. 165-185 (1991).
7. Hegde, U., Zhou, L., Bahadori, M. Y., “The
Transition to Turbulence of Microgravity Gas Jet Diffusion Flames,” Combustion Science & Technology, Vol. 102, pp. 95-113 (1994)
8. Becker, H. A. and Yamazaki, S. “Entrainment
Momentum Flux and Temperature in Vertical Free Turbulent Diffusion Flames,” Combustion and Flame, Vol. 33, pp. 123-149 (1978).

AIAA-2001-0628
American Institute of Aeronautics and Astronautics
7
Figure 1. Schematic diagram of the drop-rig.
Figure 2. Schematic diagram of the 1.25 second drop
tower at the University of Texas at Austin
-20
-10
0
10
20
30
40
50
0 0.5 1 1.5Time (sec)
Mill
i-g
Unfiltered Smoothed
Figure 3. Accelerometer data collected during the free fall of the drop-rig.
Onboard Computer
Pulnix TM-6710CCD camera
Shutoff valvePressure regulator
Solenoid valveMicrometering valve
Jet Gas bottle
Charging port
24V Battery pack
Pilot flame burner
Combustion chamber
Flow straightner
Fume hood
Microblower
Power distributionsystem
Pilot flame gas bottle
Co-flow Blower
Co-flow ducting

AIAA-2001-0628
American Institute of Aeronautics and Astronautics
8
First frame at t = 0.069sec, Time between frames = 0.017sec
a) Low-gravity ReD=2,500
First frame at t = 0.063sec, Time between frames = 0.0057sec
b) Normal-gravity ReD=2,500
First frame at t = 0.083sec, Time between frames = 0.017sec
c) Low-gravity ReD=7,500
First frame at t = 0.063sec, Time between frames = 0.011sec
d) Normal-gravity ReD=7,500 Figure 4. Typical startup sequences
AIAA-2001-0628
American Institute of Aeronautics and Astronautics
9
Figure 5. Flame startup for different Reynolds numbers

AIAA-2001-0628
American Institute of Aeronautics and Astronautics
10
a) Low-gravity ReD=2,500. Time between frames = 0.0029sec
b) Normal-gravity ReD=2,500. Time between frames = 0.0029sec
c) Low-gravity ReD=7,500. Time between frames = 0.0029sec
d) Normal-gravity ReD=7,500. Time between frames = 0.0029sec
Figure 6. Typical image sequences at steady state
AIAA-2001-0628
American Institute of Aeronautics and Astronautics
11
Normal-gravity Low-gravity
ReD = 2,500
Normal-gravity Low-gravity
ReD = 7,500
Normal-gravity Low-gravity
ReD = 5,000
Normal-gravity Low-gravity
ReD = 10,500
Figure 7. Average images obtained for different Reynolds numbers

AIAA-2001-0628
American Institute of Aeronautics and Astronautics
12
Figure 8. Variation of L/D to Reynolds number
Figure 9. Variation of buoyancy parameter to Reynolds number

AIAA-2001-0628
American Institute of Aeronautics and Astronautics
13
Figure 10. Flame tip oscillation for various Reynolds numbers.
AIAA-2001-0628
American Institute of Aeronautics and Astronautics
14
a) Normal-gravity condition, ReD=2,500
c) Normal-gravity condition, ReD = 7,500
b) Low-gravity condition, ReD=2,500
d) Low-gravity condition, ReD = 7,500
Figure 11. Sample volume rendering images obtained for the highest and lowest Reynolds number cases