Large-scale brain networks emerge from dynamic processing ... · PDF fileLarge-scale brain...
13
Large-scale brain networks emerge from dynamic processing of musical timbre, key and rhythm Vinoo Alluri a, ⁎, Petri Toiviainen a, 1 , Iiro P. Jääskeläinen c, d, 2 , Enrico Glerean c, d, 2 , Mikko Sams c, d, 2 , Elvira Brattico a, b, 3 a Finnish Centre of Excellence in Interdisciplinary Music Research, University of Jyväskylä, Finland b Cognitive Brain Research Unit, Institute of Behavioral Sciences, University of Helsinki, Finland c Mind and Brain Laboratory, Department of Biomedical Engineering and Computational Science (BECS), Aalto University School of Science, Finland d Advanced Magnetic Imaging Centre, Aalto University School of Science, Finland abstract article info Article history: Received 21 June 2011 Revised 13 October 2011 Accepted 6 November 2011 Available online 12 November 2011 Keywords: Music processing fMRI Computational feature extraction Naturalistic stimulus Temporal evolution We investigated the neural underpinnings of timbral, tonal, and rhythmic features of a naturalistic musical stimu- lus. Participants were scanned with functional Magnetic Resonance Imaging (fMRI) while listening to a stimulus with a rich musical structure, a modern tango. We correlated temporal evolutions of timbral, tonal, and rhythmic features of the stimulus, extracted using acoustic feature extraction procedures, with the fMRI time series. Results corroborate those obtained with controlled stimuli in previous studies and highlight additional areas recruited during musical feature processing. While timbral feature processing was associated with activations in cognitive areas of the cerebellum, and sensory and default mode network cerebrocortical areas, musical pulse and tonality processing recruited cortical and subcortical cognitive, motor and emotion-related circuits. In sum, by combining neuroimaging, acoustic feature extraction and behavioral methods, we revealed the large-scale cognitive, motor and limbic brain circuitry dedicated to acoustic feature processing during listening to a naturalistic stimulus. In ad- dition to these novel findings, our study has practical relevance as it provides a powerful means to localize neural processing of individual acoustical features, be it those of music, speech, or soundscapes, in ecological settings. © 2011 Elsevier Inc. All rights reserved. Introduction Music is fundamental to humans across all cultures and is capable of eliciting intense emotions (Salimpoor et al., 2011). Uncovering the neu- ral underpinnings of music processing has become a central theme in cognitive neuroscience in the past decade, as evidenced by the con- stantly increasing corpus of studies on this topic. The intrinsically multi- dimensional nature of music renders this task challenging. More specifically, music comprises several perceivable features of varying levels of abstraction, such as loudness, pitch (the organization of sounds along a scale from low to high), rhythm (the perceptual organization of sound events in time) and timbre (property that allows to distinguish between different instrument sounds having the same pitch and loud- ness). Perceiving polyphonic music involves automatic segregation of the musical information in the brain. For instance, when listening to a piece of music played by an orchestra we are able to distinguish one instrument's timbre from that of another, perceive the leading melody by extracting pitch height, and feel the beat (Bregman, 1990; Janata et al., 2002a, 2002b). In this process, domain-specific neural mechanisms for acoustic feature analysis and integration as well as domain-general neural circuits of attention and memory are required. In particular, hier- archical processing within the auditory cortex going from more simple to more complex features (Chevillet et al., 2011; Patterson et al., 2002), and hemispheric specialization (Samson et al., 2011; Zatorre et al., 2002) for spectral vs. temporal acoustic variations, have been identified as putative principles of functional organization of acoustic feature- related processing. Previous neuroimaging studies of music have attempted to identify brain structures involved in the perception of music-related perceptual features, such as pitch (Patterson et al., 2002), sensory dissonance (Blood et al., 1999; Koelsch et al., 2006), rhythm (Chen et al., 2008; Grahn and Rowe, 2009), timbre (Caclin et al., 2006; Halpern et al., 2004), and key (Janata et al., 2002a, 2002b). However, while these studies have successfully identified brain regions participating in processing of individual musical features they have re- lied on controlled auditory paradigms in which these features have been presented in isolation and manipulated artificially. Although a few studies have investigated brain responses during continuous listen- ing to relatively simple musical stimuli (Janata et al., 2002a, 2002b; Schaefer et al., 2009), it has not been previously studied how the human brain processes, in parallel, the multitude of musical features NeuroImage 59 (2012) 3677–3689 ⁎ Corresponding author at: Department of Music, University of Jyväskylä, PL 35(M), 40014 Jyväskylä, Finland. E-mail address: vinoo.alluri@jyu.fi (V. Alluri). 1 Department of Music, University of Jyväskylä, PL 35(M), 40014 Jyväskylä, Finland. 2 BECS, Dept. of Biomedical Engineering and Computational Science, P.O.Box 12200, FI-00076 Aalto, Finland. 3 Institute of Behavioral Sciences, P.O.B. 9, 00014, University of Helsinki, Finland. 1053-8119/$ – see front matter © 2011 Elsevier Inc. All rights reserved. doi:10.1016/j.neuroimage.2011.11.019 Contents lists available at SciVerse ScienceDirect NeuroImage journal homepage: www.elsevier.com/locate/ynimg
Transcript of Large-scale brain networks emerge from dynamic processing ... · PDF fileLarge-scale brain...

NeuroImage 59 (2012) 3677–3689
Contents lists available at SciVerse ScienceDirect
NeuroImage
j ourna l homepage: www.e lsev ie r .com/ locate /yn img
Large-scale brain networks emerge from dynamic processing of musical timbre, keyand rhythm
Vinoo Alluri a,⁎, Petri Toiviainen a,1, Iiro P. Jääskeläinen c,d,2, Enrico Glerean c,d,2,Mikko Sams c,d,2, Elvira Brattico a,b,3
a Finnish Centre of Excellence in Interdisciplinary Music Research, University of Jyväskylä, Finlandb Cognitive Brain Research Unit, Institute of Behavioral Sciences, University of Helsinki, Finlandc Mind and Brain Laboratory, Department of Biomedical Engineering and Computational Science (BECS), Aalto University School of Science, Finlandd Advanced Magnetic Imaging Centre, Aalto University School of Science, Finland
⁎ Corresponding author at: Department of Music, Uni40014 Jyväskylä, Finland.
E-mail address: [email protected] (V. Alluri).1 Department of Music, University of Jyväskylä, PL 352 BECS, Dept. of Biomedical Engineering and Computa
FI-00076 Aalto, Finland.3 Institute of Behavioral Sciences, P.O.B. 9, 00014, Uni
1053-8119/$ – see front matter © 2011 Elsevier Inc. Alldoi:10.1016/j.neuroimage.2011.11.019
a b s t r a c t
a r t i c l e i n f oArticle history:Received 21 June 2011Revised 13 October 2011Accepted 6 November 2011Available online 12 November 2011
Keywords:Music processingfMRIComputational feature extractionNaturalistic stimulusTemporal evolution
We investigated the neural underpinnings of timbral, tonal, and rhythmic features of a naturalistic musical stimu-lus. Participants were scanned with functional Magnetic Resonance Imaging (fMRI) while listening to a stimuluswith a rich musical structure, a modern tango. We correlated temporal evolutions of timbral, tonal, and rhythmicfeatures of the stimulus, extracted using acoustic feature extraction procedures, with the fMRI time series. Resultscorroborate those obtained with controlled stimuli in previous studies and highlight additional areas recruitedduring musical feature processing. While timbral feature processing was associated with activations in cognitiveareas of the cerebellum, and sensory and default mode network cerebrocortical areas, musical pulse and tonalityprocessing recruited cortical and subcortical cognitive, motor and emotion-related circuits. In sum, by combiningneuroimaging, acoustic feature extraction and behavioral methods, we revealed the large-scale cognitive, motorand limbic brain circuitry dedicated to acoustic feature processing during listening to a naturalistic stimulus. In ad-dition to these novel findings, our study has practical relevance as it provides a powerful means to localize neuralprocessing of individual acoustical features, be it those of music, speech, or soundscapes, in ecological settings.
© 2011 Elsevier Inc. All rights reserved.
Introduction
Music is fundamental to humans across all cultures and is capable ofeliciting intense emotions (Salimpoor et al., 2011). Uncovering the neu-ral underpinnings of music processing has become a central theme incognitive neuroscience in the past decade, as evidenced by the con-stantly increasing corpus of studies on this topic. The intrinsicallymulti-dimensional nature of music renders this task challenging. Morespecifically, music comprises several perceivable features of varyinglevels of abstraction, such as loudness, pitch (the organization of soundsalong a scale from low to high), rhythm (the perceptual organization ofsound events in time) and timbre (property that allows to distinguishbetween different instrument sounds having the same pitch and loud-ness). Perceiving polyphonic music involves automatic segregation ofthe musical information in the brain. For instance, when listening to apiece of music played by an orchestra we are able to distinguish one
versity of Jyväskylä, PL 35(M),
(M), 40014 Jyväskylä, Finland.tional Science, P.O.Box 12200,
versity of Helsinki, Finland.
rights reserved.
instrument's timbre from that of another, perceive the leading melodyby extracting pitch height, and feel the beat (Bregman, 1990; Janata etal., 2002a, 2002b). In this process, domain-specific neural mechanismsfor acoustic feature analysis and integration as well as domain-generalneural circuits of attention andmemory are required. In particular, hier-archical processing within the auditory cortex going from more simpleto more complex features (Chevillet et al., 2011; Patterson et al., 2002),and hemispheric specialization (Samson et al., 2011; Zatorre et al.,2002) for spectral vs. temporal acoustic variations, have been identifiedas putative principles of functional organization of acoustic feature-related processing. Previous neuroimaging studies of music haveattempted to identify brain structures involved in the perception ofmusic-related perceptual features, such as pitch (Patterson et al.,2002), sensory dissonance (Blood et al., 1999; Koelsch et al., 2006),rhythm (Chen et al., 2008; Grahn and Rowe, 2009), timbre (Caclin etal., 2006; Halpern et al., 2004), and key (Janata et al., 2002a, 2002b).However, while these studies have successfully identified brain regionsparticipating in processing of individual musical features they have re-lied on controlled auditory paradigms in which these features havebeen presented in isolation and manipulated artificially. Although afew studies have investigated brain responses during continuous listen-ing to relatively simple musical stimuli (Janata et al., 2002a, 2002b;Schaefer et al., 2009), it has not been previously studied how thehuman brain processes, in parallel, the multitude of musical features

3678 V. Alluri et al. / NeuroImage 59 (2012) 3677–3689
when participants are listening to a record of real orchestra music dur-ing neuroimaging.
In the visual modality, recent evidence suggests that the brain pro-cesses visual stimuli presented in a more ecological setting differentlythan when presented in conventional controlled settings (Hasson etal., 2004). Assuming that this finding is generalizable across sensorymodalities, one could expect that the majority of studies in the audi-tory modality, in which acoustic features were artificially manipulat-ed, may have revealed an incomplete picture of brain function relatedto musical feature processing. Therefore, studying music listening as acontinuous process using naturalistic stimuli could provide more ac-curate accounts of the processing of musical features in the brain.
We employed a stimulus-wise and task-wisemore ecological settingin which participants freely listened to real music without performingany other task, in order to determine the neural mechanisms and struc-tures responsible for musical feature processing under realistic condi-tions. To tackle the complexity of the problem, we introduced a novelinterdisciplinary approach combining neuroimaging with computa-tional acoustic feature extraction and behavioral psychology. As musicstimulus we chose the modern tango Adios Nonino by Astor Piazzolla.The participants were scanned with fMRI while listening to this piece.Temporal evolutions of acoustic components representing timbral,tonal and rhythmic features of the stimulus were computationallyextracted and validated via a perceptual experiment. Following thiswe performed correlation analyses of the time series of the individualacoustic components and the time series of the BOLD signal.
In light of previous studies (Samson et al., 2011), we hypothesizedthat timbral components would activate mainly sensory areas, such asthe superior temporal gyrus (STG) and the Heschl's gyrus (HG). More-over, we expected that the spectrally varying timbral componentswould activate particularly the caudolateral and anterior superiortemporal regions, respectively (see Samson et al., 2011 for an over-view). In addition, we predicted hemispheric lateralization, in partic-ular, that right hemispheric regions would show larger areasinvolved in the processing of these features (Zatorre et al., 2002). Pro-cessing of tonality-related features was expected to recruit areas inthe brain formerly known to be neural substrates of tonality
Fig. 1. Loadings of the features on the first 9 Principal Components (PC) as a result of principnumber in order of decreasing amount of variance explained. The shade of gray indicates theand 8 are not labeled as they failed to correlate with the perceptual ratings and thus were e
processing, such as the rostromedial prefrontal cortex (Janata et al.,2002a, 2002b). In addition, as tonality processing draws on long-term knowledge of hierarchical tonality structures (Krumhansl,1990), we expected the brain areas related to memory processing,such as the hippocampus (see Burianova et al., 2010 for an overview)to be activated. We hypothesized rhythm-related features to recruit,in addition to areas in the auditory cortex, cortical and subcorticalareas related to motor processing, such as the premotor and supple-mentary motor areas, and subcortical structures involved in the pro-cessing of time intervals such as the basal ganglia (Harrington et al.,1998; Janata and Grafton, 2003; Rao et al., 2001; Schwartze et al.,2011). Furthermore, as tonal and rhythmic features are known to elicitexpectations in listeners (Janata, 2005; Zanto et al., 2006), we hypoth-esized them to shape activations in the higher-order areas in the brain,such as the supplementary motor areas, which are known to be in-volved in perceptual tasks having an anticipatory component(Schubotz and von Cramon, 2002).
Materials and methods
Participants
Eleven healthy participants (with no neurological, hearing or psy-chological problems) with formal musical training participated in thestudy (mean age: 23.2±3.7 SD; 5 females). We chose participantswith formal musical training as it has been shown that musicians dis-play stronger neural responses to various musical features in compari-son to non-musicians (Pantev et al., 2001; Wong et al., 2007). Fiveparticipants were educated in and performed mainly classical music,two musicians were trained in folk and jazz music, and the rest wereplaying mainly pop/rock music. Four musicians played string instru-ments, three percussive instruments, two wind instruments, and twokeyboard instruments. All participants, except one, were also able toplay other instruments along with their main one. These musiciansstarted to play their main instrument on average at 9.1±3.4 SD yearsof age, and their second instrument at 10.5±3.7 SD years, collecting atotal amount of years of training equal, on average, to 16.1±6 SD.
al component analysis with varimax rotation. The x-axis indicates principal componentrespective loading withwhite indicating themaximum and black theminimum. PCs 4, 5,xcluded from subsequent analyses.
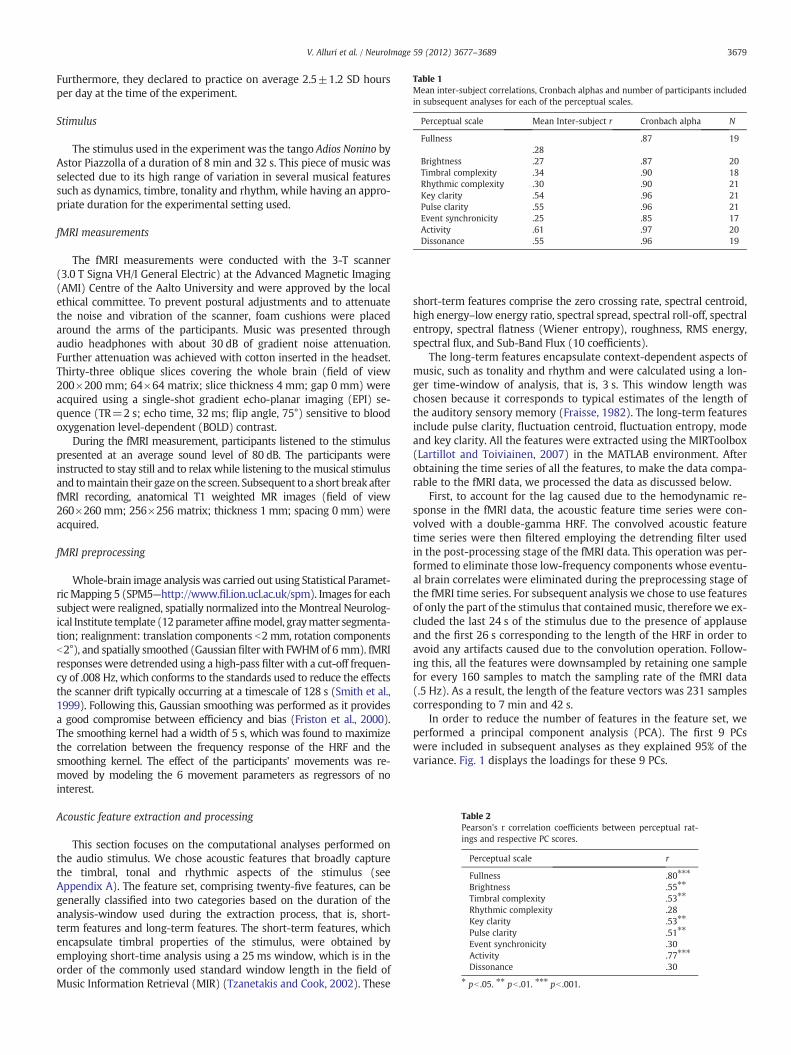
Table 1Mean inter-subject correlations, Cronbach alphas and number of participants includedin subsequent analyses for each of the perceptual scales.
Perceptual scale Mean Inter-subject r Cronbach alpha N
Fullness.28
.87 19
Brightness .27 .87 20Timbral complexity .34 .90 18Rhythmic complexity .30 .90 21Key clarity .54 .96 21Pulse clarity .55 .96 21Event synchronicity .25 .85 17Activity .61 .97 20Dissonance .55 .96 19
Table 2Pearson's r correlation coefficients between perceptual rat-ings and respective PC scores.
Perceptual scale r
Fullness .80⁎⁎⁎
Brightness .55⁎⁎
Timbral complexity .53⁎⁎
Rhythmic complexity .28Key clarity .53⁎⁎
Pulse clarity .51⁎⁎
Event synchronicity .30Activity .77⁎⁎⁎
Dissonance .30
⁎ pb .05. ⁎⁎ pb .01. ⁎⁎⁎ pb .001.
3679V. Alluri et al. / NeuroImage 59 (2012) 3677–3689
Furthermore, they declared to practice on average 2.5±1.2 SD hoursper day at the time of the experiment.
Stimulus
The stimulus used in the experiment was the tango Adios Nonino byAstor Piazzolla of a duration of 8 min and 32 s. This piece of music wasselected due to its high range of variation in several musical featuressuch as dynamics, timbre, tonality and rhythm, while having an appro-priate duration for the experimental setting used.
fMRI measurements
The fMRI measurements were conducted with the 3-T scanner(3.0 T Signa VH/I General Electric) at the Advanced Magnetic Imaging(AMI) Centre of the Aalto University and were approved by the localethical committee. To prevent postural adjustments and to attenuatethe noise and vibration of the scanner, foam cushions were placedaround the arms of the participants. Music was presented throughaudio headphones with about 30 dB of gradient noise attenuation.Further attenuation was achieved with cotton inserted in the headset.Thirty-three oblique slices covering the whole brain (field of view200×200 mm; 64×64 matrix; slice thickness 4 mm; gap 0 mm) wereacquired using a single-shot gradient echo-planar imaging (EPI) se-quence (TR=2 s; echo time, 32 ms; flip angle, 75°) sensitive to bloodoxygenation level-dependent (BOLD) contrast.
During the fMRI measurement, participants listened to the stimuluspresented at an average sound level of 80 dB. The participants wereinstructed to stay still and to relax while listening to themusical stimulusand tomaintain their gaze on the screen. Subsequent to a short break afterfMRI recording, anatomical T1 weighted MR images (field of view260×260 mm; 256×256 matrix; thickness 1 mm; spacing 0 mm) wereacquired.
fMRI preprocessing
Whole-brain image analysis was carried out using Statistical Paramet-ricMapping 5 (SPM5—http://www.fil.ion.ucl.ac.uk/spm). Images for eachsubject were realigned, spatially normalized into the Montreal Neurolog-ical Institute template (12parameter affinemodel, graymatter segmenta-tion; realignment: translation components b2 mm, rotation componentsb2°), and spatially smoothed (Gaussian filter with FWHMof 6 mm). fMRIresponses were detrended using a high-pass filter with a cut-off frequen-cy of .008 Hz, which conforms to the standards used to reduce the effectsthe scanner drift typically occurring at a timescale of 128 s (Smith et al.,1999). Following this, Gaussian smoothing was performed as it providesa good compromise between efficiency and bias (Friston et al., 2000).The smoothing kernel had a width of 5 s, which was found to maximizethe correlation between the frequency response of the HRF and thesmoothing kernel. The effect of the participants' movements was re-moved by modeling the 6 movement parameters as regressors of nointerest.
Acoustic feature extraction and processing
This section focuses on the computational analyses performed onthe audio stimulus. We chose acoustic features that broadly capturethe timbral, tonal and rhythmic aspects of the stimulus (seeAppendix A). The feature set, comprising twenty-five features, can begenerally classified into two categories based on the duration of theanalysis-window used during the extraction process, that is, short-term features and long-term features. The short-term features, whichencapsulate timbral properties of the stimulus, were obtained byemploying short-time analysis using a 25 ms window, which is in theorder of the commonly used standard window length in the field ofMusic Information Retrieval (MIR) (Tzanetakis and Cook, 2002). These
short-term features comprise the zero crossing rate, spectral centroid,high energy–low energy ratio, spectral spread, spectral roll-off, spectralentropy, spectral flatness (Wiener entropy), roughness, RMS energy,spectral flux, and Sub-Band Flux (10 coefficients).
The long-term features encapsulate context-dependent aspects ofmusic, such as tonality and rhythm and were calculated using a lon-ger time-window of analysis, that is, 3 s. This window length waschosen because it corresponds to typical estimates of the length ofthe auditory sensory memory (Fraisse, 1982). The long-term featuresinclude pulse clarity, fluctuation centroid, fluctuation entropy, modeand key clarity. All the features were extracted using the MIRToolbox(Lartillot and Toiviainen, 2007) in the MATLAB environment. Afterobtaining the time series of all the features, to make the data compa-rable to the fMRI data, we processed the data as discussed below.
First, to account for the lag caused due to the hemodynamic re-sponse in the fMRI data, the acoustic feature time series were con-volved with a double-gamma HRF. The convolved acoustic featuretime series were then filtered employing the detrending filter usedin the post-processing stage of the fMRI data. This operation was per-formed to eliminate those low-frequency components whose eventu-al brain correlates were eliminated during the preprocessing stage ofthe fMRI time series. For subsequent analysis we chose to use featuresof only the part of the stimulus that containedmusic, therefore we ex-cluded the last 24 s of the stimulus due to the presence of applauseand the first 26 s corresponding to the length of the HRF in order toavoid any artifacts caused due to the convolution operation. Follow-ing this, all the features were downsampled by retaining one samplefor every 160 samples to match the sampling rate of the fMRI data(.5 Hz). As a result, the length of the feature vectors was 231 samplescorresponding to 7 min and 42 s.
In order to reduce the number of features in the feature set, weperformed a principal component analysis (PCA). The first 9 PCswere included in subsequent analyses as they explained 95% of thevariance. Fig. 1 displays the loadings for these 9 PCs.
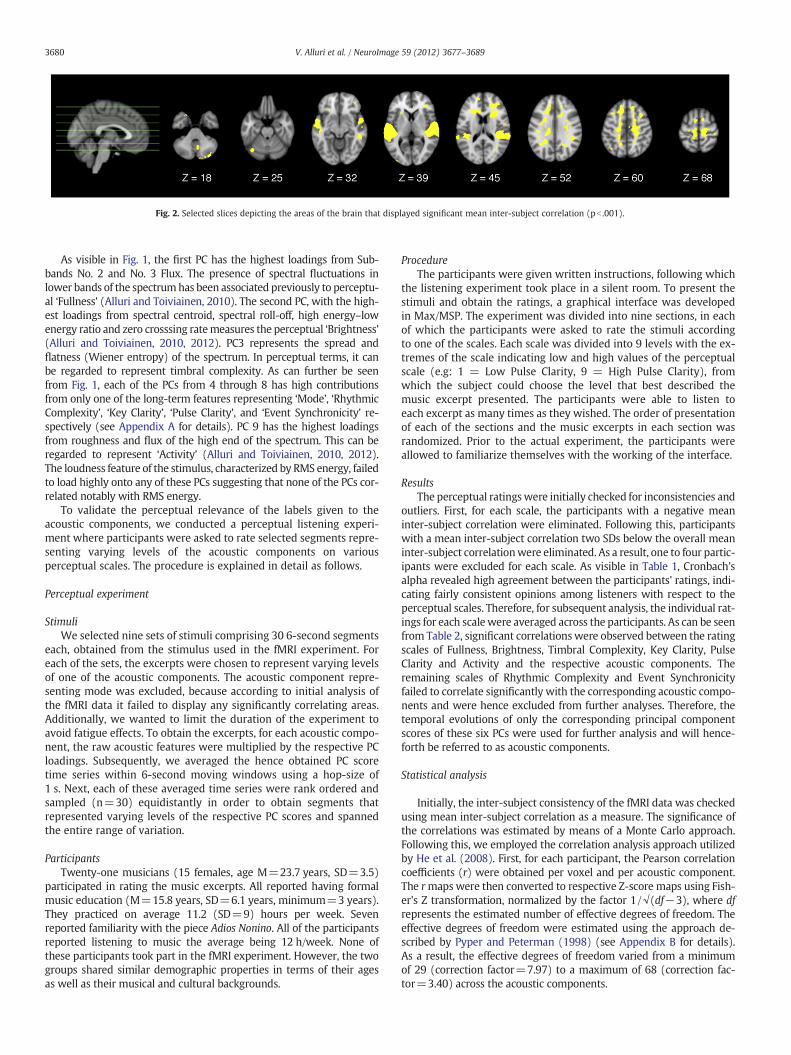
Fig. 2. Selected slices depicting the areas of the brain that displayed significant mean inter-subject correlation (pb .001).
3680 V. Alluri et al. / NeuroImage 59 (2012) 3677–3689
As visible in Fig. 1, the first PC has the highest loadings from Sub-bands No. 2 and No. 3 Flux. The presence of spectral fluctuations inlower bands of the spectrumhas been associated previously to perceptu-al ‘Fullness’ (Alluri and Toiviainen, 2010). The second PC, with the high-est loadings from spectral centroid, spectral roll-off, high energy–lowenergy ratio and zero crosssing ratemeasures the perceptual ‘Brightness’(Alluri and Toiviainen, 2010, 2012). PC3 represents the spread andflatness (Wiener entropy) of the spectrum. In perceptual terms, it canbe regarded to represent timbral complexity. As can further be seenfrom Fig. 1, each of the PCs from 4 through 8 has high contributionsfrom only one of the long-term features representing ‘Mode’, ‘RhythmicComplexity’, ‘Key Clarity’, ‘Pulse Clarity’, and ‘Event Synchronicity’ re-spectively (see Appendix A for details). PC 9 has the highest loadingsfrom roughness and flux of the high end of the spectrum. This can beregarded to represent ‘Activity’ (Alluri and Toiviainen, 2010, 2012).The loudness feature of the stimulus, characterized by RMS energy, failedto load highly onto any of these PCs suggesting that none of the PCs cor-related notably with RMS energy.
To validate the perceptual relevance of the labels given to theacoustic components, we conducted a perceptual listening experi-ment where participants were asked to rate selected segments repre-senting varying levels of the acoustic components on variousperceptual scales. The procedure is explained in detail as follows.
Perceptual experiment
StimuliWe selected nine sets of stimuli comprising 30 6-second segments
each, obtained from the stimulus used in the fMRI experiment. Foreach of the sets, the excerpts were chosen to represent varying levelsof one of the acoustic components. The acoustic component repre-senting mode was excluded, because according to initial analysis ofthe fMRI data it failed to display any significantly correlating areas.Additionally, we wanted to limit the duration of the experiment toavoid fatigue effects. To obtain the excerpts, for each acoustic compo-nent, the raw acoustic features were multiplied by the respective PCloadings. Subsequently, we averaged the hence obtained PC scoretime series within 6-second moving windows using a hop-size of1 s. Next, each of these averaged time series were rank ordered andsampled (n=30) equidistantly in order to obtain segments thatrepresented varying levels of the respective PC scores and spannedthe entire range of variation.
ParticipantsTwenty-one musicians (15 females, age M=23.7 years, SD=3.5)
participated in rating the music excerpts. All reported having formalmusic education (M=15.8 years, SD=6.1 years, minimum=3 years).They practiced on average 11.2 (SD=9) hours per week. Sevenreported familiarity with the piece Adios Nonino. All of the participantsreported listening to music the average being 12 h/week. None ofthese participants took part in the fMRI experiment. However, the twogroups shared similar demographic properties in terms of their agesas well as their musical and cultural backgrounds.
ProcedureThe participants were given written instructions, following which
the listening experiment took place in a silent room. To present thestimuli and obtain the ratings, a graphical interface was developedin Max/MSP. The experiment was divided into nine sections, in eachof which the participants were asked to rate the stimuli accordingto one of the scales. Each scale was divided into 9 levels with the ex-tremes of the scale indicating low and high values of the perceptualscale (e.g: 1 = Low Pulse Clarity, 9 = High Pulse Clarity), fromwhich the subject could choose the level that best described themusic excerpt presented. The participants were able to listen toeach excerpt as many times as they wished. The order of presentationof each of the sections and the music excerpts in each section wasrandomized. Prior to the actual experiment, the participants wereallowed to familiarize themselves with the working of the interface.
ResultsThe perceptual ratingswere initially checked for inconsistencies and
outliers. First, for each scale, the participants with a negative meaninter-subject correlation were eliminated. Following this, participantswith a mean inter-subject correlation two SDs below the overall meaninter-subject correlationwere eliminated. As a result, one to four partic-ipants were excluded for each scale. As visible in Table 1, Cronbach'salpha revealed high agreement between the participants' ratings, indi-cating fairly consistent opinions among listeners with respect to theperceptual scales. Therefore, for subsequent analysis, the individual rat-ings for each scalewere averaged across the participants. As can be seenfrom Table 2, significant correlationswere observed between the ratingscales of Fullness, Brightness, Timbral Complexity, Key Clarity, PulseClarity and Activity and the respective acoustic components. Theremaining scales of Rhythmic Complexity and Event Synchronicityfailed to correlate significantly with the corresponding acoustic compo-nents and were hence excluded from further analyses. Therefore, thetemporal evolutions of only the corresponding principal componentscores of these six PCs were used for further analysis and will hence-forth be referred to as acoustic components.
Statistical analysis
Initially, the inter-subject consistency of the fMRI data was checkedusing mean inter-subject correlation as a measure. The significance ofthe correlations was estimated by means of a Monte Carlo approach.Following this, we employed the correlation analysis approach utilizedby He et al. (2008). First, for each participant, the Pearson correlationcoefficients (r) were obtained per voxel and per acoustic component.The rmaps were then converted to respective Z-score maps using Fish-er's Z transformation, normalized by the factor 1/√(df−3), where dfrepresents the estimated number of effective degrees of freedom. Theeffective degrees of freedom were estimated using the approach de-scribed by Pyper and Peterman (1998) (see Appendix B for details).As a result, the effective degrees of freedom varied from a minimumof 29 (correction factor=7.97) to a maximum of 68 (correction fac-tor=3.40) across the acoustic components.

3681V. Alluri et al. / NeuroImage 59 (2012) 3677–3689
For each acoustic component, in order to obtain the group mapswe employed the combining tests procedure described by Lazar(2008). In this approach, individual Z-score maps were first con-verted to p-maps and were then pooled using the Fisher's p-valuetechnique (Fisher, 1950) to create the group maps. The individualp-values of each voxel were pooled using the equation below to ob-tain a T-statistic (Eq. (1)) that is modeled as a Chi-square distribu-tion with 2k degrees of freedom where k represents the number ofparticipants.
T ¼ −2Xk
i¼1
log pi: ð1Þ
Fig. 3. Lateral and mid-sagittal views of the left and right hemispheres of the brain showing rthe correlations was set at p=.001. Cluster correction was performed at a significance level olisted in Table 3. The areas indicated in red and blue correspond to the brain areas that cor
The group maps hence obtained for each component were thre-sholded at a significance level of pb .001. Following this, in order tomin-imize Type I errors, we corrected formultiple comparisons using clustersize thresholding. To determine the thresholds for multiple compari-sons correction, we performed a Monte Carlo simulation of the ap-proach described by Ledberg et al. (1998) (see Appendix B). As result,we obtained a cluster size threshold of 22 voxels for pb .001 (Z=3.29).
Results
Fig. 2 displays the results of the correlation analysis performed totest the consistency between the participants' fMRI responses. As canbe seen, relatively large areas of the brain were found to display
egions correlating significantly with timbral components. The significance threshold forf p=.001 (Z=3.29) corresponding to a cluster size of 22 voxels. The exact Z-values arerelated positively and negatively to each of the timbral components, respectively.

Table 3Correlation results between acoustic components and brain activity using a significance threshold pb .001. The clusters were obtained using the 18-connectivity scheme employedin SPM. The significant voxels were cluster corrected at Z>3.29 (pb .001 and cluster size>22). The coordinates are in Talairach space and indicate the location of the global max-imum within each cluster. For each cluster, ROI analysis was performed using MarsBar. Each cluster is numbered and named after the ROI containing the voxel with the maximal Z-value. The sub-clusters obtained from the ROI analysis are displayed under each main cluster. The coordinates for the sub-clusters are in Talairach space and indicate the location ofthe local maximum within each cluster.
Right hemisphere BA k x Y z Z-value Left hemisphere BA k x y z Z-value
(A) FullnessPositive correlation1. Superior temporal gyrus 22 2325 51 −14 1 7.35 5. Superior temporal gyrus 22 2283 −50 −21 3 7.34
Superior temporal gyrus 1646 51 −14 1 7.35 Superior temporal gyrus 1137 −50 −21 3 7.34Heschl's gyrus 203 50 −15 4 6.82 Heschl's gyrus 80 −53 −15 8 5.20Insula 17 50 −4 0 4.70 Middle temporal gyrus 890 −50 −19 1 6.94Postcentral gyrus 8 63 −15 14 3.78Rolandic operculum 193 40 −28 16 6.13 Rolandic operculum 64 −44 −28 14 6.23Supramarginal gyrus 100 50 −34 24 4.96 Supramarginal gyrus 13 −51 −25 14 4.71Superior temporal pole 20 53 2 −5 4.38
Cerebellum2. Inferior semi-lunar lobule 76 30 −78 −35 4.25
VIIB 1 26 −78 −36 3.58Crus II 75 30 −78 −35 4.25
3. Declive 39 32 −63 −17 3.76 6. Declive 39 −14 −73 −13 3.75VI 39 32 −63 −17 3.76 VI 39 −14 −73 −13 3.75
4. Tonsil 40 6 −45 −38 3.60IX 23 16 −47 −40 3.41
7. Uvula 79 −28 −63 −24 4.33VI 28 −28 −61 −24 4.18Crus I 50 −28 −63 −24 4.33VIIB 22 −8 −71 −30 3.95VIII 2 −8 −69 −30 3.50
8. Pyramis 66 −28 −68 −34 4.10VIIB 10 −28 −68 −34 4.10VIII 2 −26 −66 −34 3.45Crus II 54 −30 −70 −34 4.09
9. Pyramis 23 −20 −83 −31 4.01Crus II 23 −20 −83 −31 4.01
Negative correlation1. Postcentral gyrus 2 67 44 −23 49 3.66 3. Postcentral gyrus 3 191 −36 −31 48 4.19
Postcentral gyrus 67 44 −23 49 3.66 Postcentral gyrus 83 −36 −31 48 4.192. Inferior parietal lobule 40 31 40 −38 55 3.81 Inferior parietal gyrus 95 −32 −41 43 3.70
Inferior parietal gyrus 12 40 −38 52 3.41Superior parietal gyrus 9 40 −38 53 3.66Postcentral gyrus 10 40 −38 55 3.81
4. Middle frontal gyrus 11 27 −26 38 −19 4.09Inferior orbitofrontal gyrus 11 −30 42 −17 3.54
5. Superior parietal lobule 7 165 −18 −61 56 3.71Superior parietal gyrus 75 −18 −61 56 3.71Postcentral gyrus 18 −24 −42 56 3.58Precuneus 72 −16 −61 58 3.53
(B) BrightnessPositive correlation1. Superior temporal gyrus 22 3166 50 −19 3 8.13 6. Superior temporal gyrus 22 3245 −55 −15 3 8.13
Superior temporal gyrus 2070 50 −19 3 8.13 Superior temporal gyrus 1516 −55 −15 3 8.13Heschl's gyrus 225 48 −15 4 8.13 Heschl's gyrus 153 −53 −15 8 7.73Insula 51 50 −4 0 6.16 Insula 13 −46 −8 −1 4.50Postcentral gyrus 27 63 −15 14 5.01 Postcentral gyrus 3 −63 −21 16 3.41Rolandic operculum 274 40 −28 16 6.80 Rolandic operculum 109 −46 −28 14 6.89Supramarginal gyrus 99 48 −34 24 4.95 Supramarginal gyrus 16 −63 −23 14 5.37Middle temporal gyrus 90 46 −33 3 4.17 Middle temporal gyrus 1192 −59 −12 −3 8.13Temporal pole 74 51 2 −7 5.90 Temporal pole 11 −57 5 −9 4.40
2. Precentral Gyrus 6 64 55 0 41 4.05 7. Precentral gyrus 6 28 −55 0 42 4.39Precentral gyrus 53 55 0 41 4.05 Precentral gyrus 17 −55 0 42 4.39Middle frontal gyrus 11 51 −1 50 3.69 Postcentral gyrus 10 −55 0 41 4.21
3. Putamen 38 24 11 −6 3.63Putamen 36 24 11 −6 3.63
4. Putamen 30 14 10 1 3.38Putamen/pallidum 7 14 6 −4 3.33Putamen 10 22 12 5 3.26
Cerebellum5. Declive 186 −32 −63 −22 4.34
VI 102 −28 −59 −22 4.28CrusI 84 −32 −63 −22 4.34
Negative correlation1. Medial frontal gyrus 9 26 −20 42 15 3.68
Middle frontal gyrus 7 −20 43 14 3.63Superior frontal gyrus 2 −20 42 18 3.31
2. Posterior cingulate 29 26 −6 −44 10 3.50Calcrine 4 −6 −44 8 3.44
3682 V. Alluri et al. / NeuroImage 59 (2012) 3677–3689

Table 3 (continued)
Right hemisphere BA k x Y z Z-value Left hemisphere BA k x y z Z-value
Posterior cingulate 5 −6 −40 8 3.36Precuneus 9 −6 −44 10 3.50
(C) ActivityPositive correlation1. Superior temporal gyrus 22 2368 51 −14 1 7.92 5. Superior temporal gyrus 22 2378 −50 −21 3 7.48
Superior temporal gyrus 1632 51 −14 1 7.92 Superior temporal gyrus 1185 −50 −21 3 7.48Heschl's gyrus 211 50 −15 4 7.31 Heschl's gyrus 91 −53 −15 8 5.58Rolandic operculum 209 40 −28 16 6.26 Rolandic operculum 73 −44 −28 14 5.87Supramarginal gyrus 101 50 −34 24 4.63 Supramarginal gyrus 11 −53 −25 14 4.36Temporal pole 24 51 2 −5 4.67 Temporal pole 15 −57 7 −9 3.78Insula 24 50 −4 0 5.45 Middle temporal gyrus 893 −50 −19 1 7.09Postcentral gyrus 8 63 −15 14 3.87
2. Medial frontal gyrus 11 22 8 61 −15 3.69Medial frontal gyrus 22 8 61 −15 3.69
Cerebellum3. Inferior semi-lunar lobule 70 30 −79 −35 4.42 6. Uvula 91 −30 −63 −24 4.13
VIIB 1 26 −78 −36 3.60 VI 19 −28 −61 −24 3.96CrusII 69 30 −79 −35 4.42 CrusI 72 −30 −63 −24 4.13
4. Declive 50 32 −63 −15 3.89 7. Pyramis 106 −32 −70 −32 4.11VI 50 32 −63 −15 3.89 VIIB 8 −28 −68 −34 3.86
VIII 1 −26 −66 −34 3.40CrusII 97 −32 −70 −32 4.11
8. Declive 57 −16 −73 −13 3.91VI 57 −16 −73 −13 3.91
Negative correlation1. Postcentral gyrus 3 46 42 −25 49 3.51 2. Postcentral gyrus 3 137 −36 −31 48 4.26
Postcentral gyrus 46 42 −25 49 3.51 Postcentral gyrus 72 −36 −31 48 4.26Inferior parietal lobule 56 −38 −35 44 3.64
3. Superior parietal lobule 7 105 −18 −53 58 3.61Superior parietal lobule 46 −18 −53 58 3.61Postcentral gyrus 9 −24 −42 56 3.43Precuneus 50 −16 −53 58 3.47
4. Middle frontal gyrus 6 62 −32 8 46 3.63Middle frontal gyrus 24 −32 8 46 3.63Precentral gyrus 38 −32 6 44 3.60
5. Superior frontal gyrus 9 24 −20 52 25 3.48Superior frontal gyrus 24 −20 52 25 3.48Middle frontal gyrus 19 −22 52 27 3.48
(D) Timbral complexityPositive correlation1. Superior temporal gyrus 22 1804 53 −8 −1 7.05 2. Superior temporal gyrus 21 1787 −55 −12 −1 6.93
Superior temporal gyrus 1418 53 −8 −1 7.05 Superior temporal gyrus 973 −55 −12 −1 6.93Heschl's gyrus 163 51 −13 4 6.41 Heschl's gyrus 64 −50 −17 8 5.06Rolandic operculum 104 65 −5 8 4.83 Rolandic operculum 22 −42 −28 14 4.20Middle temporal gyrus 4 69 −25 0 3.71 Middle temporal gyrus 659 −57 −14 −1 6.78Insula 9 50 −4 0 4.50Postcentral gyrus 9 65 −11 13 3.66Temporal pole 43 53 2 −7 4.90
Cerebellum3. Declive 27 −26 −61 −22 4.19
VI 26 −26 −61 −22 4.19CrusI 1 −30 −63 −22 3.13
(E) Key clarityNegative correlation1. Precentral gyrus 6 306 59 −4 28 4.67
Postcentral gyrus 256 59 −4 28 4.67Precentral gyrus 44 63 3 22 4.09Rolandic operculum 1 61 −3 13 3.25Supramarginal gyrus 1 55 −12 26 3.31
2. Postcentral gyrus 3 82 48 −15 58 4.29 6. Postcentral gyrus 3 142 −44 −18 58 4.12Postcentral gyrus 24 50 −15 56 4.14 Postcentral gyrus 69 −44 −18 58 4.12Precentral gyrus 58 48 −15 58 4.29 Precentral gyrus 72 −42 −17 58 4.03
3. Postcentral gyrus 43 80 50 −14 21 4.29 7. Postcentral gyrus 43 86 −46 −9 17 4.23Insula 15 34 −17 17 4.29 Heschl's gyrus 4 −46 −11 10 3.39Rolandic operculum 62 50 −14 21 4.29 Postcentral gyrus 31 −53 −13 21 3.67
Rolandic operculum 45 −46 −9 17 4.234. Superior frontal gyrus 6 29 12 −12 67 3.83 8. Superior frontal gyrus 9 57 −8 52 31 3.82
Superior frontal gyrus 3 14 −12 67 3.23 Superior frontal gyrus 31 −10 52 31 3.74Paracentral lobule 1 8 −18 69 3.13 Medial frontal gyrus 26 −8 52 31 3.82Precentral gyrus 3 14 −14 67 3.52Supplementary motor area 22 12 −12 67 3.83
9. Claustrum 22 −34 −11 4 3.79Insula 12 −36 −13 4 3.68
(continued on next page)
3683V. Alluri et al. / NeuroImage 59 (2012) 3677–3689

Table 3 (continued)
Right hemisphere BA k x Y z Z-value Left hemisphere BA k x y z Z-value
Putamen 1 −32 −11 4 3.155. Cingulate gyrus 24 50 14 −6 44 3.66
Middle cingulate gyrus 27 14 −6 44 3.66Supplementary motor area 22 14 −4 44 3.54
(F) Pulse clarityPositive correlation1. Superior temporal gyrus 22 173 51 −8 0 4.30 3. Superior temporal gyrus 22 97 −61 −17 3 3.73
Superior temporal gyrus 153 51 −8 0 4.30 Superior temporal gyrus 74 −61 −17 3 3.73Heschl's gyrus 19 53 −10 4 3.73 Middle temporal gyrus 23 −55 −16 1 3.63Insula 1 50 −4 0 3.11
2. Superior temporal gyrus 41 26 40 −30 16 3.37Heschl's gyrus 2 38 −30 16 3.23Rolandic operculum 3 40 −30 18 3.26Superior temporal gyrus 21 40 −30 16 3.37
Negative correlation5. Claustrum 78 −32 −8 −8 4.15
Amygdala 5 −28 −8 −10 3.91Hippocampus 7 −30 −10 −10 3.76Insula 6 −36 −8 −8 3.42Putamen 11 −30 −10 −6 3.75
1. Cingulate gyrus 32 50 2 6 40 3.72 6. Cingulate gyrus 32 38 −2 6 40 4.01Cingulum mid 40 2 6 40 3.72 Cingulum mid 18 −2 6 40 4.01Supplementary motor area 10 4 6 42 3.40 Supplementary motor area 20 −2 8 40 3.94
2. Precuneus 7 23 12 −48 59 3.58Precuneus 15 12 −48 59 3.58Superior parietal lobule 8 14 −48 59 3.42
3. Insula 13 22 38 10 9 3.46 7. Insula 13 28 −38 12 5 3.57Insula 13 38 10 9 3.46 Insula 28 −38 12 5 3.57Inferior frontal operculum 9 40 10 11 3.44
4. Inferior temporal gyrus 97 48 −48 −18 4.10Fusiform gyrus 7 44 −47 −16 3.41Inferior temporal gyrus 90 48 −48 −18 4.10
3684 V. Alluri et al. / NeuroImage 59 (2012) 3677–3689
significant mean inter-subject correlations with the maximum foundin the auditory cortices (r=.64, pb .0001). Following this, we per-formed correlation analysis between the fMRI data and acoustic com-ponents. As described in Perceptual experiment, perceptualvalidation of the acoustic components resulted in a compact set ofsix acoustic components that represented the temporal evolution ofthe main timbral, tonal, and rhythmic features in the stimulus. Tim-bral components comprised perceived Fullness, Activity, Brightness,and Timbral complexity of the stimulus. Tonal and Rhythmic compo-nents comprised Key Clarity and Pulse Clarity respectively (audio ex-cerpts depicting examples of low levels and high levels of all sixacoustic components can be found as Supplementary material:AudiomaterialS1). First-level analysis comprised correlating thesesix components with fMRI time series at an individual level. Follow-ing this, second-level analysis involved pooling individual results toobtain group maps for each acoustic component. The results are dis-cussed below.
Timbral feature processing in the brain
Correlation analyses revealed that the presence of high valuesin all the timbral features namely Fullness, Brightness, TimbralComplexity and Activity, was associated with increased neuronalactivation in the bilateral STG (BA 22) (see Fig. 3). Additionally, alateralization effect was found wherein the right hemisphere dis-played positive correlations with timbral components in largerproportions of the HG, rolandic operculum, supramarginal gyrus,and superior temporal pole than the left hemisphere (seeTable 3). In contrast, the left hemispheric middle temporal gyrushad a larger proportion displaying such a correlation than itsright hemispheric counterpart (see Table 3 for details).
Another group of activations was found in the cerebellum. In par-ticular, high values of Fullness and Activity in the stimulus were
associated with increased activation in the declive, uvula, and pyra-mis (lobule VI, Crus I and II). Increase in the timbral components ofBrightness and Timbral Complexity was associated with increased ac-tivation in the declive only.
Outside of the auditory cortex and the cerebellum, we observed cer-ebrocortical areas correlating negatively with the timbral components.In particular, decreased Activity and Fullnesswas found to be associatedwith increased activations in the bilateral postcentral gyrus (BA 2 and3), and the left precuneus (BA 7). In addition, low levels of Fullnesswere associated with increased activations in the bilateral inferior pari-etal gyrus (BA 40), and those of Activity were associated with increasedactivations in the left superior frontal gyrus (BA 9) and left medial fron-tal gyrus (BA 6). Increased activations in the right medial frontal gyrus(BA 11) were found to be associated with increasing Activity.
Furthermore, increase in Brightness recruited the bilateral precen-tral gyrus (BA 6), and the right putamen. Reduced levels of Brightnessin the stimulus, on the other hand were associated with increased ac-tivations in two left hemispheric clusters of the medial frontal gyrus(BA 9) and the posterior cingulate cortex (BA 29). No negative corre-lations were found for Timbral Complexity.
Rhythmic and tonal feature processing in the brain
High levels of Pulse Clarity were linked with increased activationin the bilateral STG (BA 22), as well as the right primary auditory cor-tex (BA 41) (see Fig. 4 and Table 3). In contrast, decreased Pulse Clar-ity recruited the right inferior temporal gyrus (ITG, BA 37) andprecuneus (BA 7). In addition, decreased Pulse Clarity was associatedwith high levels of activation in several subcortical limbic areas in-cluding the left hemispheric amygdala, hippocampus and putamen,the bilateral mid-cingulate gyrus (BA 32) in the vicinity of the supple-mentary motor area, and the bilateral insula (BA 13).

Fig. 4. Lateral and mid-sagittal views of the left and right hemispheres of the brain showing regions correlating significantly with Pulse Clarity and Key Clarity components. Thesignificance threshold for the correlations was set at p=.001. Cluster correction was performed at a significance level of p=.001 (Z=3.29) corresponding to a cluster size of 22voxels. The exact Z-values are listed in Table 3. The areas indicated in red and blue correspond to the brain areas that correlated positively and negatively to each of the components,respectively.
3685V. Alluri et al. / NeuroImage 59 (2012) 3677–3689
The presence of unclear key (i.e., low levels of Key Clarity) wasfound to be associated with increased activation in cortical and sub-cortical areas such as parts of the bilateral precentral gyrus (BA 3),the right mid-cingulate gyrus (BA 24) in the vicinity of the supple-mentary motor area and right postcentral (BA 6) gyrus, and the lefthemispheric superior frontal gyrus (BA 9), the left insula and the bi-lateral rolandic operculum (see Fig. 4). No positive correlationswere observed for Key Clarity.
Discussion
In the present study, we investigated the neural correlates of tim-bral, tonal, and rhythmic feature processing of a naturalisticmusic stim-ulus. To this end we employed a novel paradigm combiningneuroimaging, computational acoustic feature extraction and behavior-al psychology. Participants were scanned using fMRI while they freelylistened to the musical piece Adios Nonino by Astor Piazzolla. First,inter-subject consistency on a voxel-by-voxel basis was evaluatedusing mean inter-subject correlation as a measure. Following this, theevolution of musical features in the piece was obtained using sophisti-cated acoustic feature extraction procedures. Based on a perceptualtest we selected a set of six acoustic components representing themain timbral, tonal, and rhythmic features present in this piece. Follow-ing this, the neural underpinnings of these acoustic components wereinvestigated by correlating their time series with the time series of theBOLD signal. Overall, our results highlighted the brain structures re-sponsible for the processing of an extensive set of timbral, tonal andrhythmic features. The results corroborate findings reported in previousneuroimaging studies, which have used artificial and acoustically re-duced conditions to investigate musical feature processing. Moreover,they also highlight additional brain structures involved in musical fea-ture processing. Timbral features activated mainly perceptual andresting-state or default mode areas of the cerebrum and cognitiveareas of the cerebellum. In contrast, for tonal and rhythmic features,we observed for the first time during listening to a naturalistic stimulus,
activations in subcortical emotion-related areas along with activationsin cognitive and somatomotor cerebrocortical areas.
Timbre-related acoustic components correlated positively with acti-vations in large areas of the temporal lobe (STG, HG, and MTG) (seeFig. 3). These areas weremostly activated duringmoments of high Full-ness, Activity, Brightness and Timbral Complexity, whichwere often as-sociated with quicker passages in the stimulus with several pitchesusually played by several instruments. While there exists a dearth ofstudies regarding neural correlates of timbre processing in a musicalcontext, or polyphonic timbre processing, evidence from neural studieson monophonic timbre has repeatedly pointed at the involvement ofthe bilateral STG and HG (Caclin et al., 2006; Halpern et al., 2004). Thecurrent findings suggest that the same brain areas are recruited in poly-phonic timbre processing. As hypothesized based on Samson et al.(2011), we found the caudolateral and anteriolateral parts of the STG,specifically in the right hemisphere to be involved in timbral featureprocessing. Furthermore, this finding also supports our hypothesis ofinterhemispheric specialization in the auditory cortices with regard tothe processing of timbral features, with the right temporal lobe display-ing larger areas with significant correlations with these features.
Negative correlations between timbral features of Activity andFullness and brain activity were observed in cerebrocortical regionsin the vicinity of the left superior frontal gyrus (BA 9), the left precu-neus and surrounding parietal areas, and the ventral medial prefron-tal cortex. These areas are known to be part of the default modenetwork (DMN). The DMN is a neural circuit constantly monitoringthe sensory environment and displaying high activity during lack offocused attention on external events (Fox et al., 2009; McAvoy etal., 2008). As low values in Activity and Fullness were mostly associ-ated with sections in the stimulus with sparse texture played by thepiano, thereby resulting in lower levels of auditory–cognitive load,the activation of the DMN during these moments is in line with pre-vious results (Levitin and Menon, 2003; Pallesen et al., 2009; Uddinet al., 2009). In the visual modality, a network comprising severalparietal areas such as the precuneus and the supramarginal gyrus

3686 V. Alluri et al. / NeuroImage 59 (2012) 3677–3689
has been found to be highly activated with reduced visual attention orload (Hahn et al., 2006). Similarly, the left posterior cingulate, one ofthe central structures of the DMN, was observed to be deactivatedduring moments in the stimulus with high Brightness, which wereassociated with the presence of several instruments playing simulta-neously. This finding appears to be in line with those discussed byLevitin and Menon (2003) regarding the deactivations in the posteriorcingulate cortex in response to taxing auditory and visual cognitivetasks. Activations in the right putamen and the bilateral precentralgyrus as well as the right medial frontal gyrus, which appear to be re-lated to movement (Grahn and Rowe, 2009), were found to correlatepositively with Brightness and Activity, respectively. Uddin et al.(2009) showed that these same motor-control areas are functionallyconnected to the anticorrelated DMN associated with the posteriorcingulate cortex. Further research, however, is called for to clarify thelink between Brightness and motor-related brain activity.
In addition to the DMN, negative correlations for timbral featuresof Activity and Fullness were observed in the somatosensory areas(BA 2, 3 and 40). Previous studies investigating the mirror neuronsystem (Keysers et al., 2010; Koelsch et al., 2006) found that the pri-mary somatosensory (BA 2) and secondary somatosensory areaswere recruited while hearing sounds resulting from other people's ac-tions. As nine out of the eleven participants reported playing thepiano as their primary or secondary instrument, one could postulatethat listening to the piano parts may have activated somatosensoryareas that would be active during actual piano playing.
Interestingly, areas of the cerebellum, including lobule VI, Crus I andII, were found to be involved in processing timbre-related acoustic com-ponents. According to a meta-analysis by Stoodley and Schmahmann(2009), these areas are known to be the cognitive regions of the cere-bellum. Additionally, the involvement of Crus I and II in conjunctionwith the superior parietal lobule, lateral prefrontal cortex, and dorsalpremotor cortex, in processing high cognitive load in an auditory taskwith chords was found by Salmi et al. (2010). As mentioned earlier,high levels of Fullness and Activity in the stimulus were associatedwith high levels of auditory-related cognitive load. Hence, our resultsfor the first time demonstrate the role of the cerebellum in cognitiveprocessing while listening to a naturalistic music stimulus.
Previously, the scarce attempts at identifying the neural struc-tures responsible for tonality processing have utilized chord ca-dences especially composed or simple and repetitive melody lines(Janata et al., 2002a, 2002b). In the present study, this implicit com-plex cognitive skill has for the first time been investigated usingcontinuous expressive real music. Janata et al. (2002a, 2002b) iden-tified the rostromedial prefrontal cortex as a possible brain substratefor tonal encoding. While, contrary to our expectations, we failed tofind significant correlations either in that area or the hippocampus,we observed that the time series for key clarity negatively corre-lated with activations in the superior frontal gyrus (BA 9), previous-ly related to beauty judgments of sound patterns (Kornysheva et al.,2010), and several brain areas related to somatomotor processing,particularly concentrated in BA 6 and 3 (the precentral and postcen-tral gyri and the supplementary motor area) (see Fig. 4).
Importantly, we further found that decreasing clarity in the keyof the musical stimulus activated inner encephalic structures relat-ed to emotion processing such as the claustrum and anterior cin-gulate (Etkin et al., 2010). Among the auditory areas, only theleft HG and the bilateral rolandic operculum were activated duringprocessing music with unclear key. The rolandic operculum of thepremotor cortex is known to play an important role in speech ar-ticulation and phonological rehearsal (Brown et al., 2005). Previ-ous studies have further revealed that the rolandic operculum inconjunction with the insular cortex is known to play an importantrole in overt and covert singing (Jeffries et al., 2003). This activa-tion, coupled with the ones in the precentral and postcentralgyri, support the link between spontaneous singing and key
processing. However, further investigations are required to ascer-tain this link. Koelsch et al. (2006) in their fMRI study contendthat the rolandic operculum in conjunction with the anterior supe-rior insula, and ventral striatum are recruited in non-musicianswhile processing pleasant music, in contrast to unpleasant highlyatonal counterparts (which were created electronically by pitch-shifting thereby causing them to sound very unnatural or farfrom ‘real world’ music). Based on our findings we could postulatethat the participants found the tonally less clear parts of the stim-ulus to be more pleasant than the tonally more clear parts. Thisfinding could be explained in light of the theory advocated byMeyer (1956) according to which one important device for elicit-ing pleasurable emotions in music listening is the tension evokedby the violation of expectations, such as when a key is uncleardue to the presence of complex harmonies (Sloboda, 1991). How-ever, more studies with an ecological listening setting are neededto clarify the relation between key clarity and emotion induction relat-ed to violated expectation. Furthermore, the network of these brainareas in conjunctionwith activations in themedial frontal brain regions(BA 9), has been previously postulated to be involved in the processingof affect-related evaluation and classification in music (Khalfa et al.,2005) and with internal self-monitoring and evaluative processing, es-pecially in an aesthetic context. For instance, activity in this region wasobserved when asking subjects to judge the beauty of a painting or ablack-and-white abstract shape or even a rhythmic drum sequence(Jacobsen et al., 2006; Kornysheva et al., 2010). These results furtherhint at a link between key processing and aesthetic appreciation.
In line with our hypothesis, for the rhythmic component, PulseClarity, we found correlations in the auditory cortices (BA 22 and41), the motor cortex, basal ganglia structures (putamen), and severalregions of the limbic system (cingulate gyrus, insula) and the rightITG (BA 37). While the activations in the areas of the auditory cortexdisplayed positive correlations, the remaining areas correlatednegatively.
The negative correlation of Pulse Clarity with the putamen indi-cates that it was highly activated during segments of the music withunclear pulse, suggesting the participants were internally generatingthe pulse during those moments (Grahn and Rowe, 2009). Important-ly, the activations in interior brain structures belonging to the limbicsystem in the vicinity of the amygdala, and the middle cingulate gyrusin the vicinity of the supplementary motor area, have not been ob-served to be active in previous studies where pulse was artificiallymanipulated or where participants were asked to tap and extractthe pulse within complex rhythmic patterns. As Low Pulse Clarity im-plies low temporal predictability, the present finding is in line withthat of Engel and Keller (2011), who report similar activationswhen comparing temporally unpredictable improvizations withtheir more predictable imitations. Blood and Zatorre (2001) foundthat limbic and reward areas are recruited during music-inducedchills. In addition, they emphasize the similarity of these results tothose obtained from euphoria-related and pleasant emotion-relatedbrain imaging studies. Moreover, recent evidence suggests thatthese inner brain structures are recruited especially during intensepleasurable sensations to music (Salimpoor et al., 2011). In light ofthese findings, one could postulate that lack of clarity in the perceivedpulse causes tension, which could be pleasurable thereby resulting inthe activation of reward circuits in their brains. The present studythus demonstrates for the first time a neural link between rhythmperception and activity of brain structures associated with emotionsin a realistic listening condition.
Interestingly, we found that the right ITG (BA 37) to be activatedduring moments of Low Pulse Clarity. While the ITG (BA 37) hasbeen associated previously with visual processing, Levitin andMenon (2003) found the left ITG to be more activated during scram-bled music listening conditions in comparison to their unscrambledcounterparts. These findings hint at the possible role of the ITG in

3687V. Alluri et al. / NeuroImage 59 (2012) 3677–3689
processing predictability of temporal order. However, this hypothesisis open to question and requires further investigation.
With regard to inter-subject consistency, one could expect thevoxels that correlate significantly with the acoustic components todisplay overall significant mean inter-subject correlations. Indeedthis was found to be true (see Appendix Table C.1). In particular thetimbral and rhythmic components displayed on average significantmean inter-subject correlations. However, this was not true for KeyClarity. This finding could be attributed to the fact that key can beconsidered a high level musical concept, the processing of which isbased on schematic knowledge that emerges as a result of prior expo-sure to music (Krumhansl, 1990). Consequently, one could assumethe presence of relatively large inter-individual variability in the pro-cessing of Key Clarity (see Brattico, 2011; Brattico and Jacobsen,2009).
Conclusions
To sum up, the current study introduced a new paradigm to inves-tigate and predict the neural mechanisms related to the processingof timbral, tonal, and rhythmic features while listening to a naturalis-tic stimulus. A notable result of this novel naturalistic approachemployed is that, in addition to corroborating findings from previouscontrolled settings, it revealed additional brain areas involved inmusic feature processing. First, cognitive areas of the cerebellum aswell as sensory and DNM-related cortical areas were found to be in-volved in timbral feature processing. Second, the results demonstratethe recruitment of limbic and reward areas in the processing of musi-cal pulse. Finally, processing of tonality was found to involve cogni-tive and emotion-related regions of the brain. These findingsadvocate the use of more ecological paradigms in future studies inorder to obtain a more comprehensive picture of music processingin the brain.
As can be seen in Fig. 3, there exists considerable overlap in theareas of the brain that correlate significantly with the timbral compo-nents, especially Activity and Fullness. This overlap can be attributedto the covariance in the acoustic components representing timbre(see Appendix Table C.2). Covariance in acoustic features is inevitableespecially in naturalistic stimulus. Nevertheless, it is noteworthy thatthere hardly exists overlap between timbral, rhythmic and tonalcomponents.
In addition to the aforementioned areas, high inter-subject con-sistency was observed in some areas that failed to correlate signifi-cantly with the present set of acoustic components. This findingsuggests that additional acoustic components are needed to accountfor these stimulus-related activations. This calls for an expansion ofthe acoustic feature set to obtain a more comprehensive picture ofprocessing of the musical elements in the brain. A potential con-founding factor in the present paradigm is the covariance betweenthe acoustic components. The presence of between-component co-variance would render it more demanding to tease out the uniqueindividual contributions of the components to evoked activations.However the correlation between the acoustic components repre-senting timbral, rhythmic and tonal aspects was found to be atmost moderate suggesting that they represented mutually relative-ly independent musical aspects of the stimulus. Conducting furtherexperiments with larger sets of naturalistic stimuli representing, forinstance, different genres, as well as with musically untrained lis-teners, would allow for generalizations concerning the brain net-works involved in processing musical features in real time. Inaddition, the results obtained in the present study using the data-driven paradigm could serve as a basis for future hypothesis-driven studies.
Supplementary materials related to this article can be found on-line at doi:10.1016/j.neuroimage.2011.11.019.
Acknowledgments
The authors wish to thank Geoff Luck for his help. This researchwas supported by the Academy of Finland (project numbers7118616, 130412 and 138145) and by the aivoAALTO project of theAalto University.
Appendix A
Acoustic features
The features were extracted from the stimulus on a frame-by-frame basis (see Alluri and Toiviainen (2010) for more details). Awindow length of 25 ms with a 50% overlap was used to extract theshort-term (timbral) features and a frame size of 3 s with a 33% over-lap was used to extract the long-term (tonal and rhythmic) features.
A brief description of each of the acoustic features is presentedbelow. A detailed explanation can be found in the user manual ofthe MIRToolbox (Lartillot and Toiviainen, 2007).
LoudnessRoot Mean Square Energy: measure of instantaneous energy con-
tained in the signal, obtained by taking the square root of sum of thesquares of the amplitude.
Timbral featuresZero crossing rate (ZCR): number of time-domain zero crossings
of the signal per time unit.Spectral centroid: geometric center on the frequency scale of the
amplitude spectrum.High energy–low energy ratio: ratio of energy content below and
above 1500 Hz.Spectral entropy: the relative Shannon entropy (1948) calculated
using the equation Eq. (A.1)
Ht ¼ −
PN
n¼1At n½ � logAt n½ �
logNðA:1Þ
where At is the amplitude spectrum of audio frame at time t and N isthe number of frequency bins in the amplitude spectrum. The relativeShannon entropy indicates whether the spectrum contains predomi-nant peaks or not. For example, a single sine tone has minimal entro-py and white noise maximal.
Spectral roll-off: frequency below which 85% of the total energyexists.
Spectral flux: measure of temporal change in the spectrum,obtained by calculating the Euclidian distance between subsequentwindow-based amplitude spectra.
Spectral spread: standard deviation of the spectrum.Spectral flatness: Wiener entropy of the spectrum, defined as the
ratio of its geometric mean to its arithmetic mean.Sub-Band Flux (10 features in total): measure of fluctuation of fre-
quency content in ten octave-scaled sub-bands of the spectrum(Alluri and Toiviainen, 2010).
Roughness: estimate of sensory dissonance (Sethares, 1998).
Tonal featuresMode: strength of major of minor mode (Saari et al., in press).Key clarity: measure of the tonal clarity (Gómez, 2006; Krumhansl,
1990; Saari et al., in press).
Rhythmic featuresFluctuation centroid: geometric mean of the fluctuation spectrum
representing the global repartition of rhythm periodicities within the
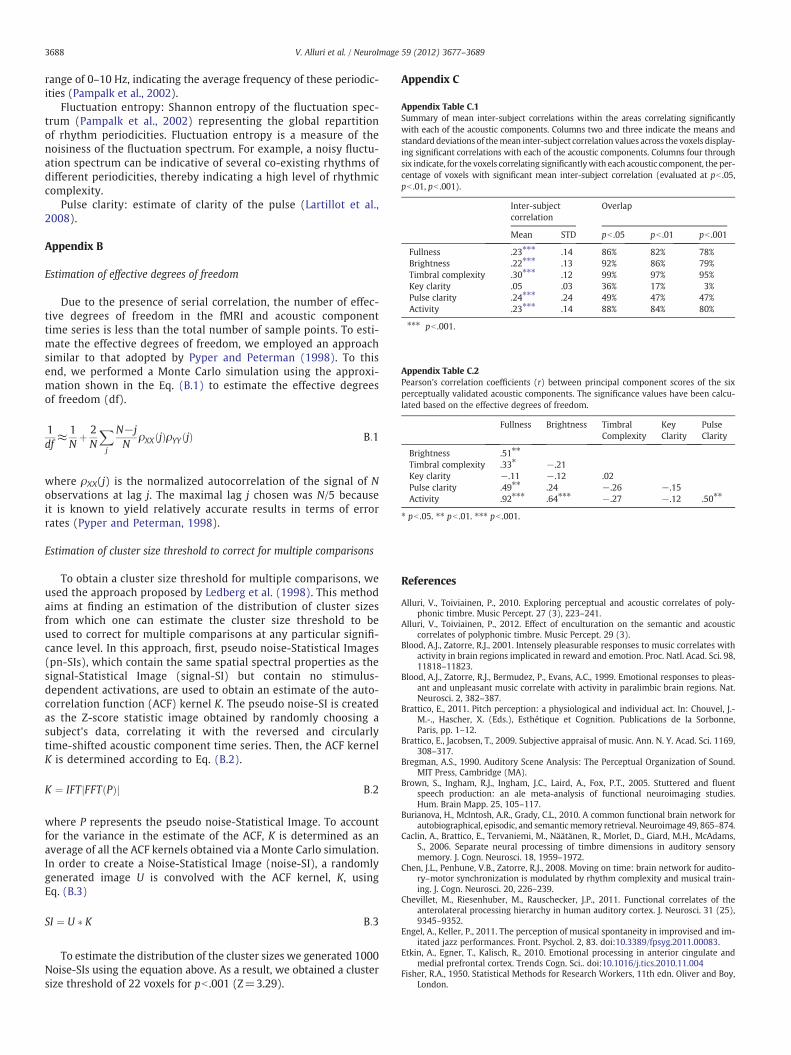
Appendix Table C.1Summary of mean inter-subject correlations within the areas correlating significantlywith each of the acoustic components. Columns two and three indicate the means andstandard deviations of themean inter-subject correlation values across the voxels display-ing significant correlations with each of the acoustic components. Columns four throughsix indicate, for the voxels correlating significantlywith each acoustic component, the per-centage of voxels with significant mean inter-subject correlation (evaluated at pb .05,pb .01, pb .001).
Inter-subjectcorrelation
Overlap
Mean STD pb .05 pb .01 pb .001
Fullness .23⁎⁎⁎ .14 86% 82% 78%Brightness .22⁎⁎⁎ .13 92% 86% 79%Timbral complexity .30⁎⁎⁎ .12 99% 97% 95%Key clarity .05 .03 36% 17% 3%Pulse clarity .24⁎⁎⁎ .24 49% 47% 47%Activity .23⁎⁎⁎ .14 88% 84% 80%
⁎⁎⁎ pb .001.
Appendix Table C.2Pearson's correlation coefficients (r) between principal component scores of the sixperceptually validated acoustic components. The significance values have been calcu-lated based on the effective degrees of freedom.
Fullness Brightness TimbralComplexity
KeyClarity
PulseClarity
Brightness .51⁎⁎
Timbral complexity .33⁎ −.21Key clarity −.11 −.12 .02Pulse clarity .49⁎⁎ .24 −.26 −.15Activity .92⁎⁎⁎ .64⁎⁎⁎ −.27 −.12 .50⁎⁎
⁎ pb .05. ⁎⁎ pb .01. ⁎⁎⁎ pb .001.
3688 V. Alluri et al. / NeuroImage 59 (2012) 3677–3689
range of 0–10 Hz, indicating the average frequency of these periodic-ities (Pampalk et al., 2002).
Fluctuation entropy: Shannon entropy of the fluctuation spec-trum (Pampalk et al., 2002) representing the global repartitionof rhythm periodicities. Fluctuation entropy is a measure of thenoisiness of the fluctuation spectrum. For example, a noisy fluctu-ation spectrum can be indicative of several co-existing rhythms ofdifferent periodicities, thereby indicating a high level of rhythmiccomplexity.
Pulse clarity: estimate of clarity of the pulse (Lartillot et al.,2008).
Appendix B
Estimation of effective degrees of freedom
Due to the presence of serial correlation, the number of effec-tive degrees of freedom in the fMRI and acoustic componenttime series is less than the total number of sample points. To esti-mate the effective degrees of freedom, we employed an approachsimilar to that adopted by Pyper and Peterman (1998). To thisend, we performed a Monte Carlo simulation using the approxi-mation shown in the Eq. (B.1) to estimate the effective degreesof freedom (df).
1df
≈ 1Nþ 2N
X
j
N−jN
ρXX jð ÞρYY jð Þ B:1
where ρXX(j) is the normalized autocorrelation of the signal of Nobservations at lag j. The maximal lag j chosen was N/5 becauseit is known to yield relatively accurate results in terms of errorrates (Pyper and Peterman, 1998).
Estimation of cluster size threshold to correct for multiple comparisons
To obtain a cluster size threshold for multiple comparisons, weused the approach proposed by Ledberg et al. (1998). This methodaims at finding an estimation of the distribution of cluster sizesfrom which one can estimate the cluster size threshold to beused to correct for multiple comparisons at any particular signifi-cance level. In this approach, first, pseudo noise-Statistical Images(pn-SIs), which contain the same spatial spectral properties as thesignal-Statistical Image (signal-SI) but contain no stimulus-dependent activations, are used to obtain an estimate of the auto-correlation function (ACF) kernel K. The pseudo noise-SI is createdas the Z-score statistic image obtained by randomly choosing asubject's data, correlating it with the reversed and circularlytime-shifted acoustic component time series. Then, the ACF kernelK is determined according to Eq. (B.2).
K ¼ IFT FFT Pð Þj j B:2
where P represents the pseudo noise-Statistical Image. To accountfor the variance in the estimate of the ACF, K is determined as anaverage of all the ACF kernels obtained via a Monte Carlo simulation.In order to create a Noise-Statistical Image (noise-SI), a randomlygenerated image U is convolved with the ACF kernel, K, usingEq. (B.3)
SI ¼ U � K B:3
To estimate the distribution of the cluster sizes we generated 1000Noise-SIs using the equation above. As a result, we obtained a clustersize threshold of 22 voxels for pb .001 (Z=3.29).
Appendix C
References
Alluri, V., Toiviainen, P., 2010. Exploring perceptual and acoustic correlates of poly-phonic timbre. Music Percept. 27 (3), 223–241.
Alluri, V., Toiviainen, P., 2012. Effect of enculturation on the semantic and acousticcorrelates of polyphonic timbre. Music Percept. 29 (3).
Blood, A.J., Zatorre, R.J., 2001. Intensely pleasurable responses to music correlates withactivity in brain regions implicated in reward and emotion. Proc. Natl. Acad. Sci. 98,11818–11823.
Blood, A.J., Zatorre, R.J., Bermudez, P., Evans, A.C., 1999. Emotional responses to pleas-ant and unpleasant music correlate with activity in paralimbic brain regions. Nat.Neurosci. 2, 382–387.
Brattico, E., 2011. Pitch perception: a physiological and individual act. In: Chouvel, J.-M.-., Hascher, X. (Eds.), Esthétique et Cognition. Publications de la Sorbonne,Paris, pp. 1–12.
Brattico, E., Jacobsen, T., 2009. Subjective appraisal of music. Ann. N. Y. Acad. Sci. 1169,308–317.
Bregman, A.S., 1990. Auditory Scene Analysis: The Perceptual Organization of Sound.MIT Press, Cambridge (MA).
Brown, S., Ingham, R.J., Ingham, J.C., Laird, A., Fox, P.T., 2005. Stuttered and fluentspeech production: an ale meta-analysis of functional neuroimaging studies.Hum. Brain Mapp. 25, 105–117.
Burianova, H., McIntosh, A.R., Grady, C.L., 2010. A common functional brain network forautobiographical, episodic, and semanticmemory retrieval. Neuroimage 49, 865–874.
Caclin, A., Brattico, E., Tervaniemi, M., Näätänen, R., Morlet, D., Giard, M.H., McAdams,S., 2006. Separate neural processing of timbre dimensions in auditory sensorymemory. J. Cogn. Neurosci. 18, 1959–1972.
Chen, J.L., Penhune, V.B., Zatorre, R.J., 2008. Moving on time: brain network for audito-ry–motor synchronization is modulated by rhythm complexity and musical train-ing. J. Cogn. Neurosci. 20, 226–239.
Chevillet, M., Riesenhuber, M., Rauschecker, J.P., 2011. Functional correlates of theanterolateral processing hierarchy in human auditory cortex. J. Neurosci. 31 (25),9345–9352.
Engel, A., Keller, P., 2011. The perception of musical spontaneity in improvised and im-itated jazz performances. Front. Psychol. 2, 83. doi:10.3389/fpsyg.2011.00083.
Etkin, A., Egner, T., Kalisch, R., 2010. Emotional processing in anterior cingulate andmedial prefrontal cortex. Trends Cogn. Sci.. doi:10.1016/j.tics.2010.11.004
Fisher, R.A., 1950. Statistical Methods for Research Workers, 11th edn. Oliver and Boy,London.

3689V. Alluri et al. / NeuroImage 59 (2012) 3677–3689
Fox, M.D., Zhang, D., Snyder, A.Z., Raichle, M.E., 2009. The Global Signal and ObservedAnticorrelated Resting State Brain Networks. J. Neurophysiol. 101 (6), 3270–3283.
Fraisse, P., 1982. Rhythm and tempo. In: Deutsch, D. (Ed.), Psychol. Music. AcademicPress, New York.
Friston, K.J., Josephs, O., Zarahn, E., Holmes, A.P., Rouquette, S., Poline, J.-B., 2000. Tosmooth or not to smooth? Neuroimage 12, 196–208.
Gómez, E., 2006. Tonal description of music audio signal. PhD Thesis, Universitat Pom-peu Fabra, Barcelona.
Grahn, J.A., Rowe, J.B., 2009. Feeling the beat: premotor and striatal interactions in mu-sicians and nonmusicians during beat perception. J. Neurosci. 29, 7540–7548.
Hahn, B., Ross, T.J., Stein, E.A., 2006. Neuroanatomical dissociation between bottom-upand top-down processes of visuospatial selective attention. Neuroimage 32, 842–853.
Halpern, A.R., Zatorre, R.J., Bouffard, M., Johnson, J.A., 2004. Behavioral and neural corre-lates of perceived and imagined musical timbre. Neuropsychologia 42, 1281–1292.
Harrington, D.L., Haaland, K., Hermanowicz, N., 1998. Temporal processing in the basalganglia. Neuropsychology 12, 3–12.
Hasson, U., Nir, Y., Levy, I., Fuhrmann, G., Malach, R., 2004. Intersubject synchronizationof cortical activity during natural vision. Science 303, 1634–1640.
He, B.J., Snyder, A.Z., Zempel, J.M., Smyth, M.D., Raichle, M.E., 2008. Electrophysiologicalcorrelates of the brain's intrinsic large-scale functional architecture. Proc. Natl.Acad. Sci. 105, 16039–16044.
Jacobsen, T., Schubotz, R.I., Hofel, L., Cramon, D.Y., 2006. Brain correlates of aestheticjudgment of beauty. Neuroimage 29 (1), 276–285.
Janata, P., 2005. Brain networks that track musical structure. Ann. N. Y. Acad. Sci. 1060,111–124.
Janata, P., Grafton, S., 2003. Swinging in the brain: shared neural substrates for behav-iors related to sequencing and music. Nat. Neurosci. 6, 682–687.
Janata, P., Birk, J.L., van Horn, J.D., Leman,M., Tillmann, B., Bharucha, J.J., 2002a. The corticaltopography of tonal structures underlying western music. Science 298, 2167–2170.
Janata, P., Tillmann, B., Bharucha, J.J., 2002b. Listening to polyphonic music recruitsdomain-general attention and working memory circuits. Cogn. Affect. Behav. Neu-rosci. 2, 121–140.
Jeffries, K., Fritz, J., Braun, A., 2003. Words in melody: an H215O PET study of brain acti-
vation during singing and speaking. Neuroreport 14, 749–754.Keysers, C., Kaas, J.H., Gazzola, V., 2010. Somatosensation in social perception. Nat. Rev.
Neurosci. 11, 417–428.Khalfa, S., Schon, D., Anton, J.L., Liegeois-Chauvel, C., 2005. Brain regions involved in the
recognition of happiness and sadness in music. Neuroreport 16, 1981–1984.Koelsch, S., Fritz, T., von Cramon, D.Y., Muller, K., Friederici, A.D., 2006. Investigating
emotion with music: an fMRI study. Hum. Brain Mapp. 27, 239–250.Kornysheva, K., von Cramon, D.Y., Jacobsen, T., Schubotz, R.I., 2010. Tuning-in to the
beat: aesthetic appreciation of musical rhythms correlates with a premotor activityboost. Hum. Brain Mapp. 31 (1), 48–64.
Krumhansl, C.L., 1990. Cognitive Foundations of Musical Pitch. Oxford University Press,Oxford.
Lartillot, O., Toiviainen, P., 2007. MIR in Matlab (II): a toolbox for musical feature ex-traction from audio. In: Dixon, S., Bainbridge, D., Typke, Rainer (Eds.), Proc. Intl.Conf. Music Inform. Retrieval, pp. 237–244.
Lartillot, O., Eerola, T., Toiviainen, P., Fornari, J., 2008. Multi-feature modeling of pulseclarity: design, validation, and optimization. Proc. ISMIR, Philadelphia.
Lazar, N.A., 2008. The statistical analysis of functional MRI data. Springer, New York.Ledberg, A., Akerman, S., Roland, P.E., 1998. Estimation of the probabilities of 3D clus-
ters in functional brain images. Neuroimage 8, 113–128.Levitin, D.J., Menon, V., 2003. Musical structure is processed in “language” areas of the
brain: a possible role for Brodmann area 47 in temporal coherence. Neuroimage20, 2142–2152.
Mcavoy, M., Larson-Prior, L., Nolan, T.S., Vaishnavi, S.N., Raichle, M.E., d'Avossa, G.,2008. Resting states affect spontaneous BOLD oscillations in sensory and paralim-bic cortex. J. Neurophysiol. 100 (2), 922–931.
Meyer, L.B., 1956. Emotion and meaning in music. University of Chicago Press, Chicago.Pallesen, K.J., Brattico, E., Bailey, C.J., Korvenoja, A., Gjedde, A., 2009. Cognitive and
emotional modulation of brain default operation. J. Cogn. Neurosci. 21 (6),1065–1080.
Pampalk, E., Rauber, A., Merkl, D., 2002. Content-based organization and visualizationof music archives. Proc. IEEE ACM-MM, pp. 570–579.
Pantev, C., Roberts, L.E., Schulz, M., Engelien, A., Ross, B., 2001. Timbre-specific en-hancement of auditory cortical representations in musicians. Neuroreport 12,169–174.
Patterson, R.D., Uppenkamp, S., Johnsrude, I.S., Griffiths, T.D., 2002. The processingof temporal pitch and melody information in auditory cortex. Neuron 36,767–776.
Pyper, B.J., Peterman, R.M., 1998. Comparison of methods to account for autocorrela-tion in correlation analyses of fish data. Can. J. Fish. Aquat. Sci. 55, 2127–2140.
Rao, S.M., Mayer, A.R., Harrington, D.L., 2001. The evolution of brain activation duringtemporal processing. Nat. Neurosci. 4, 317–323.
Saari, P., Eerola, T., Lartillot, O., 2011. Generalizability and Simplicity as Criteria inFeature Selection: Application to Mood Classification in Music. IEEE Transactionson Audio, Speech, and Language Processing 19 (6), 1802–1812. doi:10.1109/TASL.2010.2101596.
Salimpoor, V., Benovoy, M., Larcher, K., Dagher, A., Zatorre, R.J., 2011. Anatomically dis-tinct dopamine release during anticipation and experience of peak emotion tomusic. Nat. Neurosci. 14 (2), 257–262.
Salmi, J., Pallesen, K.J., Neuvonen, T., Brattico, E., Korvenoja, A., Salonen, O., et al., 2010.Cognitive and motor loops of the human cerebro-cerebellar system. J. Cogn. Neu-rosci. 22, 2663–2676.
Samson, F., Zeffiro, A.T., Toussaint, A., Belin, P., 2011. Stimulus complexity and categor-ical effects in human auditory cortex: an activation likelihood estimation meta-analysis. Front. Psychol. 1, 1–23.
Schaefer, R.S., Desain, P., Suppes, P., 2009. Structural decomposition of EEG signaturesof melodic processing. Biol. Psychol. 82, 253–259.
Schubotz, R.I., von Cramon, D.Y., 2002. Predicting perceptual events activates corre-sponding motor schemes in lateral premotor cortex: an fMRI study. Neuroimage15, 787–796.
Schwartze, M., Keller, P.E., Patel, A.D., Kotz, S.A., 2011. The impact of basal ganglialesions on sensorimotor synchronization, spontaneous motor tempo, and thedetection of tempo changes. Behav. Brain Res. 216 (2), 685–691.
Sethares, W.A., 1998. Tuning, Timbre, Spectrum, Scale. Springer-Verlag.Shannon, C.E., 1948. A mathematical theory of communication. Bell Syst. Tech. J. 27,
379–423.Sloboda, J., 1991. Music structure and emotional response: some empirical findings.
Psychol. Music. 19, 110–120.Smith, A.M., Lewis, B.K., Ruttimann, U.E., Ye, F.Q., Sinnwell, T.M., Yang, Y., Duyn, J.H.,
Frank, J.A., 1999. Investigation of low frequency drift in fMRI signal. Neuroimage9, 526–533.
Stoodley, C.J., Schmahmann, J.D., 2009. Functional topography in the human cerebel-lum: a meta-analysis of neuroimaging studies. Neuroimage 44, 489–501.
Tzanetakis, G., Cook, P., 2002. Music genre classification of audio signals. Proc. IEEE TAcoust Speech. 10, pp. 293–302.
Uddin, L.Q., Kelly, A.M.C., Biswal, B.B., Xavier Castellanos, F., Milham, M.P., 2009. Func-tional connectivity of default mode network components: correlation, anticorrela-tion, and causality. Hum. Brain Mapp. 30, 625–637.
Wong, P.C., Skoe, E., Russo, N.M., Dees, T., Kraus, N., 2007. Musical experience shapeshuman brainstem encoding of linguistic pitch patterns. Nat. Neurosci. 10,420–422.
Zanto, T.P., Snyder, J.S., Large, E.W., 2006. Neural correlates of rhythmic expectancy.Adv. Cogn. Psychol. 2, 221–231.
Zatorre, R.J., Belin, P., Penhune, V.B., 2002. Structure and function of auditory cortex:music and speech. Trends Cogn. Sci. 6, 37–46.