LARGE PILOT SCALE TESTING OF LINDE/BASF POST- … Library/Research/Coal/carbon capture... · ABBOTT...
40
LARGE PILOT SCALE TESTING OF LINDE/BASF POST- COMBUSTION CO 2 CAPTURE TECHNOLOGY AT THE ABBOTT COAL-FIRED POWER PLANT DOE/NETL Funding Award DE-FE0026588 Phase I Close-out Meeting November 17, 2017
Transcript of LARGE PILOT SCALE TESTING OF LINDE/BASF POST- … Library/Research/Coal/carbon capture... · ABBOTT...

LARGE PILOT SCALE TESTING OF LINDE/BASF POST-
COMBUSTION CO2 CAPTURE TECHNOLOGY AT THE ABBOTT COAL-FIRED
POWER PLANT
DOE/NETL Funding Award DE-FE0026588Phase I Close-out Meeting
November 17, 2017
2
Disclaimer
This report was prepared as an account of work sponsored by an agency of theUnited States Government. Neither the United States Government nor any agencythereof, nor any of their employees, makes any warranty, express or implied, orassumes any legal liability or responsibility for the accuracy, completeness, orusefulness of any information, apparatus, product, or process disclosed, orrepresents that its use would not infringe privately owned rights. Reference hereinto any specific commercial product, process, or service by trade name, trademark,manufacturer, or otherwise does not necessarily constitute or imply itsendorsement, recommendation, or favoring by the United States Government orany agency thereof. The views and opinions of authors expressed herein do notnecessarily state or reflect those of the United States Government or any agencythereof.

PROJECT MANAGEMENT AND PARTICIPANTS
3
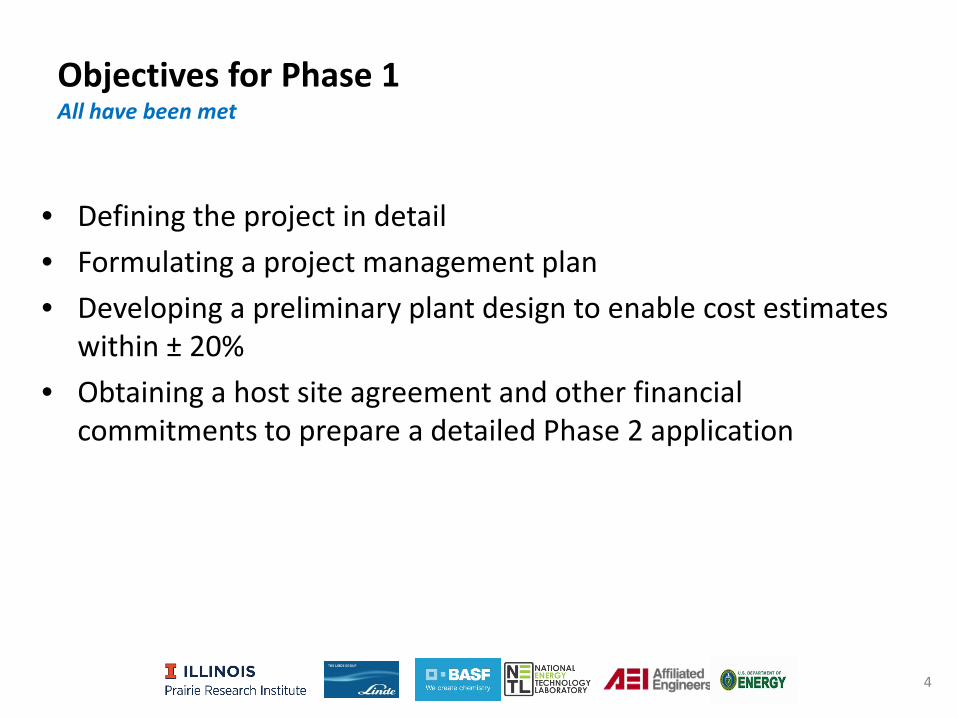
Objectives for Phase 1All have been met
• Defining the project in detail• Formulating a project management plan• Developing a preliminary plant design to enable cost estimates
within ± 20%• Obtaining a host site agreement and other financial
commitments to prepare a detailed Phase 2 application
4
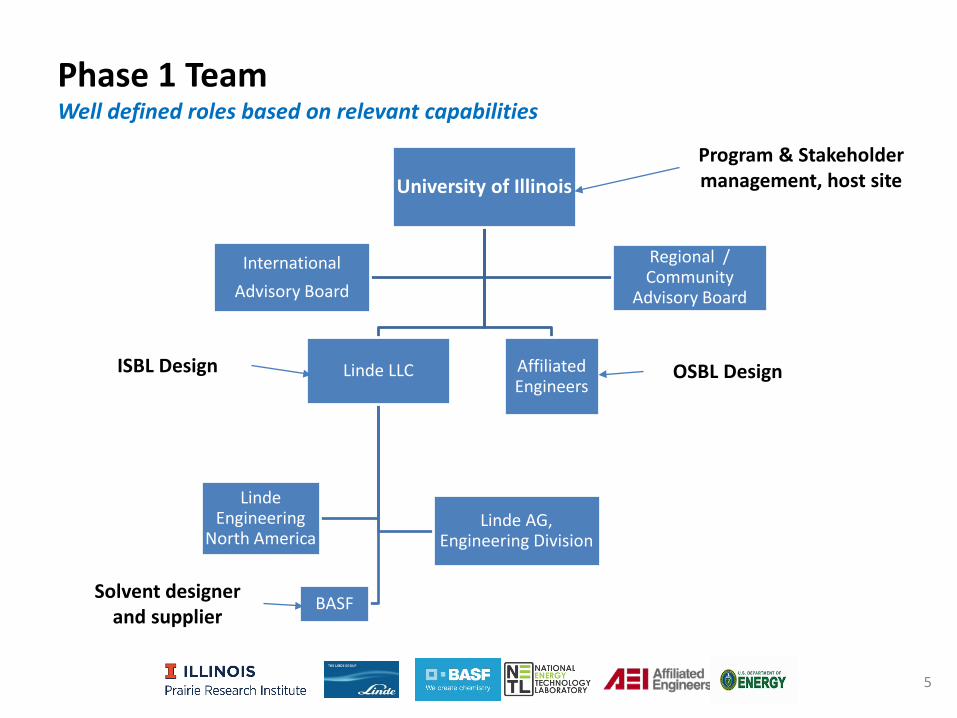
Phase 1 TeamWell defined roles based on relevant capabilities
5
University of Illinois
Linde LLC
BASF
Linde AG, Engineering Division
Linde Engineering
North America
Affiliated Engineers
InternationalAdvisory Board
Regional / Community
Advisory Board
Program & Stakeholder management, host site
ISBL Design
Solvent designer and supplier
OSBL Design

Project Timeline and Milestones
6
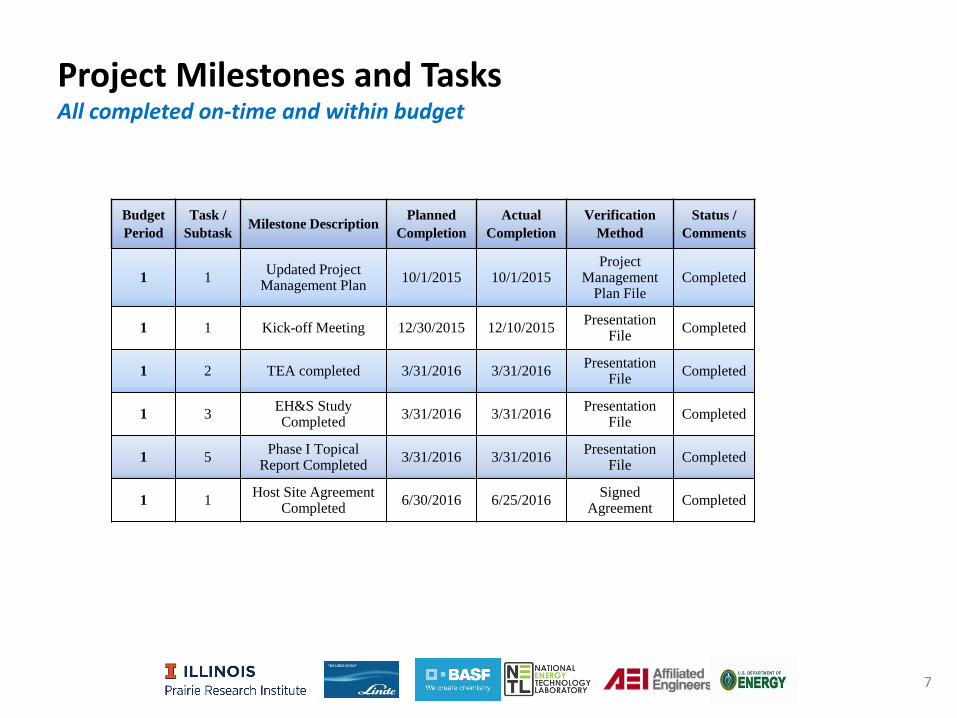
Project Milestones and TasksAll completed on-time and within budget
7
Budget Period
Task / Subtask Milestone Description Planned
CompletionActual
CompletionVerification
MethodStatus /
Comments
1 1 Updated Project Management Plan 10/1/2015 10/1/2015
Project Management
Plan FileCompleted
1 1 Kick-off Meeting 12/30/2015 12/10/2015 Presentation File Completed
1 2 TEA completed 3/31/2016 3/31/2016 Presentation File Completed
1 3 EH&S Study Completed 3/31/2016 3/31/2016 Presentation
File Completed
1 5 Phase I Topical Report Completed 3/31/2016 3/31/2016 Presentation
File Completed
1 1 Host Site Agreement Completed 6/30/2016 6/25/2016 Signed
Agreement Completed
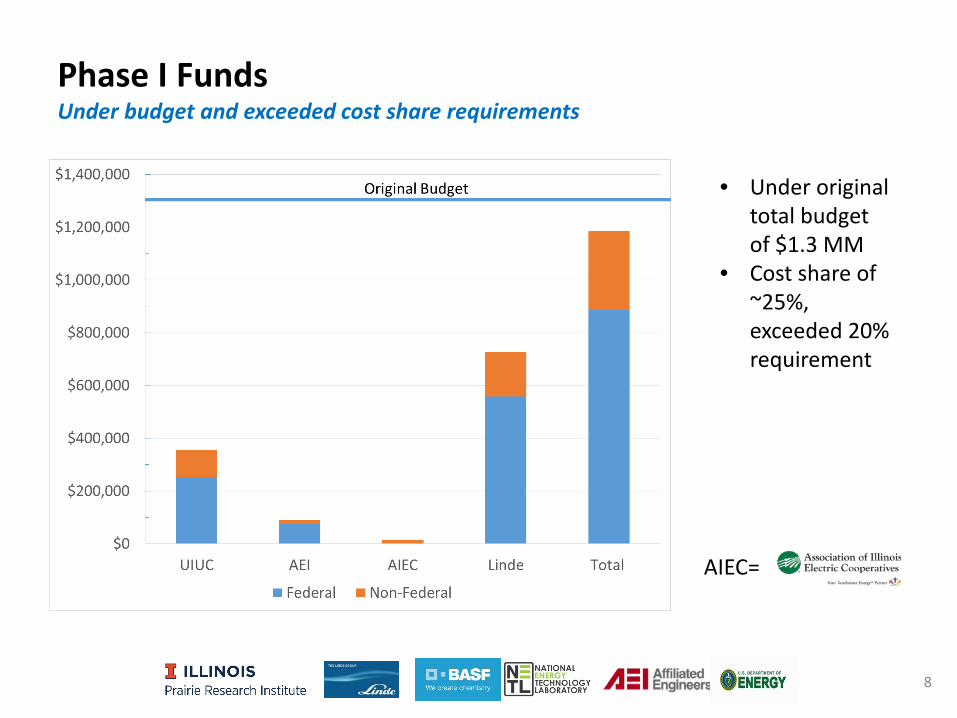
Phase I FundsUnder budget and exceeded cost share requirements
8
AIEC=
• Under originaltotal budgetof $1.3 MM
• Cost share of~25%,exceeded 20%requirement
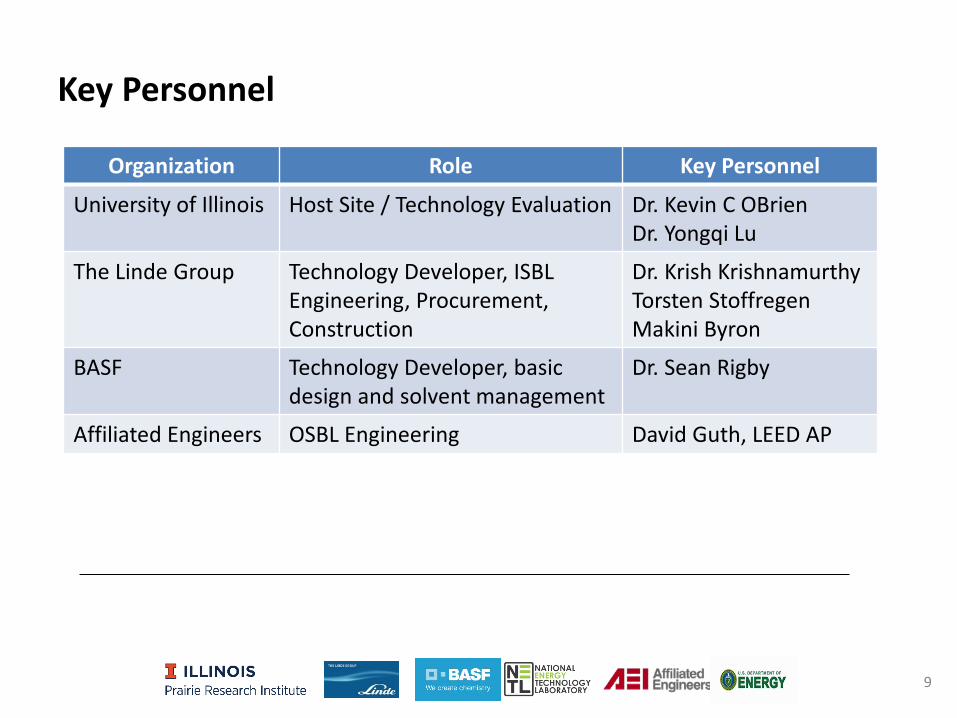
Key Personnel
9
Organization Role Key Personnel
University of Illinois Host Site / Technology Evaluation Dr. Kevin C OBrienDr. Yongqi Lu
The Linde Group Technology Developer, ISBL Engineering, Procurement, Construction
Dr. Krish KrishnamurthyTorsten StoffregenMakini Byron
BASF Technology Developer, basic design and solvent management
Dr. Sean Rigby
Affiliated Engineers OSBL Engineering David Guth, LEED AP
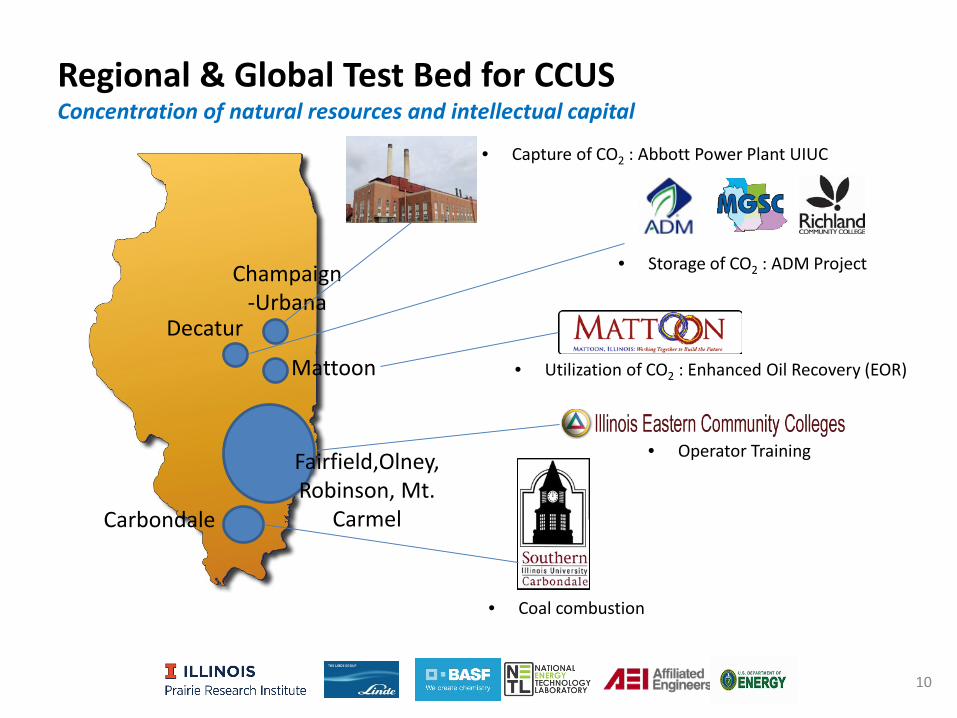
Regional & Global Test Bed for CCUSConcentration of natural resources and intellectual capital
10
Decatur
Champaign-Urbana
Mattoon
Carbondale
Fairfield,Olney, Robinson, Mt.
Carmel
• Operator Training
• Coal combustion
• Utilization of CO2 : Enhanced Oil Recovery (EOR)
• Storage of CO2 : ADM Project
• Capture of CO2 : Abbott Power Plant UIUC
OVERVIEW OF TECHNOLOGY DEVELOPMENT
11

BASF OASE® blue technology developmentLinde adopted and optimized for PCC applications
12

Technology performance to datePP1= Niederaussem; PP2=NCCC
13
Test/Performance Attribute
PCC Pilot Plant
Key results and current achievement against targets Remarks
Solvent selection PP1Two solvents screened following benchmark
testing with MEA. OASE® blue selected Solvent selected to optimize performance, emissions, and cost
CO2 capture rate PP1, PP2 Recovery > 90% as per target AchievedCO2 purity PP1, PP2 Purity > 99.9% (dry basis) as per target Achieved
Plant capacity PP1, PP2• PP1: 7.2 tonnes CO2/day (0.45 MWe)• PP2: >25 tonnes CO2/day (>1.5 MWe per design
target, >15,500 lb/hr flue gas)
Achieved. Higher capacity testing performed at PP2 – 10 days in May-June 2015. An additional week of higher capacity testing was
conducted in Nov. 2015.Regenerator steam
consumption PP1, PP2 ~ 2.8 GJ/tonne-CO2 (Intrinsic energy requirement) Achieved (20% lower than MEA).~ 2.7 GJ/tonne-CO2 observed in PP2
Cyclic capacity PP1, PP2 >20% compared to MEA Achieved
Emissions control testing PP1, PP2
Identified and validated BASF/RWE patented dry bed configuration of water wash unit to reduce emissions as per design target. Aerosol control configuration in flue gas stream tested and evaluated
Incorporated in PP2 design.Detailed isokinetic measurements (flue gas & treated gas) performed to confirm effectiveness of emissions control options (such as dry bed configuration) for high aerosol content flue gas, in particular flue gas with a high nanoparticle size particle density.
Regeneratoroperating pressure PP2 Pressure up to 3.4 Bara
Achieved & confirmed benefits for compressed CO2 production. Pressure parametric testing completed in Nov. 2015. Long-duration testing was performed at 3.4 bara.
Materials of construction PP1 Wide range of materials (CS, SS, concrete with PP
inliner, FRP, etc) tested in sections and in couponsEnabled optimized material specifications for PP2 and for
commercial cases
Validation of unique process
featuresPP1, PP2
• High capacity packing in the absorber column• Blower downstream of absorber (PP2)• Unique two-phase flow reboiler design (PP2)• Gravity-driven interstage cooler (PP2)
Design improvements for reducing the energy required for solvent regeneration through heat integration were identified. Stripper inter-stage heater (SIH) design can result in ~2.3 GJ/tonne CO2.
Long-term testing for solvent stability
assessmentPP1, PP2
• PP1: >26,000 hrs (>3 years) of testing• PP2: ~ 1,500 hrs of continuous testing under
steady state conditions
• PP1: Achieved• PP2: Long term testing successfully completed from May through
July 2016.

LARGE PILOT DESIGN AND TEST APPROACH
14

Overview of Capture System for Large Pilot Plant Technology features in large pilot design
15

CO2 product:
― 272 MTPD (300 tons/day)
― 90% capture efficiency
― 99.7+% purity (<100 ppmv O2)
― ~1.2 bars delivery pressure at site boundary
Flue gas processed:
― Target capture plant capacity: 15 MWe
― Target flue gas flow rate: 77.6 tonnes/hr(wet)
― Flue gas composition (straight): CO2 5.7mol%(wet)
(with recycle): CO2 10.3 mol%(wet);
Operating requirements:
― Regenerator LP steam (3.4-4.8 barg): 17.0 tonnes/hr
― Electrical power: max 462 kW
― Cooling water: 132 gpm
16
Preliminary CO2 capture plant design basisLarge pilot captures 300 tons/day CO2

Test Cases Planned in Large Scale PilotRecycling important to increase level of CO2
17
Case 1: Treat as-received flue gas:containing low concentration CO2(5.7%mol)
Case 2: Treat flue gas with CO2 recycle:to increase the CO2 concentration from5.7%mol (without recycle) to 10.3%mol(with recycle).
Case 3: Treat flue gas with CO2 recycleand stripping operation at a higherpressure
Flue Gas Specification Treated Gas Total Captured CO2
Description UnitCase 1
(Straight FG Flow)
Case 2/3(FG w/ CO2
recycle)
Case 2/3(FG w/ CO2
recycle)
Case 3(CO2 recycle at
higher P)
Operating pressure bar (psi) 1.0(14.9)
1.0(14.9)
1.0(14.9)
3.4(49.3)
Operating temperature °F (°C) 200 (93.3) 200 (93.3) 104 (40) 104 (40)
Total VolumetricFlow (Nm3/h) 78,353
65,621 63,424 1,833
Total Mass Flow lb/hr(kg/hr)
163,321 (74,081)
163,903(74,345)
142,967(64,849)
22,841(10,361)
Composition:CO2 mol% 5.7 10.4 1.1 97.7N2 mol% 68.8 72.7 78.7 0.0Ar mol% 0.8 0.9 0.9 0.0O2 mol% 10.3 10.9 11.8 0.0
H2O mol% 14.4 5.2 7.5 2.2
SO2 ppmv 68.0(max 200) 64.0 N/A N/A
SO3 ppmv tbd tbd N/A N/ANOx ppmv tbd 200 N/A N/A
Chlorides ppmv tbd tbd N/A N/ADust lb/SCF tbd tbd N/A N/A
NB: 2016 measured CO2 concentration at Abbott (two coal boilers at full load) was 9.2% CO2 as opposed to 5.7% which was the design of the plant. This is more in line with the pulverized coal plants and recycle option in this case can increase the flue gas CO2 concentration to 13%, typical of PC boilers.

18
Large Pilot Analysis PointsFrequent analysis through online and manual sample points

INTEGRATION WITH POWER PLANT
19
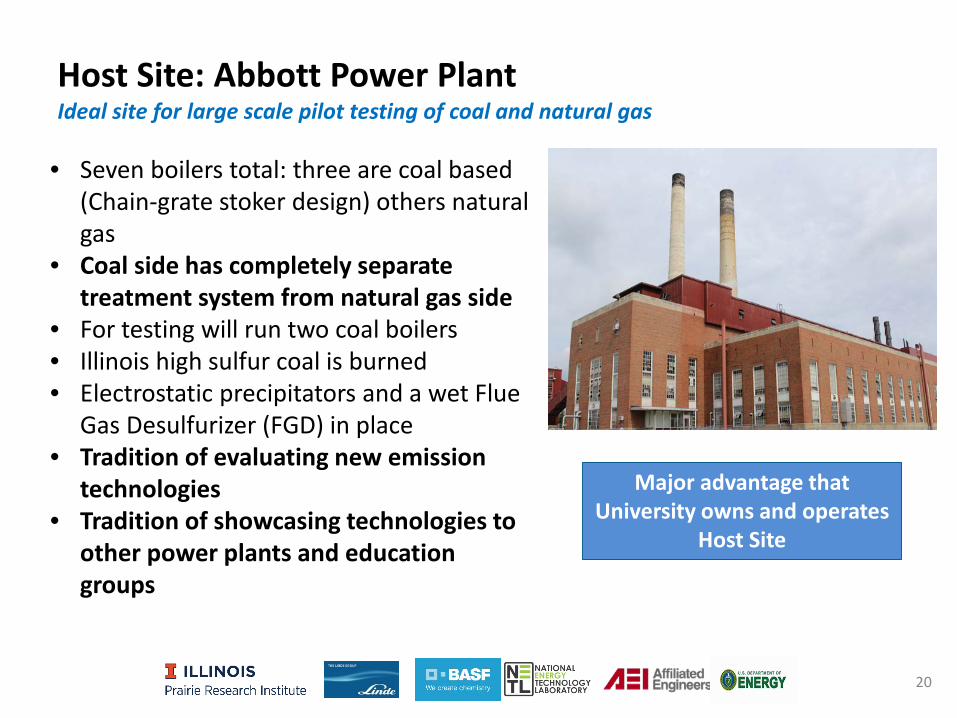
Host Site: Abbott Power PlantIdeal site for large scale pilot testing of coal and natural gas
20
• Seven boilers total: three are coal based(Chain-grate stoker design) others naturalgas
• Coal side has completely separatetreatment system from natural gas side
• For testing will run two coal boilers• Illinois high sulfur coal is burned• Electrostatic precipitators and a wet Flue
Gas Desulfurizer (FGD) in place• Tradition of evaluating new emission
technologies• Tradition of showcasing technologies to
other power plants and educationgroups
Major advantage that University owns and operates
Host Site

Site for Carbon Capture Plant Established and EvaluatedLocated close to Abbott Power Plant
21
Extract flue gas POST CEMS Unit

Integration of Pilot Plant with Utilities at Host Site
22
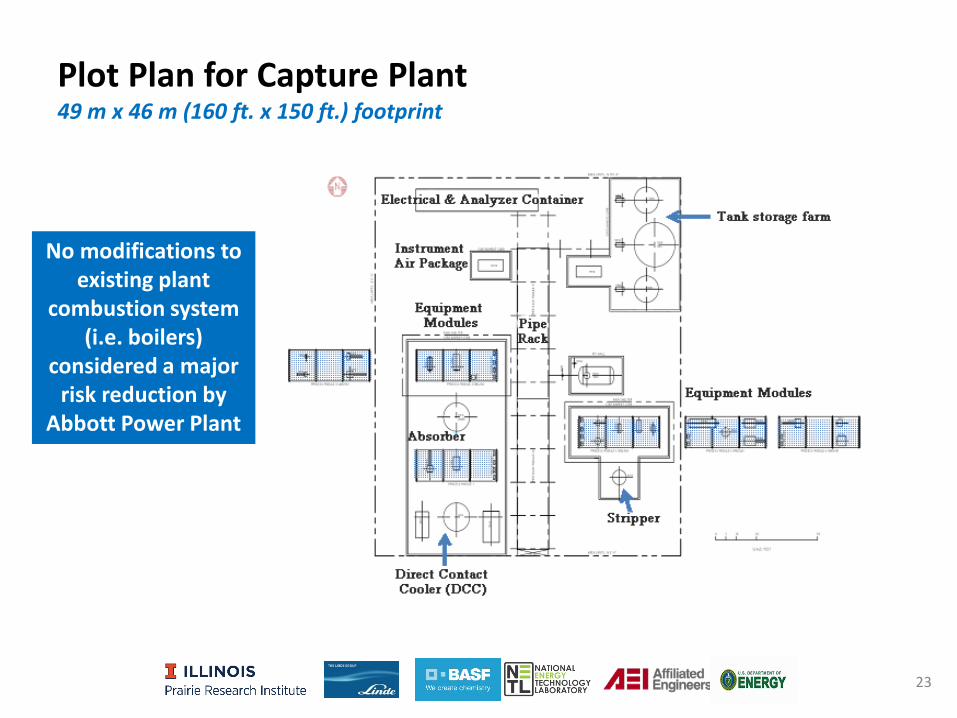
Plot Plan for Capture Plant49 m x 46 m (160 ft. x 150 ft.) footprint
23
No modifications to existing plant
combustion system (i.e. boilers)
considered a major risk reduction by
Abbott Power Plant

ENVIRONMENTAL, HEALTH AND SAFETY ANALYSIS
24

Potentially Hazardous Materials Engineering controls and/or safeguards in place to limit possible consequences
25
1
2 3
5
4
6
7
Safeguards
1) • Bulk heat stable salts removal options• Anti-foaming and anti-corrosion agents
available, if needed
2) • Module shelters to redirect rain water• Impermeable pads under modules and
columns• Sloped floor - drainage to a sump
3) • Water reuse/recycle considered• Neutralization of waste water before
disposal, if needed
4) • Caustic tank surrounded by 6’ wall
5) • Relatively small volumes of solvent• Solvent handling guidance from BASF
6) • Emission Control System, includingpatented “dry bed” configuration
• Treated gas vented at 170’
7) • Storage tank surrounded by 3’ wall• Amine lines welded to prevent leakages

Key Environmental Health & Safety RisksRisk mitigation factors identified for design, build and operate activities
26
Safety and Health Risk Mitigation Approach
Plant operations safety• Applied Linde’s comprehensive “Safety by Design” guidelines• Safety and operator training
Safety issues arising from improper design and operations/maintenance requirements not identified at design
• Implementation of Linde Gas Standard Requirements• Comprehensive Hazard and Operability study (HAZOP)• Comprehensive Process Safety Reviews (PSR)
Process operations safety
• Safety instrumented systems• Flow restriction and safety interlocks
• Automatic safe shutdown capability incorporated in the large pilotplant design
• Emergency power supply
Chemical exposure• Multiple eye wash and emergency showers• Safe locations of vents and blow down• Proper sizing of relief valve and similar devices• Catch pots for capturing any leaks during maintenance
Solvent handling • Rigorous operating procedures including mandatory usage ofPersonal Protection Equipment (PPE)
Solvent storage (regulatory requirements)
• OSHA and EPA regulated chemicals with threshold storage volumefor process safety management checked. Confirmed solvent is notpart of the classified chemicals list with threshold volume.

TECHNO-ECONOMIC ANALYSIS
27
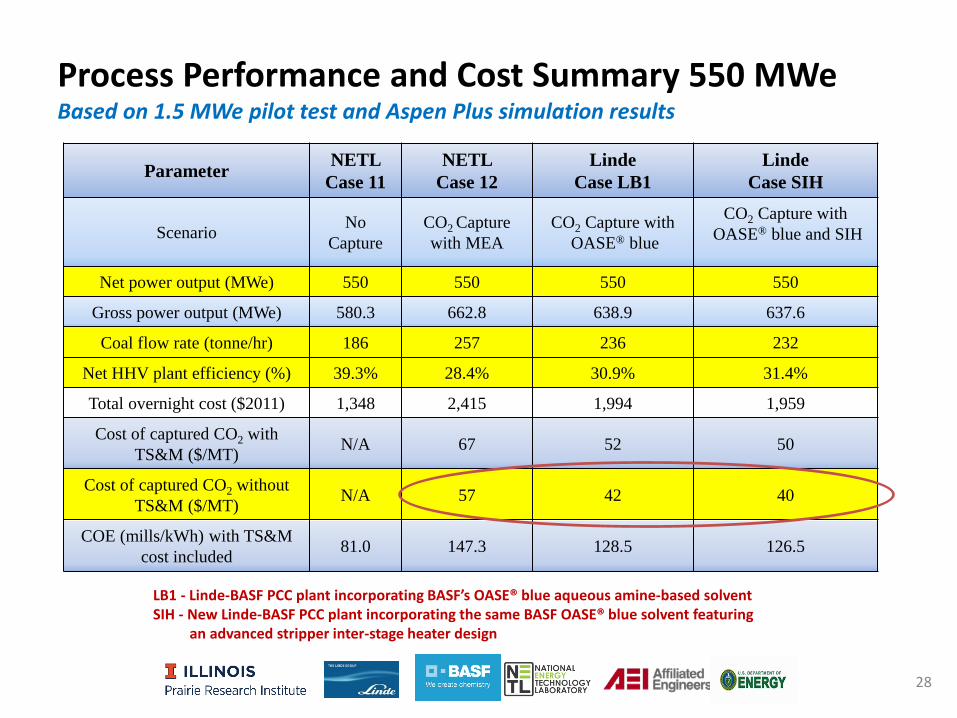
Parameter NETLCase 11
NETL Case 12
Linde Case LB1
Linde Case SIH
Scenario No Capture
CO2 Capture with MEA
CO2 Capture withOASE® blue
CO2 Capture withOASE® blue and SIH
Net power output (MWe) 550 550 550 550
Gross power output (MWe) 580.3 662.8 638.9 637.6
Coal flow rate (tonne/hr) 186 257 236 232
Net HHV plant efficiency (%) 39.3% 28.4% 30.9% 31.4%
Total overnight cost ($2011) 1,348 2,415 1,994 1,959
Cost of captured CO2 with TS&M ($/MT) N/A 67 52 50
Cost of captured CO2 withoutTS&M ($/MT) N/A 57 42 40
COE (mills/kWh) with TS&M cost included 81.0 147.3 128.5 126.5
28
LB1 - Linde-BASF PCC plant incorporating BASF’s OASE® blue aqueous amine-based solvent SIH - New Linde-BASF PCC plant incorporating the same BASF OASE® blue solvent featuring
an advanced stripper inter-stage heater design
Process Performance and Cost Summary 550 MWeBased on 1.5 MWe pilot test and Aspen Plus simulation results
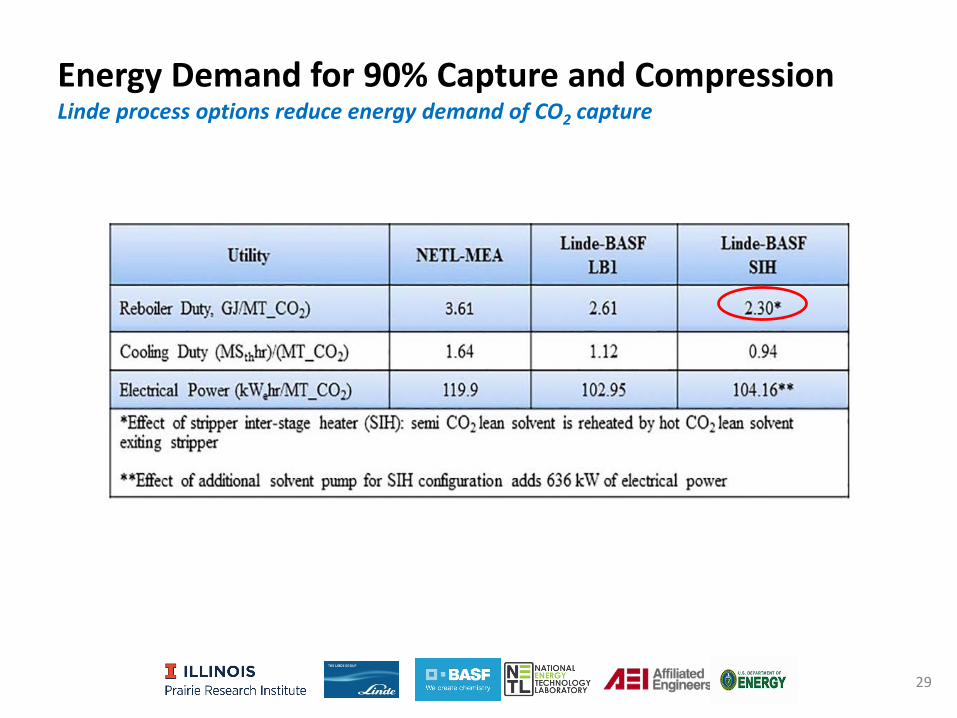
Energy Demand for 90% Capture and CompressionLinde process options reduce energy demand of CO2 capture
29

Annual Operating and Maintenance ExpensesNovel solvent reduces annual operating expenses
30
Annual O&M Expenses for 550 MWe PC Power Plant with PCC (2011$)
CaseNETL_2011
Case 12Linde-BASF
LB1-2011Linde-BASF
SIH-2011Linde-BASF
LB1-AFSC-2011Total Fixed Operating
Cost 64,137,607 57,356,056 56,777,693 56,557,758Maintenance Material
Cost 19,058,869 18,017,114 17,823,784 17,700,023Water 3,803,686 3,595,777 3,557,193 3,532,493
Chemicals* 24,913,611 23,551,836 23,299,117 23,137,338SCR Catalyst 1,183,917 1,119,204 1,107,195 1,099,507Ash Disposal 5,129,148 4,848,789 4,796,760 4,763,454By-Products 0 0 0 0
Total Variable Operating Cost 54,089,231 51,132,721 50,584,050 50,232,815
Total Fuel Cost (Coal @ 68.60$/ton) 144,504,012 136,605,442 135,139,620 134,201,266
*Includes cost of OASE blue® solvent for Linde-BASF PCC options

31
Process Performance and Cost Summary 550 MWeNet higher heating value (HHV) efficiency (%) improvements
32
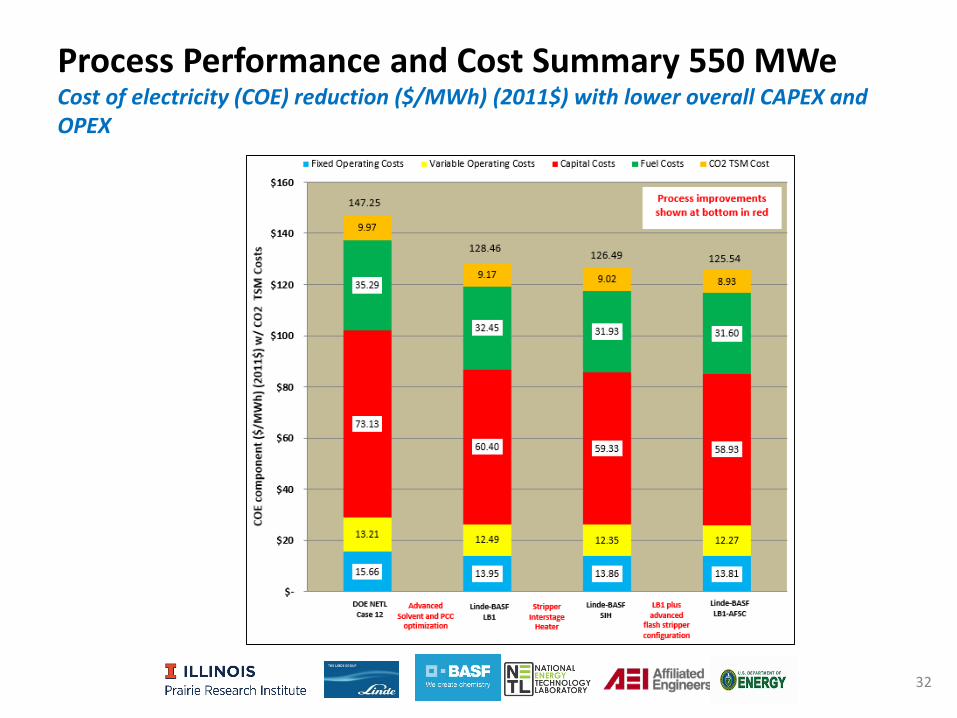
Process Performance and Cost Summary 550 MWeCost of electricity (COE) reduction ($/MWh) (2011$) with lower overall CAPEX and OPEX

33
Process Performance and Cost Summary 550 MWeLower cost of CO2 captured ($/tonne CO2) (2011$) toward DOE target of $40/tonneCO2

TECHNOLOGY GAPS
34

35
Technology Gap AnalysisTRL improvements that would result from large scale pilot
TRL 9____
TRL 8____
TRL 7____
TRL 6____
TRL 5____
TRL 4____
TRL 3____
TRL 2_____
TRL 1
Expected TRL after large pilot
CO2 Capture Plant Subsystems
Absorber and Stripper Columns1
Heat exchangers and reboiler
Stripper heat integration and recovery
Materials of construction
Emission control
Solvent Management
1. Columns expected to achieve TRL 9 based on Linde related experience inbuilding up to ~ 12 m diameter columns for other commercial applications.
Current TRL
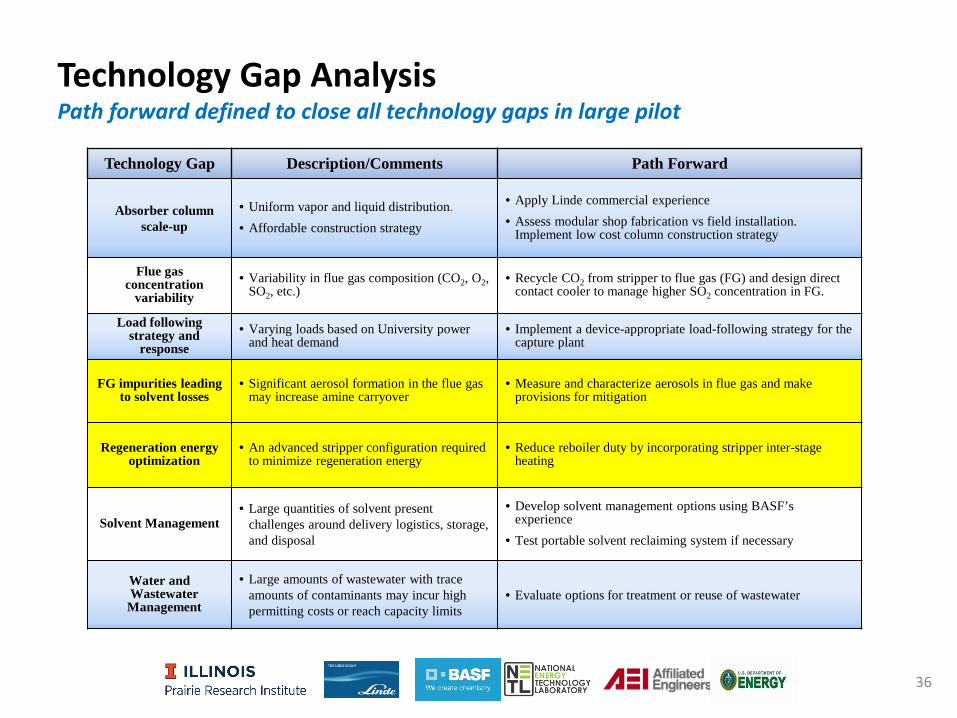
Technology Gap AnalysisPath forward defined to close all technology gaps in large pilot
36
Technology Gap Description/Comments Path Forward
Absorber column scale-up
• Uniform vapor and liquid distribution.• Affordable construction strategy
• Apply Linde commercial experience• Assess modular shop fabrication vs field installation.
Implement low cost column construction strategy
Flue gas concentration
variability• Variability in flue gas composition (CO2, O2,
SO2, etc.)• Recycle CO2 from stripper to flue gas (FG) and design direct
contact cooler to manage higher SO2 concentration in FG.
Load following strategy and
response• Varying loads based on University power
and heat demand• Implement a device-appropriate load-following strategy for the
capture plant
FG impurities leading to solvent losses
• Significant aerosol formation in the flue gasmay increase amine carryover
• Measure and characterize aerosols in flue gas and makeprovisions for mitigation
Regeneration energy optimization
• An advanced stripper configuration requiredto minimize regeneration energy
• Reduce reboiler duty by incorporating stripper inter-stageheating
Solvent Management• Large quantities of solvent present
challenges around delivery logistics, storage,and disposal
• Develop solvent management options using BASF’sexperience
• Test portable solvent reclaiming system if necessary
Water and Wastewater Management
• Large amounts of wastewater with traceamounts of contaminants may incur highpermitting costs or reach capacity limits
• Evaluate options for treatment or reuse of wastewater

LESSONS LEARNED, AND PATH FORWARD
37

Lessons LearnedTechnical & Permitting Regulatory
Technical• Significance of solvent regeneration at high pressure (up to 3.5 Bar) on capital and
operating cost reductions• Significance of flexible reboiler design to allow proper PCC process dynamics
during rapid power plant load fluctuations.• Optimization of PCC process configuration to maximize waste heat utilization and
ultimately minimize solvent regeneration energy consumption – results ininclusion of Stripper Inter-stage Heater (SIH) Significance of aerosol formation onsolvent losses and related emission issues
• Center for utilizing captured carbon have spurred interest from other technologydevelopers in CO2 utilization
Permitting & Regulatory• Importance of water demand on the permitting costs
38
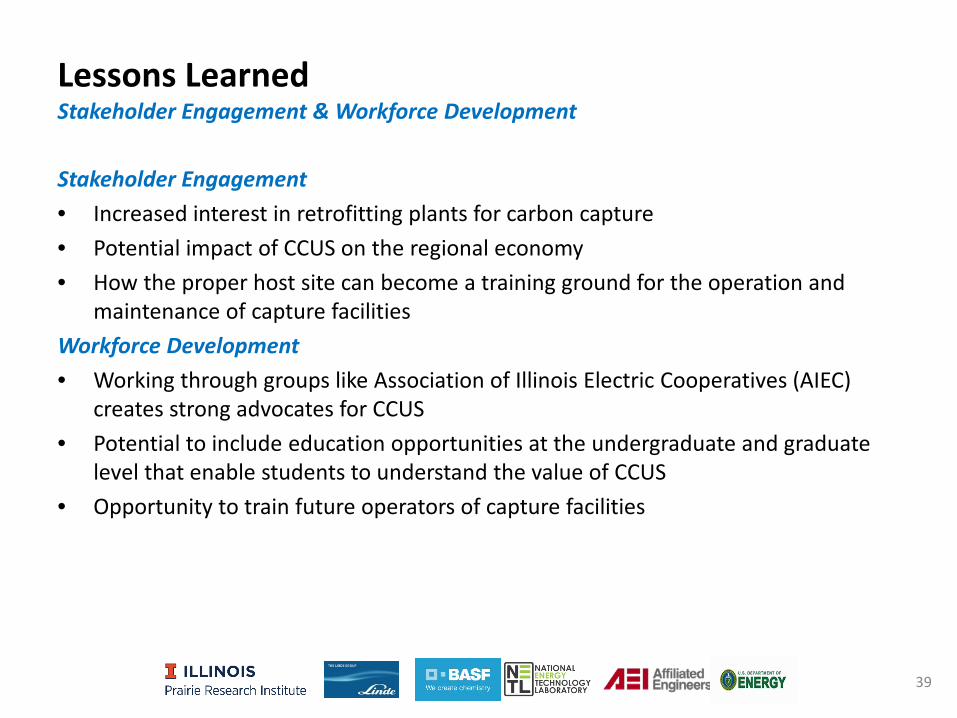
Lessons LearnedStakeholder Engagement & Workforce Development
Stakeholder Engagement• Increased interest in retrofitting plants for carbon capture• Potential impact of CCUS on the regional economy• How the proper host site can become a training ground for the operation and
maintenance of capture facilitiesWorkforce Development• Working through groups like Association of Illinois Electric Cooperatives (AIEC)
creates strong advocates for CCUS• Potential to include education opportunities at the undergraduate and graduate
level that enable students to understand the value of CCUS• Opportunity to train future operators of capture facilities
39
40
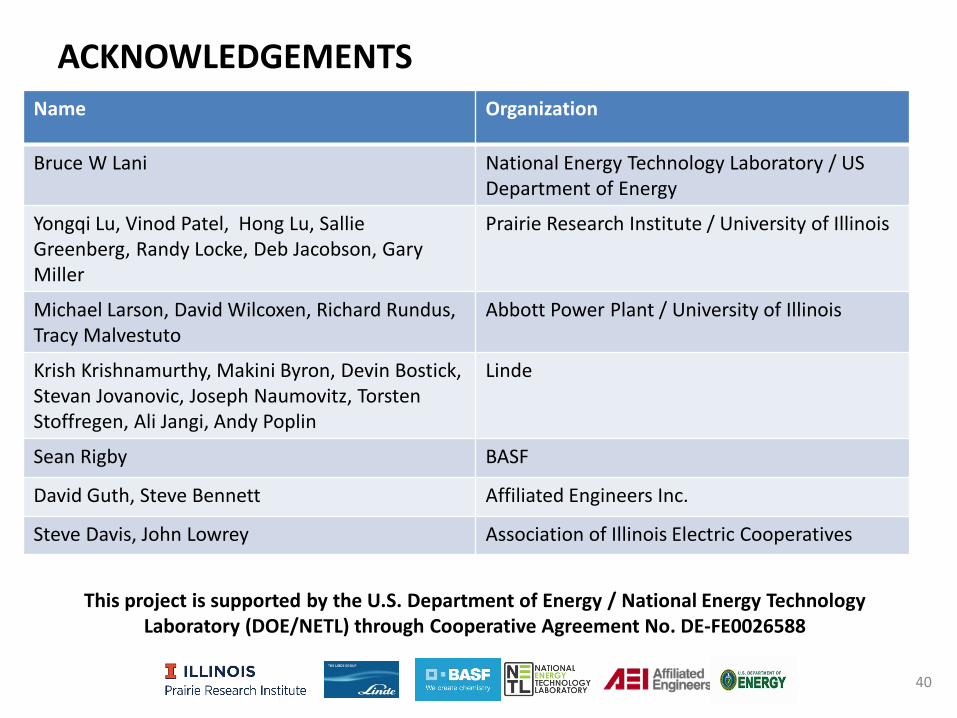
ACKNOWLEDGEMENTSName Organization
Bruce W Lani National Energy Technology Laboratory / US Department of Energy
Yongqi Lu, Vinod Patel, Hong Lu, Sallie Greenberg, Randy Locke, Deb Jacobson, Gary Miller
Prairie Research Institute / University of Illinois
Michael Larson, David Wilcoxen, Richard Rundus, Tracy Malvestuto
Abbott Power Plant / University of Illinois
Krish Krishnamurthy, Makini Byron, Devin Bostick, Stevan Jovanovic, Joseph Naumovitz, Torsten Stoffregen, Ali Jangi, Andy Poplin
Linde
Sean Rigby BASF
David Guth, Steve Bennett Affiliated Engineers Inc.
Steve Davis, John Lowrey Association of Illinois Electric Cooperatives
This project is supported by the U.S. Department of Energy / National Energy Technology Laboratory (DOE/NETL) through Cooperative Agreement No. DE-FE0026588