Large divergence of satellite and Earth system … divergence of satellite and Earth system model...
11
Large divergence of satellite and Earth system model estimates of global terrestrial CO 2 fertilization W. Kolby Smith 1,2 , Sasha C. Reed 3 , Cory C. Cleveland 1 , Ashley P. Ballantyne 1 , William R.L. 4 Anderegg 4 , William R. Wieder 5,6 , Yi Y. Liu 7 , Steven W. Running 1 5 6 1 Department of Ecosystem and Conservation Sciences, University of Montana, Missoula, MT, 7 USA; 2 Institute on the Environment, University of Minnesota, St. Paul, MN, USA; 3 Southwest 8 Biological Science Center, U.S. Geological Survey, Moab, Utah, USA; 4 Department of Ecology 9 and Evolutionary Biology, Princeton University, Princeton, NJ, USA; 5 National Center for 10 Atmospheric Research, Boulder, CO, USA; 6 Institute for Arctic and Alpine Research, Boulder, 11 CO, USA; 7 ARC Centre of Excellence for Climate Systems Science & Climate Change Research 12 Centre, University of New South Wales, Sydney, Australia. 13 14 Corresponding Author Email: [email protected] 15 SUPPLEMENTARY INFORMATION DOI: 10.1038/NCLIMATE2879 NATURE CLIMATE CHANGE | www.nature.com/natureclimatechange 1
Transcript of Large divergence of satellite and Earth system … divergence of satellite and Earth system model...
Large divergence of satellite and Earth system model estimates of global terrestrial CO2 fertilization
Supplementary Information for: 1
Large divergence of satellite and Earth system model estimates of global terrestrial CO2 2
fertilization 3
W. Kolby Smith1,2, Sasha C. Reed3, Cory C. Cleveland1, Ashley P. Ballantyne1, William R.L. 4
Anderegg4, William R. Wieder5,6, Yi Y. Liu7, Steven W. Running1 5
6
1Department of Ecosystem and Conservation Sciences, University of Montana, Missoula, MT, 7
USA; 2Institute on the Environment, University of Minnesota, St. Paul, MN, USA; 3Southwest 8
Biological Science Center, U.S. Geological Survey, Moab, Utah, USA; 4Department of Ecology 9
and Evolutionary Biology, Princeton University, Princeton, NJ, USA; 5National Center for 10
Atmospheric Research, Boulder, CO, USA; 6Institute for Arctic and Alpine Research, Boulder, 11
CO, USA; 7ARC Centre of Excellence for Climate Systems Science & Climate Change Research 12
Centre, University of New South Wales, Sydney, Australia. 13
14
Corresponding Author Email: [email protected]
SUPPLEMENTARY INFORMATIONDOI: 10.1038/NCLIMATE2879
NATURE CLIMATE CHANGE | www.nature.com/natureclimatechange 1

Supplementary Table 1. CMIP5 model centers, identification numbers, and names. 16
Modelling Center Institute ID Model Name
Beijing Climate Center, China
Meteorological Administration BCC BCC-CSM1-1
Community Earth System Model
Contributors
NSF-DOE-
NCAR CESM1-BGC
Met Office Hadley Centre MOHC Had-GEM2-ES
Institut Pierre-Simon Laplace IPSL IPSL-CM5A-MR
NOAA Geophysical Fluid
Dynamics Laboratory NOAA GFDL GFDL-ESM2M
17
Supplementary Table 2. Characteristics of the Free-Air CO2 Enrichment (FACE) 18
experimental sites. 19
Latitude Longitude MAT
(°C)
MAP
(mm)
Available
NPP data
Elevated CO2
(ppm)
Aspen1 45°40’N 89°37’W 4.9 810 2001-2003 580
Duke1 35°58’N 79°05’W 15.5 1140 1996-2007 580
ORNL1 35°54’N 84°20’W 14.2 1390 1998-2008 550
Pop-Euro1 42°22’N 11°48’E 14.1 818 2000-2001 550
BioCON2 45°N 93°W 10.3 660 1998-1999 560
PHACE2 41°11’N 104°54’W 7.5 384 2006-2009 600
1Forest FACE sites (see ref. 12 and ref. 14); 2Non-forest Face sites (see ref. 13 and ref. 15) 20
2 NATURE CLIMATE CHANGE | www.nature.com/natureclimatechange
SUPPLEMENTARY INFORMATION DOI: 10.1038/NCLIMATE2879

Supplementary Table 1. CMIP5 model centers, identification numbers, and names. 16
Modelling Center Institute ID Model Name
Beijing Climate Center, China
Meteorological Administration BCC BCC-CSM1-1
Community Earth System Model
Contributors
NSF-DOE-
NCAR CESM1-BGC
Met Office Hadley Centre MOHC Had-GEM2-ES
Institut Pierre-Simon Laplace IPSL IPSL-CM5A-MR
NOAA Geophysical Fluid
Dynamics Laboratory NOAA GFDL GFDL-ESM2M
17
Supplementary Table 2. Characteristics of the Free-Air CO2 Enrichment (FACE) 18
experimental sites. 19
Latitude Longitude MAT
(°C)
MAP
(mm)
Available
NPP data
Elevated CO2
(ppm)
Aspen1 45°40’N 89°37’W 4.9 810 2001-2003 580
Duke1 35°58’N 79°05’W 15.5 1140 1996-2007 580
ORNL1 35°54’N 84°20’W 14.2 1390 1998-2008 550
Pop-Euro1 42°22’N 11°48’E 14.1 818 2000-2001 550
BioCON2 45°N 93°W 10.3 660 1998-1999 560
PHACE2 41°11’N 104°54’W 7.5 384 2006-2009 600
1Forest FACE sites (see ref. 12 and ref. 14); 2Non-forest Face sites (see ref. 13 and ref. 15) 20
NATURE CLIMATE CHANGE | www.nature.com/natureclimatechange 3
SUPPLEMENTARY INFORMATIONDOI: 10.1038/NCLIMATE2879

Supplementary Figure 1. Temporal changes in NPP for each CMIP5 model considered. a. 21 CMIP5CO2+CLIM NPP. b. CMIP5CLIM NPP. The change in NPP (1960-2011) for individual CMIP5 22 models (light lines) and the ensemble mean (heavy line) are shown. The CMIP5 model that 23 considered nutrient constraints (CESM1-BGC) is shown with a dashed line. 24
25
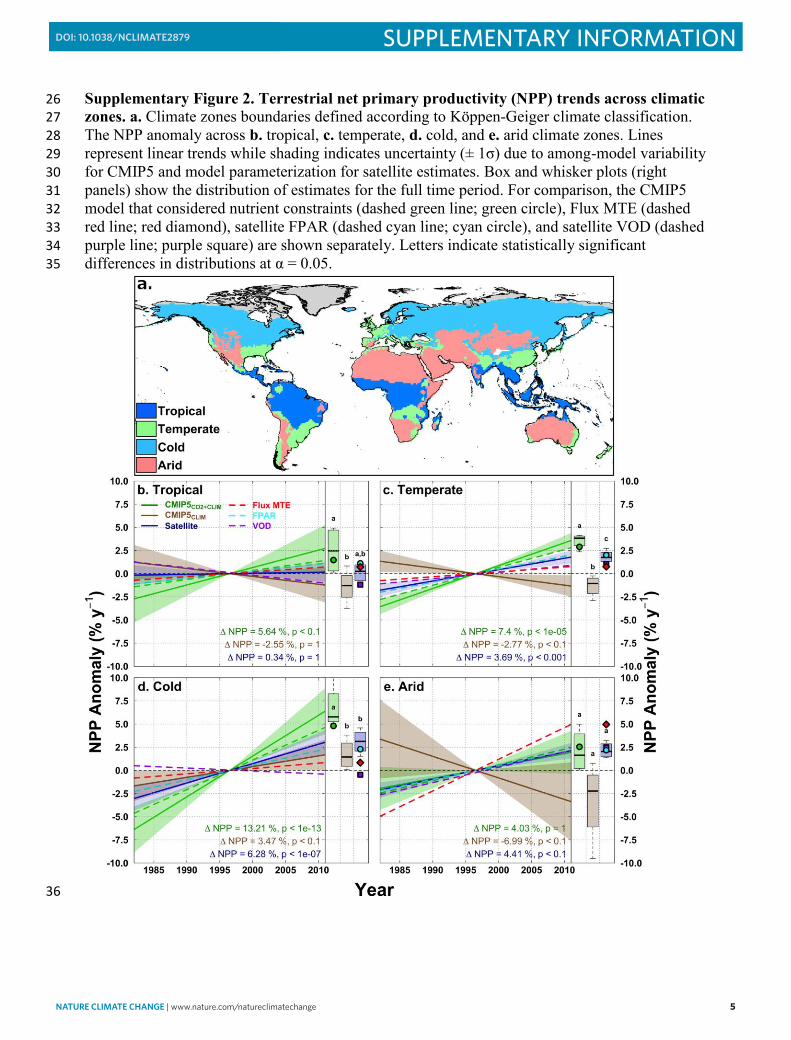
Supplementary Figure 2. Terrestrial net primary productivity (NPP) trends across climatic 26 zones. a. Climate zones boundaries defined according to Köppen-Geiger climate classification. 27 The NPP anomaly across b. tropical, c. temperate, d. cold, and e. arid climate zones. Lines 28 represent linear trends while shading indicates uncertainty (± 1σ) due to among-model variability 29 for CMIP5 and model parameterization for satellite estimates. Box and whisker plots (right 30 panels) show the distribution of estimates for the full time period. For comparison, the CMIP5 31 model that considered nutrient constraints (dashed green line; green circle), Flux MTE (dashed 32 red line; red diamond), satellite FPAR (dashed cyan line; cyan circle), and satellite VOD (dashed 33 purple line; purple square) are shown separately. Letters indicate statistically significant 34 differences in distributions at α = 0.05. 35
36
4 NATURE CLIMATE CHANGE | www.nature.com/natureclimatechange
SUPPLEMENTARY INFORMATION DOI: 10.1038/NCLIMATE2879
Supplementary Figure 1. Temporal changes in NPP for each CMIP5 model considered. a. 21 CMIP5CO2+CLIM NPP. b. CMIP5CLIM NPP. The change in NPP (1960-2011) for individual CMIP5 22 models (light lines) and the ensemble mean (heavy line) are shown. The CMIP5 model that 23 considered nutrient constraints (CESM1-BGC) is shown with a dashed line. 24
25
Supplementary Figure 2. Terrestrial net primary productivity (NPP) trends across climatic 26 zones. a. Climate zones boundaries defined according to Köppen-Geiger climate classification. 27 The NPP anomaly across b. tropical, c. temperate, d. cold, and e. arid climate zones. Lines 28 represent linear trends while shading indicates uncertainty (± 1σ) due to among-model variability 29 for CMIP5 and model parameterization for satellite estimates. Box and whisker plots (right 30 panels) show the distribution of estimates for the full time period. For comparison, the CMIP5 31 model that considered nutrient constraints (dashed green line; green circle), Flux MTE (dashed 32 red line; red diamond), satellite FPAR (dashed cyan line; cyan circle), and satellite VOD (dashed 33 purple line; purple square) are shown separately. Letters indicate statistically significant 34 differences in distributions at α = 0.05. 35
36
NATURE CLIMATE CHANGE | www.nature.com/natureclimatechange 5
SUPPLEMENTARY INFORMATIONDOI: 10.1038/NCLIMATE2879

Supplementary Figure 3. Terrestrial net primary productivity (NPP) trends by biome type. 37 a. Biome classifications defined according to the MODIS collection 5 global land-cover 38 classification and the Köppen-Geiger climate classification. The NPP anomaly across b. northern 39 hemisphere evergreen forest, c. northern hemisphere deciduous forest, d. temperate grassland, e. 40 arid grassland, f. temperate shrubland, and g. arid shrubland biomes. Lines represent linear trends 41 while shading indicates uncertainty (± 1σ) due to among-model variability for CMIP5 and model 42 parameterization for satellite estimates. Box and whisker plots (right panels), show the 43 distribution of estimates for the full time period. For comparison, the CMIP5 model that 44 considered nutrient constraints (dashed green line; green circle), Flux MTE (dashed red line; red 45 diamond), satellite FPAR (dashed cyan line; cyan circle), and satellite VOD (dashed purple line; 46 purple square) are shown separately. Letters indicate statistically significant differences in 47 distributions at α = 0.05. 48
49
6 NATURE CLIMATE CHANGE | www.nature.com/natureclimatechange
SUPPLEMENTARY INFORMATION DOI: 10.1038/NCLIMATE2879

Supplementary Figure 3. Terrestrial net primary productivity (NPP) trends by biome type. 37 a. Biome classifications defined according to the MODIS collection 5 global land-cover 38 classification and the Köppen-Geiger climate classification. The NPP anomaly across b. northern 39 hemisphere evergreen forest, c. northern hemisphere deciduous forest, d. temperate grassland, e. 40 arid grassland, f. temperate shrubland, and g. arid shrubland biomes. Lines represent linear trends 41 while shading indicates uncertainty (± 1σ) due to among-model variability for CMIP5 and model 42 parameterization for satellite estimates. Box and whisker plots (right panels), show the 43 distribution of estimates for the full time period. For comparison, the CMIP5 model that 44 considered nutrient constraints (dashed green line; green circle), Flux MTE (dashed red line; red 45 diamond), satellite FPAR (dashed cyan line; cyan circle), and satellite VOD (dashed purple line; 46 purple square) are shown separately. Letters indicate statistically significant differences in 47 distributions at α = 0.05. 48
49
Supplementary Figure 4. Vapor pressure deficit (VPD) and minimum temperature (TMIN) trends across long-term climate 50 zones. The TMIN (a.-d.) and VPD (e.-h.) anomaly across tropical, temperate, cold, and arid climate zones. Lines represent linear 51 trends while shading indicates uncertainty (± 1σ) due to among-model variability for CMIP5 and model parameterization for satellite 52 estimates. Box and whisker plots (right panels), show the distribution of estimates for the full time period. For comparison, the CMIP5 53 model that considered nutrient constraints (dashed green line; green circle) is shown separately. Letters indicate statistically significant 54 differences in distributions at α = 0.05. 55
56
NATURE CLIMATE CHANGE | www.nature.com/natureclimatechange 7
SUPPLEMENTARY INFORMATIONDOI: 10.1038/NCLIMATE2879

Supplementary Figure 5. Spatial and latitudinal correlation between terrestrial net 57 primary productivity (NPP) and minimum temperature (TMIN) from 1982 to 2011. a. 58 CMIP5CO2+CLIM, b. CMIP5CLIM, and c. satellite estimates. In the latitudinal plots (right panels), 59 shading indicates uncertainty (± 1σ) due to among-model variability for CMIP5 and model 60 parameterization for satellite estimates. For comparison, the CMIP5 model that considered 61 nutrient constraints (CESM1-BGC; top panel, dashed line), satellite VOD (bottom panel, dotted 62 line), and satellite FPAR (bottom panel, dashed line) are shown separately. 63
64
8 NATURE CLIMATE CHANGE | www.nature.com/natureclimatechange
SUPPLEMENTARY INFORMATION DOI: 10.1038/NCLIMATE2879

Supplementary Figure 5. Spatial and latitudinal correlation between terrestrial net 57 primary productivity (NPP) and minimum temperature (TMIN) from 1982 to 2011. a. 58 CMIP5CO2+CLIM, b. CMIP5CLIM, and c. satellite estimates. In the latitudinal plots (right panels), 59 shading indicates uncertainty (± 1σ) due to among-model variability for CMIP5 and model 60 parameterization for satellite estimates. For comparison, the CMIP5 model that considered 61 nutrient constraints (CESM1-BGC; top panel, dashed line), satellite VOD (bottom panel, dotted 62 line), and satellite FPAR (bottom panel, dashed line) are shown separately. 63
64
Supplementary Figure 6. Spatial and latitudinal correlation between terrestrial net 65 primary productivity (NPP) and vapor pressure deficit (VPD) from 1982 to 2011 a. 66 CMIP5CO2+CLIM, b. CMIP5CLIM, and c. satellite estimates. In the latitudinal plots (right panels), 67 shading indicates uncertainty (± 1σ) due to among-model variability for CMIP5 and model 68 parameterization for satellite estimates. For comparison, the CMIP5 model that considered 69 nutrient constraints (CESM1-BGC; top panel, dashed line), satellite VOD (bottom panel, dotted 70 line), and satellite FPAR (bottom panel, dashed line) are shown separately. 71
72
NATURE CLIMATE CHANGE | www.nature.com/natureclimatechange 9
SUPPLEMENTARY INFORMATIONDOI: 10.1038/NCLIMATE2879

Supplementary Figure 7. Change in the sensitivity of CMIP5 terrestrial net primary 73 productivity (NPP) to vapor pressure deficit (VPD) and change in the variance of NPP and 74 VPD from 1982 to 2011. a.-c. Tropical, d.-f. temperate, g.-i. cold, and j.-l. arid climatic zones. 75 The change in the sensitivity of NPP to VPD was calculated as the unit change in NPP per unit 76 change in VPD using a 10-year sliding window. The change in the variance of NPP and VPD 77 was also calculated using a 10-year sliding window. Lines represent linear trends while shading 78 indicates uncertainty (± 1σ) due to among-model variability. 79
80
10 NATURE CLIMATE CHANGE | www.nature.com/natureclimatechange
SUPPLEMENTARY INFORMATION DOI: 10.1038/NCLIMATE2879

Supplementary Figure 7. Change in the sensitivity of CMIP5 terrestrial net primary 73 productivity (NPP) to vapor pressure deficit (VPD) and change in the variance of NPP and 74 VPD from 1982 to 2011. a.-c. Tropical, d.-f. temperate, g.-i. cold, and j.-l. arid climatic zones. 75 The change in the sensitivity of NPP to VPD was calculated as the unit change in NPP per unit 76 change in VPD using a 10-year sliding window. The change in the variance of NPP and VPD 77 was also calculated using a 10-year sliding window. Lines represent linear trends while shading 78 indicates uncertainty (± 1σ) due to among-model variability. 79
80
Supplementary Figure 8. Change in the sensitivity of satellite-derived terrestrial net 81 primary productivity (NPP) to vapor pressure deficit (VPD) and change in the variance of 82 NPP and VPD across climate zones from 1982 to 2011. a.-c. Tropical, d.-f. temperate, g.-i. 83 cold, and j.-l. arid climatic zones. The change in the sensitivity of NPP to VPD was calculated as 84 the unit change in NPP per unit change in VPD using a 10-year sliding window. The change in 85 the variance of NPP and VPD was also calculated using a 10-year sliding window. Lines 86 represent linear trends while shading indicates uncertainty (± 1σ) due to among-model 87 variability. For comparison, the change in sensitivity of FPAR to VPD (cyan lines) is shown 88 separately. 89
90
NATURE CLIMATE CHANGE | www.nature.com/natureclimatechange 11
SUPPLEMENTARY INFORMATIONDOI: 10.1038/NCLIMATE2879


![RSS-170 [Satellite Mobile Earth Stations]](https://static.fdocuments.us/doc/165x107/577d274a1a28ab4e1ea38a47/rss-170-satellite-mobile-earth-stations.jpg)