Large Displacement Analysis of Elasto-Plastic Thin … Displacement Analysis of Elasto-Plastic...
53
1 Large Displacement Analysis of Elasto-Plastic Thin-Walled Frames Part II: Verification and Application B.A. Izzuddin 1 and D. Lloyd Smith 2 ABSTRACT The companion paper presents a new Eulerian formulation for the large displacement analysis of thin-walled frames, accounting for the elasto-plastic material response. This paper aims at verifying the proposed formulation and providing several examples of its application to thin- walled members and frames. In this regard, it is demonstrated that such a relatively simple formulation enables the accurate modelling of initial imperfections, residual stresses, the Wagner effect, the beam-column effect, lateral torsional instability and large displacements using a small number of elements and a coarse cross-sectional discretisation. Moreover, it is shown that the formulation can be used in the assessment of the ultimate and post-ultimate response of thin-walled structures for which the design codes are either inaccurate or inapplicable. Such structures include continuous beams, simply supported beams with intermediate lateral restraints, as well as frames for which the ultimate limit state involves considerable interaction between the structural members. KEYWORDS Thin-walled frames. Large displacements. Elasto-plastic analysis. Lateral-torsional buckling. INTRODUCTION 1 Lecturer in Engineering Computing, Department of Civil Engineering, Imperial College, London SW7 2BU, U.K. 2 Reader in Structural Mechanics, Department of Civil Engineering, Imperial College, London SW7 2BU, U.K.
-
Upload
truongduong -
Category
Documents
-
view
215 -
download
0
Transcript of Large Displacement Analysis of Elasto-Plastic Thin … Displacement Analysis of Elasto-Plastic...

1
Large Displacement Analysis of Elasto-Plastic Thin-Walled Frames
Part II: Verification and Application
B.A. Izzuddin1 and D. Lloyd Smith2
ABSTRACT
The companion paper presents a new Eulerian formulation for the large displacement analysis
of thin-walled frames, accounting for the elasto-plastic material response. This paper aims at
verifying the proposed formulation and providing several examples of its application to thin-
walled members and frames. In this regard, it is demonstrated that such a relatively simple
formulation enables the accurate modelling of initial imperfections, residual stresses, the
Wagner effect, the beam-column effect, lateral torsional instability and large displacements
using a small number of elements and a coarse cross-sectional discretisation. Moreover, it is
shown that the formulation can be used in the assessment of the ultimate and post-ultimate
response of thin-walled structures for which the design codes are either inaccurate or
inapplicable. Such structures include continuous beams, simply supported beams with
intermediate lateral restraints, as well as frames for which the ultimate limit state involves
considerable interaction between the structural members.
KEYWORDS
Thin-walled frames. Large displacements. Elasto-plastic analysis. Lateral-torsional buckling.
INTRODUCTION
1 Lecturer in Engineering Computing, Department of Civil Engineering, Imperial College, London SW7 2BU,
U.K.
2 Reader in Structural Mechanics, Department of Civil Engineering, Imperial College, London SW7 2BU, U.K.

2
The companion paper (Izzuddin and Lloyd Smith, 1995) presents a new one-dimensional
formulation for the large displacement elasto-plastic analysis of thin-walled frames with
members of open cross-sectional form. The proposed formulation is derived in a local
Eulerian system, which enables the use of simplified strain-displacement relationships at
local element level without compromising the accuracy of modelling geometric nonlinearities
in the global response. Consequently, the formulation can be used to model the elasto-plastic
response of thin-walled frames subject to flexural and lateral torsional instability.
In the Eulerian system, the proposed formulation uses cubic shape functions for the
transverse displacements and angle of twist, hence the name 'cubic formulation', and a linear
shape function for the axial displacement. The cubic formulation accounts for initial
imperfections, residual stresses and the Wagner effect, and it utilises cross-sectional
discretisation into monitoring areas at two Gauss integration points to model the spread of
material plasticity over the cross-section and along the member. In this regard, the
replacement of the shear strain by a rate of twist generalised strain within the cubic
formulation enables a coarse discretisation of the cross-section. Moreover, the versatility of
the large displacement Eulerian approach allows a small number of elements to be used
without significant loss in accuracy.
The cubic formulation has been implemented within ADAPTIC (Izzuddin, 1991), which is a
general purpose computer program for the nonlinear analysis of steel, concrete and composite
framed structures. ADAPTIC v2.5.1 is used herein for verifying the accuracy of the cubic
formulation and illustrating its applicability to the large displacement elasto-plastic analysis
of members and frames with thin-walled open cross-sections.
The paper proceeds by presenting several verification examples, for which comparisons are
made against theoretical solutions, as well as against results obtained from other
experimental and analytical research work. In this set of examples, considerable attention is
paid to the significance of the assumptions made in the derivation of the cubic formulation
and their influence on its resulting accuracy and applicability.

3
After verification, there follows two application examples, illustrating the utility of the
proposed formulation in the assessment of the ultimate, as well as the post-ultimate response
of thin-walled members and frames. The objective is to demonstrate that the one-dimensional
cubic formulation represents a simple, yet powerful, tool for studying the large displacement
elasto-plastic response of thin-walled structures, providing accurate results with
computational efficiency.
VERIFICATION
Five examples are presented hereafter to illustrate the accuracy of the cubic formulation, to
validate some of the assumptions made in its derivation, and to show the sensitivity of the
results to variations in model parameters.
Elastic Cantilever with Cruciform Cross-section
An elastic cantilever with a cruciform cross-section is subjected to a compressive axial force,
as shown in Fig. 1. The theoretical values for the torsional buckling load (Pc1) and the
flexural buckling load (Pc2) are given by the following expressions (Allen and Bulson, 1980):
Pc1 GJ A
Iy Iz
288.4 kN (1.a)
Pc2 2EIy
4L2 1729
L2 kN (L in meters) (1.b)
In order to investigate the ability of the cubic formulation to predict the torsional buckling
response, which is due to the Wagner effect, a short cantilever (L=2m) is first chosen such
that (Pc1) is less than (Pc2). The elastic analysis is undertaken using two meshes of 2
elements (N2) and 4 elements (N4), respectively. Two imperfection levels are also
considered, both of which vary linearly from zero values at the support; the first (I1) assumes
a (1 mm) transverse imperfection and a (210–4 rad) twist imperfection at the cantilever tip,
whereas the second (I2) assumes the higher values of (4 mm) and (10–2 rad) for the tip
transverse and twist imperfection, respectively. Moreover, two cross-sectional discretisations
4
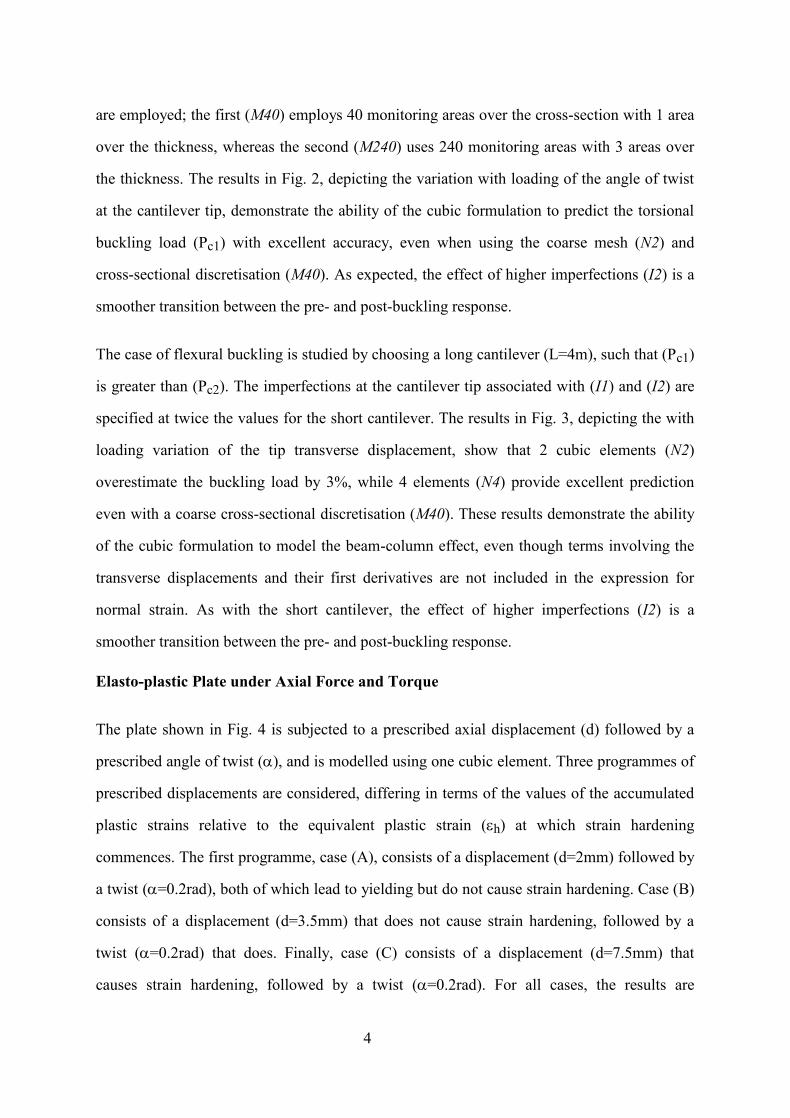
are employed; the first (M40) employs 40 monitoring areas over the cross-section with 1 area
over the thickness, whereas the second (M240) uses 240 monitoring areas with 3 areas over
the thickness. The results in Fig. 2, depicting the variation with loading of the angle of twist
at the cantilever tip, demonstrate the ability of the cubic formulation to predict the torsional
buckling load (Pc1) with excellent accuracy, even when using the coarse mesh (N2) and
cross-sectional discretisation (M40). As expected, the effect of higher imperfections (I2) is a
smoother transition between the pre- and post-buckling response.
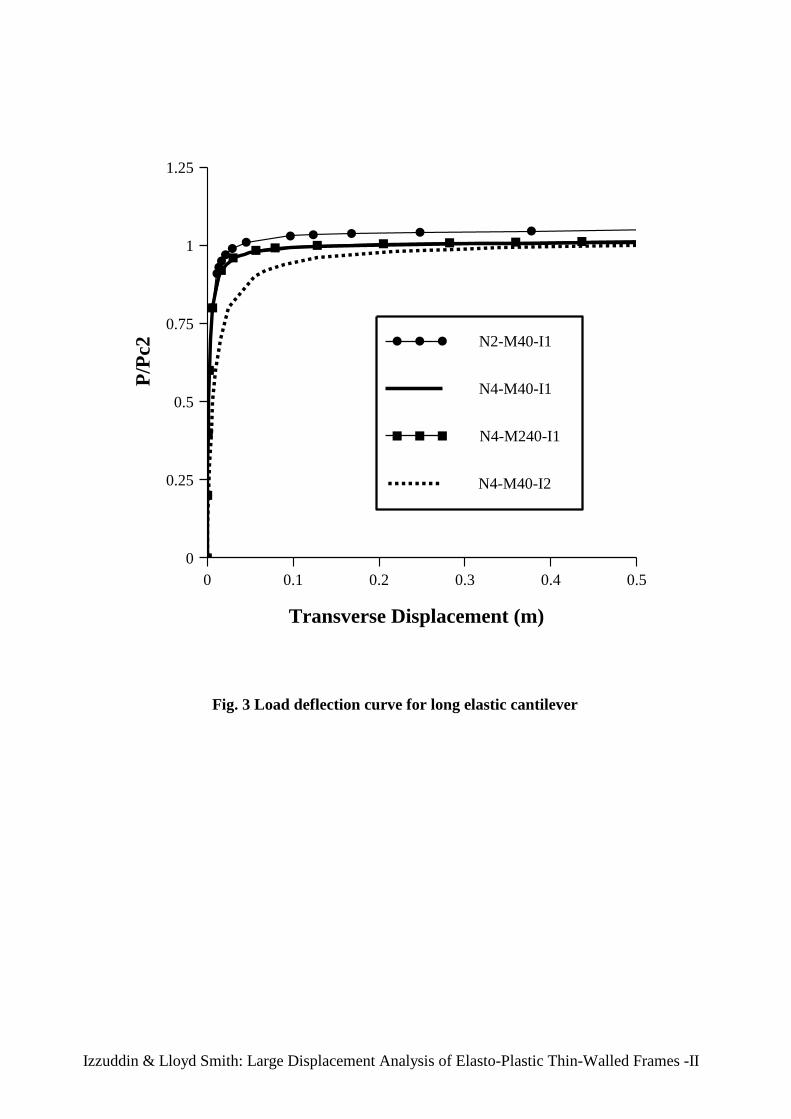
The case of flexural buckling is studied by choosing a long cantilever (L=4m), such that (Pc1)
is greater than (Pc2). The imperfections at the cantilever tip associated with (I1) and (I2) are
specified at twice the values for the short cantilever. The results in Fig. 3, depicting the with
loading variation of the tip transverse displacement, show that 2 cubic elements (N2)
overestimate the buckling load by 3%, while 4 elements (N4) provide excellent prediction
even with a coarse cross-sectional discretisation (M40). These results demonstrate the ability
of the cubic formulation to model the beam-column effect, even though terms involving the
transverse displacements and their first derivatives are not included in the expression for
normal strain. As with the short cantilever, the effect of higher imperfections (I2) is a
smoother transition between the pre- and post-buckling response.
Elasto-plastic Plate under Axial Force and Torque
The plate shown in Fig. 4 is subjected to a prescribed axial displacement (d) followed by a
prescribed angle of twist (), and is modelled using one cubic element. Three programmes of
prescribed displacements are considered, differing in terms of the values of the accumulated
plastic strains relative to the equivalent plastic strain (h) at which strain hardening
commences. The first programme, case (A), consists of a displacement (d=2mm) followed by
a twist (=0.2rad), both of which lead to yielding but do not cause strain hardening. Case (B)
consists of a displacement (d=3.5mm) that does not cause strain hardening, followed by a
twist (=0.2rad) that does. Finally, case (C) consists of a displacement (d=7.5mm) that
causes strain hardening, followed by a twist (=0.2rad). For all cases, the results are

5
displayed in the form of interaction curves between the axial force (P) and the torque (T)
needed to sustain the prescribed displacements, both being normalised with respect to the
fully plastic axial force (P0=300kN) and the fully plastic twisting moment (T0=866kN.m).
As expected, the results presented in Fig. 5 for case (A) do not show a difference between the
isotropic and kinematic hardening models, since the accumulated plastic strains do not
exceed (h). It may be inferred from Fig. 5 that, in the absence of strain hardening, the
Wagner effect would cause (T0) to be exceeded if twisting were to be continued. The
accuracy of the backward Euler approach in material plasticity calculations is demonstrated
in Fig. 6, where the application of the full load in 10 incremental steps is shown to provide
accurate prediction within 3% of that obtained using 50 incremental steps. In Fig. 7, the effect
of varying the number and distribution of monitoring areas is considered. There, it is
demonstrated that a coarse discretisation of (110) monitoring areas, representing 1 area over
the plate thickness and 10 areas over the plate width, provides a prediction within 3% of that
obtained using the fine discretisation of (550) areas for a large part of the loading history. It
is also shown that the optimum distribution of monitoring areas, which combines efficiency
and accuracy in the twisting phase, consists of 3 through-thickness areas.
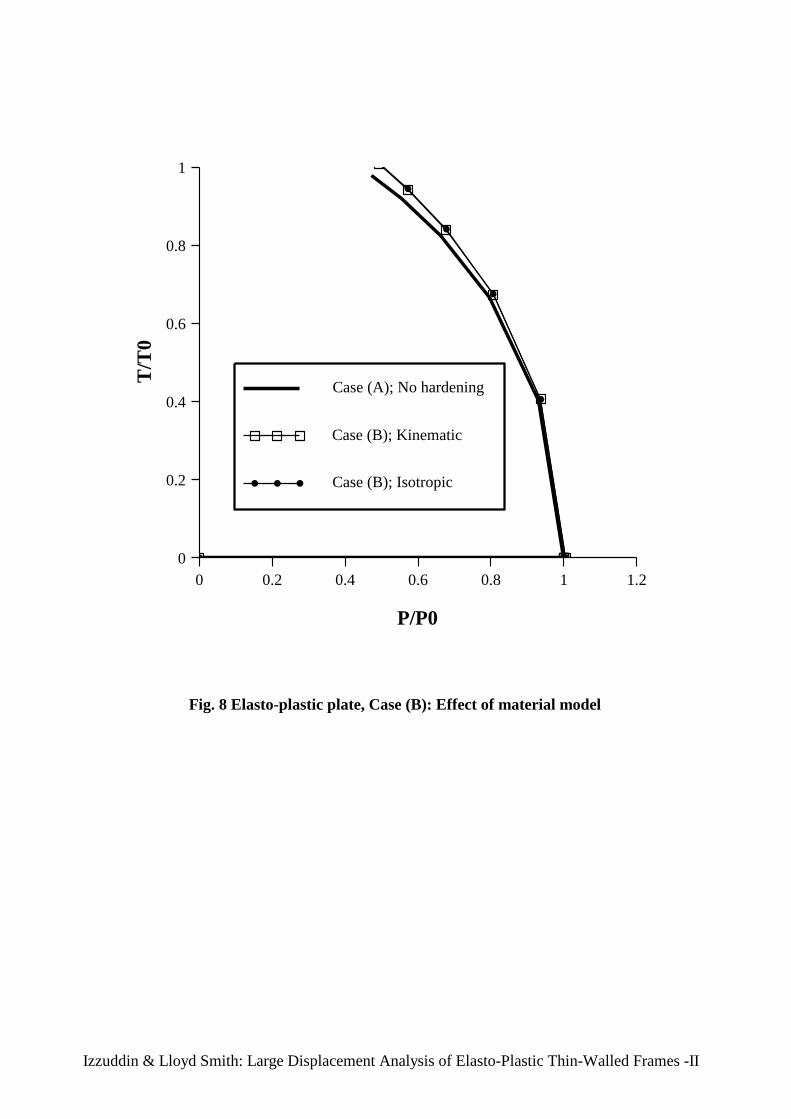
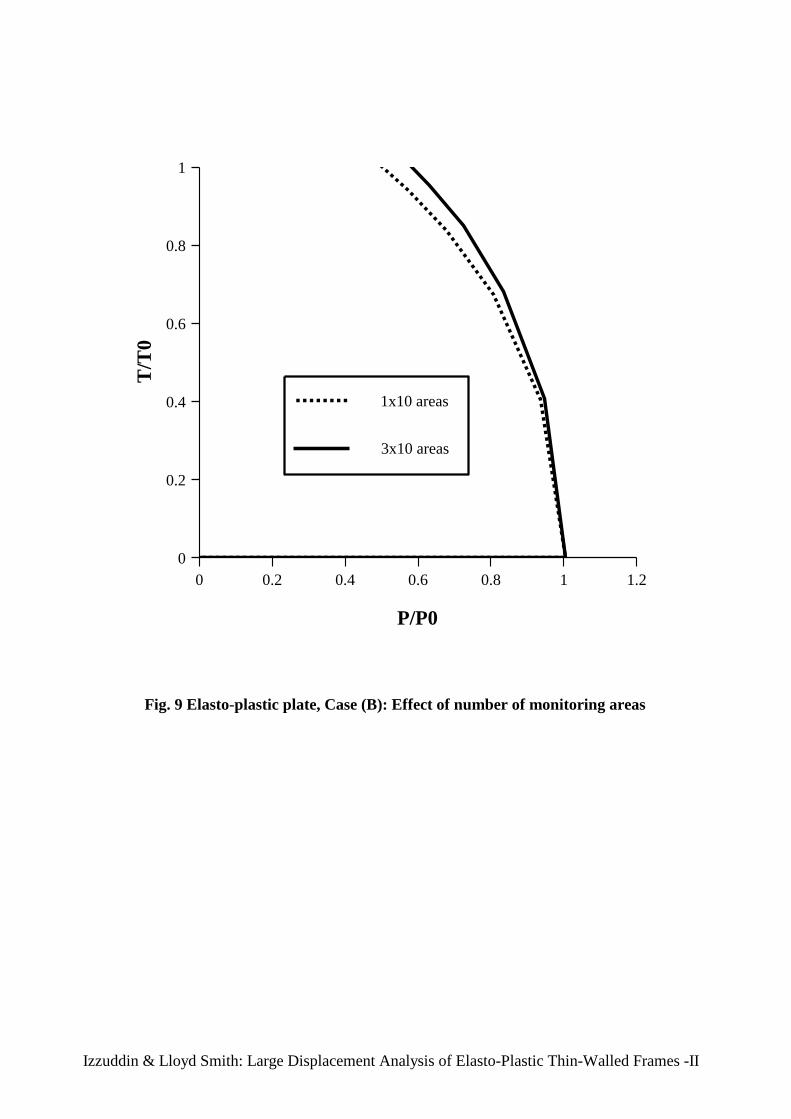
The results for case (B), depicted in Fig. 8, show the strain hardening effect in comparison
with case (A), although both the kinematic and isotropic models provide almost identical
predictions. The latter observation is consistent with the fact that the accumulated plastic
strain is not significantly larger than (h), and that no load reversals are applied which would
show differences between predictions based on interaction curve translation and expansion.
The effect of varying the monitoring areas for kinematic hardening is presented in Fig. 9,
where again it is demonstrated that a coarse discretisation of (110) monitoring areas
provides a prediction within 3% of that obtained using (310) monitoring areas for a large
part of the loading history.
Finally, the results for case (C) in Fig. 10 show the strain hardening effect in comparison with
case (A), and demonstrate significant differences between the kinematic and isotropic

6
models. The predictions of the two models coincide in the axial loading phase; however, the
isotropic model overestimates the torque in the twisting phase, since it is associated with
interaction curve expansion rather than translation. Here again, the accuracy of the backward
Euler approach is illustrated in Fig. 11, where the application of the full load in 10
incremental steps provides a prediction within 3% of that obtained using 50 incremental
steps.
I-Beam under Non-uniform Torsion
The I-beam shown in Fig. 12 is subjected to a midspan torque and is restrained against twist
at the two ends. It is modelled using 10 cubic elements of equal length, and the cross-section
is discretised into 200 monitoring areas with 5 through-thickness areas. The cases of perfect
plasticity (H'=0) and kinematic strain hardening (H'=0.02E) are considered, and the
equivalent plastic strain at which hardening commences (h) is assumed to be zero. Fig. 13
shows a good agreement between the results for the case of perfect plasticity (H'=0) and the
analytical results of Chen and Trahair (1992), even though these authors have adopted a more
complex distribution (based on a mitre model) of torsional shear strains. Comparison with the
experimental results of Farwell and Galambos (1969) is more favourable for the case of strain
hardening (H'=0.02E). However, as no information is available regarding the material
hardening characteristics, it is possible that the response is underestimated by the perfectly
plastic model (H'=0) due to residual stresses in the plate specimen or due to locked tensile
forces in the experimental set-up, as suggested by Chen and Trahair (1992).
Cantilever Subject to LTB
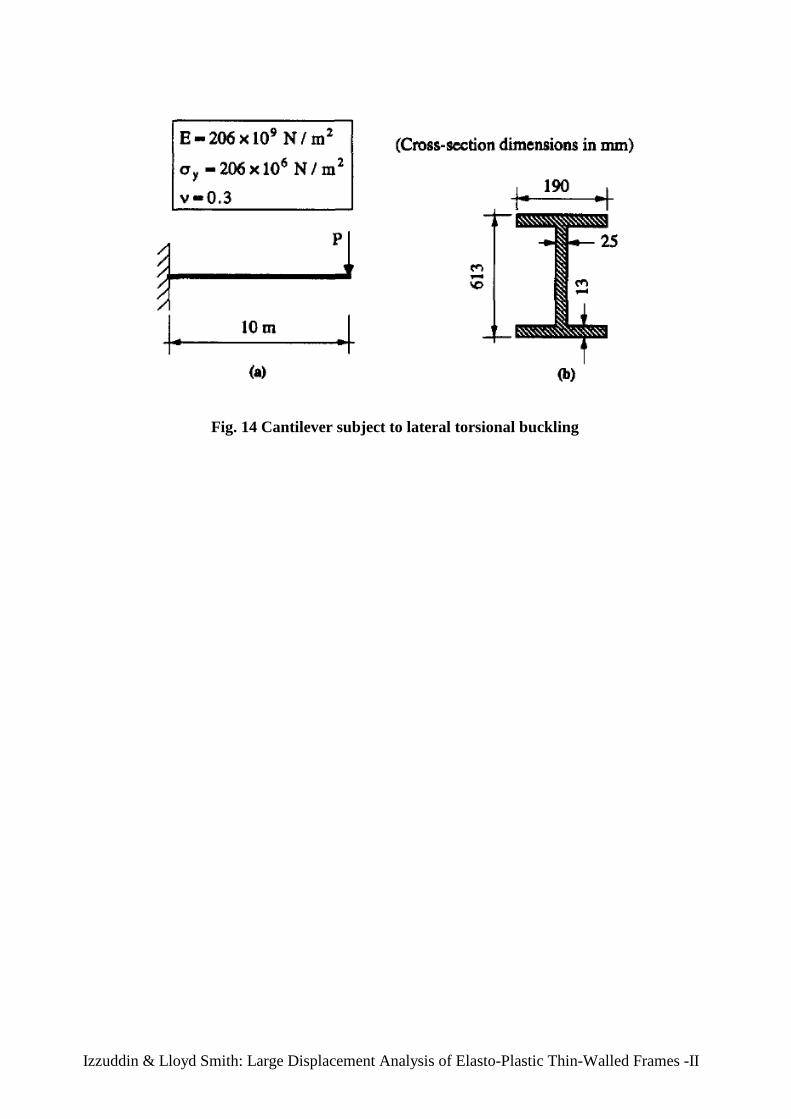
The cantilever in Fig. 14 is subjected to a vertical load at its tip, and is fully restrained against
cross-sectional warping at the support. Its elastic lateral torsional buckling load (Pcr) is given
by (e.g. Trahair, 1993):
P cr
EIy GJ
L2 3.95 3.522 EIw
GJ L2
47.35kN (2)

7
The cantilever is modelled using 10 cubic elements of equal length. Two twist imperfection
levels are considered, which vary linearly from zero values at the support to values of (10-
3rad) and (0.1rad) at the tip, respectively.
For the low imperfection level, the results of the lateral tip displacement in Fig. 15
demonstrate the ability of the cubic formulation to predict the elastic buckling load with
excellent accuracy. The elasto-plastic response, in which perfect plasticity is assumed,
exhibits an ultimate point which is very close to the elastic buckling load, since the fully
plastic collapse load is 58% more than the elastic buckling load. It is important to note that
the use of a uniaxial elasto-plastic material model, in which plasticity is based only on the
normal stresses, provides a relatively accurate prediction in comparison with that of the
biaxial material model, in which the interaction with torsional shear stresses is included. As
shown in Fig. 15, the uniaxial and biaxial models compare closely up to a considerable lateral
tip displacement of (1m). This is an expected result, since the stress state at the point of
lateral torsional buckling consists chiefly of normal stresses, shear stresses becoming
significant only after considerable twisting is achieved in the post-buckling range.
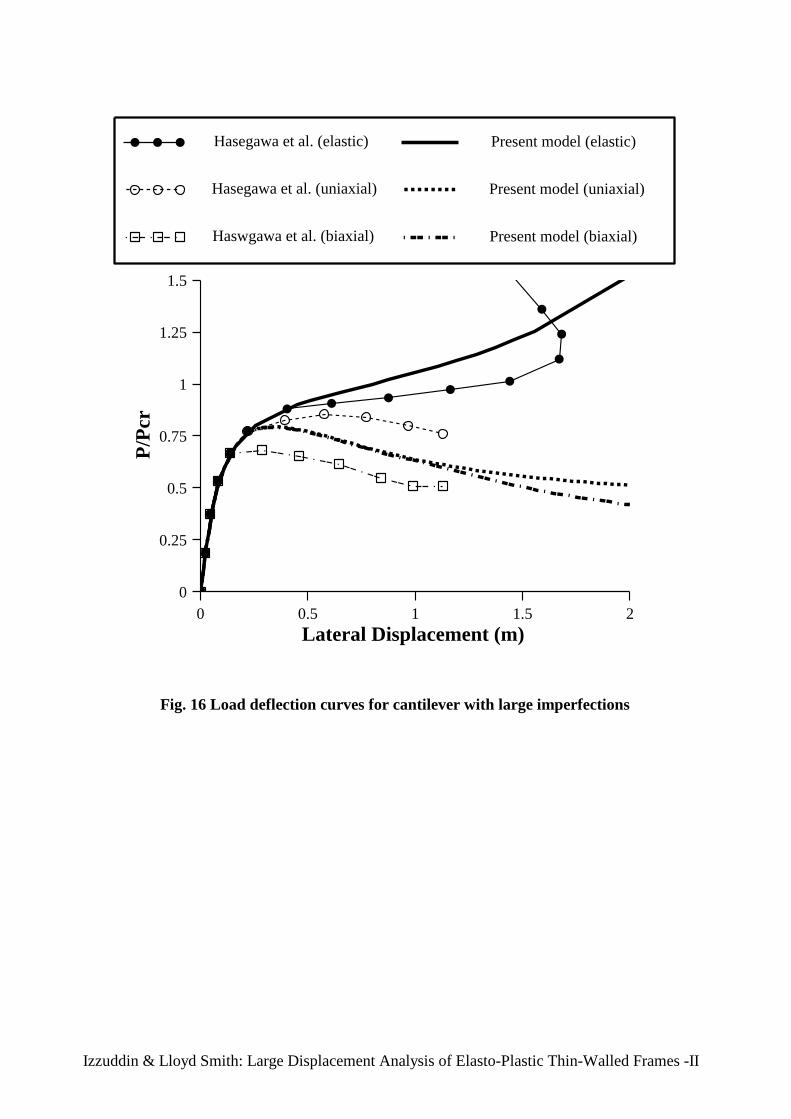
For the high imperfection level, the elastic response exhibits a smoother transition between
the pre- and post-buckling paths, as shown in Fig. 16. Comparison with the results of
Hasegawa et al. (1987), obtained for an equivalent level of imperfection, shows considerable
discrepancy in the elastic post-buckling range. This is conceivably due to the inability of their
formulation to model sufficiently accurately the effects of large displacements and rotations.
However, more significantly, the present authors believe that the results of Hasegawa and
coworkers, based on their biaxial material model, underestimate the elasto-plastic buckling
load considerably. Such an outcome is most likely due to their erroneous assumption that the
tangent shear modulus is always proportional to the normal tangent modulus. As explained
previously, since the shear stresses are very small in the early stages of lateral torsional
buckling, the tangent shear modulus should remain very close to the elastic value. Therefore,
as far as the elasto-plastic buckling load is concerned, no considerable discrepancy would be
expected between the results of the biaxial and uniaxial material models.

8
I-Beam Subject to LTB
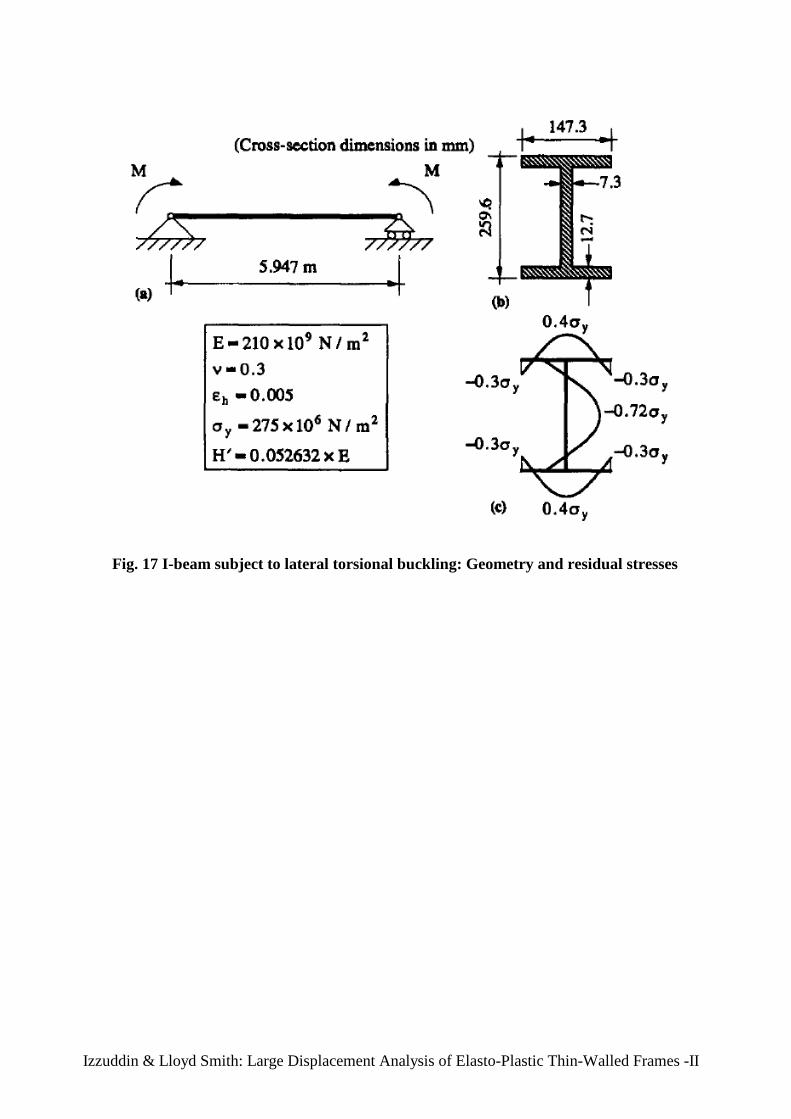
In Fig. 17, an I-beam is subjected to uniform bending moment about its major axis, applied
by means of two quasi-tangential end moments (Ziegler, 1968). Restraint against twisting and
warping is provided at the beam ends, and a twist imperfection is present, varying at the rate
of (10–3rad/m) from a zero value at the left end.
The beam length (L=5.947m) is chosen such that the elastic buckling load (Mcr) is identical
to the fully plastic collapse load (Mp), where the former is obtained from the following
expression (Chajes, 1974):
Mcr
0.883L
EIy
GJ
2 EIw
(0.492L)2
Mp 155 kN.m (3)
In this expression, () is Chwalla's constant, accounting for the effect of pre-buckling vertical
displacement on the buckling load (Bleich, 1952):
1Iy
Iz
0.67 (4)
Firstly, the nonlinear elastic response of the beam without residual stresses is considered,
where the number of cubic elements and the cross-sectional discretisation are varied. The
results in Fig. 18 for the midspan lateral displacement demonstrate the accuracy of the cubic
formulation, which is capable of predicting the buckling load within 3% using 4 elements,
and almost exactly using 6 elements. It is also shown that a coarse cross-sectional
discretisation using (150) monitoring areas, representing 1 monitoring area over the
thickness and 50 over the total length of component plates, provides good accuracy in
comparison with the finer discretisation of (3100) monitoring areas.
For the elasto-plastic response of the beam without residual stresses, Fig. 19 shows a
reduction in the ultimate capacity of 15% from the elastic case. Again, the accuracy of the
cubic formulation is demonstrated; only 4 elements with (150) monitoring areas are shown

9
to provide a very good prediction in comparison with the finer mesh of 10 elements and
cross-sectional discretisation of (3100) areas.
The influence of the Wagner effect and residual stresses on the elasto-plastic response is also
investigated. A parabolic pattern of residual stresses (Fig. 17), similar to that used by
Nethercot (1975), is adopted. Consideration of the load deflection curves in Fig. 20
demonstrates that the Wagner effect does not affect the ultimate capacity of the beam without
residual stresses. This is an expected result, since the beam is subject to bending about a
cross-sectional axis of symmetry, and hence the torsional stiffness is not affected. For the
beam with residual stresses, the Wagner effect has a small influence of less than 1%, which is
due to the introduction of asymmetry in the compressive and tensile stresses prior to
buckling, leading to modification in the torsional stiffness. However, more significantly,
residual stresses are shown to lead to a reduction in the ultimate capacity of 26% from the
elastic case, as compared to 15% for the beam without residual stresses, which is primarily
due to earlier yielding.
Finally, the effect of the material strain hardening is considered, where the cases of
kinematic, isotropic and perfect plasticity are studied. For this purpose, the beam is loaded
with sagging moments until a midspan twist rotation of (1.4rad) is achieved. This is followed
by an unloading-reloading phase with hogging moments. The results shown in Figs. 21.a and
21.b for the midspan angle of twist and lateral displacement, respectively, demonstrate no
significant difference between kinematic and isotropic hardening in the loading phase.
However, as expected, the isotropic model overestimates the response in the unloading-
reloading phase, since hardening is based on interaction curve expansion rather than
translation. Moreover, the case of perfect plasticity underestimates the response after
considerable displacements, which is also an expected result. The deflected shapes of the
beam assuming kinematic hardening are shown in Figs. 22.a-c.
10
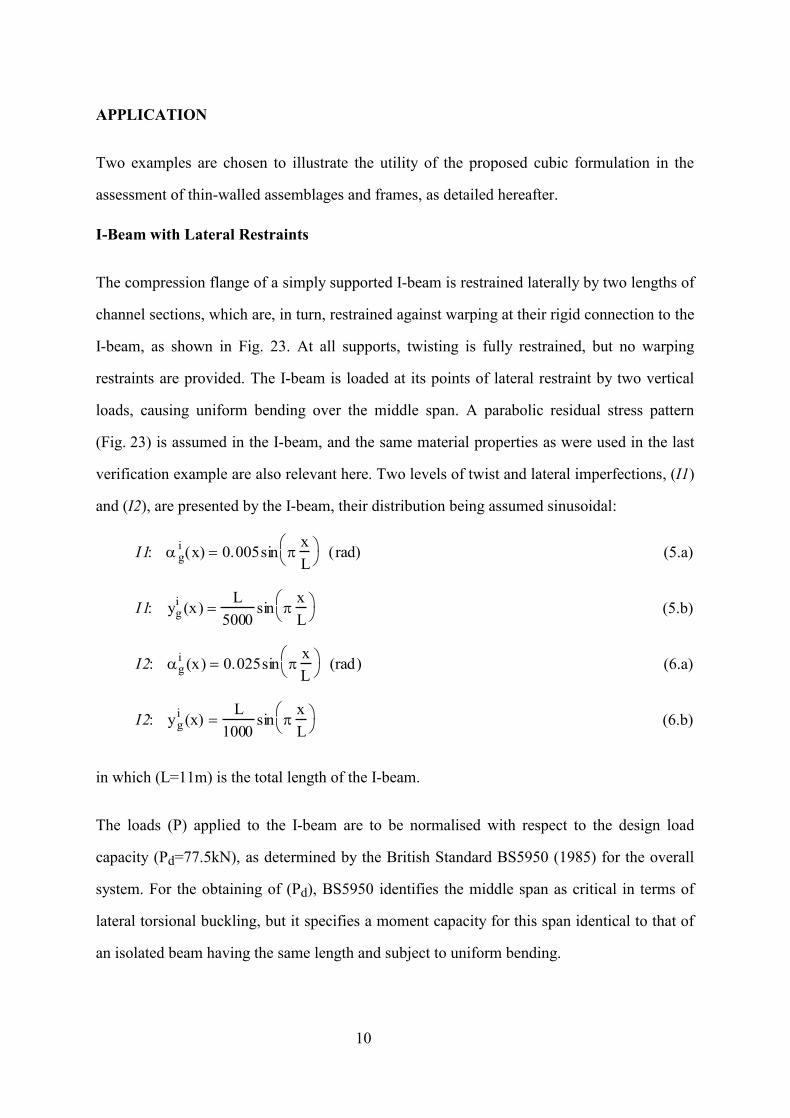
APPLICATION
Two examples are chosen to illustrate the utility of the proposed cubic formulation in the
assessment of thin-walled assemblages and frames, as detailed hereafter.
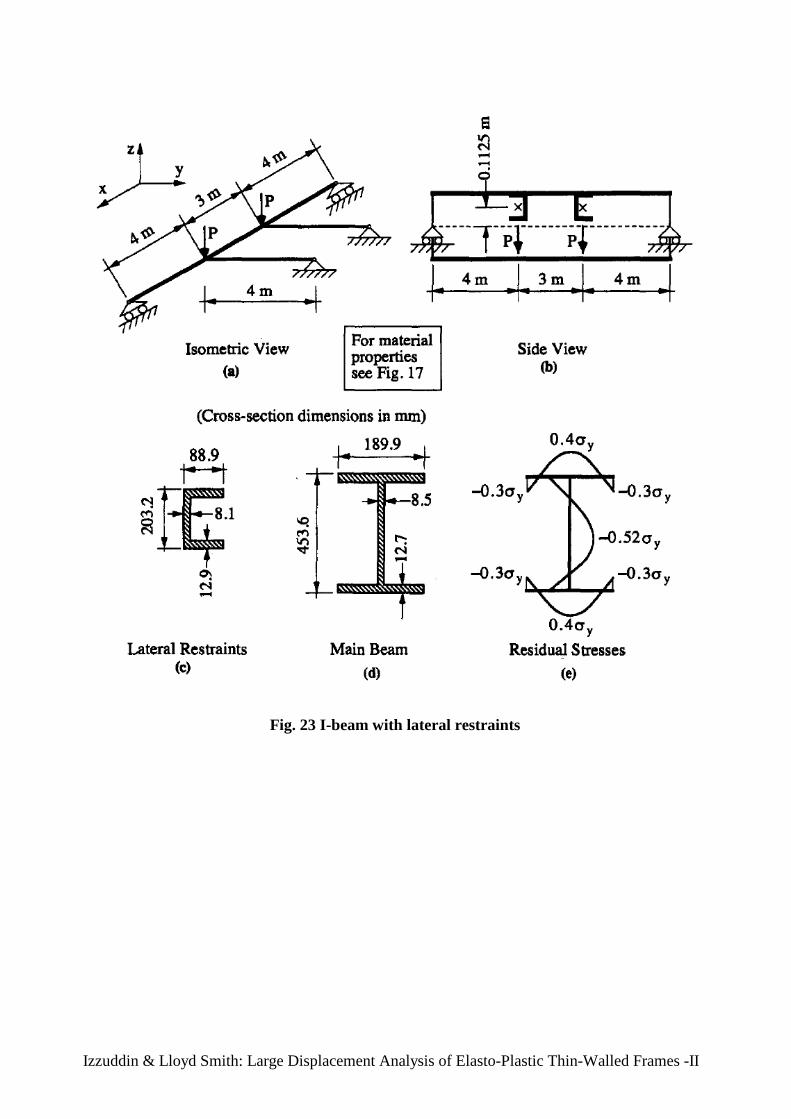
I-Beam with Lateral Restraints
The compression flange of a simply supported I-beam is restrained laterally by two lengths of
channel sections, which are, in turn, restrained against warping at their rigid connection to the
I-beam, as shown in Fig. 23. At all supports, twisting is fully restrained, but no warping
restraints are provided. The I-beam is loaded at its points of lateral restraint by two vertical
loads, causing uniform bending over the middle span. A parabolic residual stress pattern
(Fig. 23) is assumed in the I-beam, and the same material properties as were used in the last
verification example are also relevant here. Two levels of twist and lateral imperfections, (I1)
and (I2), are presented by the I-beam, their distribution being assumed sinusoidal:
I1: gi(x) 0.005sin
x
L
(rad) (5.a)
I1: ygi(x)
L
5000sin
x
L
(5.b)
I2: gi(x) 0.025sin
x
L
(rad) (6.a)
I2: ygi(x)
L
1000sin
x
L
(6.b)
in which (L=11m) is the total length of the I-beam.
The loads (P) applied to the I-beam are to be normalised with respect to the design load
capacity (Pd=77.5kN), as determined by the British Standard BS5950 (1985) for the overall
system. For the obtaining of (Pd), BS5950 identifies the middle span as critical in terms of
lateral torsional buckling, but it specifies a moment capacity for this span identical to that of
an isolated beam having the same length and subject to uniform bending.

11
To study the accuracy of the design code requirements, the elasto-plastic response of the I-
beam is determined using three different models. A first model (F) is based on full modelling
of the I-beam and the lateral restraints using cubic elements. The second is a reduced model
(R), where the lateral restraints are not modelled explicitly, but their effect is approximated
by applying full lateral and torsional restraints to the I-beam at the points of loading. Finally,
model (B) is concerned only with the critical middle span, where a 3 meter simply supported
I-beam under uniform bending is considered in isolation; it is assumed to have only lateral
and twist restraints at its ends, without accounting for any warping or minor axis bending
restraints.
Results obtained from the three models for the two imperfection levels are shown in Figs.
24.a and 24.b for the midspan angle of twist and lateral displacement, respectively. It is
observed that the full model (F) predicts an ultimate load which is over 20% greater than
(Pd), and which is not significantly affected by the level of imperfections. A similar
prediction is observed for the reduced model (R), which implies that the effect of the lateral
restraints may be approximated by full lateral and torsional restraints at the two loading
points, but only as far as the ultimate load capacity is concerned. The isolated beam model
(B) predicts an ultimate load which is 10% greater than (Pd) for the low imperfection level,
and which is almost identical to (Pd) for the higher imperfection level. Final deflected shapes
for the full system and the isolated beam are shown in Figs. 25 and 26, respectively.
The above observations indicate a very good agreement between the predictions of the cubic
formulation and BS5950 for the isolated I-beam, model (B), particularly considering that the
design code incorporates realistic imperfections in its empirical expressions for the ultimate
load. However, it is demonstrated that BS5950 underestimates considerably the ultimate load
of the full system, which is shown to be fairly insensitive to imperfections. This
underestimate is attributed to the fact that BS5950 does not account for the interaction
between the middle span and the adjacent spans, which leads to partial restraints of warping
and minor axis bending at the two ends of the middle span beam.

12
Triangular Frame
The triangular frame shown in Fig. 27 uses 'Y' and channel cross-sections for its columns and
beams, respectively. Two forms of the frame, an unbraced frame (U) and a braced frame (B),
are considered; in the latter, the braces comprise rectangular plates fixed to the top flanges of
the beams. The columns are fully built-in at the supports, while the beams are assumed to be
restrained against warping at the beam-column connections. Three midspan point loads are
applied on the beams at the intersection of the top flange with the web, where the value of
each of the two rear loads is half that of the front load. The same material properties as were
used for the last verification example are also relevant for this frame.
For each type of frame, unbraced (U) and braced (B), the elastic response (E) and elasto-
plastic response (P) are determined using 10 cubic elements per member. The resulting load
deflection curves are shown in Figs. 28.a and 28.b for the midspan vertical displacements of
the front and rear beams, respectively. In these figures, the applied load is normalised with
respect to the plastic collapse load (Pp 323kN ) of the frame, corresponding to a
mechanism restricted to the front beam.
The elastic response of the unbraced frame (E-U) is characterised by an increase in the
displacement rate of the front beam at a load factor of 0.6 and a similar increase for the rear
beams at a load factor of 1.2. Each of these events is associated with elastic lateral torsional
buckling of the corresponding beam, reflecting the uncoupled responses of the beams in the
unbraced frame.
For the braced frame, the elastic response (E-B) exhibits a greater buckling resistance
corresponding to a load factor of 1.61, at which point all beams undergo lateral torsional
buckling simultaneously. The braces effect a considerable improvement in the buckling
resistance for the loading under consideration, since they force the rear beams to buckle in an
unfavourable direction, namely inwards instead of outwards.

13
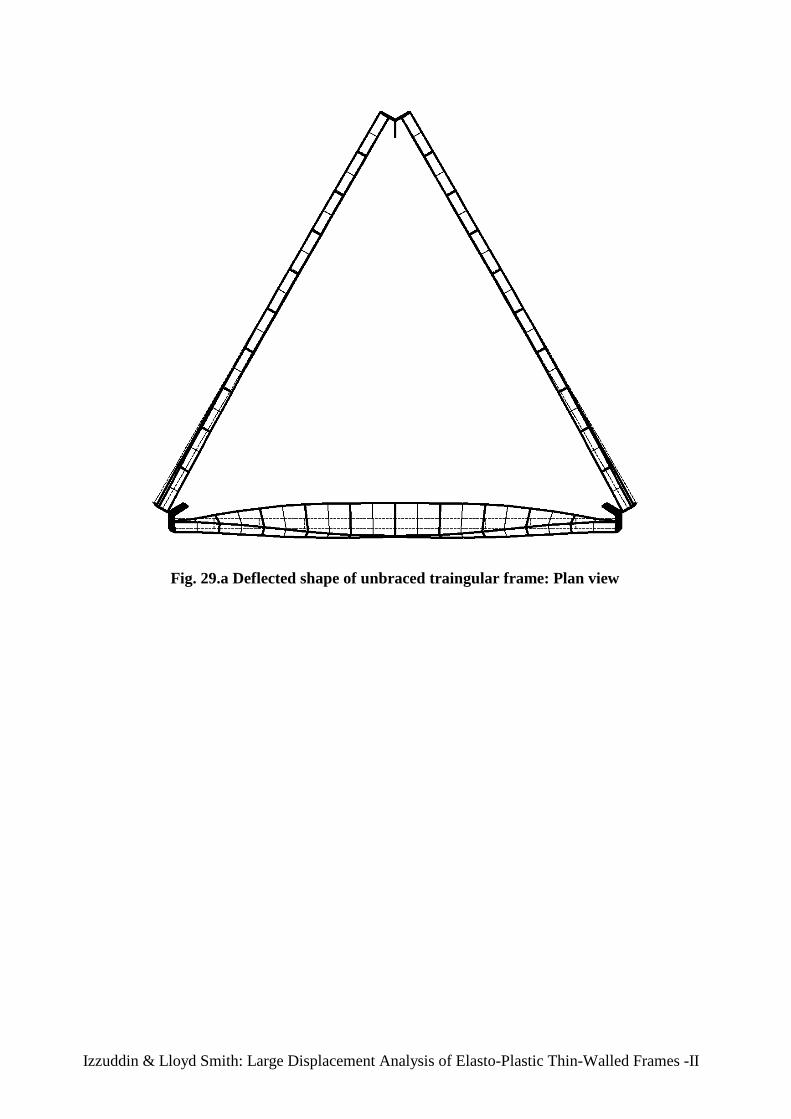
The elasto-plastic response of the unbraced frame (P-U) exhibits failure at a load factor of
0.446, which is associated with lateral torsional buckling of the front beam only. The final
deflected shape of the unbraced frame is shown in Figs. 29.a and 29.b in plan and isometric
views, respectively.
The effect of bracing on the elasto-plastic response (P-B) is to delay failure of the frame until
the load on the front beam is close to its theoretical plastic collapse value, thus achieving a
failure load factor of 0.894. However, the failure mode is not restricted to the front beam; it
involves lateral torsional buckling of all the beams, axial-flexural yielding of the front braces,
and flexural buckling of the rear brace, as shown in Figs. 30.a and 30.b. If the braces are
assumed to remain elastic, due to higher yield strength, the response (P-BE) of the frame
manifests a resistance increased to a load factor of 0.916, and considerable enhancement of
the post buckling behaviour.
CONCLUSION
A new one-dimensional formulation is presented in the companion paper, which is applicable
to the large displacement analysis of thin-walled frames with members of open cross-
sectional form. The formulation is derived in a local Eulerian system, where simplified strain-
displacement relationships are used. This paper verifies the proposed formulation, establishes
the sensitivity of its predictions to variation of model parameters, and provides some
examples of its application to thin-walled members and frames.
Several verification examples show that the proposed cubic formulation is capable of
modelling the beam-column effect, the Wagner effect and lateral torsional instability. It is
also established that good accuracy can be achieved with as few as four elements per
member, as well as a coarse cross-sectional discretisation comprising one monitoring area
over the thickness of component plates. In addition, it is demonstrated that the adopted
backward Euler approach for material plasticity calculations is fairly insensitive to the size of
the incremental load step.

14
For problems of lateral torsional instability, it is observed that material models based on
uniaxial plasticity provide very good predictions of the elasto-plastic buckling load. The use
of biaxial plasticity models is shown to be necessary only in the determination of the post-
buckling response at large displacements. In addition, the distinction between isotropic and
kinematic strain hardening is demonstrated to be relevant only for cases of load reversal in
the hardening range.
Finally, two application examples show the utility of the cubic formulation in the assessment
of the ultimate and post-ultimate response of thin-walled assemblages and frames. In one
example, it is demonstrated that design codes which do not account for the interaction
between the structural members at failure can be overly conservative.

15
REFERENCES
1. Allen, H.G. and Bulson, P.S., 1980. Background to Buckling, McGraw Hill Book
Company, Ltd., London.
2. Bleich, F., 1952. Buckling Strength of Metal Structures, McGraw Hill Book Company,
London.
3. BS5950, 1985. Structural Use of Steelwork in Building, Part 1, British Standards
Institution, U.K.
4. Chajes, A., 1974. Principles of Structural Stability Theory, Prentice-Hall, Englewood
Cliffs, N.J.
5. Chen, G. and Trahair, N.S., 1992. "Inelastic Nonuniform Torsion of Steel I-Beams",
Journal of Constructional Steel Research, Vol. 23, pp. 189-207.
6. Farwell, C.R. and Galambos, T.V., 1969. "Nonuniform Torsion of Steel Beams in
Inelastic Range", Journal of the Structural Division, ASCE, Vol. 95, No. ST12, pp.
2813-2829.
7. Hasegawa, A., Liyanage, K.K., Noda, M. and Nishino, F., 1987. "An Inelastic Finite
Displacement Formulation of Thin-Walled Members", Structural
Engineering/Earthquake Engineering, Vol. 4, No. 2, pp. 269-276.
8. Izzuddin, B.A. and Lloyd Smith, D., 1995. "Large Displacement Analysis of Elasto-
Plastic Thin-Walled Frames. Part I: Formulation and Implementation", Companion
paper.
9. Izzuddin, B.A., 1991. "Nonlinear Dynamic Analysis of Framed Structures", Thesis
submitted for the degree of Doctor of Philosophy in the University of London,
Department of Civil Engineering, Imperial College, London.
16
10. Nethercot, D.A., 1975. "Inelastic Buckling of Steel Beams under Non-Uniform
Moment", The Structural Engineer, Vol. 53, No. 2, pp. 73-78.
11. Trahair, N.S., 1993. Flexural-Torsional Buckling of Structures, E & FN Spon,
Chapman and Hall, London.
12. Ziegler, H., 1968. Principles of Structural Stability, Blaisdell Publishing Company,
London.

Izzuddin & Lloyd Smith: Large Displacement Analysis of Elasto-Plastic Thin-Walled Frames -II
Fig. 1 Elastic cantilever with cruciform cross-section

Izzuddin & Lloyd Smith: Large Displacement Analysis of Elasto-Plastic Thin-Walled Frames -II
0
0.25
0.5
0.75
1
1.25
1.5
0 0.1 0.2 0.3 0.4 0.5 0.6
P/P
c1
Angle of Twist (rad)
N2-M40-I1
N4-M40-I1
N2-M240-I1
N2-M40-I2
Fig. 2 Load rotation curve for short elastic cantilever
Izzuddin & Lloyd Smith: Large Displacement Analysis of Elasto-Plastic Thin-Walled Frames -II
0
0.25
0.5
0.75
1
1.25
0 0.1 0.2 0.3 0.4 0.5
P/P
c2
Transverse Displacement (m)
N2-M40-I1
N4-M40-I1
N4-M240-I1
N4-M40-I2
Fig. 3 Load deflection curve for long elastic cantilever

Izzuddin & Lloyd Smith: Large Displacement Analysis of Elasto-Plastic Thin-Walled Frames -II
Fig. 4 Elasto-plastic plate subject to axial force and torque

Izzuddin & Lloyd Smith: Large Displacement Analysis of Elasto-Plastic Thin-Walled Frames -II
0
0.2
0.4
0.6
0.8
1
0 0.2 0.4 0.6 0.8 1 1.2
T/T
0
P/P0
Kinematic with Wagner
Isotropic with Wagner
Kinematic without Wagner
Fig. 5 Elasto-plastic plate, Case (A): Effect of material model

Izzuddin & Lloyd Smith: Large Displacement Analysis of Elasto-Plastic Thin-Walled Frames -II
0
0.2
0.4
0.6
0.8
1
0 0.2 0.4 0.6 0.8 1 1.2
T/T
0
P/P0
Steps = 10
Steps = 50
Fig. 6 Elasto-plastic plate, Case (A): Effect of number of incremental steps

Izzuddin & Lloyd Smith: Large Displacement Analysis of Elasto-Plastic Thin-Walled Frames -II
0
0.2
0.4
0.6
0.8
1
0 0.2 0.4 0.6 0.8 1 1.2
T/T
0
P/P0
1x10 areas
2x10 areas
3x10 areas
5x50 areas
Fig. 7 Elasto-plastic plate, Case (A): Effect of number of monitoring areas
Izzuddin & Lloyd Smith: Large Displacement Analysis of Elasto-Plastic Thin-Walled Frames -II
0
0.2
0.4
0.6
0.8
1
0 0.2 0.4 0.6 0.8 1 1.2
T/T
0
P/P0
Case (A); No hardening
Case (B); Kinematic
Case (B); Isotropic
Fig. 8 Elasto-plastic plate, Case (B): Effect of material model
Izzuddin & Lloyd Smith: Large Displacement Analysis of Elasto-Plastic Thin-Walled Frames -II
0
0.2
0.4
0.6
0.8
1
0 0.2 0.4 0.6 0.8 1 1.2
T/T
0
P/P0
1x10 areas
3x10 areas
Fig. 9 Elasto-plastic plate, Case (B): Effect of number of monitoring areas

Izzuddin & Lloyd Smith: Large Displacement Analysis of Elasto-Plastic Thin-Walled Frames -II
0
0.2
0.4
0.6
0.8
1
0 0.2 0.4 0.6 0.8 1 1.2 1.4
T/T
0
P/P0
Case (A); No hardening
Case (C); Kinematic
Case (C); Isotropic
Fig. 10 Elasto-plastic plate, Case (C): Effect of material model

Izzuddin & Lloyd Smith: Large Displacement Analysis of Elasto-Plastic Thin-Walled Frames -II
0
0.2
0.4
0.6
0.8
1
0 0.2 0.4 0.6 0.8 1 1.2 1.4
T/T
0
P/P0
Kinematic; Steps = 10
Isotropic; Steps = 10
Kinematic; Steps = 50
Isotropic; Steps = 50
Fig. 11 Elasto-plastic plate, Case (C): Effect of number of incremental steps

Izzuddin & Lloyd Smith: Large Displacement Analysis of Elasto-Plastic Thin-Walled Frames -II
Fig. 12 I-Beam under non-uniform torsion

Izzuddin & Lloyd Smith: Large Displacement Analysis of Elasto-Plastic Thin-Walled Frames -II
0
25
50
75
100
125
150
0 5 10 15 20
Tor
que
(kip
.in)
Midspan Angle of Twist (Deg)
Farwell & Galambos (Test)
Chen & Trahair
Cubic formulation (H’=0)
Cubic formulation (H’=0.02E)
Fig. 13 Torque rotation curve of I-beam under non-uniform torsion
Izzuddin & Lloyd Smith: Large Displacement Analysis of Elasto-Plastic Thin-Walled Frames -II
Fig. 14 Cantilever subject to lateral torsional buckling

Izzuddin & Lloyd Smith: Large Displacement Analysis of Elasto-Plastic Thin-Walled Frames -II
0
0.25
0.5
0.75
1
1.25
1.5
0 0.5 1 1.5 2
P/P
cr
Lateral Displacement (m)
Elastic
Elasto-plastic (Uniaxial)
Elasto-plastic (Biaxial)
Fig. 15 Load deflection curves for cantilever with small imperfections
Izzuddin & Lloyd Smith: Large Displacement Analysis of Elasto-Plastic Thin-Walled Frames -II
0
0.25
0.5
0.75
1
1.25
1.5
0 0.5 1 1.5 2
P/P
cr
Lateral Displacement (m)
Hasegawa et al. (elastic)
Hasegawa et al. (uniaxial)
Haswgawa et al. (biaxial)
Present model (elastic)
Present model (uniaxial)
Present model (biaxial)
Fig. 16 Load deflection curves for cantilever with large imperfections
Izzuddin & Lloyd Smith: Large Displacement Analysis of Elasto-Plastic Thin-Walled Frames -II
Fig. 17 I-beam subject to lateral torsional buckling: Geometry and residual stresses

Izzuddin & Lloyd Smith: Large Displacement Analysis of Elasto-Plastic Thin-Walled Frames -II
0
0.25
0.5
0.75
1
1.25
1.5
0 0.05 0.1 0.15 0.2 0.25 0.3
M/M
cr
Midspan Lateral Displacement (m)
4 elements; 1x50 areas
6 elements; 1x50 areas
10 elements; 1x50 areas
10 elements; 3x100 areas
Fig. 18 Load deflection curve for elastic I-beam

Izzuddin & Lloyd Smith: Large Displacement Analysis of Elasto-Plastic Thin-Walled Frames -II
0
0.1
0.2
0.3
0.4
0.5
0.6
0.7
0.8
0.9
1
0 0.05 0.1 0.15 0.2 0.25
M/M
cr
Midspan Lateral Displacement (m)
4 elements; 1x50 areas
10 elements; 1x50 areas
10 elements; 3x100 areas
Fig. 19 Load deflection curve for elasto-plastic I-beam

Izzuddin & Lloyd Smith: Large Displacement Analysis of Elasto-Plastic Thin-Walled Frames -II
0
0.1
0.2
0.3
0.4
0.5
0.6
0.7
0.8
0.9
1
0 0.05 0.1 0.15 0.2 0.25
M/M
cr
Midspan Lateral Displacement (m)
No residual strains; Wagner
No residual strains; No Wagner
Residual strains; Wagner
Residual strains; No Wagner
Fig. 20 Influence of residual stresses and Wagner effect on I-beam response

Izzuddin & Lloyd Smith: Large Displacement Analysis of Elasto-Plastic Thin-Walled Frames -II
-0.3
-0.2
-0.1
0
0.1
0.2
0.3
0.4
0.5
0.6
0.7
0.8
0.9
1
-1 -0.5 0 0.5 1 1.5
M/M
cr
Angle of Twist (rad)
Kinematic
Isotropic
Perfectly plastic
Fig. 21.a Elasto-plastic response of I-beam with load reversal: Midspan twist

Izzuddin & Lloyd Smith: Large Displacement Analysis of Elasto-Plastic Thin-Walled Frames -II
-0.3
-0.2
-0.1
0
0.1
0.2
0.3
0.4
0.5
0.6
0.7
0.8
0.9
1
0 0.2 0.4 0.6 0.8 1 1.2 1.4 1.6
M/M
cr
Lateral Displacement (m)
Kinematic
Isotropic
Perfectly plastic
Fig. 21.b Elasto-plastic response of I-beam with load reversal: Midspan displacement

Izzuddin & Lloyd Smith: Large Displacement Analysis of Elasto-Plastic Thin-Walled Frames -II
Fig. 22.a Deflected shape of I-beam: Loading to maximum positive midspan twist

Izzuddin & Lloyd Smith: Large Displacement Analysis of Elasto-Plastic Thin-Walled Frames -II
Fig. 22.b Deflected shape of I-beam: Reloading to zero midspan twist

Izzuddin & Lloyd Smith: Large Displacement Analysis of Elasto-Plastic Thin-Walled Frames -II
Fig. 22.c Deflected shape of I-beam: Reloading to maximum negative midspan twist
Izzuddin & Lloyd Smith: Large Displacement Analysis of Elasto-Plastic Thin-Walled Frames -II
Fig. 23 I-beam with lateral restraints

Izzuddin & Lloyd Smith: Large Displacement Analysis of Elasto-Plastic Thin-Walled Frames -II
0
0.25
0.5
0.75
1
1.25
0 0.2 0.4 0.6 0.8 1
P/P
d
Angle of Twist (rad)
F-I1
R-I1
B-I1
F-I2
R-I2
B-I2
Fig. 24.a Response of I-beam with lateral restraints: Midspan angle of twist

Izzuddin & Lloyd Smith: Large Displacement Analysis of Elasto-Plastic Thin-Walled Frames -II
0
0.25
0.5
0.75
1
1.25
-0.05 0 0.05 0.1 0.15 0.2 0.25 0.3
P/P
d
Lateral Displacement (m)
F-I1
R-I1
B-I1
F-I2
R-I2
B-I2
Fig. 24.b Response of I-beam with lateral restraints: Midspan lateral displacement

Izzuddin & Lloyd Smith: Large Displacement Analysis of Elasto-Plastic Thin-Walled Frames -II
Fig. 25 Deflected shape of I-beam with lateral restraints: Model (F)

Izzuddin & Lloyd Smith: Large Displacement Analysis of Elasto-Plastic Thin-Walled Frames -II
Fig. 26 Deflected shape of isolated I-beam: Model (B)

Izzuddin & Lloyd Smith: Large Displacement Analysis of Elasto-Plastic Thin-Walled Frames -II
Fig. 27 Geometric and loading configuration of triangular frame

Izzuddin & Lloyd Smith: Large Displacement Analysis of Elasto-Plastic Thin-Walled Frames -II
0
0.2
0.4
0.6
0.8
1
1.2
1.4
1.6
1.8
2
0 0.1 0.2 0.3 0.4 0.5
P/P
p
Vertical Displacement (m)
E-U
P-U
E-B
P-B
P-BE
Fig. 28.a Response of triangular frame: Midspan vertical displacement of front beam

Izzuddin & Lloyd Smith: Large Displacement Analysis of Elasto-Plastic Thin-Walled Frames -II
0
0.2
0.4
0.6
0.8
1
1.2
1.4
1.6
1.8
2
0 0.01 0.02 0.03 0.04 0.05 0.06 0.07 0.08 0.09 0.1
P/P
p
Vertical Displacement (m)
E-U
P-U
E-B
P-B
P-BE
Fig. 28.b Response of triangular frame: Midspan vertical displacement of rear beams
Izzuddin & Lloyd Smith: Large Displacement Analysis of Elasto-Plastic Thin-Walled Frames -II
Fig. 29.a Deflected shape of unbraced traingular frame: Plan view

Izzuddin & Lloyd Smith: Large Displacement Analysis of Elasto-Plastic Thin-Walled Frames -II
Fig. 29.b Deflected shape of unbraced traingular frame: Isometric view

Izzuddin & Lloyd Smith: Large Displacement Analysis of Elasto-Plastic Thin-Walled Frames -II
Fig. 30.a Deflected shape of braced traingular frame: Plan view

Izzuddin & Lloyd Smith: Large Displacement Analysis of Elasto-Plastic Thin-Walled Frames -II
Fig. 30.b Deflected shape of braced traingular frame: Isometric view