Large Cap Core Model Portfolio - UBS · Large Cap Core model portfolio Starting with this report,...
18
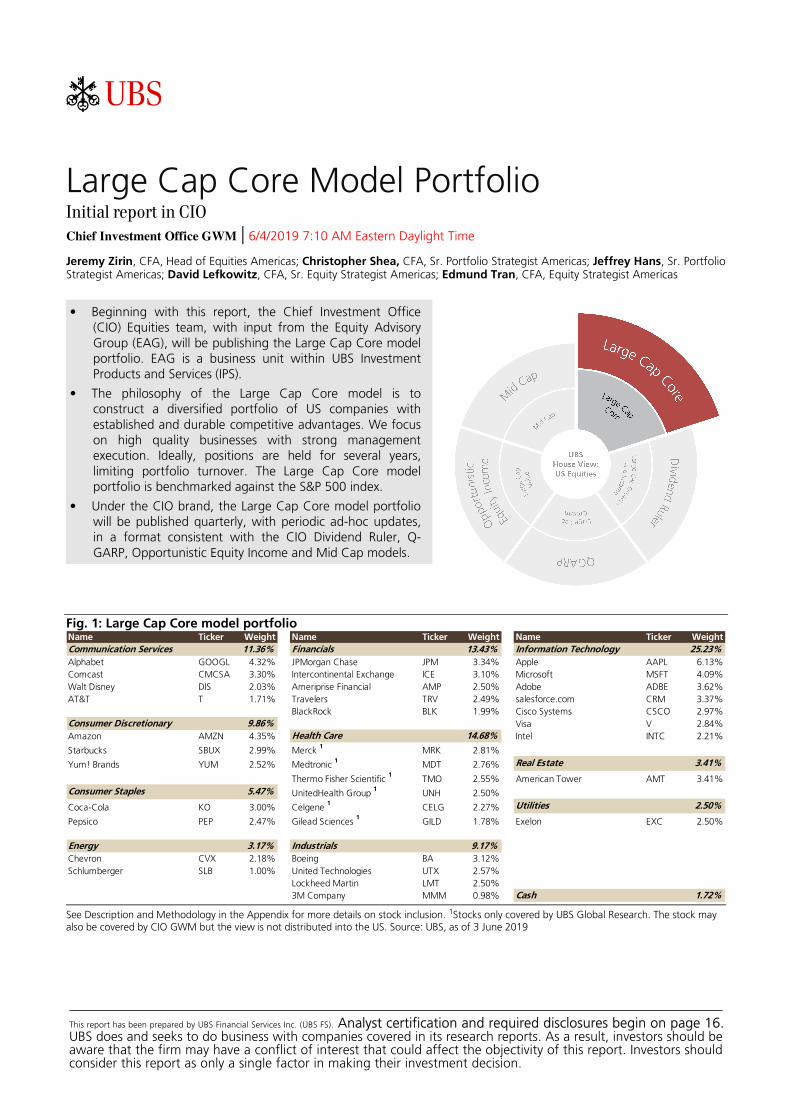
ab Large Cap Core Model Portfolio Initial report in CIO Chief Investment Office GWM | 6/4/2019 7:10 AM Eastern Daylight Time Jeremy Zirin, CFA, Head of Equities Americas; Christopher Shea, CFA, Sr. Portfolio Strategist Americas; Jeffrey Hans, Sr. Portfolio Strategist Americas; David Lefkowitz, CFA, Sr. Equity Strategist Americas; Edmund Tran, CFA, Equity Strategist Americas • Beginning with this report, the Chief Investment Office (CIO) Equities team, with input from the Equity Advisory Group (EAG), will be publishing the Large Cap Core model portfolio. EAG is a business unit within UBS Investment Products and Services (IPS). • The philosophy of the Large Cap Core model is to construct a diversified portfolio of US companies with established and durable competitive advantages. We focus on high quality businesses with strong management execution. Ideally, positions are held for several years, limiting portfolio turnover. The Large Cap Core model portfolio is benchmarked against the S&P 500 index. • Under the CIO brand, the Large Cap Core model portfolio will be published quarterly, with periodic ad-hoc updates, in a format consistent with the CIO Dividend Ruler, Q- GARP, Opportunistic Equity Income and Mid Cap models. Fig. 1: Large Cap Core model portfolio Name Ticker Weight Name Ticker Weight Name Ticker Weight Communication Services 11.36% Financials 13.43% Information Technology 25.23% Alphabet GOOGL 4.32% JPMorgan Chase JPM 3.34% Apple AAPL 6.13% Comcast CMCSA 3.30% Intercontinental Exchange ICE 3.10% Microsoft MSFT 4.09% Walt Disney DIS 2.03% Ameriprise Financial AMP 2.50% Adobe ADBE 3.62% AT&T T 1.71% Travelers TRV 2.49% salesforce.com CRM 3.37% BlackRock BLK 1.99% Cisco Systems CSCO 2.97% Consumer Discretionary 9.86% Visa V 2.84% Amazon AMZN 4.35% Health Care 14.68% Intel INTC 2.21% Starbucks SBUX 2.99% Merck 1 MRK 2.81% Yum! Brands YUM 2.52% Medtronic 1 MDT 2.76% Real Estate 3.41% Thermo Fisher Scientific 1 TMO 2.55% American Tower AMT 3.41% Consumer Staples 5.47% UnitedHealth Group 1 UNH 2.50% Coca-Cola KO 3.00% Celgene 1 CELG 2.27% Utilities 2.50% Pepsico PEP 2.47% Gilead Sciences 1 GILD 1.78% Exelon EXC 2.50% Energy 3.17% Industrials 9.17% Chevron CVX 2.18% Boeing BA 3.12% Schlumberger SLB 1.00% United Technologies UTX 2.57% Lockheed Martin LMT 2.50% 3M Company MMM 0.98% Cash 1.72% See Description and Methodology in the Appendix for more details on stock inclusion. 1 Stocks only covered by UBS Global Research. The stock may also be covered by CIO GWM but the view is not distributed into the US. Source: UBS, as of 3 June 2019 This report has been prepared by UBS Financial Services Inc. (UBS FS). Analyst certification and required disclosures begin on page 16. UBS does and seeks to do business with companies covered in its research reports. As a result, investors should be aware that the firm may have a conflict of interest that could affect the objectivity of this report. Investors should consider this report as only a single factor in making their investment decision.
Transcript of Large Cap Core Model Portfolio - UBS · Large Cap Core model portfolio Starting with this report,...
ab
Large Cap Core Model Portfolio Initial report in CIO
Chief Investment Office GWM | 6/4/2019 7:10 AM Eastern Daylight Time
Jeremy Zirin, CFA, Head of Equities Americas; Christopher Shea, CFA, Sr. Portfolio Strategist Americas; Jeffrey Hans, Sr. Portfolio Strategist Americas; David Lefkowitz, CFA, Sr. Equity Strategist Americas; Edmund Tran, CFA, Equity Strategist Americas
• Beginning with this report, the Chief Investment Office (CIO) Equities team, with input from the Equity Advisory Group (EAG), will be publishing the Large Cap Core model portfolio. EAG is a business unit within UBS Investment Products and Services (IPS).
• The philosophy of the Large Cap Core model is to construct a diversified portfolio of US companies with established and durable competitive advantages. We focus on high quality businesses with strong management execution. Ideally, positions are held for several years, limiting portfolio turnover. The Large Cap Core model portfolio is benchmarked against the S&P 500 index.
• Under the CIO brand, the Large Cap Core model portfolio will be published quarterly, with periodic ad-hoc updates, in a format consistent with the CIO Dividend Ruler, Q-GARP, Opportunistic Equity Income and Mid Cap models.
Fig. 1: Large Cap Core model portfolio Name Ticker Weight Name Ticker Weight Name Ticker Weight
Communication Services 11.36% Financials 13.43% Information Technology 25.23%
Alphabet GOOGL 4.32% JPMorgan Chase JPM 3.34% Apple AAPL 6.13%
Comcast CMCSA 3.30% Intercontinental Exchange ICE 3.10% Microsoft MSFT 4.09%
Walt Disney DIS 2.03% Ameriprise Financial AMP 2.50% Adobe ADBE 3.62%
AT&T T 1.71% Travelers TRV 2.49% salesforce.com CRM 3.37%
BlackRock BLK 1.99% Cisco Systems CSCO 2.97%
Consumer Discretionary 9.86% Visa V 2.84%
Amazon AMZN 4.35% Health Care 14.68% Intel INTC 2.21%
Starbucks SBUX 2.99% Merck 1
MRK 2.81%
Yum! Brands YUM 2.52% Medtronic 1
MDT 2.76% Real Estate 3.41%
Thermo Fisher Scientific 1
TMO 2.55% American Tower AMT 3.41%
Consumer Staples 5.47% UnitedHealth Group 1
UNH 2.50%
Coca-Cola KO 3.00% Celgene 1
CELG 2.27% Utilities 2.50%
Pepsico PEP 2.47% Gilead Sciences 1
GILD 1.78% Exelon EXC 2.50%
Energy 3.17% Industrials 9.17%
Chevron CVX 2.18% Boeing BA 3.12%
Schlumberger SLB 1.00% United Technologies UTX 2.57%
Lockheed Martin LMT 2.50%
3M Company MMM 0.98% Cash 1.72%
See Description and Methodology in the Appendix for more details on stock inclusion. 1Stocks only covered by UBS Global Research. The stock may also be covered by CIO GWM but the view is not distributed into the US. Source: UBS, as of 3 June 2019
This report has been prepared by UBS Financial Services Inc. (UBS FS). Analyst certification and required disclosures begin on page 16.UBS does and seeks to do business with companies covered in its research reports. As a result, investors should beaware that the firm may have a conflict of interest that could affect the objectivity of this report. Investors shouldconsider this report as only a single factor in making their investment decision.

Large Cap Core model portfolio Starting with this report, CIO will begin publishing the Large Cap Core (LCC) model portfolio. This realignment under the CIO brand integrates the strategy into a broader suite of equity model portfolios within the size and style equity allocations recommended in the CIO House View. UBS Investment Management originated the Large Cap Core model portfolio in 2005, and had managed the strategy with a bias towards large, domestic companies deemed to possess competitive advantages and led by management teams with successful track records. Going forward, CIO assumes responsibility for the management and publication of the model portfolio, and evaluates a variety of factors when considering changes. In order to reflect the breadth of intellectual capital at UBS, CIO will include input from the UBS Equity Advisory Group, headed by Rob Romano, in the investment process. Key tenets of the US LCC investment philosophy The philosophy behind the Large Cap Core model portfolio is to identify large, domestic companies that we see as having established and durable competitive advantages that can be used to defend against competition and drive high returns on capital over time. Financial health, attractive valuation and quality of management are also key considerations. Success in identifying these structural competitive advantages should result in low portfolio turnover and allow investor capital to continue compounding in portfolio companies, while minimizing the potential performance dilution that can result from taxes and excessive trading. For example, average annual turnover for the LCC model portfolio has been just 10% over the past seven years (Fig. 4). Sources of competitive advantages We expect companies that possess durable competitive advantages to earn high returns on capital and create value for shareholders. Competitive advantages come in many forms. Some that we look for include:
• High switching costs, which are the economic impediments – measured in cost, time, or risk to a business – that customers face when they consider switching suppliers. American Tower is a prime example, as the costs for a wireless service provider to remove network antennae and fiber optic cables from American's towers and reinstall them onto competitors' towers often outweigh the potential benefits. Similarly, non-transferrable content and synchronized user continuity across multiple devices can discourage users of Apple's iOS and Alphabet's Android ecosystems from leaving. Both examples result in customer lock-In and lower churn.
• Network effects occur when additional users of a product
Fig. 2: Total return as of 3 June 2019
CIO Large
Cap CoreS&P 500
2005* 2.4% 1.4%
2006 14.7% 15.8%
2007 13.0% 5.5%
2008 -36.9% -37.0%
2009 35.0% 26.5%
2010 10.5% 15.1%
2011 -0.8% 2.1%
2012 13.5% 16.0%
2013 32.2% 32.4%
2014 12.6% 13.7%
2015 -0.4% 1.4%
2016 11.0% 12.0%
2017 18.8% 21.8%
2018 0.5% -4.4%
2019** 11.9% 10.4%
Since inception
(cumulative)209.5% 195.7%
* Total return for 2005 is from inception on 14 November 2005 through year-end.
** Beginning on 5 June 2019, performance is based on
the published weights in the CIO Large Cap Core reports.
Please see Description & Methodology for further details.
Source: UBS, as of 3 June 2019
Fig. 3: Total return as of 31 May 2019
CIO Large
Cap Core S&P 500
YTD 12.5% 10.7%
1-year 8.4% 3.8%
3-year CAGR 12.9% 11.7%
5-year CAGR 10.0% 9.7%
7-year CAGR 13.1% 13.5%
10-year CAGR 12.8% 13.9%
Since inception 8.7% 8.4%
Note: CAGR = compound annual growth rate.
Source: Bloomberg, FactSet, UBS, as of 3 June 2019
Large Cap Core Model Portfolio
2

or service increase its value to others. Visa's payment processing networks benefit as more merchants accept its cards, because wider merchant acceptance drives increased spending on Visa cards. Greater spending on Visa cards in turn drives even wider merchant acceptance rates. This positive feedback loop can be a powerful growth driver.
• Valuable intangible assets are the brands, patents, copyrights, trade secrets, and industry regulation that can keep competition at bay. Coca-Cola, PepsiCo, Starbucks and Disney all invest heavily in their brands, and consumers are willing to pay a premium for their products despite cheaper alternatives in the marketplace. Celgene's biopharmaceuticals and Medtronic's medical devices are protected by patents and require marketing approvals from government health agencies before going to market; both restrict competition and support higher prices.
• Economies of scale are the cost advantages companies create when the sheer volume of output drives down the cost of producing each individual product. Intel incurs significant costs to build and run semiconductor fabrication plants; these costs are more easily absorbed when its chips are mass produced. Similarly, Amazon's distribution capabilities are virtually unmatched in retail, and its ability to move merchandise cheaply and quickly is difficult and costly for competitors to match.
How is the model portfolio constructed? Candidates should have at least one identifiable competitive advantage to merit inclusion in the model portfolio. Fundamental research will be the primary input in identifying candidates, leveraging the expertise of the CIO equity sector strategy team. A proprietary CIO quantitative scoring tool will also be used to both help identify potential candidates and monitor existing positions in the portfolio. Individual position sizing will reflect the conviction of CIO sector and portfolio strategists, as well as the potential risk, return and other benefits a holding may contribute to the overall portfolio. Portfolio Parameters
• Number of stocks: 20-50 • Target minimum position size 1%; maximum 10% (or
5% above benchmark weight, whichever is higher)
• Minimum market capitalization of at least USD 2.5bn
• Minimum number of S&P sectors included in portfolio (for diversification): 6
• Maximum sector tilts: +/- 15% above sector weight in benchmark
• Maximum allocation to American Depository Receipts (ADRs) of 15%
• Cash allocation between 1-10%, with a 2% target Published portfolio weights are dynamic and will reflect the "drift" that results from the compounding of individual stock returns and the reinvestment of dividends.
Fig. 4: Select characteristics relative to the S&P
500 as of 31 May 2019
CIO Large Cap Core (LCC)5-years 7-years 10-years
Since
Inception
Standard Deviation 11.5% 11.1% 12.2% 13.4%
Sharpe Ratio 0.79 1.12 1.01 0.56
Average Annual Turnover* 9.6% 10.3% 16.8% 19.2%
vs. S&P 500
Standard Deviation 11.6% 11.2% 12.6% 14.2%
Sharpe Ratio 0.76 1.15 1.07 0.50
LCC Beta 0.98 0.98 0.96 0.92
LCC Upside Capture 0.99 0.98 0.96 0.97
LCC Downside Capture 0.96 1.00 0.99 0.93
* Turnover is calculated as of the most recent completed
calendar year-end.
Source: Bloomberg, FactSet, UBS, as of 3 June 2019
Large Cap Core Model Portfolio
3

Model portfolio changes • In this report, we are initiating new positions in
Ameriprise (AMP), Exelon (EXC), Lockheed Martin (LMT), and UnitedHealth Group (UNH), and adding to existing positions in Alphabet (GOOGL) and Intercontinental Exchange (ICE).
• We are removing Allergan (AGN), McKesson (MCK) and General Motors (GM), as well as the iShares MSCI Momentum (MTUM) and Van Eck Vector Morningstar Wide Moat (MOAT) ETFs.
• Fig. 1 lists the portfolio weights for the updated model portfolio and Fig. 5 shows the specific portfolio weight changes being made in this report.
• Our performance calculations will reflect these changes as of closing prices on Wednesday, 5 June 2019.
Adding Ameriprise Financial Ameriprise offers financial products and services aimed at the mass affluent and affluent market segments. Half of the company's operating profit is generated by its Advice & Wealth Management unit, with the remainder split between its Asset Management, Annuities and Protection segments. We find Ameriprise attractive for the sticky bonds it forms with customers of its Advice & Wealth and Asset Management units. Relationships with financial advisors, detailed financial planning and proprietary investment and insurance products can be strong deterrents for customers to switch firms. CIO's Brad Ball has written favorably of Ameriprise's strategic reorientation to generate a greater portion of earnings from the less capital-intensive asset and wealth management businesses. These actions should improve profitability and release excess capital that can be returned to shareholders through dividends and share repurchases. At less than 9x forward earnings estimates, we believe Ameriprise shares are attractively valued. Adding UnitedHealth Group UnitedHealth Group is the largest managed care organization in the US. Its primary business segment is UnitedHealthcare, which generates approximately two-thirds of company revenues by providing health benefits to millions of consumers enrolled in its Federal, state, private and individual insurance plans. The remainder is generated by its Optum health services segment, which includes the company's OptumRx pharmacy benefit manager, OptumHealth ambulatory care network, and OptumInsight healthcare data analytics arm. UnitedHealth occupies what is likely the most competitively-advantaged position within the healthcare services industry. The company has built a market-leading membership base, which it leverages to negotiate lower reimbursement terms paid to third-party hospitals, physicians and pharmacies. United has also consolidated large segments of the healthcare services
Fig. 5: CIO Large Cap Core changes in this
report
Addition Ameriprise Financial AMP 0.00% 2.50%
Addition Exelon EXC 0.00% 2.50%
Addition Lockheed Martin LMT 0.00% 2.50%
Addition UnitedHealth Group UNH 0.00% 2.50%
Deletion Allergan AGN 1.23% 0.00%
Deletion General Motors GM 2.11% 0.00%
Deletion McKesson MCK 1.68% 0.00%
Deletion iShares MSCI USA Momentum ETF MTUM 1.90% 0.00%
Deletion VanEck Mstar Wide Moat ETF MOAT 3.78% 0.00%
Increase Alphabet GOOGL 2.32% 4.32%
Increase Intercontinental Exchange ICE 2.10% 3.10%
Decrease Cash - 4.01% 1.72%
Security TickerPrior
Weight
New
Weight
Source: UBS, as of 3 June 2019
Large Cap Core Model Portfolio
4

value chain (OptumRx pharmacy benefits, OptumHealth patient clinics) that provide its members with cheaper in-network options while giving the company greater control over its medical costs. UnitedHealth's steady revenue growth has been driven by two favorable tailwinds: healthy US employment gains adding to United's membership, and Baby Boomers aging onto the Medicare health insurance program. Profit margins have benefitted from management's containment of medical costs. These combined trends have driven consistent free cash flow generation for years, which management has returned to shareholders with steady dividend increases and share repurchases. UNH shares have returned -4.7% in 2019 compared to the 10.4% gain in the S&P 500 as healthcare stocks – and particularly managed care organizations – have suffered from healthcare policy uncertainty. Heated political rhetoric ahead of the 2020 US Presidential Election could remain a persistent headwind into next year. However, we believe that any changes to the US healthcare system are more likely to be incremental, and that UnitedHealth will continue to play a leading role given its scope, scale and cost advantages. Adding Exelon Exelon is an integrated power utility generating the majority of its operating profits from its six regulated utilities that deliver electricity and natural gas to ten million customers in the Mid-Atlantic and Midwest regions. The remainder is produced by its unregulated power generation unit. CIO sector strategist Jay Dobson expects shares to benefit from management's efforts to refocus the company on lower-risk opportunities by harvesting cash flows from its wholesale nuclear fleet and reinvesting into regulated utility operations. This strategy should lead to a more predictable growth profile going forward. Additionally, management has adeptly convinced regulators in Illinois, New York and New Jersey to support its nuclear assets in these states, winning zero emission credits that extended the economic lives of these plants. While Exelon's leverage is somewhat elevated, a byproduct of the debt-financed acquisition of Pepco Holdings in 2016, management should be able to pay down debt while growing the dividend at a 5% rate through 2020. Adding Lockheed Martin Lockheed Martin is a leading global defense and aerospace contractor deriving the majority of its revenues and operating profit from the US government. Aeronautics is the largest business segment by revenue and operating profit, responsible for the development and production of F-35, F-22 and F-16 fighters. Rotary & Mission Systems, which acquired Sikorsky helicopters from United Technologies, designs and manufactures mission and combat systems for ships,
Large Cap Core Model Portfolio
5

submarines and aircraft. Space (satellites, space transportation services) and Missile and Fire Control (air and missile defense systems) comprise the remainder of the business. Lockheed stands out for its potent and diversified mix of military programs that ensure it will remain a key supplier to the US Department of Defense for years to come. The institutional know-how it has amassed from decades of classified military design and contracting work, the ramping cost efficiencies of the F-35 Joint Strike Fighter program, and the large installed base of planes and helicopters that generate aftermarket service contracts make Lockheed a formidable company to displace. Lockheed's revenue and profit growth in recent years reflect increased US defense spending and ramping production of the F-35 stealth fighter. We expect profits to grow at low double-digit rate, driven by the F-35 and a greater contribution from high margin service contracts. Lockheed has generated positive annual free cash flow for over two decades, which management has used to fund steadily growing dividends and large share repurchases. Lockheed currently trades at 15.4x forward consensus earnings, a 1-standard deviation discount to the 18.3x average forward P/E over the prior five years. Increasing Alphabet and Intercontinental Exchange Alphabet remains the dominant player in online and mobile search and advertising, and continues to report attractive double-digit revenue and earnings growth despite its considerable size. The competitive advantages derived from its massive user base and data-driven search results appear intact, while the risk/reward is more attractive following a -19.8% selloff in its shares. Alphabet was recently featured in the "Pricing Power Standouts" report authored CIO Thematic Research Americas' head Laura Kane, which highlighted companies with dominant market shares and stable profit margins. Intercontinental Exchange is a leading operator of physical and electronic securities exchanges. Its pivot to selling market data, marked by the 2015 acquisition of Interactive Data, has provided the company with an additional source of revenue that is proving to be smoother and faster-growing than the volume-driven revenues from its exchanges. CIO sector strategist Brad Ball added Intercontinental Exchange to his Most Preferred list earlier this year, citing the company's potential to capitalize on increasing investor demand for risk-management solutions and its more stable earnings compared to other financial stocks. Removing iShares MSCI Momentum ETF (MTUM), Van Eck Vector Morningstar Wide Moat ETF (MOAT), Allergan (AGN), McKesson (MCK), and General Motors (GM)
Large Cap Core Model Portfolio
6

As part of the transition to CIO, we will no longer include ETFs in the Large Cap Core model portfolio. Additionally, we have exited Allergan, McKesson and General Motors in an effort to reallocate towards higher quality companies. We see UnitedHealth as better positioned than Allergan and McKesson to withstand whatever changes await the healthcare industry. Finally, while encouraged by General Motors' efforts in autonomous vehicles, we retain exposure to this thematic through our Intel and Alphabet positions, whose MobileEye and Waymo units are potential beneficiaries of this emerging trend.
Large Cap Core Model Portfolio
7

Large Cap Core Investment thesis table – part 1 Name Sector Investment Thesis
AlphabetCommunication
Services
Dominant internet search market share drives above-average profitability. Shift of advertising from
traditional to online media supports Google's strong growth outlook. The percent of consumer time
devoted to the Internet is higher than the percent of advertising dollars that have migrated online,
suggesting many more years of solid growth ahead. We view valuation as reasonable for estimated high-
teens EPS growth over the next 3-5 years.
AT&TCommunication
Services
We see multiple growth drivers ahead for AT&T, including reaping benefits from the recently acquired
Time Warner business and building out its 5G capabilities. The company generates strong free cash flow,
which it plans to use to de-lever its balance sheet. Steady dividend growth underpins an attractive
dividend yield.
ComcastCommunication
Services
Market-leading broadband infrastructure drives solid pricing power and high, stable profitability. Well-
positioned to drive growth on the back of continued housing market gains, market share gains in
commercial services, and innovative X1 platform which mitigates risk of video subscriber losses. We view
the forward P/E of 14x as fair given defensive cash flows, solid growth prospects, and shareholder friendly
management.
Walt DisneyCommunication
Services
Consistent growth and high quality is underpinned by a deep bench of world class content. Disney's
acquisition of Fox's Film and TV studio will make its media library even more compelling. In our view,
Disney has perfected the art of leveraging content across multiple entertainment platforms (Studio, Parks,
Consumer Products). Cable network subscribers are beginning to shrink but the company should be able
to monetize its content through its various direct-to-consumer streaming services.
Amazon.comConsumer
Discretionary
With e-commerce representing just 10% of total retail sales in the US, Amazon stands to grow wallet
share as the shift to online buying continues. The company also has one of the leading cloud computing
platforms (AWS), which should continue to grow given the secular migration from traditional on-premise
data systems to cloud computing. The company's shift in focus from hyper growth to a blend of growth
and profitability makes the earnings trajectory, and thus valuations, more attractive.
StarbucksConsumer
Discretionary
Dominant coffee company, generating consistent revenue and profit growth driven by new store
openings, increased same-store sales, and operating efficiencies. Menu innovation, alternative store
formats, Starbucks Rewards and Mobile Order and Pay have resonated with customers and improved per-
store productivity. Strong free cash flow generation funds increased dividends and share repurchases.
Yum! BrandsConsumer
Discretionary
World's largest quick service restaurant system, with over 48,000 KFC, Taco Bell and Pizza Hut locations
worldwide. Consistent growth driven by a combination of low-single digit growth in units and same-store
sales. Management's decision to refranchise the majority of its store base decreased capital intensity,
drove steadier cash flows, and freed up capital for increased dividends and share repurchases.
Coca-ColaConsumer
Staples
A more disciplined pricing strategy, shift towards healthier drinks, and restructured relationships with
bottlers should drive a rebound in EPS growth.
PepsiCoConsumer
Staples
Pepsi has generated consistent sales and profit growth historically, driven by its balanced geographic and
category diversification. It's crown jewel has been the Frito Lay business, which has benefited from
product innovation and strong demand for snack foods globally. New CEO focused on investing back into
the business to drive more innovation and take market share.
Source: UBS, as of 3 June 2019
Large Cap Core Model Portfolio
8
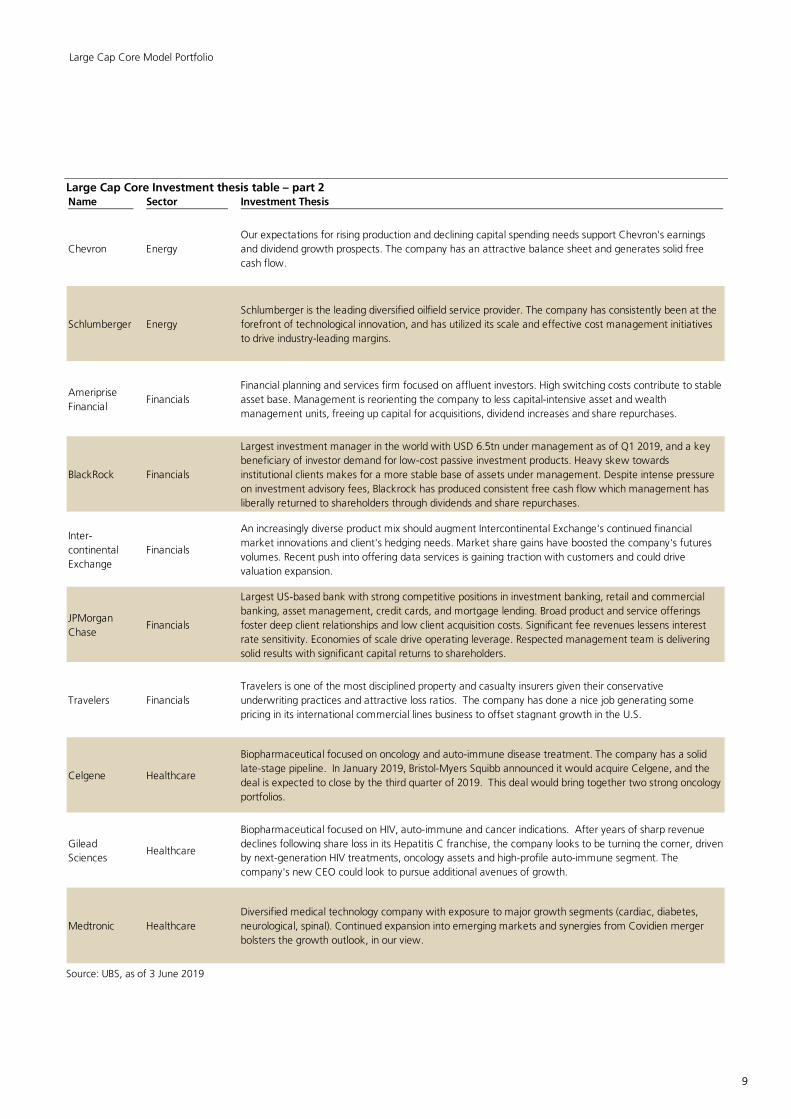
Large Cap Core Investment thesis table – part 2 Name Sector Investment Thesis
Chevron Energy
Our expectations for rising production and declining capital spending needs support Chevron's earnings
and dividend growth prospects. The company has an attractive balance sheet and generates solid free
cash flow.
Schlumberger Energy
Schlumberger is the leading diversified oilfield service provider. The company has consistently been at the
forefront of technological innovation, and has utilized its scale and effective cost management initiatives
to drive industry-leading margins.
Ameriprise
FinancialFinancials
Financial planning and services firm focused on affluent investors. High switching costs contribute to stable
asset base. Management is reorienting the company to less capital-intensive asset and wealth
management units, freeing up capital for acquisitions, dividend increases and share repurchases.
BlackRock Financials
Largest investment manager in the world with USD 6.5tn under management as of Q1 2019, and a key
beneficiary of investor demand for low-cost passive investment products. Heavy skew towards
institutional clients makes for a more stable base of assets under management. Despite intense pressure
on investment advisory fees, Blackrock has produced consistent free cash flow which management has
liberally returned to shareholders through dividends and share repurchases.
Inter-
continental
Exchange
Financials
An increasingly diverse product mix should augment Intercontinental Exchange's continued financial
market innovations and client's hedging needs. Market share gains have boosted the company's futures
volumes. Recent push into offering data services is gaining traction with customers and could drive
valuation expansion.
JPMorgan
ChaseFinancials
Largest US-based bank with strong competitive positions in investment banking, retail and commercial
banking, asset management, credit cards, and mortgage lending. Broad product and service offerings
foster deep client relationships and low client acquisition costs. Significant fee revenues lessens interest
rate sensitivity. Economies of scale drive operating leverage. Respected management team is delivering
solid results with significant capital returns to shareholders.
Travelers Financials
Travelers is one of the most disciplined property and casualty insurers given their conservative
underwriting practices and attractive loss ratios. The company has done a nice job generating some
pricing in its international commercial lines business to offset stagnant growth in the U.S.
Celgene Healthcare
Biopharmaceutical focused on oncology and auto-immune disease treatment. The company has a solid
late-stage pipeline. In January 2019, Bristol-Myers Squibb announced it would acquire Celgene, and the
deal is expected to close by the third quarter of 2019. This deal would bring together two strong oncology
portfolios.
Gilead
SciencesHealthcare
Biopharmaceutical focused on HIV, auto-immune and cancer indications. After years of sharp revenue
declines following share loss in its Hepatitis C franchise, the company looks to be turning the corner, driven
by next-generation HIV treatments, oncology assets and high-profile auto-immune segment. The
company's new CEO could look to pursue additional avenues of growth.
Medtronic Healthcare
Diversified medical technology company with exposure to major growth segments (cardiac, diabetes,
neurological, spinal). Continued expansion into emerging markets and synergies from Covidien merger
bolsters the growth outlook, in our view.
Source: UBS, as of 3 June 2019
Large Cap Core Model Portfolio
9

Large Cap Core Investment thesis table – part 3 Name Sector Investment Thesis
Merck Healthcare
Global leader in oncology, vaccines and animal healthcare products. Its human health division is the key
revenue and profit driver, with rapidly growing cancer and diabetes treatments. Lead drug Keytruda has
proven to be a dominant next-generation treatment for a variety of cancers. The company has steadily
increased its dividend over the years.
Thermo Fisher
ScientificHealthcare
One of the largest and most diversified providers of life sciences tools, Thermo Fisher has the breadth and
depth to generate consistent revenue growth. Superior capital allocation, consistent double-digit earnings
growth, improving return on equity and reasonable valuation suggest a favorable outlook. Strong
management team with a very good track record.
UnitedHealth
GroupHealthcare
UnitedHealth is the largest and most diversified managed care organization, with significant exposure to
the high-growth Medicare and Medicaid insurance markets. Aging US demographics should drive
continued managed care adoption, and in turn, support earnings growth. The company's healthcare
services segment (pharmacy benefits manager, healthcare IT, and consulting services) give the company
further scale.
3M Industrials
Diversified manufacturer of industrial products. Its consistently high levels of spending on research and
development drives innovation and product vitality, which in turn underpins its profitability. Stepped-up
dividend growth driving an attractive yield.
Boeing Industrials
Air travel traffic should continue to grow faster than global economic growth driven by the rising affluent
in emerging markets. An aging global airplane fleet will likely prompt a replacement cycle over the next
several years, enhancing the growth outlook over the next decade. The limited number of commercial
aerospace manufacturers gives us confidence that Boeing will retain its high market share. Despite the
tragic 737 MAX crashes, we don't believe the aircraft is fundamental flawed.
Lockheed
MartinIndustrials
Ramping production of its fighter jets (the F-35), robust demand for missiles and missile defense,
opportunities for Sikorsky helicopters, combined with growth in defense spending in the US and abroad
should generate attractive earnings and dividend growth. Non-US sales are becoming an increasingly
important revenue driver and now account for nearly 30% of revenues.
United
TechnologiesIndustrials
UTX's aerospace units are benefitting from robust end market demand, growth in the emerging market
middle class, and investments in new jet engine technology. The company's Carrier (climate control
systems) and Otis (elevators) units are benefitting from continued urbanization in emerging markets and a
cyclical pickup in developed market construction activity. Management plans to spin out the Otis and
Carrier units in early 2020, which could unlock value for shareholders.
AdobeInformation
Technology
Adobe has a dominant position in software for digital content creation and has expanded into digital
marketing campaign management. These two businesses should continue to enjoy solid growth as
content and advertising dollars continue to migrate to the web. Adobe was also an early adopter of cloud
and subscription-based business models, increasing the lifetime value of a customer and driving more
stable cash flows.
AppleInformation
Technology
While the smartphone category has matured, Apple has one of the most valuable smartphone user bases
in the world with high brand loyalty, driving high returns on capital. Apple is leveraging this consumer trust
into ancillary products (Watch, AirPods) and services (music). Aggressive return of capital and reasonable
valuations (forward P/E less than the S&P 500) enhance the outlook.
Source: UBS, as of 3 June 2019
Large Cap Core Model Portfolio
10
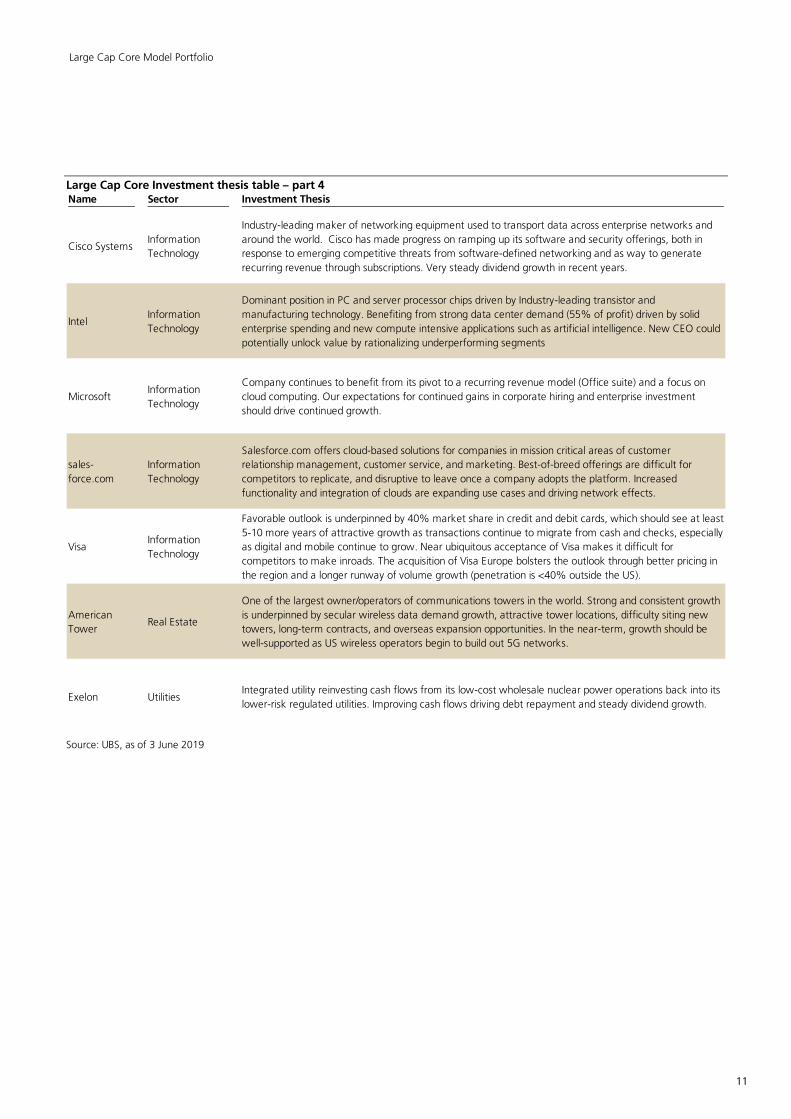
Large Cap Core Investment thesis table – part 4 Name Sector Investment Thesis
Cisco SystemsInformation
Technology
Industry-leading maker of networking equipment used to transport data across enterprise networks and
around the world. Cisco has made progress on ramping up its software and security offerings, both in
response to emerging competitive threats from software-defined networking and as way to generate
recurring revenue through subscriptions. Very steady dividend growth in recent years.
IntelInformation
Technology
Dominant position in PC and server processor chips driven by Industry-leading transistor and
manufacturing technology. Benefiting from strong data center demand (55% of profit) driven by solid
enterprise spending and new compute intensive applications such as artificial intelligence. New CEO could
potentially unlock value by rationalizing underperforming segments
MicrosoftInformation
Technology
Company continues to benefit from its pivot to a recurring revenue model (Office suite) and a focus on
cloud computing. Our expectations for continued gains in corporate hiring and enterprise investment
should drive continued growth.
sales-
force.com
Information
Technology
Salesforce.com offers cloud-based solutions for companies in mission critical areas of customer
relationship management, customer service, and marketing. Best-of-breed offerings are difficult for
competitors to replicate, and disruptive to leave once a company adopts the platform. Increased
functionality and integration of clouds are expanding use cases and driving network effects.
VisaInformation
Technology
Favorable outlook is underpinned by 40% market share in credit and debit cards, which should see at least
5-10 more years of attractive growth as transactions continue to migrate from cash and checks, especially
as digital and mobile continue to grow. Near ubiquitous acceptance of Visa makes it difficult for
competitors to make inroads. The acquisition of Visa Europe bolsters the outlook through better pricing in
the region and a longer runway of volume growth (penetration is <40% outside the US).
American
TowerReal Estate
One of the largest owner/operators of communications towers in the world. Strong and consistent growth
is underpinned by secular wireless data demand growth, attractive tower locations, difficulty siting new
towers, long-term contracts, and overseas expansion opportunities. In the near-term, growth should be
well-supported as US wireless operators begin to build out 5G networks.
Exelon UtilitiesIntegrated utility reinvesting cash flows from its low-cost wholesale nuclear power operations back into its
lower-risk regulated utilities. Improving cash flows driving debt repayment and steady dividend growth.
Source: UBS, as of 3 June 2019
Large Cap Core Model Portfolio
11
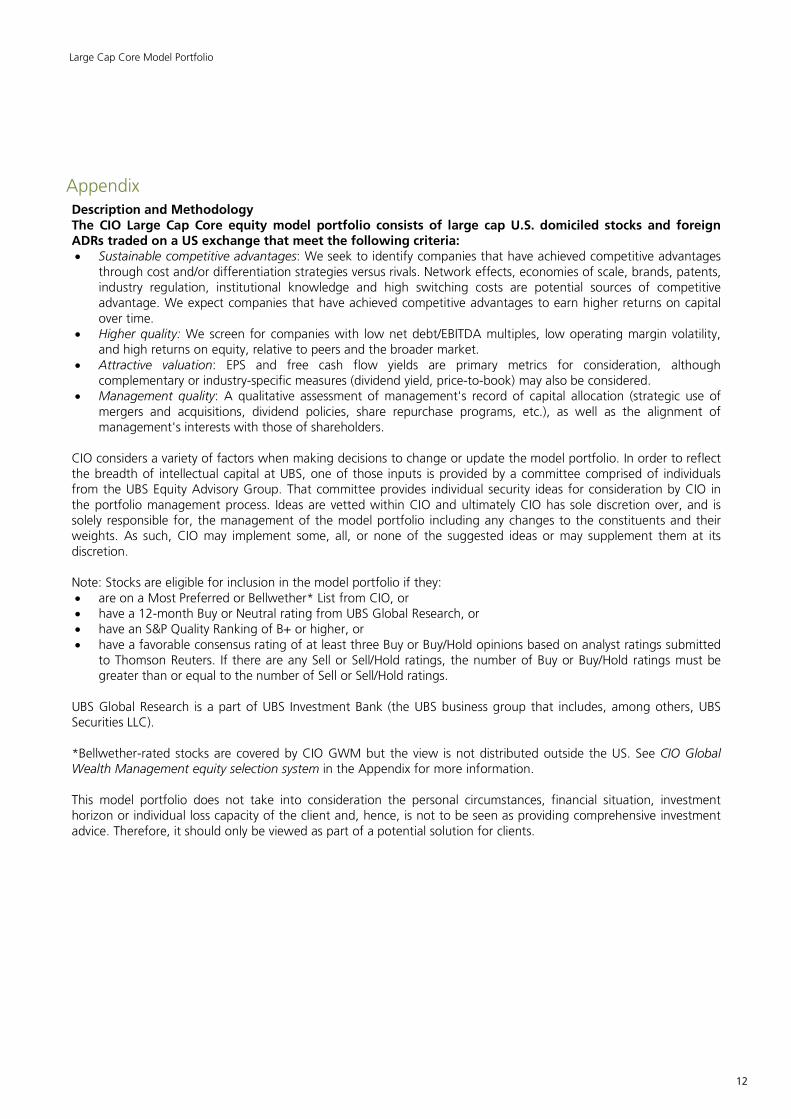
Appendix Description and Methodology The CIO Large Cap Core equity model portfolio consists of large cap U.S. domiciled stocks and foreign ADRs traded on a US exchange that meet the following criteria: • Sustainable competitive advantages: We seek to identify companies that have achieved competitive advantages
through cost and/or differentiation strategies versus rivals. Network effects, economies of scale, brands, patents, industry regulation, institutional knowledge and high switching costs are potential sources of competitive advantage. We expect companies that have achieved competitive advantages to earn higher returns on capital over time.
• Higher quality: We screen for companies with low net debt/EBITDA multiples, low operating margin volatility, and high returns on equity, relative to peers and the broader market.
• Attractive valuation: EPS and free cash flow yields are primary metrics for consideration, although complementary or industry-specific measures (dividend yield, price-to-book) may also be considered.
• Management quality: A qualitative assessment of management's record of capital allocation (strategic use of mergers and acquisitions, dividend policies, share repurchase programs, etc.), as well as the alignment of management's interests with those of shareholders.
CIO considers a variety of factors when making decisions to change or update the model portfolio. In order to reflect the breadth of intellectual capital at UBS, one of those inputs is provided by a committee comprised of individuals from the UBS Equity Advisory Group. That committee provides individual security ideas for consideration by CIO in the portfolio management process. Ideas are vetted within CIO and ultimately CIO has sole discretion over, and is solely responsible for, the management of the model portfolio including any changes to the constituents and their weights. As such, CIO may implement some, all, or none of the suggested ideas or may supplement them at its discretion. Note: Stocks are eligible for inclusion in the model portfolio if they: • are on a Most Preferred or Bellwether* List from CIO, or • have a 12-month Buy or Neutral rating from UBS Global Research, or • have an S&P Quality Ranking of B+ or higher, or • have a favorable consensus rating of at least three Buy or Buy/Hold opinions based on analyst ratings submitted
to Thomson Reuters. If there are any Sell or Sell/Hold ratings, the number of Buy or Buy/Hold ratings must be greater than or equal to the number of Sell or Sell/Hold ratings.
UBS Global Research is a part of UBS Investment Bank (the UBS business group that includes, among others, UBS Securities LLC). *Bellwether-rated stocks are covered by CIO GWM but the view is not distributed outside the US. See CIO Global Wealth Management equity selection system in the Appendix for more information. This model portfolio does not take into consideration the personal circumstances, financial situation, investment horizon or individual loss capacity of the client and, hence, is not to be seen as providing comprehensive investment advice. Therefore, it should only be viewed as part of a potential solution for clients.
Large Cap Core Model Portfolio
12

Performance calculation methodology From the inception of the "Large Cap Core" model portfolio on 14 November 2005 to 3 June 2019, the Large Cap Core model was published by UBS Investment Product and Services (IPS) Investment Management. From 14 November 2005 through 5 June 2019, the performance of the Large Cap Core model was based on an active-weighted portfolio. For performance tracking purposes, the portfolio's performance reflected the portfolio changes and closing prices one trading day prior to the published reports (unless noted otherwise). Beginning 6 June 2019, the performance calculations reflect the closing prices of all portfolio constituents rebalanced to the published weights on the effective date, or two trading dates after changes are announced (unless noted otherwise). The performance published in this report is based on capital appreciation plus dividends and does not include transaction costs such as commissions, investment management fees, margin interest, and interest charges. Actual performance adjusted for such transaction costs will result in reduced total returns. Returns may increase or decrease as a result of currency fluctuations. A complete record of all the recommendations upon which the report is based is available from UBS Financial Services Inc. upon written request. Past performance is not an indication of future results. Treatment of companies on the Firm’s Restricted List Securities included on the Firm’s Restricted List (explained in more detail below) are annotated as such with an asterisk, but have been left on their respective US Equity Model Portfolio for performance tracking purposes only. At the time the security was added to the US Equity Model Portfolio, and until the time it was added to the Restricted List, it met the CIO criteria for inclusion described above. However, while it is on the Restricted List, the Firm and authors of this publication are prohibited from expressing their ongoing view of the security. As a matter of course, this should neither be necessarily construed positively or negatively, or as a recommendation to buy, hold or sell the security. The security remains on the US Equity Model Portfolio until such time that the security is removed from the Restricted List, at which time the analyst will either re-affirm his/her ongoing inclusion on the US Equity Model Portfolio or remove it in accordance with the normal rules for changes to the list outlined above when other stocks are judged to offer more attractive risk/reward tradeoffs. The Firm’s Restricted List The principal reasons that issuers are included on the Firm’s Research Restricted list are that one or more legal entities within the UBS group are involved as an advisor and/or underwriter in a publicly announced corporate transaction. Dependent on relevant security regulations/laws, firm policy, the management of conflicts of interest and to avoid the appearance of impropriety, there may be a requirement for all or a combination of the following: restrictions on the publication of new research, suspensions of research ratings and forecasts, prohibitions on making recommendations to clients, restrictions on placing securities into discretionary accounts and prohibitions on proprietary and/or personal account trading in respect of names on the list.
Large Cap Core Model Portfolio
13

CIO Large Cap Core model portfolio disclosures
Since the original report including 158 stock recommendations, 99 advanced and 59 declined. Past performance is not indicative
of future results.
Name Ticker
Addition
Price **
Price
(3 June 2019)
Total return since
addition ***
3M Company MMM 7/8/2010 USD 81.22 USD 160.04 147.6%
Adobe ADBE 12/12/2016 USD 105.16 USD 259.03 146.3%
Allergan AGN 6/9/2016 USD 247.40 USD 123.13 -48.1%
Alphabet GOOGL 5/15/2014 USD 529.12 USD 1,038.74 96.3%
Amazon AMZN 12/12/2016 USD 760.12 USD 1,692.69 122.7%
American Tower AMT 9/26/2013 USD 74.63 USD 209.29 211.4%
Ameriprise Financial AMP 6/3/2019 NA USD 140.78 NA
Apple AAPL 12/2/2009 USD 28.03 USD 173.30 605.8%
AT&T T 3/15/2007 USD 36.94 USD 31.09 62.8%
BlackRock BLK 11/7/2018 USD 424.73 USD 419.90 0.4%
Boeing BA 9/19/2014 USD 129.35 USD 338.89 196.1%
Celgene CELG 12/17/2010 USD 29.64 USD 94.61 219.3%
Chevron CVX 6/11/2009 USD 71.90 USD 115.99 133.9%
Cisco Systems CSCO 6/13/2012 USD 16.66 USD 51.78 286.2%
Coca-Cola KO 11/14/2005 USD 21.29 USD 49.98 252.8%
Comcast CMCSA 7/8/2010 USD 8.92 USD 40.96 438.9%
Exelon EXC 6/3/2019 NA USD 48.52 NA
General Motors GM 4/5/2017 USD 34.00 USD 33.70 7.4%
Gilead Sciences GILD 2/10/2014 USD 80.98 USD 63.63 -12.8%
Intel INTC 11/25/2011 USD 22.73 USD 43.46 141.1%
Intercontinental Exchange ICE 7/8/2010 USD 21.46 USD 82.52 312.1%
iShares MSCI USA Momentum ETF MTUM 3/1/2018 USD 108.01 USD 111.43 4.8%
JPMorgan Chase JPM 10/8/2008 USD 39.30 USD 106.46 245.1%
Lockheed Martin LMT 6/3/2019 NA USD 344.57 NA
McKesson MCK 4/21/2016 USD 178.03 USD 124.56 -27.9%
Medtronic MDT 4/13/2011 USD 40.09 USD 93.33 177.2%
Merck MRK 7/8/2010 USD 35.86 USD 80.26 204.2%
Microsoft MSFT 2/15/2006 USD 26.88 USD 119.84 500.9%
PepsiCo PEP 11/14/2005 USD 58.60 USD 128.98 220.2%
salesforce.com CRM 4/5/2017 USD 85.34 USD 145.10 70.0%
Schlumberger SLB 3/9/2010 USD 64.10 USD 35.49 -32.8%
Starbucks SBUX 11/14/2017 USD 56.93 USD 76.22 39.1%
Thermo Fisher Scientific TMO 6/19/2008 USD 58.48 USD 265.28 370.7%
Travelers TRV 6/11/2009 USD 43.57 USD 146.79 328.2%
United Technologies UTX 11/14/2005 USD 53.55 USD 126.86 222.8%
UnitedHealth Group UNH 6/3/2019 NA USD 236.56 NA
VanEck Morningstar Wide Moat ETF MOAT 10/23/2013 USD 27.87 USD 44.90 75.1%
Visa V 3/15/2017 USD 89.92 USD 158.60 79.0%
Walt Disney DIS 12/17/2007 USD 32.99 USD 132.47 367.5%
Yum! Brands YUM 4/13/2009 USD 29.99 USD 104.11 489.9%
Addition
Date *
Note:* Addition Date represents the date the report was published in which the stock was added to the model portfolio. ** Addition Price represents the closing price on the day the stock was included in the model portfolio's performance calculations. Return may increase of decrease as a result of currency fluctuations. *** Total return since addition represents the price change and income received (dividends) reinvested back into the shares on the day the income is paid to shareholders. Source: FactSet, UBS, as of 3 June 2019
Large Cap Core Model Portfolio
14

Term / Abbreviation Description / Definition
CAGR Compound annual growth rate
EBITA Earnings before interest, taxes, (depreciation) and amortization
EPS Earnings per share
Net Debt Short- and long-term interest-bearing debt minus cash and cash equivalents
Required disclosures
UBS Investment Research: Global Equity Rating Definitions
For information on the ways in which UBS manages conflicts and maintains independence of its research product; historical performance information; and certain additional disclosures concerning UBS research recommendations, please visit www.ubs.com/disclosures.
Global Equity 12-Month Rating Definitions
Buy: FSR is > 6% above the MRA. Neutral: FSR is between -6% and 6% of the MRA. Sell: FSR is > 6% below the MRA.
Key Definitions
Forecast Stock Return (FSR) is defined as expected percentage price appreciation plus gross dividend yield over the next 12 months.
Market Return Assumption (MRA) is defined as the one-year local market interest rate plus 5% (a proxy for, and not a forecast of, the equity risk premium).
Under Review (UR) Stocks may be flagged as UR by the analyst, indicating that the stock's price target and/or rating are subject to possible change in the near term, usually in response to an event that may affect the investment case or valuation.
Exceptions and Special Cases
Core Banding Exceptions (CBE): Exceptions to the standard +/-6% bands may be granted by the Investment Review
Committee (IRC). Factors considered by the IRC include the stock's volatility and the credit spread of the respective company's debt. As a result, stocks deemed to be very high or low risk may be subject to higher or lower bands as they relate to the rating. When such exceptions apply, they will be identified the Companies Mentioned or Company Disclosure table in the relevant research piece.
CIO Global Wealth Management equity selection system
Bellwether: Stocks that are of high importance or relevance to the sector and which the equity sector strategist expects the stock to perform broadly in line with the sector benchmark in the next 12 months.
For additional equity selection definitions, see UBS CIO Global Wealth Management equity selection system in the Appendix.
Statement of Risk All investments are subject to risk, including the loss of principal.
Large Cap Core Model Portfolio
15

Appendix
Analyst certificationEach research analyst primarily responsible for the content of this research report, in whole or in part, certifies thatwith respect to each security or issuer that the analyst covered in this report: (1) all of the views expressed accuratelyreflect his or her personal views about those securities or issuers; and (2) no part of his or her compensation was, is,or will be, directly or indirectly, related to the specific recommendations or views expressed by that research analystin the research report.
Statement of RiskStatement of RiskEquities - Stock market returns are difficult to forecast because of fluctuations in the economy, investor psychology,geopolitical conditions and other important variables.
Required DisclosuresFor a complete set of required disclosures relating to the companies that are the subject of this report, please mail arequest to UBS CIO Global Wealth Management Business Management, 1285 Avenue of the Americas, 20th Floor,Avenue of the Americas, New York, NY 10019.
UBS CIO WM equity selection system (for US sector Equity Preferences)US equity sector strategists provide two equity selections: Most Preferred (MP) and Least Preferred (LP).Most Preferred*
We expect the stock to outperform the benchmark in the next 12 months.Least Preferred*We expect the stock to underperform the benchmark in the next 12 months.*A stock cannot be selected as Most Preferred if UBS Research rates it a Sell, while a UBS Research Buy rated stockcannot be selected as Least Preferred.Restricted: Issuing of research on a company by CIO GWM can be restricted due to legal, regulatory, contractual orbest business practice obligations which are normally caused by UBS Investment Bank’s involvement in an investmentbanking transaction in regard to the concerned company.Equity selection: An assessment relative to a benchmarkEquity selections in Equity Preferences lists (EPLs) are relative assessments versus a sector/industry, country/regional orthematic benchmark. The chosen benchmark is disclosed on the front page of each EPL.Stocks can be selected for several EPLs. To keep consistency, a stock can only be selected as either Most Preferredor Least Preferred, but not both simultaneously. As benchmarks differ between lists, stocks need not be included onevery list to which they could theoretically be added.The country EPL is a list of Most Preferred recommended stocks that our US Equity Sector Strategy team feels are bestpositioned within their respective sector coverage to outperform their respective sector benchmark over a 12-monthinvestment horizon. These selections should not be viewed as a portfolio as they represent a current snapshot of ourviews. In the event that a recommended stock is no longer Most Preferred, the list will be updated in the next monthlypublication. As such, these recommendations are only valid as of the date of the report and performance for this listwill not be calculated. For updates to the views on these names, please consult the most recent Equity PreferencesList (EPL) for the relevant sector, which may be obtained from your client advisor.
Required DisclosuresFor a complete set of required disclosures relating to the companies that are the subject of this report, please mail arequest to UBS CIO Global Wealth Management Business Management, 1285 Avenue of the Americas, 20th Floor,Avenue of the Americas, New York, NY 10019.Disclosures (3 June 2019)Within the past 12 months UBS AG, its affiliates or subsidiaries may have received or provided investment servicesand activities or ancillary services as per MiFID II which may have given rise to a payment or promise of a payment inrelation to these services from or to each company mentioned in the publication.3M Company 2, 4, 5, Adobe Systems Inc. 2, 3, 4, 5, 6, 7, Allergan 2, Alphabet Inc. Class A 1, 2, 3, 7, 11, Amazon.com1, 2, 3, 4, 5, 10, 11, American Tower Corporation 2, 12, Ameriprise Financial 1, 2, 6, 8, 9, 10, 11, Apple Inc. 1, 2, 3,4, 5, AT&T Inc. 1, 2, 4, 5, 11, 14, 15, 16, 19, Blackrock Inc. 1, 2, 6, 8, 10, 11, 14, 15, 16, Boeing Co. 1, 2, 4, 5, 11,13, Celgene Corporation 2, 8, Chevron Corp. 1, 2, 4, 5, 7, 11, Cisco Systems Inc. 1, 2, 4, 5, 11, Coca-Cola Co. 2, 4,5, 7, Comcast Corporation 2, 9, 17, Exelon Corp. 1, 2, 4, 5, 11, General Motors Company 1, 2, 11, Gilead Sciences 2,Intel Corp. 1, 2, 4, 5, 6, 10, 11, 14, 15, IntercontinentalExchange, Inc. 1, 2, 6, 7, 8, 11, 18, JPMorgan Chase & Co. 1,
Large Cap Core Model Portfolio
16
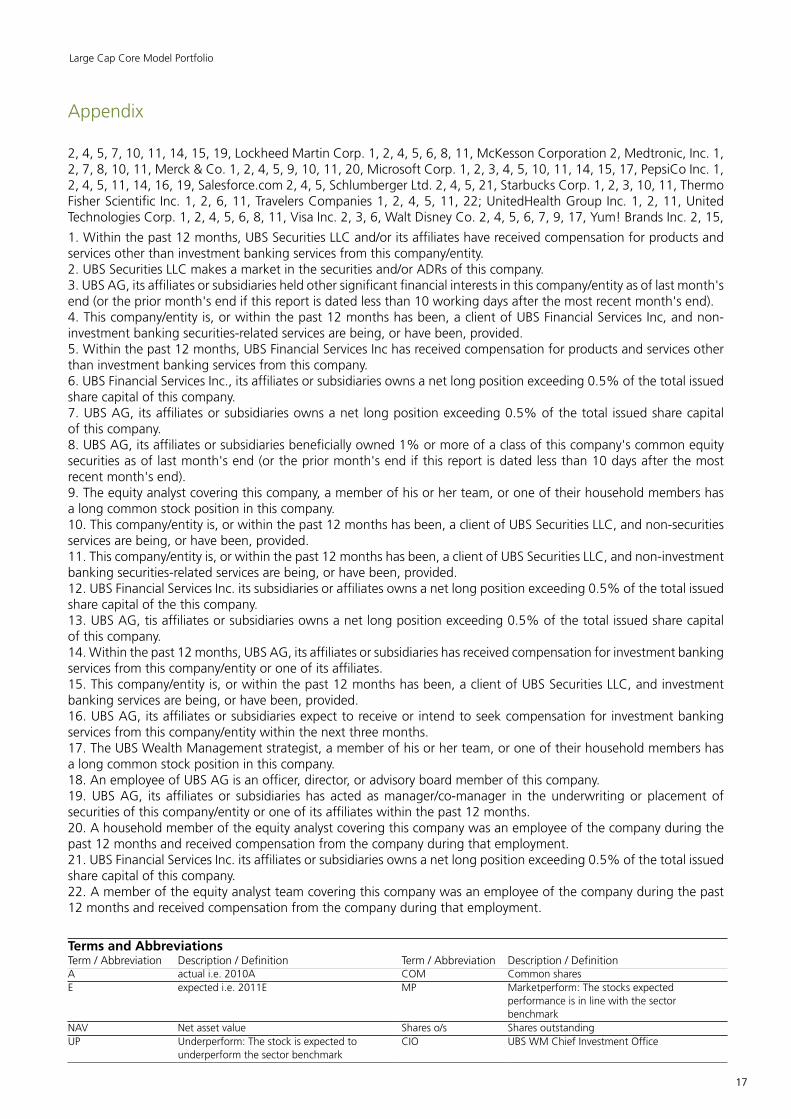
Appendix
2, 4, 5, 7, 10, 11, 14, 15, 19, Lockheed Martin Corp. 1, 2, 4, 5, 6, 8, 11, McKesson Corporation 2, Medtronic, Inc. 1,2, 7, 8, 10, 11, Merck & Co. 1, 2, 4, 5, 9, 10, 11, 20, Microsoft Corp. 1, 2, 3, 4, 5, 10, 11, 14, 15, 17, PepsiCo Inc. 1,2, 4, 5, 11, 14, 16, 19, Salesforce.com 2, 4, 5, Schlumberger Ltd. 2, 4, 5, 21, Starbucks Corp. 1, 2, 3, 10, 11, ThermoFisher Scientific Inc. 1, 2, 6, 11, Travelers Companies 1, 2, 4, 5, 11, 22; UnitedHealth Group Inc. 1, 2, 11, UnitedTechnologies Corp. 1, 2, 4, 5, 6, 8, 11, Visa Inc. 2, 3, 6, Walt Disney Co. 2, 4, 5, 6, 7, 9, 17, Yum! Brands Inc. 2, 15,
1. Within the past 12 months, UBS Securities LLC and/or its affiliates have received compensation for products andservices other than investment banking services from this company/entity.2. UBS Securities LLC makes a market in the securities and/or ADRs of this company.3. UBS AG, its affiliates or subsidiaries held other significant financial interests in this company/entity as of last month'send (or the prior month's end if this report is dated less than 10 working days after the most recent month's end).4. This company/entity is, or within the past 12 months has been, a client of UBS Financial Services Inc, and non-investment banking securities-related services are being, or have been, provided.5. Within the past 12 months, UBS Financial Services Inc has received compensation for products and services otherthan investment banking services from this company.6. UBS Financial Services Inc., its affiliates or subsidiaries owns a net long position exceeding 0.5% of the total issuedshare capital of this company.7. UBS AG, its affiliates or subsidiaries owns a net long position exceeding 0.5% of the total issued share capitalof this company.8. UBS AG, its affiliates or subsidiaries beneficially owned 1% or more of a class of this company's common equitysecurities as of last month's end (or the prior month's end if this report is dated less than 10 days after the mostrecent month's end).9. The equity analyst covering this company, a member of his or her team, or one of their household members hasa long common stock position in this company.10. This company/entity is, or within the past 12 months has been, a client of UBS Securities LLC, and non-securitiesservices are being, or have been, provided.11. This company/entity is, or within the past 12 months has been, a client of UBS Securities LLC, and non-investmentbanking securities-related services are being, or have been, provided.12. UBS Financial Services Inc. its subsidiaries or affiliates owns a net long position exceeding 0.5% of the total issuedshare capital of the this company.13. UBS AG, tis affiliates or subsidiaries owns a net long position exceeding 0.5% of the total issued share capitalof this company.14. Within the past 12 months, UBS AG, its affiliates or subsidiaries has received compensation for investment bankingservices from this company/entity or one of its affiliates.15. This company/entity is, or within the past 12 months has been, a client of UBS Securities LLC, and investmentbanking services are being, or have been, provided.16. UBS AG, its affiliates or subsidiaries expect to receive or intend to seek compensation for investment bankingservices from this company/entity within the next three months.17. The UBS Wealth Management strategist, a member of his or her team, or one of their household members hasa long common stock position in this company.18. An employee of UBS AG is an officer, director, or advisory board member of this company.19. UBS AG, its affiliates or subsidiaries has acted as manager/co-manager in the underwriting or placement ofsecurities of this company/entity or one of its affiliates within the past 12 months.20. A household member of the equity analyst covering this company was an employee of the company during thepast 12 months and received compensation from the company during that employment.21. UBS Financial Services Inc. its affiliates or subsidiaries owns a net long position exceeding 0.5% of the total issuedshare capital of this company.22. A member of the equity analyst team covering this company was an employee of the company during the past12 months and received compensation from the company during that employment.
Terms and AbbreviationsTerm / Abbreviation Description / Definition Term / Abbreviation Description / DefinitionA actual i.e. 2010A COM Common sharesE expected i.e. 2011E MP Marketperform: The stocks expected
performance is in line with the sectorbenchmark
NAV Net asset value Shares o/s Shares outstandingUP Underperform: The stock is expected to
underperform the sector benchmarkCIO UBS WM Chief Investment Office
Large Cap Core Model Portfolio
17

Appendix
Disclaimer
UBS Chief Investment Office's ("CIO") investment views are prepared and published by the Global Wealth Management business of UBSSwitzerland AG (regulated by FINMA in Switzerland) or its affiliates ("UBS").The investment views have been prepared in accordance with legal requirements designed to promote the independence of investmentresearch.Instrument/issuer-specific investment research – Risk information:This publication is for your information only and is not intended as an offer, or a solicitation of an offer, to buy or sell any investment orother specific product. The analysis contained herein does not constitute a personal recommendation or take into account the particularinvestment objectives, investment strategies, financial situation and needs of any specific recipient. It is based on numerous assumptions.Different assumptions could result in materially different results. Certain services and products are subject to legal restrictions and cannotbe offered worldwide on an unrestricted basis and/or may not be eligible for sale to all investors. All information and opinions expressedin this document were obtained from sources believed to be reliable and in good faith, but no representation or warranty, express orimplied, is made as to its accuracy or completeness (other than disclosures relating to UBS). All information and opinions as well as anyforecasts, estimates and market prices indicated are current as of the date of this report, and are subject to change without notice. Thispublication is not intended to be a complete statement or summary of the securities, markets or developments referred to in the report.Opinions expressed herein may differ or be contrary to those expressed by other business areas or divisions of UBS as a result of usingdifferent assumptions and/or criteria.In no circumstances may this document or any of the information (including any forecast, value, index or other calculated amount ("Values"))be used for any of the following purposes (i) valuation or accounting purposes; (ii) to determine the amounts due or payable, the priceor the value of any financial instrument or financial contract; or (iii) to measure the performance of any financial instrument including,without limitation, for the purpose of tracking the return or performance of any Value or of defining the asset allocation of portfolio or ofcomputing performance fees. By receiving this document and the information you will be deemed to represent and warrant to UBS thatyou will not use this document or otherwise rely on any of the information for any of the above purposes. UBS and any of its directors oremployees may be entitled at any time to hold long or short positions in investment instruments referred to herein, carry out transactionsinvolving relevant investment instruments in the capacity of principal or agent, or provide any other services or have officers, who serveas directors, either to/for the issuer, the investment instrument itself or to/for any company commercially or financially affiliated to suchissuers. At any time, investment decisions (including whether to buy, sell or hold securities) made by UBS and its employees may differ fromor be contrary to the opinions expressed in UBS research publications. Some investments may not be readily realizable since the market inthe securities is illiquid and therefore valuing the investment and identifying the risk to which you are exposed may be difficult to quantify.UBS relies on information barriers to control the flow of information contained in one or more areas within UBS, into other areas, units,divisions or affiliates of UBS. Futures and options trading is not suitable for every investor as there is a substantial risk of loss, and lossesin excess of an initial investment may occur. Past performance of an investment is no guarantee for its future performance. Additionalinformation will be made available upon request. Some investments may be subject to sudden and large falls in value and on realizationyou may receive back less than you invested or may be required to pay more. Changes in foreign exchange rates may have an adverseeffect on the price, value or income of an investment. The analyst(s) responsible for the preparation of this report may interact with tradingdesk personnel, sales personnel and other constituencies for the purpose of gathering, synthesizing and interpreting market information.Research publications from CIO are written by UBS Global Wealth Management. UBS Global Research is written by UBS InvestmentBank. Except for economic forecasts, the research process of CIO is independent of UBS Global Research. As a consequence researchmethodologies applied and assumptions made by CIO and UBS Global Research may differ, for example, in terms of investmenthorizon, model assumptions, and valuation methods. Therefore investment recommendations independently provided by the two UBSresearch organizations can be different. The compensation of the analyst(s) who prepared this report is determined exclusively by researchmanagement and senior management (not including investment banking). Analyst compensation is not based on investment banking,sales and trading or principal trading revenues, however, compensation may relate to the revenues of UBS as a whole, of which investmentbanking, sales and trading and principal trading are a part.Tax treatment depends on the individual circumstances and may be subject to change in the future. UBS does not provide legal or taxadvice and makes no representations as to the tax treatment of assets or the investment returns thereon both in general or with referenceto specific client's circumstances and needs. We are of necessity unable to take into account the particular investment objectives, financialsituation and needs of our individual clients and we would recommend that you take financial and/or tax advice as to the implications(including tax) of investing in any of the products mentioned herein.This material may not be reproduced or copies circulated without prior authority of UBS. Unless otherwise agreed in writing UBS expresslyprohibits the distribution and transfer of this material to third parties for any reason. UBS accepts no liability whatsoever for any claimsor lawsuits from any third parties arising from the use or distribution of this material. This report is for distribution only under suchcircumstances as may be permitted by applicable law. For information on the ways in which CIO manages conflicts and maintainsindependence of its investment views and publication offering, and research and rating methodologies, please visit www.ubs.com/research.Additional information on the relevant authors of this publication and other CIO publication(s) referenced in this report; and copies of anypast reports on this topic; are available upon request from your client advisor.Important Information About Sustainable Investing Strategies: Incorporating environmental, social and governance (ESG) factorsor Sustainable Investing considerations may inhibit the portfolio manager’s ability to participate in certain investment opportunities thatotherwise would be consistent with its investment objective and other principal investment strategies. The returns on a portfolio consistingprimarily of ESG or sustainable investments may be lower than a portfolio where such factors are not considered by the portfolio manager.Because sustainability criteria can exclude some investments, investors may not be able to take advantage of the same opportunities ormarket trends as investors that do not use such criteria. Companies may not necessarily meet high performance standards on all aspectsof ESG or sustainable investing issues; there is also no guarantee that any company will meet expectations in connection with corporateresponsibility, sustainability, and/or impact performance.Distributed to US persons by UBS Financial Services Inc. or UBS Securities LLC, subsidiaries of UBS AG. UBS Switzerland AG, UBS Europe SE,UBS Bank, S.A., UBS Brasil Administradora de Valores Mobiliarios Ltda, UBS Asesores Mexico, S.A. de C.V., UBS Securities Japan Co., Ltd,UBS Wealth Management Israel Ltd and UBS Menkul Degerler AS are affiliates of UBS AG. UBS Financial Services Incorporated of Puerto Ricois a subsidiary of UBS Financial Services Inc. UBS Financial Services Inc. accepts responsibility for the content of a report preparedby a non-US affiliate when it distributes reports to US persons. All transactions by a US person in the securities mentioned inthis report should be effected through a US-registered broker dealer affiliated with UBS, and not through a non-US affiliate.The contents of this report have not been and will not be approved by any securities or investment authority in the UnitedStates or elsewhere. UBS Financial Services Inc. is not acting as a municipal advisor to any municipal entity or obligated personwithin the meaning of Section 15B of the Securities Exchange Act (the "Municipal Advisor Rule") and the opinions or viewscontained herein are not intended to be, and do not constitute, advice within the meaning of the Municipal Advisor Rule.External Asset Managers / External Financial Consultants: In case this research or publication is provided to an External Asset Manageror an External Financial Consultant, UBS expressly prohibits that it is redistributed by the External Asset Manager or the External FinancialConsultant and is made available to their clients and/or third parties. For country disclosures, click here.Version 04/2019. CIO82652744© UBS 2019. The key symbol and UBS are among the registered and unregistered trademarks of UBS. All rights reserved.
Large Cap Core Model Portfolio
18