L’ORÉAL S.A. C RThe company’s product portfolio contains inter alia, some of the most popular...
35
MASTER IN FINANCE THIS REPORT WAS PREPARED EXCLUSIVELY FOR ACADEMIC PURPOSES BY NICK DÖRNER, A MASTER IN FINANCE STUDENT OF THE NOVA SCHOOL OF BUSINESS AND ECONOMICS. THE REPORT WAS SUPERVISED BY A NOVA SBE FACULTY MEMBER, ACTING IN A MERE ACADEMIC CAPACITY, WHO REVIEWED THE VALUATION METHODOLOGY AND THE FINANCIAL MODEL. (PLEASE REFER TO THE DISCLOSURES AND DISCLAIMERS AT END OF THE DOCUMENT) Page 1/31 § We recommend buying L’Oréal as the current share price lies below the range of our FY Target Price of €235.83. With an expected dividend of €3.38 per share in 2019, this results in a total shareholder return of 19.60%. § L’Oréal profits from long lasting, strong growth in the luxury segment, which outweighs current struggles in the mass segment. Overall, the company is expected to continue outperforming its peers (5y CAGR: 4.8% vs. market growth 4.6%). § A stake in L’Oréal is attractive for investors who are looking for a place to store their money as the company has been the established market leader in an industry that has historically been “recession-proof” with growth rates never below 3.2% for the last eight consecutive years. § L’Oréal is well positioned within Emerging Markets and has strong potential to benefit from secular growth in these regions, especially in China, where the company is the undisputed market leader (15.2%) in the fast-growing premium segment. § The company’s balance sheet is among the strongest in the beauty industry as the firm is reluctant to take on debt (net debt/equity of -7.64% vs. peer average of 28.5%). This, in addition to the Sanofi stake worth €9.4bn, gives room to create shareholder value in the future in terms of buy-backs, dividends and possible bolt-on acquisitions. Company description L’Oréal is a globally operating French cosmetics manufacturer. The company sells all major beauty products from Skin care to Colour Cosmetics and distributes its goods through various channels, like Traditional Retail Stores, Specialised Resellers, Travel Retail, e-commerce, Hair Salons and many more. L’ORÉAL S.A. COMPANY REPORT CONSUMER GOODS 04.JANUARY.2019 STUDENT: MAGNUS LAUVLI ANDERSEN [email protected] A Beautiful Company at a Luxurious Price A safe investment in turbulent times Recommendation: BUY Vs Previous Recommendation HOLD Price Target FY19: 235.83 € Vs Previous Price Target n.a. Price (as of 4-Jan-19) 200.00 € Reuters: OREP.PA, Bloomberg: OR FP Equity 52-week range (€) 170.3-214.9 Market Cap (€m) 111,767 Outstanding Shares (m) 558.8 Source: Bloomberg Source: Bloomberg (Values in € millions) 2017 2018E 2019F Revenues 26.023 26.829 28.267 EBIT 4.395 4.454 4.721 NOPLAT 3.520 3.155 3.341 Net income 3.585 3.378 3.568 FCF (core) 4.568 2.596 2.696 Total Assets 35.339 37.909 40.218 Total Equity 24.819 26.296 27.890 EPS 6.41 6.04 6.37 ROIC 21.4% 20.0% 20.3% Operating margin (core) 16.9% 16.6% 16.7% EV/EBIT 24.6x 24.3x 22.9x Source: Analyst Estimations 80 90 100 110 120 130 140 150 160 170 12/2013 12/2015 12/2017 L'Oréal MSCI World
Transcript of L’ORÉAL S.A. C RThe company’s product portfolio contains inter alia, some of the most popular...

MASTER IN FINANCE
THIS REPORT WAS PREPARED EXCLUSIVELY FOR ACADEMIC PURPOSES BY NICK DÖRNER, A MASTER IN FINANCE STUDENT OF THE
NOVA SCHOOL OF BUSINESS AND ECONOMICS. THE REPORT WAS SUPERVISED BY A NOVA SBE FACULTY MEMBER, ACTING IN A MERE ACADEMIC CAPACITY, WHO REVIEWED THE VALUATION METHODOLOGY AND THE FINANCIAL MODEL.
(PLEASE REFER TO THE DISCLOSURES AND DISCLAIMERS AT END OF THE DOCUMENT) Page 1/31
§ We recommend buying L’Oréal as the current share price
lies below the range of our FY Target Price of €235.83. With an
expected dividend of €3.38 per share in 2019, this results in a total
shareholder return of 19.60%.
§ L’Oréal profits from long lasting, strong growth in the luxury segment, which outweighs current struggles in the mass segment.
Overall, the company is expected to continue outperforming its
peers (5y CAGR: 4.8% vs. market growth 4.6%).
§ A stake in L’Oréal is attractive for investors who are
looking for a place to store their money as the company has been
the established market leader in an industry that has historically
been “recession-proof” with growth rates never below 3.2% for the last eight consecutive years.
§ L’Oréal is well positioned within Emerging Markets and has
strong potential to benefit from secular growth in these regions,
especially in China, where the company is the undisputed market
leader (15.2%) in the fast-growing premium segment.
§ The company’s balance sheet is among the strongest in
the beauty industry as the firm is reluctant to take on debt (net
debt/equity of -7.64% vs. peer average of 28.5%). This, in addition to the Sanofi stake worth €9.4bn, gives room to create shareholder
value in the future in terms of buy-backs, dividends and possible
bolt-on acquisitions.
Company description L’Oréal is a globally operating French cosmetics manufacturer. The company sells all major beauty products from Skin care to Colour Cosmetics and distributes its goods through various channels, like Traditional Retail Stores, Specialised Resellers, Travel Retail, e-commerce, Hair Salons and many more.
L’ORÉAL S.A. COMPANY REPORT CONSUMER GOODS 04.JANUARY.2019
STUDENT: MAGNUS LAUVLI ANDERSEN [email protected]
A Beautiful Company at a Luxurious Price
A safe investment in turbulent times
Recommendation: BUY
Vs Previous Recommendation HOLD
Price Target FY19: 235.83 €
Vs Previous Price Target n.a.
Price (as of 4-Jan-19) 200.00 €
Reuters: OREP.PA, Bloomberg: OR FP Equity
52-week range (€) 170.3-214.9
Market Cap (€m) 111,767
Outstanding Shares (m) 558.8
Source: Bloomberg
Source: Bloomberg
(Values in € millions) 2017 2018E 2019F
Revenues 26.023 26.829 28.267
EBIT 4.395 4.454 4.721
NOPLAT 3.520 3.155 3.341
Net income 3.585 3.378 3.568
FCF (core) 4.568 2.596 2.696
Total Assets 35.339 37.909 40.218
Total Equity 24.819 26.296 27.890
EPS 6.41 6.04 6.37
ROIC 21.4% 20.0% 20.3%
Operating margin (core) 16.9% 16.6% 16.7%
EV/EBIT 24.6x 24.3x 22.9x
Source: Analyst Estimations
80
90
100
110
120
130
140
150
160
170
12/2013 12/2015 12/2017
L'Oréal MSCI World

L’ORÉAL S.A. COMPANY REPORT
PAGE 2/31
Table of Contents
COMPANY DESCRIPTION ........................................................................ 3
SHAREHOLDER STRUCTURE ................................................................................. 3 BEAUTY MARKET OVERVIEW ................................................................. 4
GROWTH DRIVERS ............................................................................................... 5 MARKET ANALYSIS BY GEOGRAPHY ................................................... 9
NORTH AMERICA .................................................................................................. 9 EUROPE .............................................................................................................. 11 ASIA PACIFIC ...................................................................................................... 13 OTHERS - LATIN AMERICA AND AFRICA & MIDDLE EAST .................................. 14
VALUATION ............................................................................................. 17
FINANCIAL PROJECTION ..................................................................................... 17 DISCOUNTED CASH FLOW ANALYSIS ................................................................. 23
APPENDIX ................................................................................................ 26
FINANCIAL STATEMENTS ..................................................................... 26
REPORT RECOMMENDATIONS ............................................................................ 29

L’ORÉAL S.A. COMPANY REPORT
PAGE 3/31
Company description Headquartered and founded in 1909 in Clichy, France, L'Oréal S.A. is the world’s
largest cosmetics manufacturer with leading positions in the main beauty
segments operating across the globe. L'Oréal produces and sells cosmetics for
women and men and provides products for skincare, makeup, hair care, hygiene as well as fragrances and other smaller segments. The company’s product
portfolio contains inter alia, some of the most popular brands available like
Garnier, Maybelline or Lancôme totalling to 34 different brands. L'Oréal
distributes its products through various channels like Mass Retail, Pharmacies,
as well as, Drugstores, Travel Retail, e-commerce and Hair Salons. L'Oréal is
organized into four divisions, which generated sales of €26.02bn in 2017.
Consumer Products, being the largest division by sales, covers all products for the mass market; L'Oréal Luxe, which focuses on the premium segment of
beauty products is the second biggest division, followed by Professional
Products, which is specialised in beauty salon products and Active Cosmetics,
which provides products for skincare. L'Oréal is geographically well diversified
and active in all major cosmetic markets worldwide. New Markets, comprising
Asia/Pacific, Latin America, Eastern Europe and Africa & Middle East are
marking the biggest area of sales (40.5%) followed by Western Europe (31.2%)
and North America (28.3%). Operating profitability by geography and by division remains in double digits and lies between a minimum of 19.2% in New Markets
and a maximum of 22.9% in Western Europe as well as 20.0% for Consumer-
and Professional Products and 22.6% for Active Cosmetics.
Shareholder structure L'Oréal currently has 558m ordinary shares outstanding (diluted) and has been publicly listed at the French Stock Exchange since 1963. The Bettencourt family
controls about 33% of the shares through its holding company Tethys SAS
(27.22%) and through Francoise Bettencourt Meyers who personally holds
5.92%. Nestlé is the second biggest shareholder and controls 23.18% of the shares. Other shareholders such as Vanguard (1.74%), BlackRock (1.39%) and
Norges Bank (0.99%) also hold mentionable stakes. The geographical ownership
is focused in France and Switzerland with 40.18% and 32.28% of shares
outstanding respectively, while the US represent 8.72%. Nestlé and L'Oréal have
a long history together, which started in 1974, with L'Oréal seeking an
international partner in fear of getting nationalized by the French state. The two
parties had an agreement that as long as Liliane Bettencourt lives, they cannot
Graph 3: Global Cosmetic Market growth
Graph 2: Geographical Revenue Split L’Oréal
Source: L’Oréal Annual Report
28%
31%
7%
24%
7%3%
North AmericaWestern EuropeEastern EuropeAsiaLatin AmericaMiddle East & Africa
Graph 1: Sales of the World’s Largest Cosmetic
Manufacturers (in bn)
Source: Bloomberg
€ 26.02
€ 16.98
€ 11.00 € 7.88 € 7.47
L'Oréal P&G E.Lauder
Coty Shiseido

L’ORÉAL S.A. COMPANY REPORT
PAGE 4/31
sell their shares to third parties, only amongst each other. This deal was
terminated due to the passing of Liliane and the expiration of the six-month lock-up period after March 2018. Activist investor Daniel Loeb took a large position
(5th biggest shareholder) in Nestlé during 2017 and has been pressuring the
board of Nestlé to sell their stake in L'Oréal and return it to shareholders. Due to
the stability of cash flows, net cash position and financial flexibility it wouldn’t be
surprising if L'Oréal buys back shares in case Nestlé decides to sell their stake.
Beauty Market Overview Being the market leader in the world of cosmetics, this industry represents the
sole source of income for L'Oréal. Estimated at €412.5bn in 2017, the overall
beauty market has grown continuously over the last ten years, resisting even the
global economic downturn of the financial crisis in 2008/09 (Graph 3). Propelled
by innovation and the everlasting change in consumer preferences annual growth has not fallen below the threshold of 3.2% during the last eight consecutive
years. Especially favourable is the development of social media, as well as the
rise in online shopping paired with the growth of the high-income class in Asia
(Graph 4) and North America, which is expected to continue until 2030 and all of
which are factors expected to fuel cosmetics sales going forward.
The world of cosmetics can be segmented in many ways. When differentiating by
product category the largest one is Skincare with an overall market share of 25%,
followed by Haircare 15%, Colour Cosmetics 13%, Fragrances 10% and multiple other smaller categories (Graph 5). Beauty products can also be classified into
premium and mass production, where the latter accounts for 71% of global sales
and is concentrated in large markets such as US, China and Brazil. Over the last
five years luxury cosmetics growth has outperformed the mass cosmetics
segment and is accounting for 40% of the worldwide cosmetics growth. This is
largely driven by the expansion of the high-income class in prior mentioned
regions and the increase in Chinese consumers traveling across the globe. Geographically, the Asian Pacific market is the largest marking 34% of overall
sales succeeded by N. America 20% and Western Europe with 20% (Graph 6).
As observable in Graph 7, the gap between Asia and the Western hemisphere is
expected to further increase over the course of the next years mainly due to
differences in demographic development as well as market maturity. Hence,
leading cosmetic manufacturers are increasing their presence in these areas,
which will be analysed in more detail later on.
Currently, the cosmetics industry is rather consolidated as the top ten cosmetic manufacturers have about 45% market share of beauty market across all beauty
Graph 5: Global Cosmetic Market Product Split
Source: Euromonitor
13%
10%
15%
25%
37%
Colour CosmeticsFragrancesHair CareSkin CareOther
Source: Asian Development Bank
Graph 4: Income Class Distribution in developing
Asia
10
51
5
4
3
3
6
35
1960 1990 2014
Low income Lower middleUpper middle High income
Num
ber o
f cou
ntrie
s
Source: Euromonitor
Graph 3: Global Cosmetic Market Growth
5.7 %
4.2 %
3.2 %
4.6 %
5.2 % 5.2 %4.9 %
4.7 %4.5 %4.4 %
5.0 %
07 08 09 10 11 12 13 14 15 16 17Year

L’ORÉAL S.A. COMPANY REPORT
PAGE 5/31
segments. L'Oréal is currently the biggest beauty company, followed by P&G and
Estée Lauder (Graph 1). Economies of scale are strong in the beauty care industry, which made consolidation favourable, which is reflected in high M&A
activity (Graph 14). Smaller companies hardly benefit from supply chain cost
synergies in R&D, sourcing, manufacturing, and distribution since they are only
achieved when volume gets high enough to drive substantial cost savings per
unit. Moreover, large cosmetic companies have been dominating sales by
squeezing out small competitors on the shelves of the large retailers and on the
glossy magazine pages consumed by their target demographic. However, as sales (see below Table 1) and merchandising activities have become digital and
thus, cheaper, more responsive smaller brands are also winning through their
speed and depth of connection to their consumers – particularly, the younger
demographic. These marketing trends are forcing bigger manufacturers to
acquire smaller brands in order to revamp their aging image and capture
momentum with up and coming tech-savvy generations.
L'Oréal focuses exclusively on the beauty industry and is thus called a pure
beauty player. Unlike most of its peers, there is no other field of activity in which L'Oréal participates. Even though there are a few other competitors, that have a
similar, beauty-centric business model such as E. Lauder, Coty or Shiseido, none
of them are as diversified in both product portfolio and geographical coverage
simultaneously as L'Oréal is. E. Lauder for instance, is solely specialised in the
sale of premium products, while Coty has a broader product portfolio but is more
regionally focussed and lacks the geographical reach of L'Oréal (Graph 8). In
terms of size there are only a few players in the market who can compete with
the French cosmetics manufacturer. As observable in Graph 1 the closest pure beauty player E. Lauder has less than 50% of the total sales of L'Oréal. Unilever
and Procter & Gamble are contenders which come close to L'Oréal when it
comes to sales numbers, but these companies are no pure players and have
additional areas of focus in the consumer industry. They lack the product depth of
L'Oréal and focus more on a few large brands, which mostly cover the mass
market as of now. Hence, to completely understand the challenges and
opportunities for L'Oréal as a whole, we will analyse each geography with its unique competitive landscape and growth drivers separately.
Growth Drivers
While there are regionally bound, idiosyncratic trends, we identified what we think
to be the key drivers of growth affecting the cosmetics industry as a whole. As E.
Lauder commented in their annual report (2017): “With a desire to always be
camera-ready, consumers’ appetites for beauty products is intensifying, Portfolio Depth
Geog
raph
ical D
iver
sifica
tion
Graph 8: Diversification Overview of largest Beauty
Players
Source: Euromonitor
13%
18%
23%
28%
33%
38%
2003 2006 2009 2012 2015 2018 2021
Asia OtherNorth America Western Europe
Source: Euromonitor
Graph 7: Global Cosmetic Market Geographical Split
2003-2023
Graph 6: Global Cosmetic Market Geographical Split
20%
20%
5%
34%
14% 7%
North AmericaWestern EuropeEastern EuropeAsiaLatin AmericaMiddle East & Africa
Source: Euromonitor

L’ORÉAL S.A. COMPANY REPORT
PAGE 6/31
particularly in the luxury arena.” Due to mentioned favourable demographics and
strong growth in the upper- and middle class, luxury cosmetic sales are surging (Graph 9) and the five largest manufacturers for premium cosmetics L'Oréal, E.
Lauder, Shiseido, LVMH and Coty account for 46% of world-wide luxury sales in
2017. Inflation and rising input- and transportation cost are easier to pass on in
the premium cosmetic segment, which is contrasting the situation in the mass
segment, where consumers price sensitivity is higher. Due to intensified
competition and lower barriers to entry caused largely by digital commerce and
social media, prices stagnate, or even decrease in mature markets. Manufacturers which focused on this customer segment like P&G, Unilever and
Henkel are struggling to keep up with the growth numbers reported by more
luxury heavy competitors (Graph 10). Efforts to shift their business focus away
from mass and more into the premium segment via multiple acquisitions are
taking time to pay off and will most likely excel in the future.
In order to please customers thirst for innovation and better, more personalized
products, cosmetic companies tend to invest heavily in research & development.
L'Oréal is the leading player when it comes to R&D and they outspend the industry for the last five consecutive years, which will be analysed more
thoroughly later on.
One of the biggest drivers in the cosmetics market is the increase in sales via the
internet. E-commerce sales are rapidly growing among every major competitor,
and in every geography around the world. Table 1 depicts that the market share
of online sales in the beauty industry increased by at least 49% over the last five
years on every continent with remarkably strong numbers in Africa & Middle East
and Asia. Online shopping enables a swift comparison and detailed descriptions of products. This development is enhanced by manufacturers who take
advantage of new technologies and communicate with their customers through
social media and other new channels as well as growing mobile phone
penetration rates (up 13% since 2014). We believe that the beauty companies
that manage the shift to e-commerce successfully, will focus on merging the
offline- and online shopping experience, rather than choosing one over the other.
E-commerce will continue ‘cannibalize’ some of the offline sales but is also a channel that is needed to drive new customer experiences as this channel is
open whenever and wherever. Brick-and-mortar stores will still be an important
asset for beauty companies as they provide a unique experience for customers
where they can touch and try out products physically. The rise of specialty beauty
retailers is evidence of this (Graph 15). L’Oréal, E. Lauder and other beauty
players have amassed millions of followers on Instagram, Facebook and
YouTube through which they advertise their products and conduct market
Table 1: Market share of E-commerce of total sales by
Geography
Source: Euromonitor
Graph 9: Mass vs. Premium Sales Growth by Geography
2012-2017
Source: Euromonitor
34%
10.8%
44.4%
34.1%
10%6.4%
27.8% 32.9%
NorthAmerica
WesternEurope
EasternEurope
Asia
Luxury Sales Growth Mass Sales Growth
6.50%
3.35%
6.45%5.85%
8.90%
3.65%
2.45% 2.55% 2.85%2.05%
2013 2014 2015 2016 2017
L'Oréal & Estée LauderP&G & Unilever
Source: Euromonitor
Graph 10: Average Sales Growth of Premium and Mass
Cosmetics Manufacturers

L’ORÉAL S.A. COMPANY REPORT
PAGE 7/31
research. L'Oréal has a strong online presence with 250m followers on social
media and one billion website visits annually. In 2017 L’Oréal had online sales of €2.1bn (8% of sales) and a growth rate of 33.6% making e-commerce its fastest
growing distribution channel. The company’s strategy is mainly to leverage
retailer’s online websites and platforms in order to drive sales, but also to push
sales through the websites of their own brands (⅓ is direct to customers “D2C”).
Tmall in China is a great example of this strategy, where L’Oréal leverages
Alibaba’s e-commerce platform to reach over 600m active users. This channel
has been a strong driver of top-line growth and online sales account for over ⅓ of total sales in China 2017, up from only 3% in 2012. E. Lauder is one of the
beauty peers that also has managed to adapt to the shift in consumer
preferences and their online sales mark about 11% of total sales, up from almost
4% four years ago. Shiseido claims to have about 8% of sales online and the
company is aiming for 20% in 2020, while Coty chooses not to disclose any
online sales numbers or growth rates. E-commerce removes certain entry
barriers such as labor- and leasing costs, which makes it easier to establish new
beauty brands with less capital. On the other hand, the CEO of L’Oréal, Jean-Paul Agon, argues that e-commerce follows a more Darwinian approach where
brands that have strong customer base will flourish. This is happening especially
in China where big brands are becoming even bigger due to their online
presence. Ratings and reviews influence consumer spending habits and big
brands tends to have a larger market share online because of more reviews and
information about products than smaller brands.
Travel retail is another distribution channel that is booming largely due to strong
growth in Chinese tourists who go abroad and account for approximately 70% of growth in this channel. Their spending alone almost quintupled between 2010
and 2016 reaching a volume of $261bn (Graph 11). This trend is expected to
continue into the foreseeable future because of earlier mentioned upper- and
middle-class growth1. Moreover, the emergence of low-cost flights and
digitalization attracts more and more millennials who spend their money at
airports worldwide (Graph 13). Prestige beauty brands are benefitting the most
from globetrotters and larger growing airports, which transform into high-end retail stores. In 2017, L’Oréal did almost €2bn in sales (8% of total) in travel retail
and the distribution channel grew over 20%. The company uses the travel retail
channel to introduce premium luxury brands such as Lancôme and YSL to new
and existing customers. L’Oréal is the market leader in this distribution channel,
but faces fierce competition from E. Lauder, which saw its travel retail sales grow
22% (in constant currency) in fiscal year 2017 and now consists of 14% of the
1 Just 7% of the Chinese population possess a passport (vs. US 40%), hence there is huge growth potential for the future.
Graph 12: 5y CAGR of in Aircraft passenger by
Geography
Source: Euromonitor
0.0%
2.5%
5.0%
7.5%
10.0%
World Wide East Asia &Pacific
North America Europe &Central Asia
2002-2007 2007-2012 2012-2017
13 55 261
10.557.4
136.9
2000 2010 2016
Spending (bn USD)Annual oversee visits (m)
Graph 11: Chinese Tourist Activity
Source: China Outbound Tourism Research Institute, United Nations
World Tourism Organization

L’ORÉAL S.A. COMPANY REPORT
PAGE 8/31
company’s sales. Shiseido is also a serious player in the segment and grew their
travel retail sales by 73.8% to €350mn in 2017.
Over the last five years, the leading cosmetic manufacturers have been busy acquiring smaller players in order to gain access to new customers, distribution
channels, markets and innovation. Since it has proven challenging for them to
grow their business organically by opening stores and expanding distribution
channels for their existing portfolio, large and mature players rely increasingly on
acquisitions as means for growth. Thus, the number of global beauty care deals
has been steadily increasing from 100 in 2013 to 193 in 2017 (Graph 14).
Recently, more than half of these purchases were taking place in order to reach
customers since big beauty brands are threatened by young, independent brands that capture niche needs. The rise of social media combined with the growing
popularity of specialised shops like Sephora/Ulta in the US (Graph 15), or
Douglas in Europe, makes it easier for new brands to become household names.
One example is the influencer Kyle Jenner, whose company Kyle Cosmetics
went from zero to $420m sales in just 18 months without any traditional
advertising. After years of selling their products in department stores, large and
mature beauty players are turning to start-ups to enable cosmetics to become connected and customised. In order to stand out from rivals, L'Oréal & Co. are
using artificial intelligence and smartphone apps to reach their customers,
improve their shopping experience and building brands early on. Japanese
cosmetic manufacturer Shiseido has acquired three start-ups in the US in the
past two years covering areas like artificial skin and AI technology. L'Oréal
recently bought the Canadian beauty tech company ModiFace and LVMH has
partnered with an accelerator for beauty-tech firms. Since these deals happened
very recently, the impact of them on the industry and the company’s valuation is yet to materialize. Even though it is hard to quantify as of now, we do think major
cosmetics manufacturers are acquiring those tech companies as a precautionary
move, in order not to miss a potential trend. Next to more advanced innovation
techniques, deals are focused on natural cosmetic brands as customers
awareness for sustainable products increases. Both L'Oréal and E. Lauder
ramped up their portfolio with multiple acquisitions, which are expected to
increase the company’s market shares in this area looking forward. Estée added
Becca and Too Faced in colour cosmetics, while L'Oréal took over IT Cosmetics and Atelier Cologne in 2016, derma skincare in 2017 and Korean Style. in 2018.
Due to its net cash position and its robust cash flows, L’Oréal is in the best
financial position of the pure beauty players (Table 2). The company’s stake in
Sanofi, a publicly listed pharmaceutical company, is worth about €9.4bn and
could come in handy if L’Oréal chooses to pursue larger acquisitions. E. Lauder
Graph 14: Global Cosmetics M&A Deal Volume and Count
Source: Bloomberg
100 100
135
188 193
4.018.1 18.4
33.821.1
2013 2014 2015 2016 2017
Deal Count Volume (bn $)
75.782.4
89.897.8
106.4116.0
125.1
2017 2018 2019 2020 2021 2022 2023
Source: Statista
Graph 13: Global duty-free travel retail revenues (bn $)

L’ORÉAL S.A. COMPANY REPORT
PAGE 9/31
currently has a net debt position, but the company’s free cash flow is large
enough to cover this within one year - so its debt position is not constraining the company’s M&A potential. The firm has a strong credit rating and should
therefore have no problems with tapping into the debt markets if needed for
acquisitions. Shiseido has a net cash position, but we believe that the cash
position would not be deployed for any large acquisitions in the near future as the
company is currently in an investment phase and has predicted that free cash
flow will be negative until 2020. Coty has been struggling ever since the takeover
of P&G’s beauty division and currently has a net debt position of €6.7bn, which is larger than the company’s market capitalization. With a low cash position and a
credit rating of Ba3 the firm could run into liquidity problems and we believe Coty
is not looking for acquisitions as of today.
Market Analysis by Geography
North America North America continuous to be one of the biggest markets for beauty care with a total sales volume of €83.5bn where mass products account for 61% and
premium products for 39%. L'Oréal’s past performance in this region has been
satisfactory in both of these segments (5y CAGR 7.12%) and the company could
steadily increase its market share from 11.8% in 2012 to 13.3% in 2017. After a
solid growth momentum over the last five years with a CAGR of (3%) the
continent is facing a slowdown in some historical distribution channels and the
mass market. As observable in Graph 15, traditional channels like grocery-, or departments stores are losing market share, which is fully captured by e-
commerce and beauty specialist retailers like Sephora and Ulta Beauty.
Nevertheless, N. America will remain being the wealthiest region globally, and is
expected to be home to almost half of the world’s high-income class by 2030.
Hence, growth predictions for the premium cosmetics segment are in the higher
single digits with a CAGR of 6% between 2017 and 2022. L'Oréal aims to exploit
this trend going forward with its 15 brands in the Luxe-Division and various
investments over the last years. YSL and IT Cosmetics have continued to record double-digit growth (YSL doubled sales over the last three years) and the
increase in demand of exclusive premium products is also reflected by the
success of niche fragrances and top-end skincare like Armani and Biotherm,
where the former brand crossed the €1bn sales mark in 2017. We believe that
L'Oréal is well positioned to capture future growth in the N. American luxury
market and outperform most of its biggest competitors. Coty, which acquired
large parts of P&G’s beauty portfolio in order to compete in the premium segment
is still struggling to integrate and streamline operations, which is expected to be
Table 2: Key Financial Ratios of Pure Beauty Players
Source: Annual Reports, Bloomberg
Graph 15: Sales Channel Market Share, North America
Source: Euromonitor
22.90
11.70
5.40
20.70
14.70
9.40
-10% 26% 74%
GroceryRetailers
Beauty Spec.Ret.
InternetRetailing
2012 2017 Growth

L’ORÉAL S.A. COMPANY REPORT
PAGE 10/31
finished earliest in 2020. P&G drastically reduced its market share in the
premium- and mass beauty segments after the brand divestment to Coty from 4% in 2012 to 0.4% in 2017 and 14.6% to 9.6% respectively and has less
overlapping with L'Oréal’s business. Shiseido repeatedly reports losses in the
Americas ever since they entered the market through various acquisitions. On
multiple occasions they cut fragrance brands and stores and are expected to lose
market share going forward. Only E. Lauder is keeping up with L'Oréal’s success
due its exclusive focus on the premium segment and its strategic acquisitions as
well as its shift of distribution channels from over-exposed brick-and-mortar outlets to specialist shops and an increase in web presence. Currently, their
combined market share in the prestige segment amounts to 43% with E. Lauder
owning 23.4% and L'Oréal 19.6%. Another emerging rival is Unilever, which
intended to increase its exposure to the luxury segment through a string of
acquisitions over the last five years. Acquired brands cover skin care
(Dermalogica, Murad, REN) as well as hair care (Living Proof) and, more
recently, Hourglass and Equilibra.
In North America’s mass-market price pressure is very high due to the strong competition. As observable in Table 3 the top two players only retain 25.4%
market share compared to the 43.1% in the luxury segment. Growth in this
segment was in the low single digits with an average growth rate of 1.72% over
the last five years. L'Oréal is also affected by this development and challenged
by stronger competition in the colour cosmetics and hair care segment. Coty is
boosting its make-up brands with a multi-year brand turnaround strategy and
opened a flagship store at the times square - therefore, the company is expected
to gain traction in this segment going forward. In the hair care segment Johnson & Johnson gained a lot of attention and market share through the acquisition of
Vogue and its brands. On the other hand, in 2017 L'Oréal acquired CeraVe,
AcneFree and Ambi in an effort to complete and strengthen its positions in the
strong growing N. American skin care segment, enabling it to meet growing
demand for active skincare at a reasonable price point. As depicted in Graph 16,
skin care is the largest product segment and expected to grow by the highest
absolute amount across all categories of €3.6bn between 2018 and 2022. With mentioned purchases we expect L'Oréal to extend its position at the top of the
skin care market whilst competitors like E. Lauder, P&G, Coty and Unilever lost
market share in this segment for the last three consecutive years.
Overall, we forecast L'Oréal to outperform the market until 2021 due to its strong
positioning in the higher price segment and its bolt-on acquisitions as well as its
innovative R&D department. From that point on we expect stronger competition
Table 3: Largest Beauty Players Market Share in Mass & Premium Segment in North
America
Source: Euromonitor
Graph 16: Forecasted 5y Growth 2018-2022 by Product
Category, North America
Source: Euromonitor
3,550
1,404 1,559
3,647
5,126
20.7% 16.9% 12.2% 19.4% 14.2%
ColourCosmetics
Fragrances Hair Care Skin Care Other
Abs. Growth (bn €) Rel. Growth
Table 4: North America Market Forecast
Source: Analyst estimates, Euromonitor
North America E2018 F2019 F2020 F2021 F2022 F2023Market size (€ m) 84,166 87,509 90,747 94,389 98,206 101,451growth 0.80% 3.97% 3.70% 4.01% 4.04% 3.31%L'Oréal (adj.) share 8.90% 9.00% 9.10% 9.00% 8.90% 8.90%difference 0.10% 0.10% 0.10% -0.10% -0.10% 0.00%L'Oréal revenues (€ m) 7,493 7,878 8,261 8,498 8,743 9,032 growth 1.94% 5.14% 4.85% 2.87% 2.89% 3.31%

L’ORÉAL S.A. COMPANY REPORT
PAGE 11/31
from the currently more mass-market focused competitors, particularly Coty and
Unilever, both of which invested heavily in the luxury segment (Table 4).
Europe Being L'Oréal’s home turf, Western Europe is a rather mature and large market (€83.5bn) and known for its purchasing power due to a high disposable income of
its residents (Graph 17). Over the last five years this area has been the least
dynamic with a CAGR of 1.51% and, similar to N. America, W. Europe is a highly
competitive market where pricing power in the mass segment remains limited.
Still, L'Oréal was able to outperform the overall market (CAGR 1.94%). L'Oréal
covers all ages and income classes with its diversified and continuously growing
product and brand portfolio. The French manufacturer has a high level of brand recognition in Europe, which is reinforced through regular marketing campaigns,
free product trials and a very high social media presence - all of which reflects in
the company’s high Advertising & Promotion spending (see Valuation).
Consequently, L'Oréal is the leader in the largest markets for cosmetics in W.
Europe namely Germany, France, the UK and Italy, which translates into the
overall highest market share among competitors in the premium- and mass
segment and a total sales volume of €8.1bn in 2017 (Table 5). Nevertheless,
L'Oréal remains challenged by weak growth in France for the last three years and has been losing 1.6% market share in the mass segment. This has mainly been
caused by customers who opted for a more natural look, which included minimal
make-up usage and by very strong competition in the colour cosmetics segment
by Coty and Kiko, which have been gaining 5.1% and 2.8% market share
respectively, while L’Oréal lost 5.2% since 2012. One major trend in W. Europe is
the growing demand for sustainable and natural products. As customers become
increasingly wary of chemical ingredients they search for organic and natural beauty products. The market for natural cosmetics is gaining traction and is
estimated to almost double its current size of €13.2bn by 2024. In October 2018,
L'Oréal bought German based vegan cosmetics manufacturer Logocos - thus,
complementing its already existing portfolio for natural beauty products.
Branching increasingly into plant-based products, the French company plans to
expand sales of Logocos’ products internationally, with a focus on W. Europe.
Other large competitors have not reinforced their investments in this segment yet,
giving L’Oréal a head start to gain market share going forward.
Summing up, L’Oréal is the leader in W. Europe’s beauty market. Regardless of
the product category or geography, the French manufacturer always remains in
the top 5 spots as observable in Table 5. With the exception of France, L’Oréal
has either increased or maintained its market share in the mass- and premium
beauty segment. Regardless, due to its already strong positioning and moderate
Graph 17: Disposable Income per Capita by Geography
Source: Euromonitor
34.1%35.0%
47.7%
13.5%
10.8%0.0%
10.0%
20.0%
30.0%
40.0%
50.0%
0
10000
20000
30000
40000
Asia E. Europe Lat.America
N.America
W.Europe
Per Capita € 5y Growth
Table 5: L’Oréal’s Market Share Position by Geography
and Category
Source: Euromonitor
Table 6: Western Europe Market Forecast
Source: Analyst estimates, Euromonitor
Western Europe E2018 F2019 F2020 F2021 F2022 F2023Market size (€ m) 85,109 87,324 89,718 92,319 95,030 97,532growth 1.99% 2.60% 2.74% 2.90% 2.94% 2.63%
L'Oréal (adj.) share 9.69% 9.64% 9.59% 9.59% 9.59% 9.59%difference -0.05% -0.05% -0.05% 0.00% 0.00% 0.00%L'Oréal revenues (€ m) 8,244 8,415 8,601 8,850 9,110 9,350 growth 1.46% 2.07% 2.21% 2.90% 2.94% 2.63%

L’ORÉAL S.A. COMPANY REPORT
PAGE 12/31
growth numbers, we currently do not see a further expansion of market share,
especially due to the difficult situation in the mass segment. Moreover, L’Oréal gets threatened by smaller, trendy brands that might steal market share going
forward. Thus, we conservatively assume L’Oréal to slightly lose ground going
forward (Table 6).
Eastern Europe’s beauty market is still dominated by the mass segment, which
generated €15.4bn out of the overall €22bn in sales in 2017. Compared to its
Western counterpart, countries from E. Europe are significantly less developed
and its inhabitants have a drastically lower disposable income (Graph 17). Therefore, people tend to buy rather cheap, mass market products.
Nevertheless, growth of disposable income per capita has been tremendous over
the last five years, which is also reflected in the overall sales growth of this
beauty market (CAGR 5.45%) and which is projected to remain at similar levels
for the next five years (CAGR 4.92%). Russia is by far the largest market
measured by sales (44%), followed by Poland (18.5%), Ukraine (6.3%) and
Romania (6.2%). The Ukrainian market has doubled since 2012 with a CAGR of
14.7%. This expansion dwarfs the one of the second fastest growing nation, Russia (CAGR 6.6%), but coming from a much smaller base. L’Oréal could
continuously increase its market share in both of these states and, with the
exception of the Ukraine, is the leader in each of the four largest markets in E.
Europe. As alluded to earlier, the mass segment has been predominant in these
areas - hence, cosmetic manufacturers, which have been focussing on the latter
like P&G, Unilever, Henkel and Beiersdorf were L’Oréal’s biggest competitors.
But with growing income, locals are able consume more beauty products which is
beneficial for companies with a broader, more luxurious product portfolio. Since previously mentioned competitors have a rather narrow product portfolio, with a
few large brands, their market share has either stagnated or decreased since
2012 (Table 7). Coty could profit the most from its very extensive brand portfolio,
especially after the acquisition of more than 40 brands from P&G. They are
amplifying their presence all over E. Europe and are closing up to L’Oréal by
offering credible brands at affordable prices. This has caused slight losses in
market share for L’Oréal to Coty in the premium- and mass segment in Poland as depicted in Table 8.
Nevertheless, we expect L’Oréal to continue outperforming the market, due to its
portfolio depth and strong presence in both premium- and mass segment.
Income growth and a strong appetite for beauty products will fuel the Eastern
European market in the future and we predict L’Oréal to further increase its
market share together with Coty (Table 9).
Table 7: Market Share Eastern European Beauty Market
Source: Euromonitor
Source: Euromonitor
Table 8: Market Share of the five largest Polish Cosmetics
Manufacturers
Table 9: Eastern Europe Market Forecast
Source: Analyst estimates, Euromonitor
Eastern Europe E2018 F2019 F2020 F2021 F2022 F2023Market size (€ m) 22,714 23,736 24,759 25,884 26,973 28,093growth 3.19% 4.50% 4.31% 4.55% 4.21% 4.15%
L'Oréal (adj.) share 8.10% 8.25% 8.40% 8.45% 8.45% 8.45%difference 0.15% 0.15% 0.15% 0.05% 0.00% 0.00%L'Oréal revenues (€ m) 1,841 1,959 2,081 2,188 2,280 2,375 growth 5.13% 6.43% 6.20% 5.17% 4.21% 4.15%

L’ORÉAL S.A. COMPANY REPORT
PAGE 13/31
Asia Pacific
The Asia Pacific Division is the crown jewel of L'Oréal’s operations. It is
momentarily “only” the third largest division by sales (€6.15b, 23.64% of total sales), but recent growth rates imply that it is just a matter of time before the
division becomes the largest among all. The region represents 37% of the global
cosmetics market today (€139.1bn) and will continue to fuel L’Oréal’s top-line
growth in the future. The Asia Pacific division experienced accelerated growth
rates over the last seven quarters and with LFL2 growth of 12.3% in 2017 it is
easy to see why it gets a lot of attention. Skin care is by far the biggest segment
and represents 40.7% of all beauty related sales in this Asia, the highest among
all other segments (Graph 18). Moreover, Chinese tourists have a strong appetite for luxury brands and have taken the position as the world’s biggest spender
when it comes to travel as alluded to earlier3. The big influence of Chinese tourist
spending on the beauty industry was underscored in October 2018, when the
announcement of a momentarily cooldown in the former let the shares of the
three largest pure beauty players plummet by at least five per cent respectively.
E-commerce is another distribution channel where Chinese consumers are
leapfrogging the Western consumers. The combination of high smartphone user
penetration growth (Graph 19)4, functionable logistics infrastructure (same-day delivery) and great e-commerce ecosystems (Tmall, Taobao and JD.com) have
made this channel grow immensely during the last couple of years. Besides
China, the three countries Japan, India and South-Korea are mentionable
geographies and together represent 41.76% of the personal beauty market
(77.67% incl. China) in Asia. By 2022, India is expected to overtake the UK and
France to become the 6th largest country in the beauty market. In the Premium
Beauty Segment L'Oréal has positioned itself as the undisputed leader in China and India with 15.2% and 14.4% market share respectively. On the other hand,
L'Oréal faces strong competition In the Indian beauty mass market from Unilever
and domestic companies such as Madrico and Godrej. L'Oréal currently holds
the fourth spot with 4.3% market share. L’Oréal also has a weaker position in
Japan and South-Korea with 2.2% and 6.7% of the overall beauty market. One of
the reasons is that both these two developed countries have long-existing local
players that dominate their home market - Shiseido in Japan (19.7%) and
AmorePacific in South-Korea (32.7%).
Asia Pacific has been the most attractive market for beauty players in recent
years and will continue to be going forward. The overall beauty market in this
region is predicted to grow from €139.1b in 2017 to €197.1b by 2023 (CAGR 2 LFL = Like-for-like growth in sales, which is adjusted for new or divested businesses. 3 As depicted in Graph 11, Chinese tourists spent $261bn in 2016, runners-up are US tourists with $123.6bn. 4 China currently has more than 750m active smartphone users, almost double the number of the second largest country India with 386m.
43.0%48.1% 50.9% 53.3% 56.0%
59.3%63.3%
2013 2014 2015 2016 2017 2018 2019
Graph 19: Smartphone penetration rate China
Source: Statista
Graph 18: Product Segment Sales Split by Geography
Source: Euromonitor
40.7 %19.9 % 20.2 % 12.4 % 12.8 %
15.1 %
13.9 % 13.5 %17.3 % 17.7 %
12.2 %
18.0 % 13.2 %9.0 % 12.2 %
2.7 %
9.0 % 13.1 %17.2 % 16.9 %
29.4 %39.2 % 40.0 % 44.2 % 40.3 %
Asia N. America W. Europe L. America A.&M.E.
Skin Care Hair Care Colour Cosmetics
Fragrances Other
Graph 20: Expected Market Sizes of largest Asian
countries in 2022 (bn €, constant currency), 5y CAGR
0%
2%
4%
6%
8%
10%
12%
14%
0 20 40 60 80
China8.2%
India10.6%
Japan2.5%
SouthKorea2.1%
Indo-nesia8.2%
Source: Euromonitor

L’ORÉAL S.A. COMPANY REPORT
PAGE 14/31
6.5%). China will naturally be the biggest contributor to this region due to its
massive and rather developed economy, but other countries such as India and Indonesia are expected to grow strongly as well. Japan and South-Korea are
lacking the growth characteristics of other mentioned nations where the former is
expected to be overtaken in size by Brazil by 2022 and the latter is only expected
to grow 2.1% annually for the next five years (Graph 20). In the Asian Personal
Beauty Market Unilever and P&G are the two biggest competitors of L'Oréal and
hold the number one and two positions when it comes to market share with 7.4%
and 7.2% respectively. L'Oréal has the advantage of being a pure beauty player and has focused heavily on building brands online with the Asian consumers the
past couple of years.
L'Oréal is the leading player in the massive skin care segment (6.8% market
share) and we feel confident that the company will strengthen its position due to
a solid presence in e-commerce and travel retail, combined with its ability to
quickly adapt to local consumer preferences. Taking newly acquired skincare
brand CeraVe global will also be another reason for forecasted slight increases in
L’Oréal’s market share in this region. Most growth is predicted to come from countries such as China and India, where L’Oréal is one of the top three players
(Table 10) in the skin care segment. (Table 11)
Others - Latin America and Africa & Middle East L'Oréal’s divisions in Latin America and Africa & Middle East have been united into one geographical segment called The Others Division. The Others Division
represented 10.16% of L’Oréal’s sales in 2017 (€2.64bn) and has been the
second weakest division in terms of growth over the last five years with a CAGR
of 3.01%. The overall market size for Beauty Products in this segment was
€84.5bn in 2017 and is estimated to grow to €113.8bn in 2022. One of the main reasons this division has performed relatively poor is due to the rapid shift in oil
prices, which started in the later stage of 2014 and bottomed out in the beginning
of 2016. This change has heavily affected countries such as Brazil, Mexico and
Saudi-Arabia, which - given their size - affected L'Oréal’s sales in these two
regions. Another attribute that these two regions share is the political instability
that influences the economy and consumer spending related to beauty products.
Latin America
The Latin America division enjoyed healthy revenue growth of 6.2% in 2017, the highest reported growth rate during the last five years. Sales in this region
reached €1.95 billions in 2017 due to an uptick in GDP growth rates, but also
minor currency fluctuations (Venezuela excluded) in 2017. This region has given
L'Oréal headaches for the last three years due to volatile currency movements,
22.4 25.12.7 4.77.4 10.15.7
6.76.99.9
54.9 43.5
2012 2017
L'Oréal Coty E. LauderLVMH Puig Other
Graph 21: Largest Premium Beauty Manufacturers Market
Share Latin America
Source: Euromonitor
L'Oréal's Market Position 2017
CHI JAP IND KOR
Premium 1 7 1 3Mass 2 17 4 25Skin Care 1 15 2 3Hair Care 4 19 3 4Colour Cosmetics 1 4 2 4Fragrances 6 14 10 9Overall 2 10 5 4
Table 10: L’Oréal’s Market Share Position by Geography
and Category
Source: Euromonitor
Table 11: Asian Market Forecast
Source: Analyst estimates, Euromonitor
Asia Pacific E2018 F2019 F2020 F2021 F2022 F2023Market size (€ m) 143,848 152,907 162,646 173,844 185,930 197,059growth 3.42% 6.30% 6.37% 6.88% 6.95% 5.99%L'Oréal (adj.) share 4.52% 4.62% 4.67% 4.72% 4.72% 4.72%difference 0.10% 0.10% 0.05% 0.05% 0.00% 0.00%L'Oréal revenues (€ m) 6,506 7,069 7,600 8,211 8,781 9,307 growth 5.76% 8.65% 7.52% 8.03% 6.95% 5.99%

L’ORÉAL S.A. COMPANY REPORT
PAGE 15/31
which have affected its EUR nominated revenue numbers. The LFL growth on
the other hand, has been satisfying ranging from 4.6% to 11.5% since 2012. The overall size of the Personal Beauty Market in this region was €58bn in 2017 and
is expected to be €76bn by 2022. Brazil is the largest country by sales in L.
America with 49% of the overall beauty market. The country has experienced
negative GDP growth rates (-3.55% and -3.47% in 2015 and 2016) due to a
combination of falling oil prices, devaluation of the currency, “stagflation” and the
impeachment of head of state Dilma Rousseff. Sales in Mexico (14.4%) and
Argentina (8.3%), number two and three in terms of market size, experienced double-digit growth and were a positive contributor to the overall sales growth in
this geography for L'Oréal. Even though sales have been affected, the top
players in the Premium Market such as E. Lauder, Puig, LVMH and Coty have,
along with L'Oréal, used this opportunity to gain market share from smaller
players, which is depicted in Graph 21. The Mass Beauty and Personal Care
Market in this region has not seen the same consolidation over the last five
years, where some of the top players have either kept their market share
constant and, in some cases, even lost market share (Graph 22).
Africa & Middle East
Key countries in Africa & Middle East such as South-Africa, Saudi-Arabia and
Iran have all felt the consequences of either the oil bust, political uncertainty or
currency volatility. Hence, LFL growth for L’Oréal of -7.1% in 2017. The Personal
Beauty Market in Africa & Middle East was €26.5bn in 2017 and is expected to
grow by 9.46% (CAGR 5y) over the next five years reaching an overall market
size of €41.6bn. L'Oréal only has a small presence in this region and has, until
recently, delivered strong LFL growth. Sales have gone from €463.4m in 2012 to €692.4m in 2017, a 5y CAGR of 8.36%. This geography only represents 2.66%
of L'Oréal’s total sales in 2017 but is expected to take a larger part of its business
in the future due strong growth in the overall beauty market. E. Lauder has been,
and still is, the market leader of the Premium segment, followed by LVMH and
L'Oréal as the second and third largest players. L'Oréal’s market share has
remained unchanged since 2012, while LVMH and Coty have increased theirs.
One of the reasons L'Oréal has such a weak presence in this area is due to the fact that fragrances play a much larger part than in other geographies. The
segment represents 16.9% of Personal Beauty in A.&M.E. compared to Asia
Pacific (<3%), N. America (<10%) and W. Europe (<15%) where it is much less
prominent. Skin Care represents 12.8% of the market, much lower compared to
other markets such as Asia Pacific (40.7%), N. America (19.9%) and W. Europe
(20.2%). The latter is a segment L’Oréal normally dominates but is currently only
11.9 12.89.9 9.7
5.7 6.65.3 6.58.5 6.4
58.7 58.0
2012 2017
Unilever Natura&Co BCFL'Oréal Avon Other
Graph 22: Largest Mass Beauty Manufacturers Market
Share Latin America
Source: Euromonitor
Table 12: L’Oréal’s Market Share Position by Geography
and Category
Source: Euromonitor

L’ORÉAL S.A. COMPANY REPORT
PAGE 16/31
the third largest player with 6.8% market share, behind Beiersdorf and Unilever
with 13.5% and 12.9% respectively.
The Others division, along with Asia Pacific, is expected to outperform Europe
and N. America in terms of growth due to a number of reasons. Firstly, this
division has a favourable age distribution with almost 41.6% of the population
being in the prime working-age, which ranges from 25 to 54 in Latin America and
the Caribbean. This demographic group is expected to grow by 6.7% by 2023
and will be beneficial for the Beauty Market as the middle- and upper income
classes continue to grow. The Personal Beauty Market in L. America is expected to grow to €80.7bn, which implies a CAGR of 6.3% over the next five years
(Table 13). The strongest contributor here is Brazil, which is expected to become
the third largest country in the world by market size. A more liberal culture in
Middle East will be another driver for beauty sales in this division. Women are
starting to take part in the workforce and Saudi-Arabia recently lifted a ban on
women getting their driver's license (Graph 23). Both factors will support beauty
sales going forward. As of now, Unilever dominates this area with 10.7% market
share, but L'Oréal is gaining traction by overtaking P&G in 2017 to become the second largest player with 6.6% of the market. The two regions in the Other
Division seem to be moving in different directions when it comes to the Premium
Beauty Market. While the Premium Beauty Market in L. America is experiencing
increased consolidation (Graph 21), the Premium Market in A.&M.E. has been
less dominated by the key players. The top three players (L'Oréal, E. Lauder and
Puig) in Latin America control 45.1% of the premium market, while the top three
players (E. Lauder, LVMH and L'Oréal) in A.&M.E. only control 24.4%. Mature
markets tend to be more dominated by top three players (N. America: 49.6%, W. Europe: 38%), thus we expect that L'Oréal will become one of the three players
dominating the A.&M.E. Premium Market. Going forward, we assume that skin
care will play a larger part of the Personal Beauty Market in these two regions.
According to Euromonitor, Fragrance is destined to become the largest segment
by 2022 in these two regions and this could give L’Oréal trouble in terms of
outperforming the overall beauty market growth. Hair care is another segment
that is expected to outperform overall market growth and will according to the same source be the second largest beauty category by size. L’Oréal has a strong
presence in this segment with 18.9% (No. 2 player behind Unilever with 20.9%)
in L. America and 16.4% in Africa & Middle East (No. 1 player).
Overall, we believe that L’Oréal will have trouble to maintain its market share in
these two regions, mainly due to the company’s weak presence in the mass
market, especially in L. America where the mass market represents 91.1% of
overall beauty sales. The company also has a weak presence in fragrances
9.60% 10.40% 10.60%
20.10% 19%16.20%
Iraq Iran Saudi Arabia
1990 2017
Graph 23: Female workforce as % of total workforce
Source: World Bank
Table 13: Others Division Market Forecast
Source: Analyst estimates, Euromonitor
Other Division E2018 F2019 F2020 F2021 F2022 F2023Market size (€ m) 87,308 93,237 99,189 106,091 113,842 120,866growth 3.34% 6.79% 6.38% 6.96% 7.31% 6.17%L'Oréal (adj.) share 3.14% 3.16% 3.16% 3.16% 3.15% 3.15%difference 0.01% 0.02% 0.00% 0.00% 0.00% 0.00%L'Oréal revenues (€ m) 2,745 2,946 3,131 3,347 3,589 3,806 growth 3.80% 7.31% 6.31% 6.90% 7.21% 6.05%
Latin America E2018 F2019 F2020 F2021 F2022 F2023Market size (€ m) 59,490 63,263 66,993 71,416 76,338 80,650growth 2.51% 6.34% 5.89% 6.60% 6.89% 5.65%
L'Oréal (adj.) share 3.41% 3.46% 3.49% 3.51% 3.51% 3.51%difference 0.05% 0.05% 0.03% 0.03% 0.00% 0.00%L'Oréal revenues (€ m) 2,031 2,191 2,337 2,509 2,682 2,834 growth 4.04% 7.90% 6.66% 7.37% 6.89% 5.65%
Middle East & Africa E2018 F2019 F2020 F2021 F2022 F2023Market size (€ m) 27,819 29,974 32,196 34,675 37,504 40,216growth 5.14% 7.75% 7.42% 7.70% 8.16% 7.23%
L'Oréal (adj.) share 2.57% 2.52% 2.47% 2.42% 2.42% 2.42%difference -0.05% -0.05% -0.05% -0.05% 0.00% 0.00%L'Oréal revenues (€ m) 714 754 794 838 906 972 growth 3.13% 5.65% 5.28% 5.52% 8.16% 7.23%

L’ORÉAL S.A. COMPANY REPORT
PAGE 17/31
(2.8% and 2.5% market share in L.A. and A.&M.E.) which is expected to outgrow
the overall market. On the bright side, the hair care segment is also expected to outperform other beauty segments and given the size of this segment and
L’Oréal’s strong presence in it, we believe this will mitigate their market share
losses. Hence, we forecast the company’s market share will decrease over the
next four years and then remain constant afterwards (Table 13).
Valuation
Financial Projection Revenues
As alluded to earlier, L’Oréal is globally active and faces different challenges and
trends in various geographies. Hence, to forecast sales numbers as accurately
as possible we used a top down approach where each region was analysed
separately. By projecting the total market size and L’Oréal’s respective market
share per geography, we could back out its individual revenues. The reasoning
for our projected market shares was established in the previous chapter and leads to total revenues of €33.9bn in 2023. This corresponds to a CAGR of 4.8%
for the next five years (a small increase compared to the past 5y CAGR of 4.6%,
excl. Body Shop), indicating that L’Oréal is able to outperform the global beauty
market (CAGR 4.6%). Geographically, we could see the most distinct
development in the Asian region as it is forecasted to replace N. America as the
second largest market for L’Oréal by 2022. Generally, it is observable that
L’Oréal’s geographical footprint shifts more and more from mature- towards emerging markets. Hence, by 2023 N. America and W. Europe will contribute
less (percentage-wise) to total sales than they did in 2018 (Graph 24).
Foreign Exchange
The global operations of L’Oréal expose the firm’s in EUR reported revenues to
currency fluctuations. Therefore, when translating the foreign currency financial
statements of subsidiaries into EUR, FX movements might distort the
comparability of performances between two financial years. Thus, the French
manufacturer hedges on an annual basis with futures and options based on operating budgets in each of its subsidiaries. Since the Group’s companies have
to borrow and invest their funds in their local currency, the exchange rate risks
generated by managing their own cash and debt are almost non-existent. “Owing
to the Group’s policy of hedging a large part of annual requirements for the
following year before the end of the current year, the sensitivity of profit or loss to
changes in foreign exchange rates at 31 December is marginal.” We assume that
L’Oréal continues to use approximately 1% of its group’s sales in order to hedge
Graph 24: L’Oréal’s Geographical Sales Split
Source: Annual Report, Analyst Forecast
25.1% 27.9% 26.7%
35.5% 30.7% 27.8%
7.8% 6.9% 6.8%
20.6% 24.3% 27.5%
8.7% 7.6% 8.4%2.2% 2.7% 2.9%
2012 2018 2023
North America Western Europe
Eastern Europe AsiaLatin America Middle East & Africa
Table 14: Impact of FX movements on the market
value of hedging instruments
Source: Annual Report

L’ORÉAL S.A. COMPANY REPORT
PAGE 18/31
FX-exposure in the future, as this was the case for the last five years. As more
than 50% of the company’s revenues are either generated in USD (26.4%) or Euro (24.3%) the EUR/USD exchange rate is the one which affects the reported
revenues the most. Table 14 shows a conducted sensitivity analysis of the impact
of a sharp in- or decrease of 10% in EUR and USD against all other Group
currencies at once. As depicted, due to the hedging in place such a currency
movement would not be too dramatic considering the size of the Group’s balance
sheet.
Supply Chain and Cost Analysis
L’Oréal’s supply chain is among the most efficient ones in the cosmetics industry.
The firm has a supply chain that embraces globalization but still tends to regional
customers’ needs. Being present with manufacturing facilities and research
centres in all major beauty markets around the world, L’Oréal can react swiftly to
shifts in demand. Moreover, the company opts for local sourcing of packaging
and raw materials, ensuring greater efficiency for the group, stronger ties with
regional communities and a positive impact on the local development of
economies as well as the firm’s ecosystems. Due to its age, L’Oréal’s presence in many markets is long established with relationships to suppliers and
distribution channels that date back decades. Hence, the company has a
significantly higher number of suppliers than its peers (Table 15), leading to less
potential price pressure. The company’s huge network allows to bring acquired
brands - developed on a local or regional scale - to a global scale in a short
period of time with the same quality. In addition, the French manufacturer
continuously invests in a more efficient and automated supply chain (27% of total
investments in 2017), using new technologies to improve production processes and enhancing flexibility to benefit consumers. L’Oréal is using 3D printing for
several years (other competitors are only starting to use this technology) in order
to create mock-up’s, packaging models or production parts, allowing smaller
batches, lower manufacturing costs and shorter lead times compared to
traditional matching. Thus, innovation and time-to-market happens quicker and
cheaper, which fuels growth strategies. The use of RFID-chips in selected stores
ultimately enhances operational management allowing for more reliable inventories, optimised stock and product protection, which reflects in L’Oréal’s
comparably high inventory turnover (2.83 vs. industry average of 2.62).
Furthermore, due to the company’s various distribution channels the number of
customers (as in supermarket’s, specialist retailers, etc.) is significantly higher
than that of its peers, (Table 16) which makes revenue sources more diversified
and less dependent on big clients. Eventually, L’Oréal’s operational superiority
Table 15: Mentioned leading Suppliers of Pure and Mixed
Beauty Players
Source: Annual Report, Earnings Calls, Bloomberg
Source: Annual Report, Earnings Calls, Bloomberg
Table 16: Mentioned leading Customers of Pure and Mixed
Beauty Players

L’ORÉAL S.A. COMPANY REPORT
PAGE 19/31
3%
6%
8%
11%
13%
16%
18%
21%
23%
2012 2013 2014 2015 2016 2017
L'OréalCotyEstée LauderShiseidoBeiersdorfHenkelUnileverP&GAverage (pure beauty)Average (all)
Graph 25: Adjusted Operating Margins of largest Cosmetics
Manufacturers
Source: Bloomberg
reflects in lower cost and higher margins, which will be further analysed in the
following section.
Operating margin
Even though L’Oréal has faced headwind due to a strong EUR the company has
steadily increased its operating margin (EBIT) over the span of the last five years
(Graph 25). One of the reasons is solid growth in the premium segment where
L’Oréal has a strong presence along with E. Lauder. The premium segment is
significantly less price sensitive than the mass segment, thus resulting in higher
gross margins. Out of L’Oréal’s four divisions, L’Oréal Luxe and Active Cosmetics have been the two outperforming divisions with a 5y CAGR of 8.76% and 6.8%
respectively. The operating margins of these two division are also the highest of
the four with 21.91% and 22.61% for L’Oréal Lux and Active Cosmetics
respectively. The combination of high growth and high margins has also been a
contributor to the margin expansion in the last five years. Another factor has been
the disposal of Body Shop, which experienced a margin compression from 9.0%
in 2012 to 3.7% in 2016 due to a decrease in store traffic and intense
competition. The disposal shows that L’Oréal’s strategy and execution lies within building brands and not retail stores.
L’Oréal and E. Lauder, the two biggest pure beauty companies, have the highest
operating margins with 18.0% and 16.2% respectively. The two companies have
seen an improvement in their operating margins of 151bps and 188bps from
2012 to 2017. Shiseido has improved its operating margin the most (by 416bps)
due to weak performance in 2012 and has an operating margin of 8.0% based on
fiscal year 2017. Coty has struggled with the takeover of P&G Beauty Division,
which reflected in a compression of their operating margin by 300 basis points to 7.3% in fiscal year 2017 (negative if not adjusted). L’Oréal’s improvement during
the last five years has mainly come from a reduction in their COGS ratio and A&P
ratio, by 105bps and 77bps, while their SG&A ratio increased by 46bps over the
same time. R&D ratio had a minimal positive effect due to its reduction of 15
basis points. L’Oréal’s presence in all distribution channels and beauty segments
makes its operating margin less volatile compared to other pure beauty players.
E. Lauder and Shiseido have both enjoyed the stronger growth in the premium beauty segment and have outperformed L’Oréal in terms of sales growth and the
two companies have seen a larger increase in their operating margin during the
last five years. While we do not believe we will see strong margin expansion
going forward, we also do not believe their margin will compress as much as
peers during a worldwide recession.
Costs of Sales/Goods Sold

L’ORÉAL S.A. COMPANY REPORT
PAGE 20/31
L’Oréal’s COGS ratio has gone down by 105bp from 2012 to 2017 (173bp based
on TTM), which implies that L’Oréal has either managed to increase productivity or raise prices without customers leaving them. We believe it is rather the latter,
as sales within the luxury segment are taking a larger part of overall sales with a
higher gross margin attached to it. The company also mentioned in its most
recent earnings call that 80% of the growth comes from value-added products,
which backs up our reasoning. Among the pure beauty players, E. Lauder is the
only peer that can compete with L’Oréal’s margins. One particular note here is
that E. Lauder does not have a presence in the mass market opposed to L’Oréal, which is clearly reflected in their COGS ratio. With a Gross Margin of 80% based
on the last calendar year, the highest among all beauty players, E. Lauder has
managed to position itself as one of the top premium beauty players over the last
decade and is L’Oréal’s fiercest competitor out of the pure beauty companies.
Operating Expenses - A&P, SG&A and R&D
Even though pure beauty players normally have a higher gross margin than
mixed beauty players, it does not necessarily mean that their operating margins
are higher. Premium beauty players have to distribute a larger part of their revenue to A&P as a part of sales. L’Oréal has an A&P ratio of 29.4%, which is
the second highest ratio among the beauty players with Shiseido on top of the list
with 35.7%. The average A&P ratio of the pure beauty players has more or less
remained constant over the last five years. An increase in 2016 was due to a
change in recognition of costs on Shiseido’s part where costs from SG&A where
transferred to A&P. All pure beauty companies have seen a positive development
in their A&P ratios (meaning a lower ratio), except for Shiseido as mentioned
(Graph 26). Digital media plays a larger part of the overall A&P spend (Graph 27) and, in some cases, it has surpassed traditional media. As previously mentioned,
we believe this trend (digital media) will continue and thus we forecast slightly
higher A&P ratios as the shift in distribution channels from offline to online will
result in customer acquisition costs (CAC) being categorized in A&P, rather than
SG&A (Think of retail stores as a form of CAC, which is categorized in SG&A).
We do not believe this shift will dramatically improve operating margins, but
rather that costs will shift category as customer’s shift preferences. Digital media offers a higher ROI than traditional media, which means that beauty players can
get more out from their investments in A&P in terms of sales. It is still uncertain
(for outsiders) exactly what the ROI on digital media is and how much higher it is,
but a comprehensive study published by Nielsen in 2018 (CMO Report 2018)
shows, that companies have a higher confidence in calculating the ROI on digital
media versus traditional media. 74% of the surveyed companies said that they
were confident when it comes to their ability to calculate the ROI on their A&P
10%
15%
20%
25%
30%
35%
40%
45%
2012 2013 2014 2015 2016 2017
L'OréalCotyEstée LauderShiseidoBeiersdorfHenkelUnileverP&GAverage (pure beauty)Average (all)
Graph 26: A&P/Sales Ratios of Main Beauty Players
Source: Bloomberg, Annual Reports
10%13%
16%
25%
32%
38%
2012 2013 2014 2015 2016 2017
Source: Annual Reports L’Oréal
Graph 27: L’Oréal percentage spent on digital media of total
A&P budget

L’ORÉAL S.A. COMPANY REPORT
PAGE 21/31
1%
2%
3%
4%
2012 2013 2014 2015 2016 2017
L'OréalCotyEstée LauderShiseidoBeiersdorfHenkelUnileverP&GAverage (pure beauty)Average (all)
Graph 28: Main Beauty Manufacturers R&D/Sales
Ratios
Source: Bloomberg, Annual Reports
spend, compared 59% regarding traditional media. The same study shows that
82% of the companies believe their digital media budgets will increase the next 12 months versus only 30% for traditional media budgets. This is a strong
indicator that ROI on digital versus traditional media is higher due to reach
(Lower CPM) and personalized ads (higher conversion rate). We believe this will
not change the A&P ratio dramatically, but rather that digital media will overtake
traditional media, and in some cases, it has already happened such as with
Estée, which recently reported that nearly two-third of their ad spending goes to
digital media.
E. Lauder has along with Shiseido the highest SG&A ratios in the beauty industry
with 37.1% and 30.1%, which is an indicator that their operations do not run as
efficient as L’Oréal’s. We have seen a slight increase in SG&A ratios for all pure
beauty players since 2012. These firms are known for their acquisitions in the
beauty industry and recent acquisitions have a larger effect on SG&A than A&P
due to a different business model. Brands that L’Oréal has acquired during the
last five years such as IT Cosmetics (2016), NYX Professional Makeup (2014)
and Urban Decay (2012) have a different business model, which is less dependent on A&P due to its strong presence in social media with a younger
customer base. On the other hand, these newly acquired brands are more
service oriented, which means higher costs related to staff in stores, the stores
itself and leasing costs. All these costs go directly into SG&A, and not the A&P,
thus the increase in SG&A ratios we have seen during the last five years. We do
not believe this trend will continue going forward due to a shift to e-commerce,
which is one of the main drivers in the beauty industry today. Online sales will
become one of the largest distribution channels for L’Oréal in the future and we believe costs related to this will have a larger effect on SG&A costs than A&P
costs, as mentioned earlier.
Of the mentioned cost factors, Research and Development costs (R&D) have the
smallest effect on companies operating margin. R&D also tends to be more of a
company’s own choice, than a requirement in order to keep the business running,
especially in the short-term. Out of the comparable pure beauty companies,
L’Oréal has the highest R&D spending, both in absolute terms and as a percentage of revenue. This builds up under the fact that L’Oréal truly focuses on
the long-term when it comes to innovate quality products; and this reflects why
their R&D ratio is twice as high compared to other beauty players (Graph 28). As
a result of this, 15-20% of L’Oréal’s products in 2017 were new products entering
the market. L’Oréal has research hubs in both today’s and the future’s largest
markets (United States, Japan, China, Brazil and India), which shows that the
company can swiftly adapt to local beauty trends and can scale up production,

L’ORÉAL S.A. COMPANY REPORT
PAGE 22/31
Graph 29: PP&E/Sales Ratio of largest Pure Beauty Players
Source: Annual Report, Earnings Calls, Bloomberg
10.0%
13.5%
17.0%
20.5%
2012 2013 2014 2015 2016 2017
L'Oreal Coty Inc Estee LauderShiseido Co Ltd Average
90
115
140
165
190
215
2013 2014 2015 2016 2017
L'Oreal Coty Inc Estee Lauder
Shiseido Co Ltd Average
Graph 30: DIO of largest Pure Beauty Players
Source: Annual Report, Earnings Calls, Bloomberg
when needed. An example of this is L’Oréal’s adaption to smaller packaging in
India, where consumers buy more sachet-size (smaller sized) beauty products compared to other parts of the world. Research and innovation are one of the
seven success criteria L’Oréal outlines for merit in the future. We expect this ratio
to remain rather stable due to the consistency of the metric since 2012, which
has remained in the range of 3.25-3.75%.
CAPEX & Working Capital
Historically, L’Oréal’s capital expenditures (CAPEX) attributed to PP&E, Goodwill
and other Intangible Assets have been very volatile. This is mainly due pursued acquisitions, which varied in size over the years. Due to the company’s strategy,
multiple acquisitions take place every year, which reflects in an increasing
Goodwill position. Most recent examples of L’Oréal’s purchasing spree include
CervaVe in 2017 ($1.3bn), IT Cosmetics in 2016 ($1.2bn), Niely Cosmetics in
2015 ($130m) and Magic Holdings plus NYX Cosmetics in 2015 for a combined
$1.3bn. We expect the firm to continue its purchasing behaviour of the past, and
model Goodwill to be a fixed percentage of sales as this has been the case over
the last five years. L’Oréal’s PP&E/Sales ratio converged to the pure beauty industry average, indicating that the French manufacturer uses its equipment as
efficiently as its peers to generate sales (Graph 29). With the disposal of The
Body Shop and the announcement of modernizing plants rather than building
new ones, we expect the PP&E ratio to decrease until 2021. After that, we expect
this ratio to gradually increase back to its past 5y average, due to potential new
demand in emerging markets or other unforeseen developments that might
increase spending. Other Intangible Assets such as Patents, Software and
Brands with indefinite useful life dropped significantly in 2017 by 600m, which was largely due to the disposal of The Body Shop and we forecast this position to
stay in a rather constant proportion with sales going forward.
L’Oréal’s Working Capital has been fluctuating, but always slightly above zero for
the past five years. The company currently has an above industry average
collecting time for receivables which is due to frequent acquisitions and the
inherent streamlining process. Going forward, this time frame is expected to
decrease as D2C and e-commerce are playing a larger part of the company’s business. Thus, we assume accounts receivables will not increase proportionally
with revenues, since retail consumers do not get the same treatment as larger
players and are expected to pay quicker, meaning less receivables outstanding.
The same is assumed for inventories days outstanding. As observable in Graph
30, the industry average time of DIO has been decreasing recently, with L’Oréal
and Coty being a lot more efficient than E. Lauder and Shiseido. This big
discrepancy might be due to the fact that pure premium brands do not tend to

L’ORÉAL S.A. COMPANY REPORT
PAGE 23/31
160
210
260
310
360
2013 2014 2015 2016 2017
L'Oreal Coty Inc Estee LauderShiseido Co Ltd Average
Graph 31: DPO of largest Pure Beauty Players
Source: Annual Report, Earnings Calls, Bloomberg
manage their inventory levels with discounts or other drastic sales initiatives in
order to keep their premium image. Regardless, with e-commerce capturing a larger part of sales, we assume lower inventory-levels as this distribution channel
is less inventory-heavy compared to retail- and department stores. The industry
is still in the early days of e-commerce, but from 2020 onwards we assume DIO
to improve (going down) as operations become more efficient. Days payable
outstanding is with 205 currently a lot lower than the pure beauty industry
average of 276 (Graph 31). Other pure beauty manufacturers take a lot more
time to pay back their suppliers, which for instance in Coty’s case might indicate that they have liquidity issues or simply that L’Oréal receives discounts for paying
earlier. Since L’Oréal has the largest supplier base among peers, we think that
there is still a lot of room for potential to delay payments and conserve cash. As
depicted, over the last five years, L’Oréal gradually increased its DPO from 179
to 205 and we expect this trend to continue until 2020. Overall, we forecast a
gradual decrease in working capital, which - triggered by e-commerce and a
more efficient cash conversion cycle - is forecasted to be slightly negative by
2019.
Discounted Cash Flow Analysis Cost of capital
In order to quantify L’Oréal’s weighted average cost of capital, multiple input
factors had to be determined, adjusted and, ultimately, used (Table 16). As a
proxy for the risk-free rate we used the 10y German Bunds. The MSCI World
functions as our benchmark in order to compute the Beta of L’Oréal. We used weekly returns over a three-year period in order to get a true sense of the
company’s Beta. Aiming to get a greater understanding of L’Oréal’s volatility
against the market, we looked into how the company’s Beta behaved during the
financial crisis in 2008/09. During this period, L’Oréal’s Beta reached a value of
0.45 (14/11/2008), the lowest observation in our dataset since 2005, which could
be an indicator on how the share price moves against the market during a
recession in the future. A 95% Confidence Interval was implemented in order to bring assurance to the calculated Beta. This resulted into an upper- and lower
bound for cost of equity, thus an upper- and lower bound for the WACC, used in
the following sensitivity analysis (Table 18). L’Oréal’s revenues are spread
across the world – hence, instead of using a Market Risk Premium (MRP) of a
single country we calculated the MRP by computing a weighted average of the
major countries L’Oréal sells their products in, such as China, US, France, Brazil
and others5. Due to L’Oréal’s capital structure, we assumed a target D/E ratio of -
0.01, as the company has historically held a net cash position (last five years)
5 We used Aswath Damodaran’s world wide database, a reliable source when it comes to market risk premiums for countries.
Table 17: Input Factors Weighted Average Cost of
Capital
Source: Annual Report, Bloomberg, Damodaran
TaxTax (2018 onward)
D/E currentD/E target
D/VE/V
Risk-free rateCost of net debt/(cash)Market Risk Premium
Cost of equityCompany BetaUpper boundLower bound
WACCUpper boundLower bound
0.31%
-0.31%100.31%
28%23%
-0.003-0.010
0.910.55
5.41%6.65%4.17%
1.99%
5.40%6.97%
0.73

L’ORÉAL S.A. COMPANY REPORT
PAGE 24/31
and does not guide on future capital structure. Since L’Oréal does not have any
long-term bonds outstanding and most of its debt is short-term, we assumed book values are equal to market values. As a result of this net cash positions we
needed to look at opportunity cost of cash rather than cost of debt. We assumed
the risk-free rate as the company’s opportunity cost of cash. The combination of
lack of comparable peers with a similar capital structure, predictability in cash
flows, credit ratings and geographical presence backed up our conclusion to
assume the risk-free debt as our opportunity cost of net cash. We assumed a tax
rate of 23.24%, which is adjusted for the recent change in corporate tax rate in the US, but also for the future change in France’s corporate tax rate by 2022. By
using the CAPM we calculated L’Oréal’s cost of equity to be 5.4% and ultimately,
we arrived at a WACC of 5.41%.
In order to value L’Oréal, a Discounted Cash Flow Analysis has been conducted.
We forecasted the company’s future performance up to the point where its value
creation stabilized, i.e. the ROIC and growth of unlevered free cash flows stayed
rather constant between years three and five and were assumed to remain so
perpetually (see Appendix). Thus, we used a five-year forecast horizon for all the necessary input factors and, implicitly, our free cash flows which were
subsequently used to estimate the company’s Enterprise Value. By discounting
the future cash flows of the core business and the terminal value with the prior
computed WACC of 5.41%, we assigned L’Oréal an Enterprise Value of
€121.8bn. Approximately 89% of the EV can be allocated to the terminal value,
indicating that a high weight of the company’s worth resides in the long-term
future. By implementing a sensitivity analysis (Table 18), we could model how
L’Oréal’s share price alters depending on different WACC and terminal growth assumptions. We chose 3% as a terminal growth rate due the stability in both,
free cash flow growth and ROIC and our belief that the company will maintain this
growth rate in the future. Subtracting the company’s net debt position and adding
its non-core assets to the Enterprise Value leads to an Equity Value of €132.8bn.
With forecasted 558.8m shares outstanding in 2019, the corresponding share
price is €237.62. Based on our estimations for 2019 we expect L’Oréal to pay out
a dividend of €3.38 per share resulting in a forward dividend yield of 1.69%. We estimate no change in outstanding shares until the dividend payment of 2019 as
the buybacks decided at the 2018 Annual Shareholder Meeting have already
been executed as of first-half of 2018.
Scenario Analysis
Like noted earlier, the global market for cosmetics is currently the most dynamic
in emerging markets, where growth rates often exceed the ones from developed
ones by a landslide (Table 19). The forecasted growth rates for emerging
Table 19: Past and forecasted Market growth per geography
Source: Euromonitor, Analyst estimates
238 2.8% 2.9% 3.0% 3.1% 3.2%4.2% 405.70 434.92 469.15 509.77 558.765.3% 230.28 238.42 247.26 256.90 267.465.4% 222.21 229.70 237.81 246.63 256.245.5% 214.73 221.65 229.12 237.21 246.006.7% 156.92 160.20 163.66 167.32 171.19
LT Growth Rate
WAC
C
Table 18: Sensitivity Analysis of Share Price
Source: Analyst estimates

L’ORÉAL S.A. COMPANY REPORT
PAGE 25/31
markets in the base case of our valuation are more than twice as high as the
ones from developed markets, which leads to a substantial shift in L’Oréal’s geographical revenue split and top-line growth. Since emerging markets can be
very volatile due to factors like political instability, currency fluctuations,
dependency on commodities and many more, we conducted a scenario analysis,
accounting for various cases of growth deviating from our base case. In the bear
cases we subtracted a defined percentage from each year’s base case growth
number. We distinguished between four scenarios. Forecasted emerging markets
growth slowing down by 2% and 4%, developed markets growth slowing down by 2% and the regular base case. As depicted in Table 20, we can see that a
slowdown in emerging markets by 2% effects the share price a little less than a
similar slowdown in developed markets, due to the fact that revenues from latter
markets still have a higher share of the company’s total revenues. We attributed
each scenario and the corresponding share price a weight, where the bear cases
in emerging markets combined were attributed a higher likelihood than the one in
developed markets. This is because we think emerging markets are rather
slowing down, than accelerating even further and developed market growth was rather stable in the past. The weighted average of the resulting share prices
gives us a final share price of 235.83€.
After conducting L’Oréal’s valuation, we shortly want to examine the company’s
value creation metrics. In 2017, L’Oréal’s ROIC (21.37%) is almost four times
larger than its WACC of 5.41%. For the whole scrutinized time frame the firms
ROIC exceeds its WACC by at least 13% as plotted in Graph 32. Therefore, the
French cosmetics manufacturer creates shareholder value by generating future
cash flows at rates of return exceeding its cost of capital at all times. The forecasted ROIC is also above the current industry average of 11.9%.
-4.00%
3.00%
10.00%
17.00%
24.00%
2014 2015 2016 2017
L'Oréal Estée Lauder CotyShiseido Average
Graph 32: ROIC of pure beauty players
Source: Bloomberg, Analyst estimation
Scenario Share Price Weight Weighted Share Price
DCF Base Case 237.62€ 75% 178.22€ -2% Em. Markets 231.77€ 15% 34.77€ -4% Em. Markets 226.57€ 5% 11.33€ -2% Dvlpd. Markets 230.39€ 5% 11.52€
Share Price 235.83€
Table 20: Scenario Analysis of Share Price in Bear Cases
Source: Analyst estimates

L’ORÉAL S.A. COMPANY REPORT
PAGE 26/31
Appendix
Financial Statements
€ millions 2017A E2018 F2019 F2020 F2021 F2022 F2023Revenues 26,023 26,829 28,267 29,682 31,088 32,497 33,862
- Cost of Sales 7,359 7,587 7,966 8,335 8,699 9,060 9,407 in % of revenue 28.3% 28.3% 28.2% 28.1% 28.0% 27.9% 27.8%
Gross Profit 18,664 19,242 20,301 21,347 22,390 23,437 24,455
- Advertisment & Promotions 7,651 7,888 8,339 8,786 9,233 9,684 10,125 in % of revenue 29.4% 29.4% 29.5% 29.6% 29.7% 29.8% 29.9%
- Selling General & Administrative 5,461 5,630 5,903 6,169 6,430 6,689 6,936 in % of revenue 21.0% 21.0% 20.9% 20.8% 20.7% 20.6% 20.5%
- Research & Development 877 940 991 1,040 1,090 1,139 1,187 in % of revenue 3.4% 3.5% 3.5% 3.5% 3.5% 3.5% 3.5%
+ Other Operating Income (Expense) (280.30) (330) (348) (365) (382) (400) (416) in % of revenue -1.1% -1.2% -1.2% -1.2% -1.2% -1.2% -1.2%
EBIT (core operating income before tax) 4,395 4,454 4,721 4,987 5,255 5,525 5,791
in % of revenue 16.9% 16.6% 16.7% 16.8% 16.9% 17.0% 17.1%
- Operating Taxes 875 1,299 1,380 1,463 1,544 1,626 1,706in % of EBIT 19.9% 29.2% 29.2% 29.3% 29.4% 29.4% 29.5%
NOPLAT 3,520 3,155 3,341 3,525 3,711 3,900 4,085
+ Non-Core income (Expense) 152 358 366 375 383 392 401 in % of revenue 0.6%
- Non-Core Taxes 43 85 87 87 89 91 93in % of reported tax 19.9%
+ Other Comprehensive Income (Non-Core) (1,525) 157 165 174 182 190 198 in % of revenue -5.9%
+ Financial Cost -62 (65) (69) (72) (75) (79) (82) in % of gross debt -5.2%
- Tax Shield -18 -16 -16 -17 -18 -18 -19in % of revenue -0.07%
+ Other Comprehensive Income (Financial) 369 254.70 268.35 281.78 295.14 308.51 321.47 in % of revenue 1.4%
Comprehensive Income 2,428.10 3,789.71 4,001.44 4,212.35 4,424.39 4,638.83 4,849.70
€ millions 2017 E2018 F2019 F2020 F2021 F2022 F2023Statuatory Rate 29% 24% 24% 23% 23% 23% 23%Reported Taxes 901 1,369 1,451 1,533 1,615 1,698 1,780 in % of EBIT 20.5%
Tax Shield -18 -16 -16 -17 -18 -18 -19Non Core Taxes 43 85 87 87 89 91 93Operating Taxes 875 1,299 1,380 1,463 1,544 1,626 1,706Operational Result before Taxes 4,395 4,454 4,721 4,987 5,255 5,525 5,791Tax rate on operations / effective tax 19.9% 29.2% 29.2% 29.3% 29.4% 29.4% 29.5%
FORECASTTAXE OVERVIEW
FORECASTREFORMULATED INCOME STATEMENT / ACTUALS
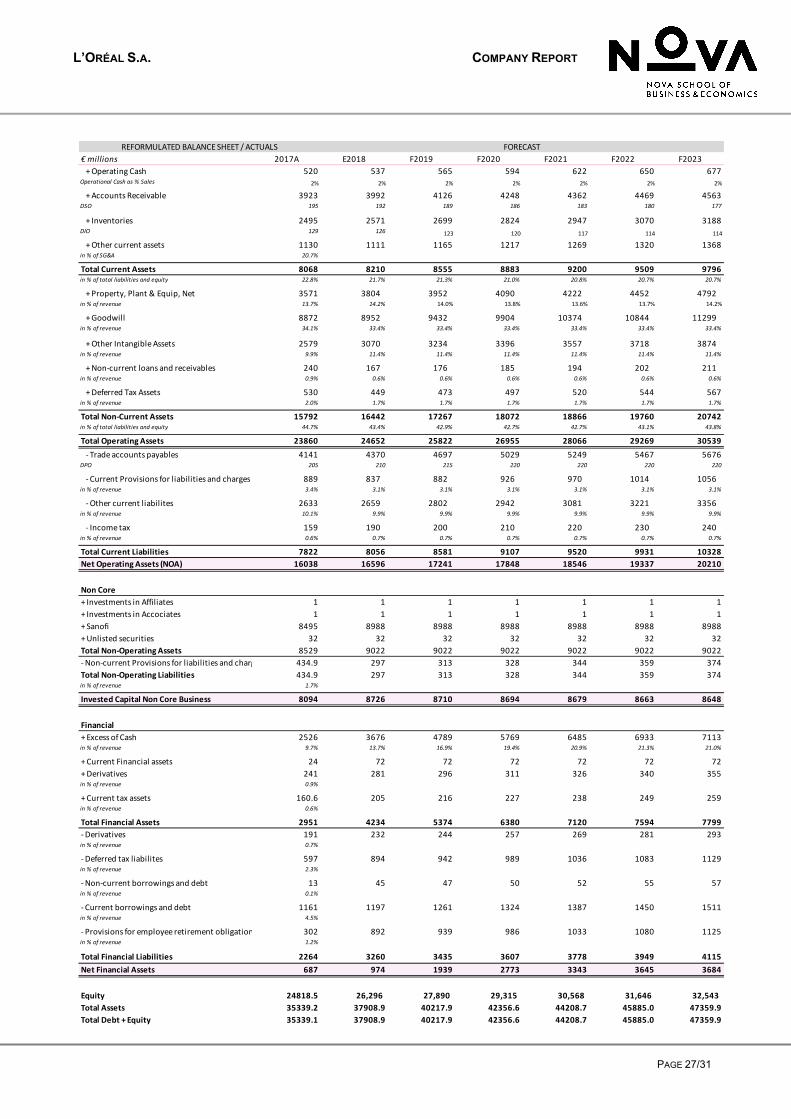
L’ORÉAL S.A. COMPANY REPORT
PAGE 27/31
€ millions 2017A E2018 F2019 F2020 F2021 F2022 F2023
+ Operating Cash 520 537 565 594 622 650 677Operational Cash as % Sales 2% 2% 2% 2% 2% 2% 2%
+ Accounts Receivable 3923 3992 4126 4248 4362 4469 4563DSO 195 192 189 186 183 180 177
+ Inventories 2495 2571 2699 2824 2947 3070 3188DIO 129 126 123 120 117 114 114
+ Other current assets 1130 1111 1165 1217 1269 1320 1368in % of SG&A 20.7%
Total Current Assets 8068 8210 8555 8883 9200 9509 9796in % of total liabilities and equity 22.8% 21.7% 21.3% 21.0% 20.8% 20.7% 20.7%
+ Property, Plant & Equip, Net 3571 3804 3952 4090 4222 4452 4792in % of revenue 13.7% 14.2% 14.0% 13.8% 13.6% 13.7% 14.2%
+ Goodwill 8872 8952 9432 9904 10374 10844 11299in % of revenue 34.1% 33.4% 33.4% 33.4% 33.4% 33.4% 33.4%
+ Other Intangible Assets 2579 3070 3234 3396 3557 3718 3874in % of revenue 9.9% 11.4% 11.4% 11.4% 11.4% 11.4% 11.4%
+ Non-current loans and receivables 240 167 176 185 194 202 211in % of revenue 0.9% 0.6% 0.6% 0.6% 0.6% 0.6% 0.6%
+ Deferred Tax Assets 530 449 473 497 520 544 567in % of revenue 2.0% 1.7% 1.7% 1.7% 1.7% 1.7% 1.7%
Total Non-Current Assets 15792 16442 17267 18072 18866 19760 20742in % of total liabilities and equity 44.7% 43.4% 42.9% 42.7% 42.7% 43.1% 43.8%
Total Operating Assets 23860 24652 25822 26955 28066 29269 30539- Trade accounts payables 4141 4370 4697 5029 5249 5467 5676
DPO 205 210 215 220 220 220 220
- Current Provisions for liabilities and charges 889 837 882 926 970 1014 1056in % of revenue 3.4% 3.1% 3.1% 3.1% 3.1% 3.1% 3.1%
- Other current liabilites 2633 2659 2802 2942 3081 3221 3356in % of revenue 10.1% 9.9% 9.9% 9.9% 9.9% 9.9% 9.9%
- Income tax 159 190 200 210 220 230 240in % of revenue 0.6% 0.7% 0.7% 0.7% 0.7% 0.7% 0.7%
Total Current Liabilities 7822 8056 8581 9107 9520 9931 10328Net Operating Assets (NOA) 16038 16596 17241 17848 18546 19337 20210
Non Core+ Investments in Affiliates 1 1 1 1 1 1 1
+ Investments in Accociates 1 1 1 1 1 1 1
+ Sanofi 8495 8988 8988 8988 8988 8988 8988
+ Unlisted securities 32 32 32 32 32 32 32
Total Non-Operating Assets 8529 9022 9022 9022 9022 9022 9022
- Non-current Provisions for liabilities and charges 434.9 297 313 328 344 359 374
Total Non-Operating Liabilities 434.9 297 313 328 344 359 374in % of revenue 1.7%
Invested Capital Non Core Business 8094 8726 8710 8694 8679 8663 8648
Financial+ Excess of Cash 2526 3676 4789 5769 6485 6933 7113in % of revenue 9.7% 13.7% 16.9% 19.4% 20.9% 21.3% 21.0%
+ Current Financial assets 24 72 72 72 72 72 72
+ Derivatives 241 281 296 311 326 340 355in % of revenue 0.9%
+ Current tax assets 160.6 205 216 227 238 249 259in % of revenue 0.6%
Total Financial Assets 2951 4234 5374 6380 7120 7594 7799- Derivatives 191 232 244 257 269 281 293in % of revenue 0.7%
- Deferred tax liabilites 597 894 942 989 1036 1083 1129in % of revenue 2.3%
- Non-current borrowings and debt 13 45 47 50 52 55 57in % of revenue 0.1%
- Current borrowings and debt 1161 1197 1261 1324 1387 1450 1511in % of revenue 4.5%
- Provisions for employee retirement obligations and related benefits302 892 939 986 1033 1080 1125in % of revenue 1.2%
Total Financial Liabilities 2264 3260 3435 3607 3778 3949 4115Net Financial Assets 687 974 1939 2773 3343 3645 3684
Equity 24818.5 26,296 27,890 29,315 30,568 31,646 32,543 Total Assets 35339.2 37908.9 40217.9 42356.6 44208.7 45885.0 47359.9Total Debt + Equity 35339.1 37908.9 40217.9 42356.6 44208.7 45885.0 47359.9
REFORMULATED BALANCE SHEET / ACTUALS FORECAST

L’ORÉAL S.A. COMPANY REPORT
PAGE 28/31
€ millions 2017A E2018 F2019 F2020 F2021 F2022 F2023Initial Balance 24,504 24,818.60 26,296.21 27,890.05 29,315.02 30,567.80 31,645.64
Net Transactions with Shareholders -2,114 -2,312 -2,408 -2,787 -3,172 -3,561 -3,953
+ Capital increase 118.3 85 85 85 85 85 85
+ Cancellation of Treasury stock 0.0 0 0 0 0 0 0+ Dividends paid (not paid on Treasury stock) -1,861 -2,034 -1,888 -2,025 -2,168 -2,315 -2,464
Payout Ratio 51.9% 60.2% 52.9% 53.9% 54.9% 55.9% 56.9%
+ Share-based payment 128.8 137 145 153 160 168 176Absolute incremental increase 8.40
+ Net changes in Treasury stock -499.2 -500 -750 -1,000 -1,250 -1,500 -1,750+ Purchase commitments for non-controlling interests
0.0 0 0 0 0 0 0
+ Changes in scope of consolidation -1.3 0 0 0 0 0 0
+ Other movements 0.3 0 0 0 0 0 0
Comprehensive Income 2,429 3,789.7 4,001 4,212 4,424 4,639 4,850
Final Balance 24,819 26,296.2 27,890 29,315 30,568 31,646 32,543
Financial Result 325 205 216 227 237 248 258Net Financial Assets 687 974 1,939 2,773 3,343 3,645 3,684
Investment in Net Financial Assets -2,046 -287 -965 -834 -570 -302 -39
Net Cash Transactions with Shareholders -2,114 -2,312 -2,408 -2,787 -3,172 -3,561 -3,953
Financing Cash Flow -3,836 -2,394 -3,157 -3,394 -3,504 -3,615 -3,733
REFORMULATED CHANGES IN EQUITY FORECAST
€ millions 2017A E2018 F2019 F2020 F2021 F2022 F2023
NOPLAT 3,520 3,155 3,341 3,525 3,711 3,900 4,085
ROIC 21.37% 19.98% 20.32% 20.41% 20.54% 20.67% 20.67%
Depreciation 1,219 1,187 1,233 1,277 1,318 1,390 1,496
in % of PPE 34.1%
Operational Cash Flow 4,738 4,342 4,574 4,801 5,029 5,289 5,581
Invested Capital - Fixed Assets 15,792 16,442 17,267 18,072 18,866 19,760 20,742
Gross CAPEX Investment 682 -651 -825 -805 -794 -894 -982
Net CAPEX -536 -1,838 -2,058 -2,081 -2,112 -2,284 -2,478
Invested Capital - NWC and Others 246 154 -26 -224 -319 -422 -532
delta NWC and Others 366 92 180 198 96 103 109
FCF Core Business / (Unlevered) 4,568 2,596 2,696 2,918 3,013 3,109 3,212
Growth 242.0% -43.2% 3.9% 8.2% 3.3% 3.2% 3.3%
Non-Core CF
Non-Operational Cash Flow -1,417 430 444 461 476 491 506
Invested Capital 8,094 8,726 8,710 8,694 8,679 8,663 8,648
Investment Cash Flow 684 -632 16 16 16 16 15
Free Cash Flow Non Core Business -733 -202 460 477 492 507 521
FREE CASH FLOW 3,835.1 2,394 3,157 3,394 3,504 3,615 3,733

L’ORÉAL S.A. COMPANY REPORT
PAGE 29/31
Disclosures and Disclaimers
Report Recommendations
Buy Expected total return (including expected capital gains and expected dividend yield)
of more than 10% over a 12-month period.
Hold Expected total return (including expected capital gains and expected dividend yield)
between 0% and 10% over a 12-month period.
Sell Expected negative total return (including expected capital gains and expected
dividend yield) over a 12-month period.
This report was prepared by [insert student’s name], a Master in Finance student of Nova School of Business
and Economics (“Nova SBE”), within the context of the Field Lab – Equity Research.
This report is issued and published exclusively for academic purposes, namely for academic evaluation and
master graduation purposes, within the context of said Field Lab – Equity Research. It is not to be construed
as an offer or a solicitation of an offer to buy or sell any security or financial instrument.
This report was supervised by a Nova SBE faculty member, acting merely in an academic capacity, who revised the valuation methodology and the financial model.
Given the exclusive academic purpose of the reports produced by Nova SBE students, it is Nova SBE
understanding that Nova SBE, the author, the present report and its publishing, are excluded from the
persons and activities requiring previous registration from local regulatory authorities. As such, Nova SBE, its
faculty and the author of this report have not sought or obtained registration with or certification as financial
analyst by any local regulator, in any jurisdiction. In Portugal, neither the author of this report nor his/her
academic supervisor is registered with or qualified under COMISSÃO DO MERCADO DE VALORES MOBILIÁRIOS
(“CMVM”, the Portuguese Securities Market Authority) as a financial analyst. No approval for publication or distribution of this report was required and/or obtained from any local authority, given the exclusive academic
nature of the report.
The additional disclaimers also apply:
USA: Pursuant to Section 202 (a) (11) of the Investment Advisers Act of 1940, neither Nova SBE nor the
author of this report are to be qualified as an investment adviser and, thus, registration with the Securities and
Exchange Commission (“SEC”, United States of America’s securities market authority) is not necessary.
Neither the author nor Nova SBE receive any compensation of any kind for the preparation of the reports.

L’ORÉAL S.A. COMPANY REPORT
PAGE 30/31
Germany: Pursuant to §34c of the WpHG (Wertpapierhandelsgesetz, i.e., the German Securities Trading Act), this entity is not required to register with or otherwise notify the Bundesanstalt für
Finanzdienstleistungsaufsicht (“BaFin”, the German Federal Financial Supervisory Authority). It should be
noted that Nova SBE is a fully-owned state university and there is no relation between the student’s equity
reports and any fund raising programme.
UK: Pursuant to section 22 of the Financial Services and Markets Act 2000 (the “FSMA”), for an activity to be
a regulated activity, it must be carried on “by way of business”. All regulated activities are subject to prior
authorization by the Financial Conduct Authority (“FCA”). However, this report serves an exclusively academic purpose and, as such, was not prepared by way of business. The author - a Master’s student - is
the sole and exclusive responsible for the information, estimates and forecasts contained herein, and for
the opinions expressed, which exclusively reflect his/her own judgment at the date of the report. Nova SBE
and its faculty have no single and formal position in relation to the most appropriate valuation method,
estimates or projections used in the report and may not be held liable by the author’s choice of the latter.
The information contained in this report was compiled by students from public sources believed to be reliable,
but Nova SBE, its faculty, or the students make no representation that it is accurate or complete, and accept
no liability whatsoever for any direct or indirect loss resulting from the use of this report or of its content.
Students are free to choose the target companies of the reports. Therefore, Nova SBE may start covering
and/or suspend the coverage of any listed company, at any time, without prior notice. The students or Nova
SBE are not responsible for updating this report, and the opinions and recommendations expressed herein
may change without further notice.
The target company or security of this report may be simultaneously covered by more than one student.
Because each student is free to choose the valuation method, and make his/her own assumptions and
estimates, the resulting projections, price target and recommendations may differ widely, even when referring
to the same security. Moreover, changing market conditions and/or changing subjective opinions may lead to significantly different valuation results. Other students’ opinions, estimates and recommendations, as well as
the advisor and other faculty members’ opinions may be inconsistent with the views expressed in this report.
Any recipient of this report should understand that statements regarding future prospects and performance
are, by nature, subjective, and may be fallible.
This report does not necessarily mention and/or analyze all possible risks arising from the investment in the
target company and/or security, namely the possible exchange rate risk resulting from the security being
denominated in a currency either than the investor’s currency, among many other risks.
The purpose of publishing this report is merely academic and it is not intended for distribution among private
investors. The information and opinions expressed in this report are not intended to be available to any
person other than Portuguese natural or legal persons or persons domiciled in Portugal. While preparing this
report, students did not have in consideration the specific investment objectives, financial situation or

L’ORÉAL S.A. COMPANY REPORT
PAGE 31/31
particular needs of any specific person. Investors should seek financial advice regarding the appropriateness
of investing in any security, namely in the security covered by this report.
The author hereby certifies that the views expressed in this report accurately reflect his/her personal opinion
about the target company and its securities. He/ She has not received or been promised any direct or indirect
compensation for expressing the opinions or recommendation included in this report.
[If applicable, it shall be added: “While preparing the report, the author may have performed an internship
(remunerated or not) in [insert the Company’s name]. This Company may have or have had an interest in the
covered company or security” and/ or “A draft of the reports have been shown to the covered company’s
officials (Investors Relations Officer or other), mainly for the purpose of correcting inaccuracies, and later
modified, prior to its publication.”]
The content of each report has been shown or made public to restricted parties prior to its publication in Nova
SBE’s website or in Bloomberg Professional, for academic purposes such as its distribution among faculty
members for students’ academic evaluation.
Nova SBE is a state-owned university, mainly financed by state subsidies, students tuition fees and
companies, through donations, or indirectly by hiring educational programs, among other possibilities. Thus,
Nova SBE may have received compensation from the target company during the last 12 months, related to its
fundraising programs, or indirectly through the sale of educational, consulting or research services. Nevertheless, no compensation eventually received by Nova SBE is in any way related to or dependent on
the opinions expressed in this report. The Nova School of Business and Economics does not deal for or
otherwise offer any investment or intermediation services to market counterparties, private or intermediate
customers.
This report may not be reproduced, distributed or published, in whole or in part, without the explicit previous
consent of its author, unless when used by Nova SBE for academic purposes only. At any time, Nova SBE
may decide to suspend this report reproduction or distribution without further notice. Neither this document
nor any copy of it may be taken, transmitted or distributed, directly or indirectly, in any country either than Portugal or to any resident outside this country. The dissemination of this document other than in Portugal or
to Portuguese citizens is therefore prohibited and unlawful.
Individual Report - Magnus Lauvli Andersen – 29959
Introduction
In this individual report I am going to make a further analysis of one of the most critical factors
for the valuation of L’Oréal in our equity research report, more precisely, the beta of the
company. As L’Oréal’s capital structure consists to a vast extend of equity, the beta, along with
the market risk premium, are among most the important inputs for our valuation as cost of
equity is almost equal to the WACC. I will make a deeper analysis of the different factors that
are needed to be estimated or calculated in order to arrive at a beta that is representable for the
chosen company. Throughout this report I will also question the methodology my partner and
I used when arriving to the company’s beta.
Deeper analysis of the components of the beta
First off, I am going to start with the estimation of the beta of L’Oréal. Beta measures the
systematic risk of a security against the market, or in this case a broad index. In the equity
research report we chose to run a regression of weekly returns over a three-year period against
the MSCI World Index. There are several critical assumptions we had to make in order to use
this framework to arrive at the beta. Firstly, we are implicitly assuming that the beta reflects the
company’s business over the time frame of the regression and that the business has remained
unchanged. In our case I believe it is safe to assume that L’Oréal’s business has not changed
significantly over the last three years, but in other cases it could have. Coty, one of the pure
beauty competitors of L’Oréal, is a great example of this, as the company acquired a part of
Procter & Gamble’s assets, thus changing the business mix of the company, both in terms of
size and geographical presence. Another assumption that was made was that the beta mirrors
the company’s average financial leverage, but not necessarily the current leverage of the
company today. This could have been another misstep. At last, one gets different betas when
changing benchmarks and time periods. In cases one could chose large companies that
potentially could dominate the local benchmark, thus it is important to choose a broad
benchmark where the company of your choice has a minor effect on the index. The frequency

Individual Report - Magnus Lauvli Andersen – 29959
of data is another factor that needs to be decided on when estimating the company’s beta. Higher
frequencies, given a constant time frame will provide you with more data, but it could also
attract unnecessary noise as daily price movements have a tendency to overreact. The liquidity
of the stock can also affect the beta as stock prices could fluctuate greatly during an illiquid
trading environment. In L’Oréal’s case this is not a problem due to the size of the company and
its trading volume.
An alternative solution in order to estimate the beta of a company
Rather than estimating the beta by running a regression, I looked at the three different factors
that could make a better estimation of the beta of a company; the cyclicality of the company’s
business, the operating leverage of the company and the financial leverage the company has.
The general rule is that the higher the cyclicality of a company’s business, the higher the beta
of the company, ceteris paribus. L’Oréal is the worldwide leader in the beauty industry, an
industry that has historically performed well during economics recessions such as the one in
2008-2009. Beauty products have become an important necessity due to secular trends such as
urbanization and a growing middle class. As L’Oréal becomes a larger player within the
premium beauty segment, this could affect the cyclicality of the business as this segment tends
to be more cyclical than the mass market segment, thus L’Oréal’s beta should increase if this
scenario plays out, keeping everything else constant.
Operating leverage is a ratio that measures the fixed costs as a proportion of total costs (sum of
variable and fixed costs). Companies with higher operating leverage, meaning a higher
percentage of fixed costs of total costs are attributed a greater beta, ceteris paribus. A cost
structure that has a lower percentage of fixed costs gives the company more flexibility to ramp
up/down production as demand fluctuates. The cash flows of a company with high fixed costs
will fluctuate more than the ones of a similar company with lower fixed costs. This translates
into a greater business risk (fluctuation of cash flows) which yields a higher beta. Smaller
companies tend to have a larger beta than large companies, as former companies have yet to

Individual Report - Magnus Lauvli Andersen – 29959
scale their business to its full potential. In L'Oréal’s case the company is a manufacturer of
consumer goods and has input costs in order to make their beauty products. This gives the
company a lower operating leverage since it can adjust its supply according to the change in
demand. A larger part of the firm’s costs is relating to Advertisement and Promotions, also
known as A&P spend. During economic downturns advertisement is one of the costs that could
easily be cut if necessary, meaning it could be segmented as a variable cost.
Financial leverage is the last component we need to look at in order to make an estimation of
the company’s true beta. Financial leverage magnifies the cash flows of the company, both
during good and bad times. Similar to operational leverage, this will make the cash flows of the
company fluctuate more than the ones of the same company with lower financial leverage. This
implies that highly levered firms should have a greater beta. Coty, which amassed a high debt
burden following the acquisition of P&G’s Beauty Division, will in this case deserve a higher
beta than companies that finances an acquisition with equity. Coty will be under pressure to
meet it principal and interest payments, thus the company would be considered a riskier
investment ceteris paribus, thus a higher beta.
An alternative framework for estimating beta
The first thing to do is to find comparable companies that operate in the same business as your
chosen company. In L’Oréal’s case this would be the beauty industry where we can find
comparable peers such as Estée Lauder, Shiseido, Coty, P&G, Henkel, Beiersdorf and so on.
Then you estimate the beta of these companies by running a regression against a broad index.
We use the average of the betas we found. Then we unlever the average beta by using the
average debt to equity ratio of these comparable peers.
𝛽#$% =𝐴𝑣𝑒𝑟𝑎𝑔𝑒𝑜𝑓𝛽/0012
(1 + (1 − 𝑇𝑐) × 𝐴𝑣𝑒𝑟𝑎𝑔𝑒 𝐷𝐸 𝑝𝑒𝑒𝑟𝑠
In some cases, your chosen company will have several business units, meaning you would have
to find comparable peers for each unit and then estimate how much each unit contributes to

Individual Report - Magnus Lauvli Andersen – 29959
overall value of the firm. This is normally done by revenue, but operating income is a more
precise measurement due to the fact operating margins differ across units. If the company has
several business units you must compute a weighted average (by operating income) of the
unlevered betas of the business units. As the last step you compute the levered beta for your
company, by using its debt to equity ratio (market values).
𝛽%0? = 𝛽#$%(1 + (1 − 𝑇𝑐)(𝐷@?𝐸@?
)
In this case we also have to make assumptions to arrive at the beta. We assume that the D/E
ratio will remain constant or that the ratio used mirrors the future capital structure. We also
assume the weights of the business units will not change over time, which is not necessarily
true. As a last point, we can also adjust for the operating leverage of the chosen company against
the average beta of comparable peers.
This framework for estimating the company’s beta will be a better proxy than running single a
regression. As I’m using a larger sample size (comparable peers) to find the company’s beta,
I’m minimizing the Standard Error of the company’s beta.
𝑆𝐸 = 𝜎C?D√𝑛
With an increasing number of comparable peers, the number of outliers, both on the up- and
downside, will play a lesser role in affecting the average beta. This will make the estimation of
the company’s beta more precise and thus, works as a better framework rather than relying on
one single regression. This framework is also good for estimating the beta of a private company,
which is not possible when running a regression.