LAO Report State and Regional Economic Developments · PDF fileState and Regional Economic...
36
Elizabeth G. Hill Legislative Analyst An LAO Report State and Regional Economic Developments in California Table of Contents Introduction After experiencing a major recession in the early 1990s, California has recently been enjoying healthy and diverse economic growth. While the state faces near-term challenges related to international developments and softness in its electronics manufacturing indus- tries, its longer-term outlook appears to be positive. This report examines recent economic developments in California, with spe- cial emphasis on how the state’s major geographic economic re- gions have been faring. It also looks at the near-term outlook for the state and its economic regions. California’s Statewide Picture ................................................... 2 Regional Developments in California ....................................... 8 Trends in the Southern California Economic Region ........... 11 Trends in the San Francisco Bay Area Economic Region ..... 22 Trends in the Central Valley Economic Region .................... 27 Trends in the Central Coast Economic Region .................... 31 Trends in the Rest-of-the-State Economic Region ............... 33 Implications of California’s Renewed Economic Growth .......... 34 September 1998
Transcript of LAO Report State and Regional Economic Developments · PDF fileState and Regional Economic...
Elizabeth G. HillLegislative Analyst
AnLAO
Report
State and Regional EconomicDevelopments in California
Table of Contents
Introduction After experiencing a major recession in the early 1990s, Californiahas recently been enjoying healthy and diverse economic growth.While the state faces near-term challenges related to internationaldevelopments and softness in its electronics manufacturing indus-tries, its longer-term outlook appears to be positive. This reportexamines recent economic developments in California, with spe-cial emphasis on how the state’s major geographic economic re-gions have been faring. It also looks at the near-term outlook forthe state and its economic regions.
California’s Statewide Picture ................................................... 2
Regional Developments in California ....................................... 8
Trends in the Southern California Economic Region ........... 11
Trends in the San Francisco Bay Area Economic Region ..... 22
Trends in the Central Valley Economic Region.................... 27
Trends in the Central Coast Economic Region.................... 31
Trends in the Rest-of-the-State Economic Region ............... 33
Implications of California’s Renewed Economic Growth.......... 34
September 1998
2
CALIFORNIA’S STATEWIDE ECONOMIC PICTUREregained its role as a national and international
economic leader.
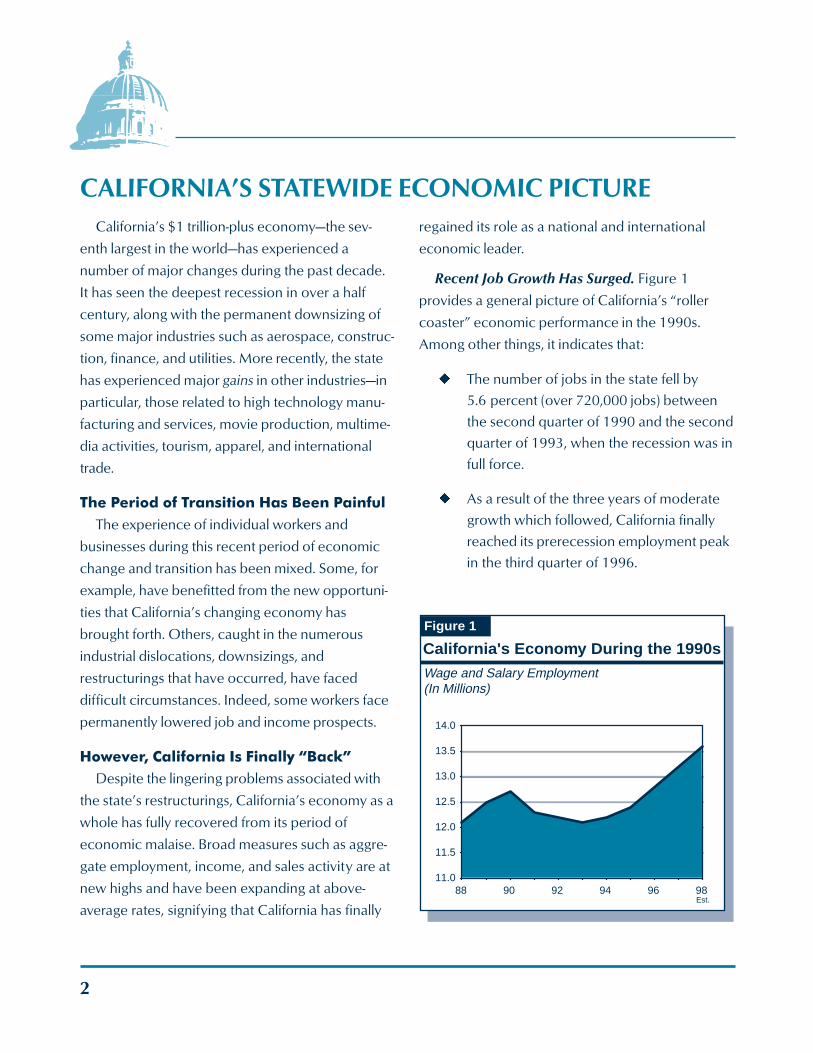
Recent Job Growth Has Surged. Figure 1
provides a general picture of California’s “roller
coaster” economic performance in the 1990s.
Among other things, it indicates that:
u The number of jobs in the state fell by
5.6 percent (over 720,000 jobs) between
the second quarter of 1990 and the second
quarter of 1993, when the recession was in
full force.
u As a result of the three years of moderate
growth which followed, California finally
reached its prerecession employment peak
in the third quarter of 1996.
California’s $1 trillion-plus economy—the sev-
enth largest in the world—has experienced a
number of major changes during the past decade.
It has seen the deepest recession in over a half
century, along with the permanent downsizing of
some major industries such as aerospace, construc-
tion, finance, and utilities. More recently, the state
has experienced major gains in other industries—in
particular, those related to high technology manu-
facturing and services, movie production, multime-
dia activities, tourism, apparel, and international
trade.
The Period of Transition Has Been PainfulThe experience of individual workers and
businesses during this recent period of economic
change and transition has been mixed. Some, for
example, have benefitted from the new opportuni-
ties that California’s changing economy has
brought forth. Others, caught in the numerous
industrial dislocations, downsizings, and
restructurings that have occurred, have faced
difficult circumstances. Indeed, some workers face
permanently lowered job and income prospects.
However, California Is Finally “Back”Despite the lingering problems associated with
the state’s restructurings, California’s economy as a
whole has fully recovered from its period of
economic malaise. Broad measures such as aggre-
gate employment, income, and sales activity are at
new highs and have been expanding at above-
average rates, signifying that California has finally
Figure 1
California's Economy During the 1990s
Wage and Salary Employment(In Millions)
11.0
11.5
12.0
12.5
13.0
13.5
14.0
88 90 92 94 96 98Est.
Legislative Analyst’s Office
3
u Since then, however, economic growth has
accelerated, with the state adding nearly
900,000 jobs in the past two years.
The 1990s’ Expansion Got Stronger as It Aged.
In past decades, the early stages of economic
expansions have traditionally been characterized
by rapid growth, due to major gains in the residen-
tial construction, retail trade, and durable goods
manufacturing industries. These rapid early stages
were generally followed by more moderate growth
periods, as the expansions matured and the pace
of spending by households and businesses eventu-
ally settled down into somewhat slower, more
sustainable rates.
In sharp contrast to these past experiences, the
early stages of the current expansion were charac-
terized by modest economic
growth, with employment and
income growing at less than
one-half the rates of earlier
expansions. This was partly due
to the continued cutbacks in
defense-related aerospace
industries, ongoing
restructurings in finance and
communications industries,
and softness in housing activity
(with the latter having persisted
well into 1996).
More recently, however, the
state’s expansion began to
broaden and strengthen, as the
restructurings began to subside
and the real estate markets perked up. Employment
and income growth in the state surpassed the
national average in 1996 for the first time since
1989. These positive trends accelerated in 1997
and remained strong through the first half of 1998.
Over the past two years, meaningful employment
growth has spread to virtually all major geographi-
cal regions and industry sectors in the state. Other
economic indicators confirm these trends, such as
home sales, nonresidential construction activity,
taxable sales, and weekly hours and earnings in the
manufacturing sector.
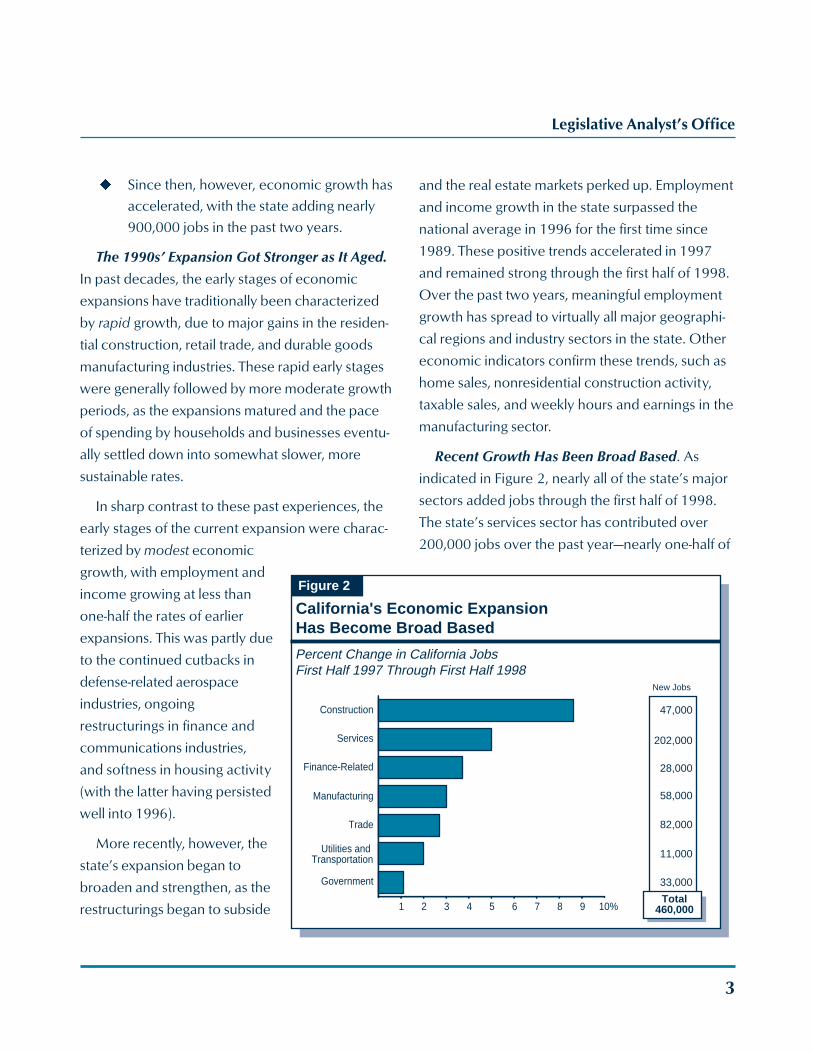
Recent Growth Has Been Broad Based. As
indicated in Figure 2, nearly all of the state’s major
sectors added jobs through the first half of 1998.
The state’s services sector has contributed over
200,000 jobs over the past year—nearly one-half of
Figure 2
California's Economic Expansion Has Become Broad Based
Percent Change in California JobsFirst Half 1997 Through First Half 1998
1 2 3 4 5 6 7 8 9 10%
Government
Trade
Manufacturing
Utilities and Transportation
Finance-Related
Services
Construction
New Jobs
47,000
202,000
28,000
11,000
33,000
58,000
Total460,000
82,000
4
WAGE AND SALARY EMPLOYMENT CATEGORIESu Trade. This category includes establish-
ments selling merchandise to people(retail trade) and to other businesses(wholesale trade). Retail trade establish-ments include department stores, foodstores, automotive dealers, and eatingand drinking establishments. Wholesaletrade establishments include importersand exporters, which have benefittedfrom the expansion of international tradeactivities in recent years and thus havegrown in importance.
u Finance, Insurance, and Real Estate. Thiscategory includes banks, credit institu-tions, mortgage brokers, investmentcompanies, insurance companies, andsecurities brokers. It also includes realestate brokers and agents, and titlecompanies.
u Services. This is the state’s single largestindustrial category. It includes a vast arrayof business activities. Among these arebusiness services, hotels, entertainmentand recreation, personal services, auto-motive repair, and film production. It alsoencompasses a variety of professionalservices, including health, legal, account-ing, and engineering. One of the fastestgrowing of the service categories isbusiness services, which includes soft-ware design and other computer-relatedservices (see later box on page 6).
u Government. This category includes bothfederal government employment (includ-ing civilian employees working onmilitary bases) and state and local govern-ment employment (which includesteachers, and employees of city, county,and state government within California).
Employment data provide the most currentand comprehensive information on industrytrends in the state. These data are collectedmonthly by the state’s Employment Develop-ment Department (EDD) from businesses inCalifornia, and are categorized by industrysector based on the Standard Industrial Classifi-cation (SIC). The major nonagricultural catego-
ries are:
u Construction. This category includesgeneral contractors engaged in theconstruction of homes, offices, stores,and other buildings. It also includesspecial trade contractors engaged inplumbing, painting, and electrical work.The category also includes contractorsinvolved in heavy construction of roads,highways, and other infrastructureprojects.
u Manufacturing. The manufacturingsector is broadly divided into thedurable goods and nondurable goodssubsectors. In California, a large numberof durable goods manufacturers areinvolved in the production of comput-ers, electronic components, aerospaceequipment, and other “high technology”goods. Major nondurable manufacturingcategories in California include appareland textiles.
u Utilities and Transportation. Thiscategory includes utilities, phonecompanies, and providers of passengerand freight transportation and warehous-ing. The transportation subcategoriesinclude businesses involved in thedistribution of internationally tradedgoods.
Legislative Analyst’s Office
5
the total gain. In percentage terms, the fastest
growing industry has been construction, which is
benefitting from increases in both residential and
nonresidential building activity. Other industries
posting significant gains include trade and manu-
facturing.
The emergence of broad-based economic
growth has very positive implications for California.
The state’s diverse industry mix makes our
economy currently more stable and less vulnerable
to downturns in one or two key industries than it
has been in the past, such as in the late 1980s
when the economy was highly dependent on
defense and real estate-related spending.
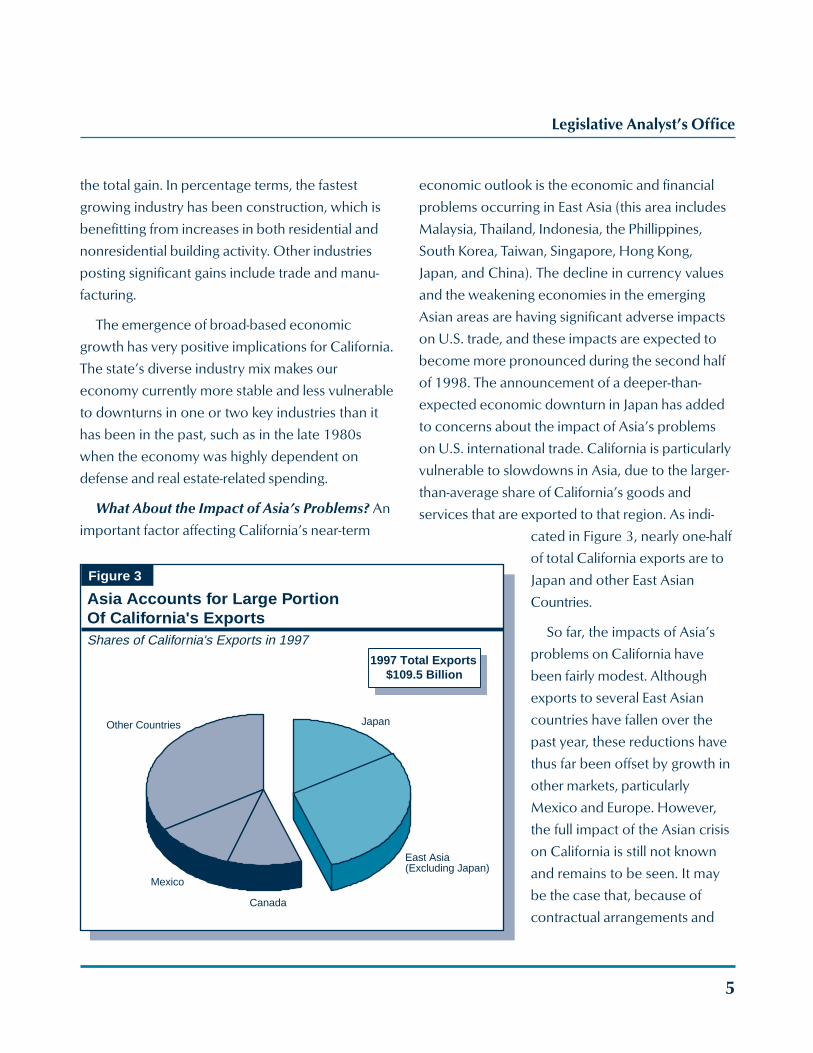
What About the Impact of Asia’s Problems? An
important factor affecting California’s near-term
economic outlook is the economic and financial
problems occurring in East Asia (this area includes
Malaysia, Thailand, Indonesia, the Phillippines,
South Korea, Taiwan, Singapore, Hong Kong,
Japan, and China). The decline in currency values
and the weakening economies in the emerging
Asian areas are having significant adverse impacts
on U.S. trade, and these impacts are expected to
become more pronounced during the second half
of 1998. The announcement of a deeper-than-
expected economic downturn in Japan has added
to concerns about the impact of Asia’s problems
on U.S. international trade. California is particularly
vulnerable to slowdowns in Asia, due to the larger-
than-average share of California’s goods and
services that are exported to that region. As indi-
cated in Figure 3, nearly one-half
of total California exports are to
Japan and other East Asian
Countries.
So far, the impacts of Asia’s
problems on California have
been fairly modest. Although
exports to several East Asian
countries have fallen over the
past year, these reductions have
thus far been offset by growth in
other markets, particularly
Mexico and Europe. However,
the full impact of the Asian crisis
on California is still not known
and remains to be seen. It may
be the case that, because of
contractual arrangements and
Figure 3
Asia Accounts for Large PortionOf California's ExportsShares of California's Exports in 1997
Other Countries Japan
Canada
Mexico
1997 Total Exports$109.5 Billion
East Asia(Excluding Japan)
6
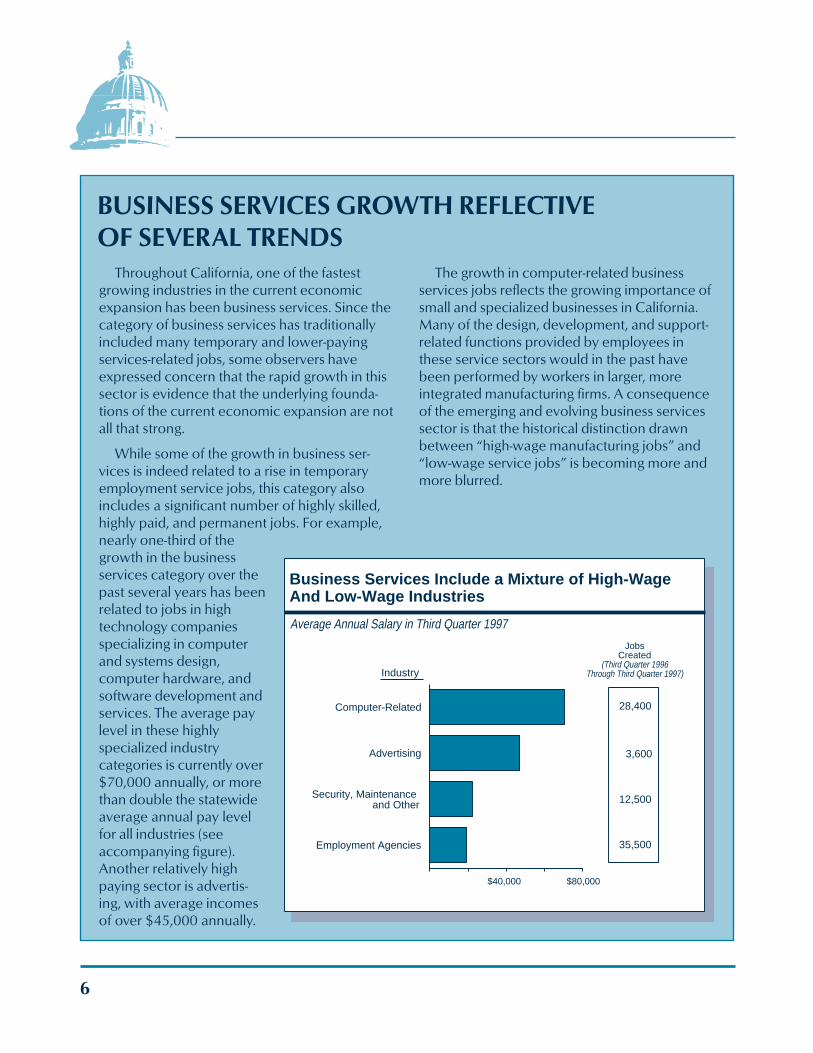
Business Services Include a Mixture of High-Wage And Low-Wage Industries
Average Annual Salary in Third Quarter 1997
$40,000 $80,000
JobsCreated
(Third Quarter 1996Through Third Quarter 1997)
12,500
3,600
28,400
35,500Employment Agencies
Security, Maintenance and Other
Advertising
Computer-Related
Industry
BUSINESS SERVICES GROWTH REFLECTIVEOF SEVERAL TRENDS
The growth in computer-related businessservices jobs reflects the growing importance ofsmall and specialized businesses in California.Many of the design, development, and support-related functions provided by employees inthese service sectors would in the past havebeen performed by workers in larger, moreintegrated manufacturing firms. A consequenceof the emerging and evolving business servicessector is that the historical distinction drawnbetween “high-wage manufacturing jobs” and“low-wage service jobs” is becoming more andmore blurred.
Throughout California, one of the fastestgrowing industries in the current economicexpansion has been business services. Since thecategory of business services has traditionallyincluded many temporary and lower-payingservices-related jobs, some observers haveexpressed concern that the rapid growth in thissector is evidence that the underlying founda-tions of the current economic expansion are notall that strong.
While some of the growth in business ser-vices is indeed related to a rise in temporaryemployment service jobs, this category alsoincludes a significant number of highly skilled,highly paid, and permanent jobs. For example,nearly one-third of thegrowth in the businessservices category over thepast several years has beenrelated to jobs in hightechnology companiesspecializing in computerand systems design,computer hardware, andsoftware development andservices. The average paylevel in these highlyspecialized industrycategories is currently over$70,000 annually, or morethan double the statewideaverage annual pay levelfor all industries (seeaccompanying figure).Another relatively highpaying sector is advertis-ing, with average incomesof over $45,000 annually.

Legislative Analyst’s Office
7
other factors, a time lag has
simply been experienced
between the onset of Asia’s
financial problems and the
associated reductions in
orders for California-pro-
duced goods that will follow.
Indeed, more current
national trade-related data
suggest that some negative
effects are now beginning to
appear, and company profit
reports indicate that some
California businesses with
significant Asian markets are
experiencing sales and profit
slowdowns. The more
serious these slowdowns
become, the more serious
will be the implications for
California’s high technology
industries, which export significant amounts of
goods and services to these countries.
At this point, however, the “best guess” is that,
while Asia’s problems will cause a slowdown in the
U.S. and California economic expansions, especially
in late 1998 and early 1999, their negative effects will
not be severe enough to derail our economies.
The Near-Term Outlook—Some Slowing,But Moderate Growth Ahead
Figure 4 provides our May forecast for
California’s economy from 1998 through 2000.
The forecast assumed that the combination of
Asia’s economic problems and more modest
growth in the U.S. economy will lead to a tapering in
the rate of job and income growth in this state. As
discussed below, the slowdowns will likely be most
pronounced in Silicon Valley, which in recent years
has been the fastest growing region of the state.
Despite this easing though, California will likely
continue to experience moderate economic
expansion through the end of the decade, sus-
tained in part by strength in construction, services,
and retail trade activity. During this period,
California’s employment and income growth are
expected to exceed the national average by about
1-to-2 percentage points per year.
Figure 4
Summary of LAO's May 1998 Economic Outlook
Percent Changesa
Preliminary1997
Projected
1998 1999 2000
United States ForecastPercent change in:
Real GDP 3.8 3.0 1.9 2.4Personal income 5.8 5.4 4.0 4.3Wage and salary jobs 2.3 2.6 1.0 1.1Consumer Price Index 2.4 1.7 2.6 2.8
Unemployment rate (%) 5.0 4.7 5.1 5.3Housing Starts (000) 1,478 1,514 1,431 1,425
California ForecastPercent change in:
Personal income 7.3 7.1 5.8 5.4Wage and salary jobs 3.3 3.4 2.9 2.5Taxable sales 6.3 6.2 5.6 5.2Consumer Price Index 2.2 2.1 2.8 3.0
Unemployment rate (%) 6.3 5.8 5.4 5.3New housing permits (000) 111 130 153 157a
Unless otherwise indicated.
8
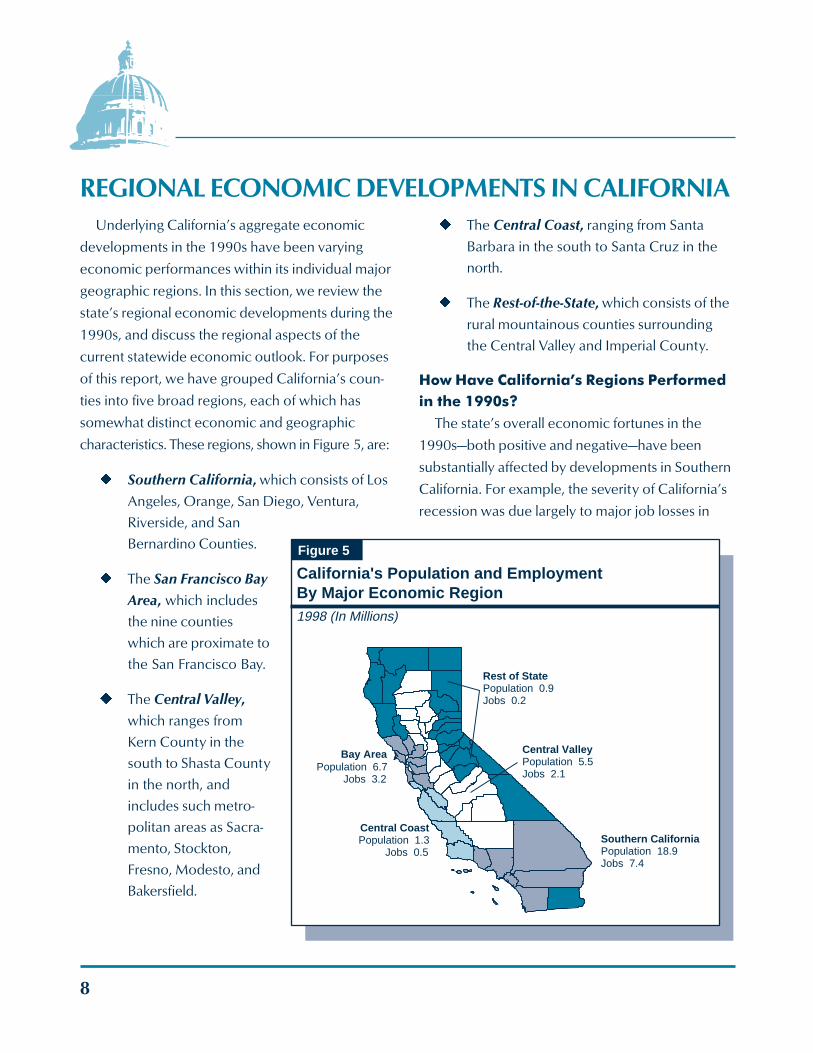
REGIONAL ECONOMIC DEVELOPMENTS IN CALIFORNIAUnderlying California’s aggregate economic
developments in the 1990s have been varying
economic performances within its individual major
geographic regions. In this section, we review the
state’s regional economic developments during the
1990s, and discuss the regional aspects of the
current statewide economic outlook. For purposes
of this report, we have grouped California’s coun-
ties into five broad regions, each of which has
somewhat distinct economic and geographic
characteristics. These regions, shown in Figure 5, are:
u Southern California, which consists of Los
Angeles, Orange, San Diego, Ventura,
Riverside, and San
Bernardino Counties.
u The San Francisco Bay
Area, which includes
the nine counties
which are proximate to
the San Francisco Bay.
u The Central Valley,
which ranges from
Kern County in the
south to Shasta County
in the north, and
includes such metro-
politan areas as Sacra-
mento, Stockton,
Fresno, Modesto, and
Bakersfield.
Figure 5
California's Population and Employment By Major Economic Region1998 (In Millions)
Bay AreaPopulation 6.7
Jobs 3.2
Southern CaliforniaPopulation 18.9Jobs 7.4
Central CoastPopulation 1.3
Jobs 0.5
Central ValleyPopulation 5.5Jobs 2.1
Rest of StatePopulation 0.9Jobs 0.2
u The Central Coast, ranging from Santa
Barbara in the south to Santa Cruz in the
north.
u The Rest-of-the-State, which consists of the
rural mountainous counties surrounding
the Central Valley and Imperial County.
How Have California’s Regions Performedin the 1990s?
The state’s overall economic fortunes in the
1990s—both positive and negative—have been
substantially affected by developments in Southern
California. For example, the severity of California’s
recession was due largely to major job losses in
Legislative Analyst’s Office
9
Southern California. Likewise, the more recent
improvement in the state’s overall economic
growth can be traced to the acceleration of em-
ployment and other economic measures in South-
ern California’s economy. To be sure, favorable
economic developments in other regions in the
recent past have had significant positive effects on
the state’s overall performance. For instance,
booming economic activity in Silicon Valley clearly
boosted California’s overall economy in the mid-
1990s. Nevertheless, the sheer size of Southern
California has made it a dominant factor in
California’s overall 1990s’ economic performance.
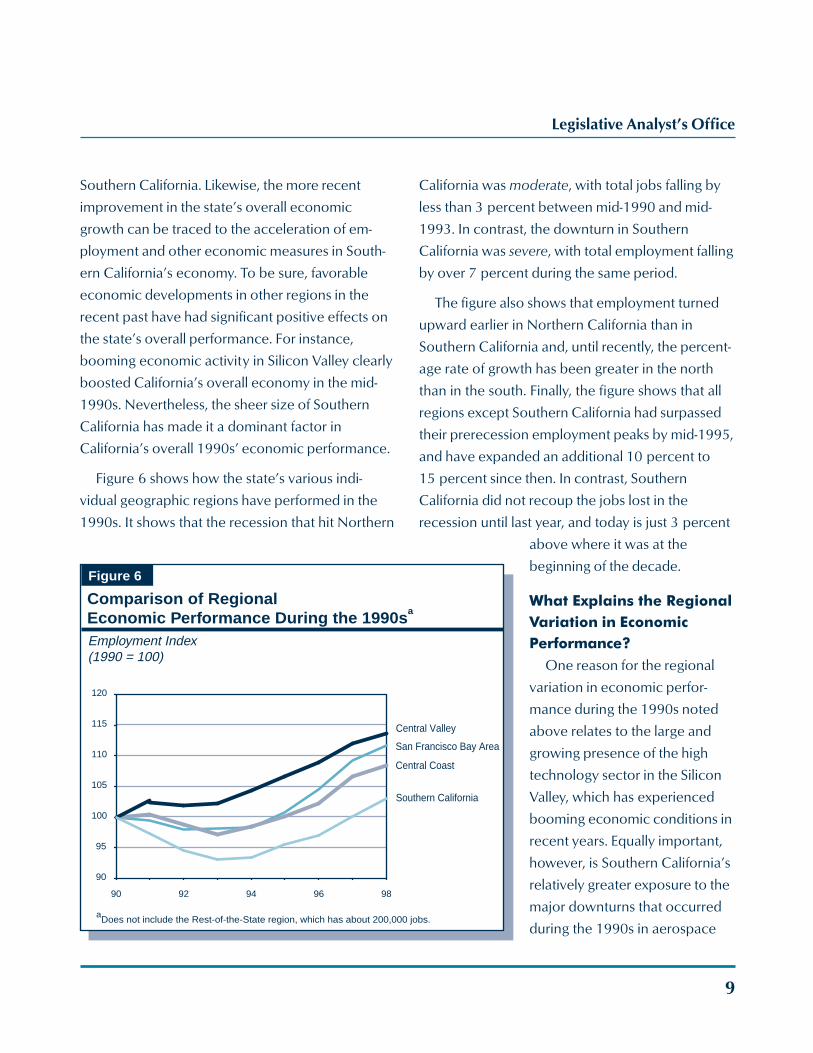
Figure 6 shows how the state’s various indi-
vidual geographic regions have performed in the
1990s. It shows that the recession that hit Northern
California was moderate, with total jobs falling by
less than 3 percent between mid-1990 and mid-
1993. In contrast, the downturn in Southern
California was severe, with total employment falling
by over 7 percent during the same period.
The figure also shows that employment turned
upward earlier in Northern California than in
Southern California and, until recently, the percent-
age rate of growth has been greater in the north
than in the south. Finally, the figure shows that all
regions except Southern California had surpassed
their prerecession employment peaks by mid-1995,
and have expanded an additional 10 percent to
15 percent since then. In contrast, Southern
California did not recoup the jobs lost in the
recession until last year, and today is just 3 percent
above where it was at the
beginning of the decade.
What Explains the RegionalVariation in EconomicPerformance?
One reason for the regional
variation in economic perfor-
mance during the 1990s noted
above relates to the large and
growing presence of the high
technology sector in the Silicon
Valley, which has experienced
booming economic conditions in
recent years. Equally important,
however, is Southern California’s
relatively greater exposure to the
major downturns that occurred
during the 1990s in aerospace
Figure 6
Comparison of RegionalEconomic Performance During the 1990s a
Employment Index(1990 = 100)
aDoes not include the Rest-of-the-State region, which has about 200,000 jobs.
San Francisco Bay Area
Central Valley
Southern California
Central Coast
90
95
100
105
110
115
120
90 92 94 96 98
10
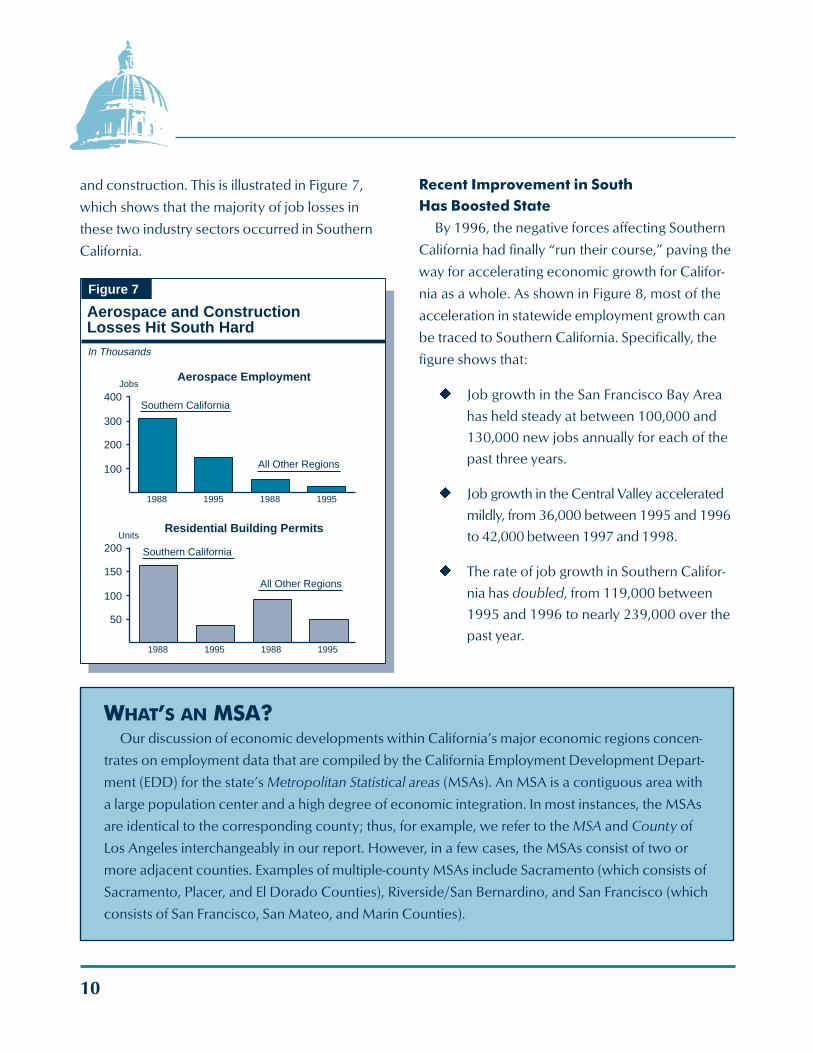
and construction. This is illustrated in Figure 7,
which shows that the majority of job losses in
these two industry sectors occurred in Southern
California.
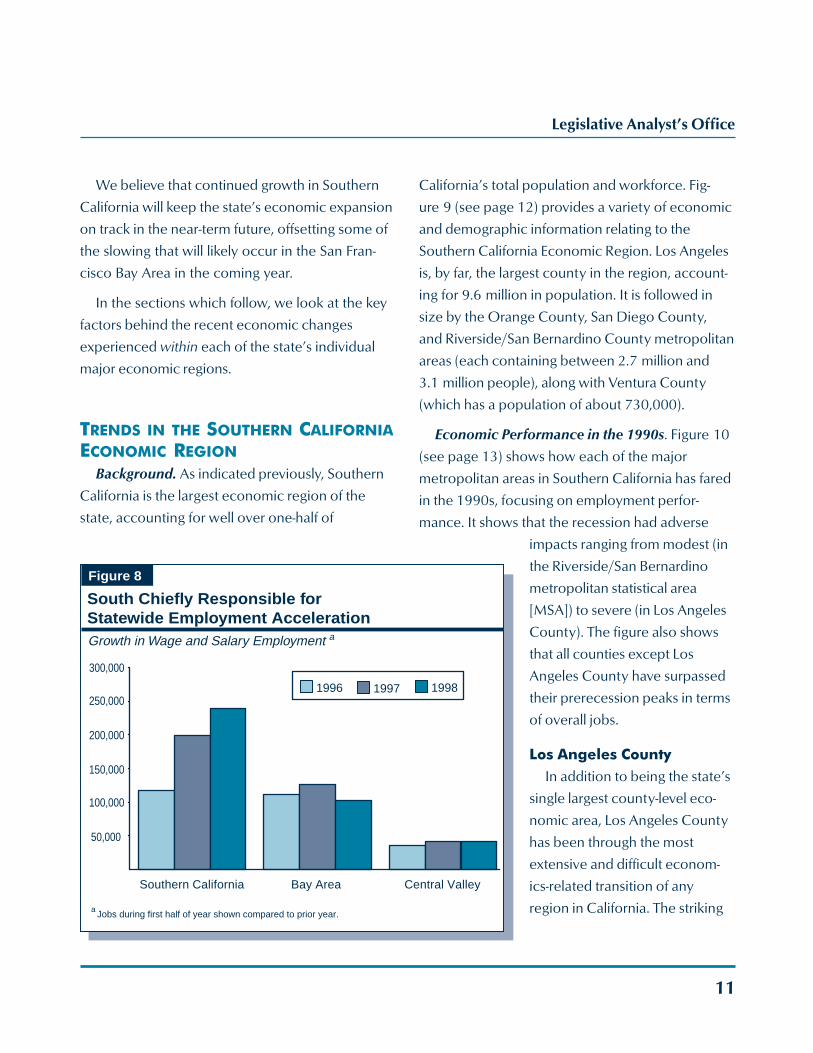
Recent Improvement in SouthHas Boosted State
By 1996, the negative forces affecting Southern
California had finally “run their course,” paving the
way for accelerating economic growth for Califor-
nia as a whole. As shown in Figure 8, most of the
acceleration in statewide employment growth can
be traced to Southern California. Specifically, the
figure shows that:
u Job growth in the San Francisco Bay Area
has held steady at between 100,000 and
130,000 new jobs annually for each of the
past three years.
u Job growth in the Central Valley accelerated
mildly, from 36,000 between 1995 and 1996
to 42,000 between 1997 and 1998.
u The rate of job growth in Southern Califor-
nia has doubled, from 119,000 between
1995 and 1996 to nearly 239,000 over the
past year.
WHAT’S AN MSA?Our discussion of economic developments within California’s major economic regions concen-
trates on employment data that are compiled by the California Employment Development Depart-
ment (EDD) for the state’s Metropolitan Statistical areas (MSAs). An MSA is a contiguous area with
a large population center and a high degree of economic integration. In most instances, the MSAs
are identical to the corresponding county; thus, for example, we refer to the MSA and County of
Los Angeles interchangeably in our report. However, in a few cases, the MSAs consist of two or
more adjacent counties. Examples of multiple-county MSAs include Sacramento (which consists of
Sacramento, Placer, and El Dorado Counties), Riverside/San Bernardino, and San Francisco (which
consists of San Francisco, San Mateo, and Marin Counties).
Figure 7
Aerospace and ConstructionLosses Hit South Hard
100
200
300
400
1988 1995 1988 1995
Aerospace Employment
Southern California
All Other Regions
50
100
150
200
1988 1995 1988 1995
Southern California
All Other Regions
Residential Building PermitsUnits
Jobs
In Thousands
Legislative Analyst’s Office
11
Figure 8
South Chiefly Responsible forStatewide Employment AccelerationGrowth in Wage and Salary Employment
50,000
100,000
150,000
200,000
250,000
300,000
Southern California Bay Area Central Valley
1996 1997 1998
a
Jobs during first half of year shown compared to prior year.a
We believe that continued growth in Southern
California will keep the state’s economic expansion
on track in the near-term future, offsetting some of
the slowing that will likely occur in the San Fran-
cisco Bay Area in the coming year.
In the sections which follow, we look at the key
factors behind the recent economic changes
experienced within each of the state’s individual
major economic regions.
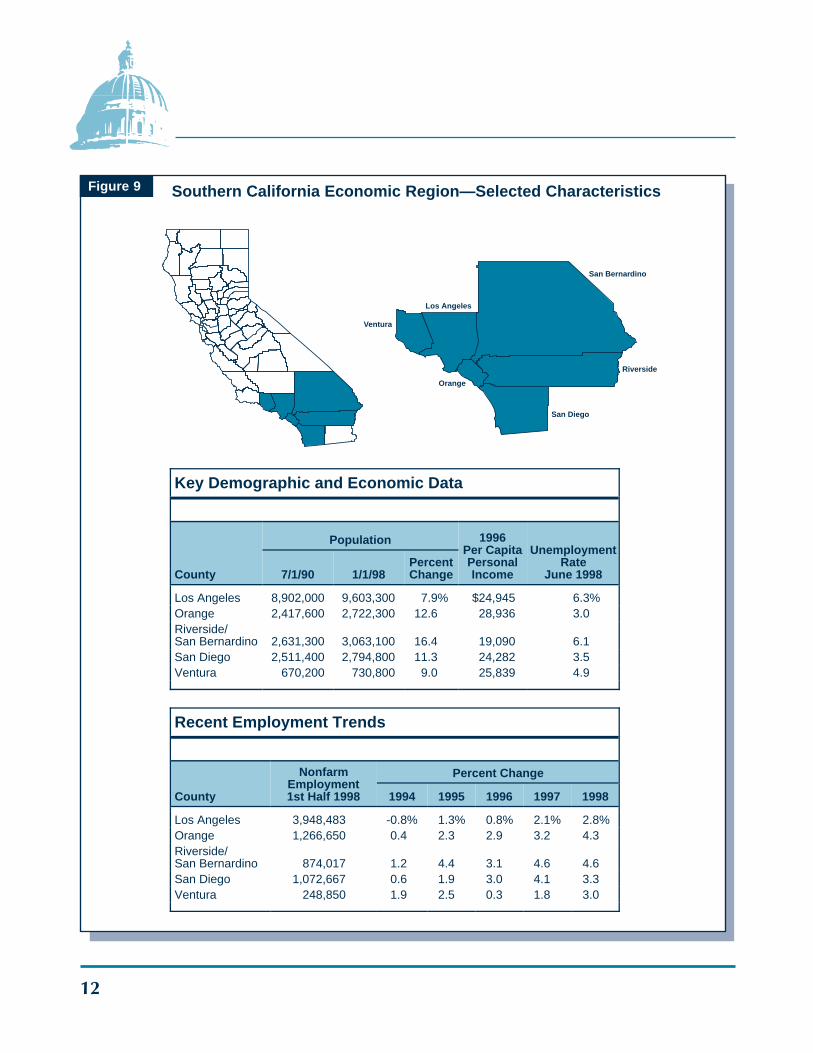
TRENDS IN THE SOUTHERN CALIFORNIAECONOMIC REGION
Background. As indicated previously, Southern
California is the largest economic region of the
state, accounting for well over one-half of
California’s total population and workforce. Fig-
ure 9 (see page 12) provides a variety of economic
and demographic information relating to the
Southern California Economic Region. Los Angeles
is, by far, the largest county in the region, account-
ing for 9.6 million in population. It is followed in
size by the Orange County, San Diego County,
and Riverside/San Bernardino County metropolitan
areas (each containing between 2.7 million and
3.1 million people), along with Ventura County
(which has a population of about 730,000).
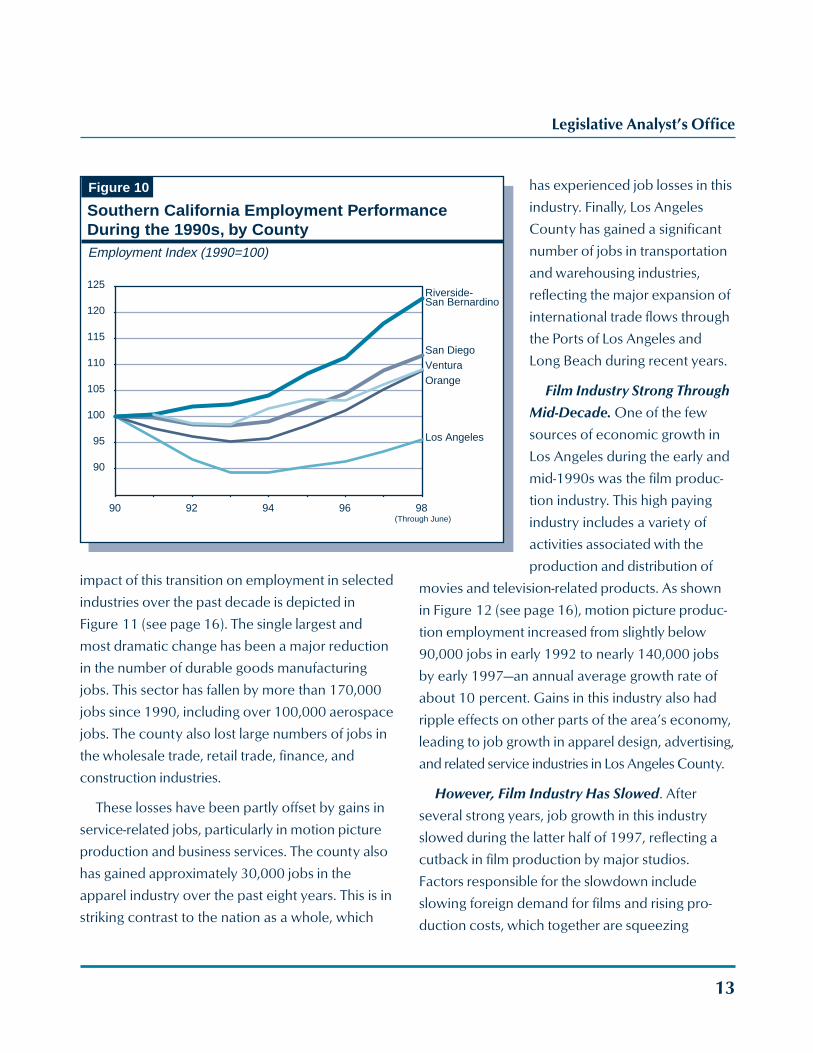
Economic Performance in the 1990s. Figure 10
(see page 13) shows how each of the major
metropolitan areas in Southern California has fared
in the 1990s, focusing on employment perfor-
mance. It shows that the recession had adverse
impacts ranging from modest (in
the Riverside/San Bernardino
metropolitan statistical area
[MSA]) to severe (in Los Angeles
County). The figure also shows
that all counties except Los
Angeles County have surpassed
their prerecession peaks in terms
of overall jobs.
Los Angeles CountyIn addition to being the state’s
single largest county-level eco-
nomic area, Los Angeles County
has been through the most
extensive and difficult econom-
ics-related transition of any
region in California. The striking
12
Figure 9
Ventura
Los Angeles
San Bernardino
Riverside
Orange
San Diego
Southern California Economic Region—Selected Characteristics
Key Demographic and Economic Data
County
Population 1996Per CapitaPersonalIncome
UnemploymentRate
June 19987/1/90 1/1/98PercentChange
Los Angeles 8,902,000 9,603,300 7.9% $24,945 6.3%Orange 2,417,600 2,722,300 12.6 28,936 3.0Riverside/San Bernardino 2,631,300 3,063,100 16.4 19,090 6.1San Diego 2,511,400 2,794,800 11.3 24,282 3.5Ventura 670,200 730,800 9.0 25,839 4.9
Recent Employment Trends
County
NonfarmEmployment1st Half 1998
Percent Change
1994 1995 1996 1997 1998
Los Angeles 3,948,483 -0.8% 1.3% 0.8% 2.1% 2.8%Orange 1,266,650 0.4 2.3 2.9 3.2 4.3Riverside/San Bernardino 874,017 1.2 4.4 3.1 4.6 4.6San Diego 1,072,667 0.6 1.9 3.0 4.1 3.3Ventura 248,850 1.9 2.5 0.3 1.8 3.0
Legislative Analyst’s Office
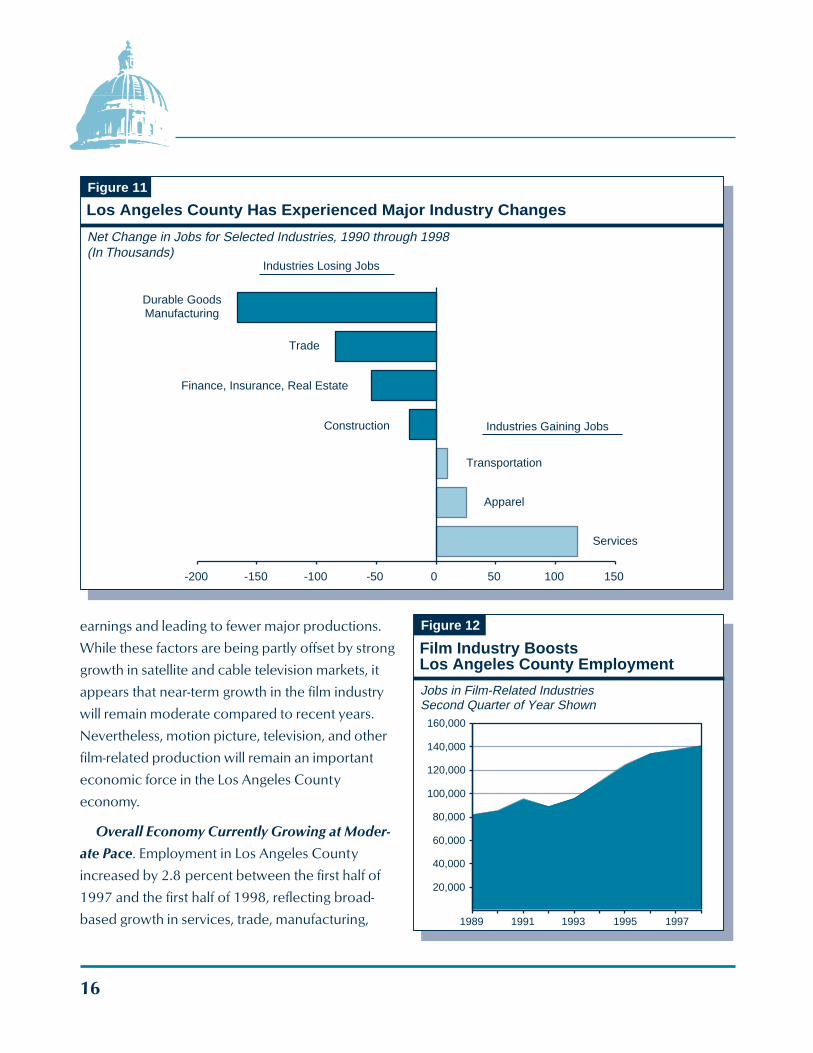
13
impact of this transition on employment in selected
industries over the past decade is depicted in
Figure 11 (see page 16). The single largest and
most dramatic change has been a major reduction
in the number of durable goods manufacturing
jobs. This sector has fallen by more than 170,000
jobs since 1990, including over 100,000 aerospace
jobs. The county also lost large numbers of jobs in
the wholesale trade, retail trade, finance, and
construction industries.
These losses have been partly offset by gains in
service-related jobs, particularly in motion picture
production and business services. The county also
has gained approximately 30,000 jobs in the
apparel industry over the past eight years. This is in
striking contrast to the nation as a whole, which
has experienced job losses in this
industry. Finally, Los Angeles
County has gained a significant
number of jobs in transportation
and warehousing industries,
reflecting the major expansion of
international trade flows through
the Ports of Los Angeles and
Long Beach during recent years.
Film Industry Strong Through
Mid-Decade. One of the few
sources of economic growth in
Los Angeles during the early and
mid-1990s was the film produc-
tion industry. This high paying
industry includes a variety of
activities associated with the
production and distribution of
movies and television-related products. As shown
in Figure 12 (see page 16), motion picture produc-
tion employment increased from slightly below
90,000 jobs in early 1992 to nearly 140,000 jobs
by early 1997—an annual average growth rate of
about 10 percent. Gains in this industry also had
ripple effects on other parts of the area’s economy,
leading to job growth in apparel design, advertising,
and related service industries in Los Angeles County.
However, Film Industry Has Slowed. After
several strong years, job growth in this industry
slowed during the latter half of 1997, reflecting a
cutback in film production by major studios.
Factors responsible for the slowdown include
slowing foreign demand for films and rising pro-
duction costs, which together are squeezing
Figure 10
Southern California Employment PerformanceDuring the 1990s, by CountyEmployment Index (1990=100)
90
95
100
105
110
115
120
125
90 92 94 96 98
Los Angeles
Orange
Riverside-San Bernardino
San DiegoVentura
(Through June)
14
Los Angeles
Orange
Other Southern California
San Francisco Bay Area
Remaining Counties
San Diego
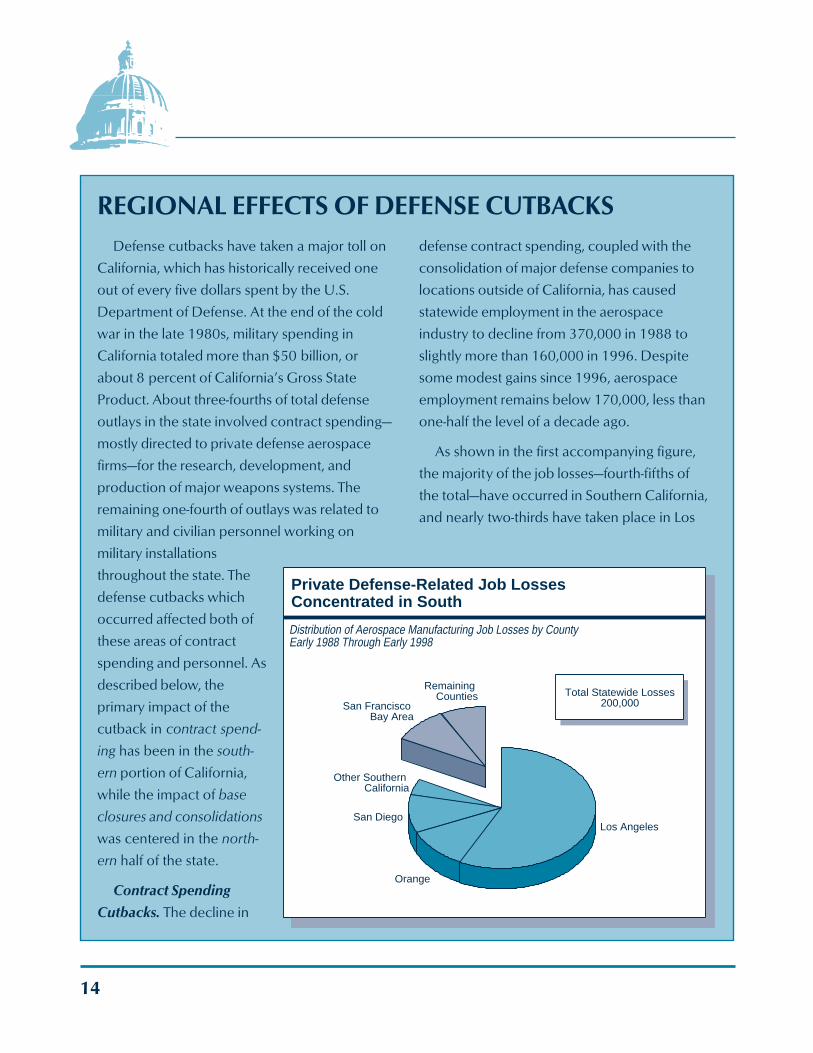
Total Statewide Losses200,000
Distribution of Aerospace Manufacturing Job Losses by CountyEarly 1988 Through Early 1998
Private Defense-Related Job LossesConcentrated in South
REGIONAL EFFECTS OF DEFENSE CUTBACKSdefense contract spending, coupled with the
consolidation of major defense companies to
locations outside of California, has caused
statewide employment in the aerospace
industry to decline from 370,000 in 1988 to
slightly more than 160,000 in 1996. Despite
some modest gains since 1996, aerospace
employment remains below 170,000, less than
one-half the level of a decade ago.
As shown in the first accompanying figure,
the majority of the job losses—fourth-fifths of
the total—have occurred in Southern California,
and nearly two-thirds have taken place in Los
Defense cutbacks have taken a major toll on
California, which has historically received one
out of every five dollars spent by the U.S.
Department of Defense. At the end of the cold
war in the late 1980s, military spending in
California totaled more than $50 billion, or
about 8 percent of California’s Gross State
Product. About three-fourths of total defense
outlays in the state involved contract spending—
mostly directed to private defense aerospace
firms—for the research, development, and
production of major weapons systems. The
remaining one-fourth of outlays was related to
military and civilian personnel working on
military installations
throughout the state. The
defense cutbacks which
occurred affected both of
these areas of contract
spending and personnel. As
described below, the
primary impact of the
cutback in contract spend-
ing has been in the south-
ern portion of California,
while the impact of base
closures and consolidations
was centered in the north-
ern half of the state.
Contract Spending
Cutbacks. The decline in
Legislative Analyst’s Office
15
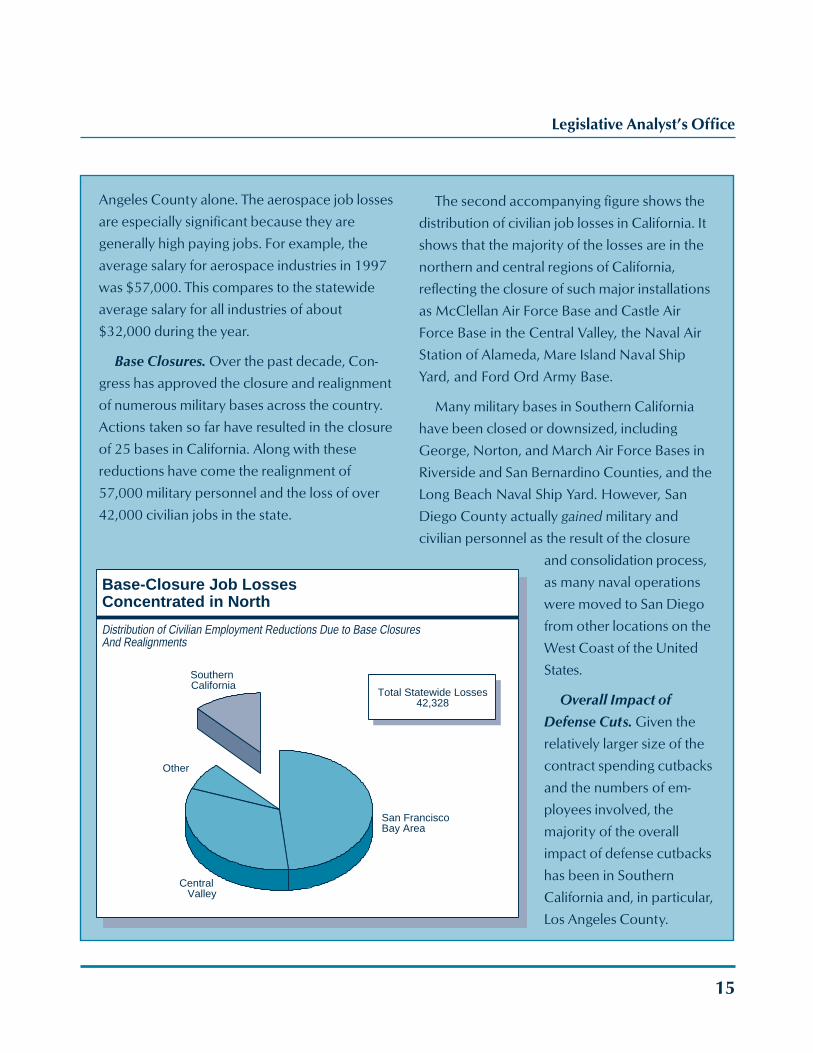
Distribution of Civilian Employment Reductions Due to Base Closures And Realignments
Base-Closure Job LossesConcentrated in North
Total Statewide Losses42,328
San Francisco Bay Area
Central Valley
Southern California
Other
Angeles County alone. The aerospace job losses
are especially significant because they are
generally high paying jobs. For example, the
average salary for aerospace industries in 1997
was $57,000. This compares to the statewide
average salary for all industries of about
$32,000 during the year.
Base Closures. Over the past decade, Con-
gress has approved the closure and realignment
of numerous military bases across the country.
Actions taken so far have resulted in the closure
of 25 bases in California. Along with these
reductions have come the realignment of
57,000 military personnel and the loss of over
42,000 civilian jobs in the state.
The second accompanying figure shows the
distribution of civilian job losses in California. It
shows that the majority of the losses are in the
northern and central regions of California,
reflecting the closure of such major installations
as McClellan Air Force Base and Castle Air
Force Base in the Central Valley, the Naval Air
Station of Alameda, Mare Island Naval Ship
Yard, and Ford Ord Army Base.
Many military bases in Southern California
have been closed or downsized, including
George, Norton, and March Air Force Bases in
Riverside and San Bernardino Counties, and the
Long Beach Naval Ship Yard. However, San
Diego County actually gained military and
civilian personnel as the result of the closure
and consolidation process,
as many naval operations
were moved to San Diego
from other locations on the
West Coast of the United
States.
Overall Impact of
Defense Cuts. Given the
relatively larger size of the
contract spending cutbacks
and the numbers of em-
ployees involved, the
majority of the overall
impact of defense cutbacks
has been in Southern
California and, in particular,
Los Angeles County.
16
earnings and leading to fewer major productions.
While these factors are being partly offset by strong
growth in satellite and cable television markets, it
appears that near-term growth in the film industry
will remain moderate compared to recent years.
Nevertheless, motion picture, television, and other
film-related production will remain an important
economic force in the Los Angeles County
economy.
Overall Economy Currently Growing at Moder-
ate Pace. Employment in Los Angeles County
increased by 2.8 percent between the first half of
1997 and the first half of 1998, reflecting broad-
based growth in services, trade, manufacturing,
and construction activity. Although still below the
statewide average, the annual increase is the
largest in a decade.
In other signs of renewed economic strength,
real estate prices and sales are up sharply in the
county, and new construction of nonresidential
facilities—including offices, industrial buildings, and
Overall Economy Currently Growing at Moderate
Pace. Employment in Los Angeles County in-
creased by 2.8 percent between the first half of
1997 and the first half of 1998, reflecting broad-
based growth in services, trade, manufacturing,
Figure 11
Los Angeles County Has Experienced Major Industry Changes
Net Change in Jobs for Selected Industries, 1990 through 1998(In Thousands)
Industries Losing Jobs
Industries Gaining Jobs
-200 -150 -100 -50 0 50 100 150
Durable Goods
Services
Apparel
Transportation
Construction
Finance, Insurance, Real Estate
Trade
Manufacturing
Figure 12
Film Industry BoostsLos Angeles County Employment
Jobs in Film-Related IndustriesSecond Quarter of Year Shown
20,000
40,000
60,000
80,000
100,000
120,000
140,000
160,000
1989 1991 1993 1995 1997
Legislative Analyst’s Office
17
and construction activity. Although still below the
statewide average, the annual increase is the
largest in a decade.
In other signs of renewed economic strength,
real estate prices and sales are up sharply in the
county, and new construction of nonresidential
facilities—including offices, industrial building, and
retail stores—has jumped 40 percent during the
past year. Finally, major capital expansions associ-
ated with the Los Angeles and Long Beach Port
facilities should boost employment and income in
the area’s economy. While the region faces some
job losses associated with further planned cutbacks
by Boeing, Northrop, and other aerospace compa-
nies, the overall outlook for the region remains
positive.
Inland EmpireThe Riverside/San Bernardino metropolitan area
(generally referred to as the Inland Empire) is the
most populous metropolitan area in California,
following Los Angeles County.
The Inland Empire experienced major increases
in population and jobs in the 1980s, reflecting the
migration of people seeking affordable housing
from the higher-cost coastal regions of Southern
California. (Home prices in the Inland Empire, for
example, have been considerably lower than for its
neighboring coastal counties in Southern Califor-
nia.) Many of these interregional migrants continue
to maintain jobs in Los Angeles and Orange
Counties, and thus face long commutes. The Inland
Empire was the center of California’s construction
boom in the second half of the 1980s, accounting
for as much as one-fifth of the volume of statewide
residential construction activity in the latter part of
the decade.
Partly because of its dependence on population
growth for its economic expansion, the Inland
Empire was hard hit when migration into the
region slowed with the early-1990s’ recession.
Although the Inland Empire avoided the major
economic downturns of its coastal neighbors, the
early 1990s were characterized by high unemploy-
ment rates, numerous home loan defaults, and
declining property values in the region. The clo-
sures of Norton and George Air Force Bases also
adversely affected the Inland Empire during this
period.
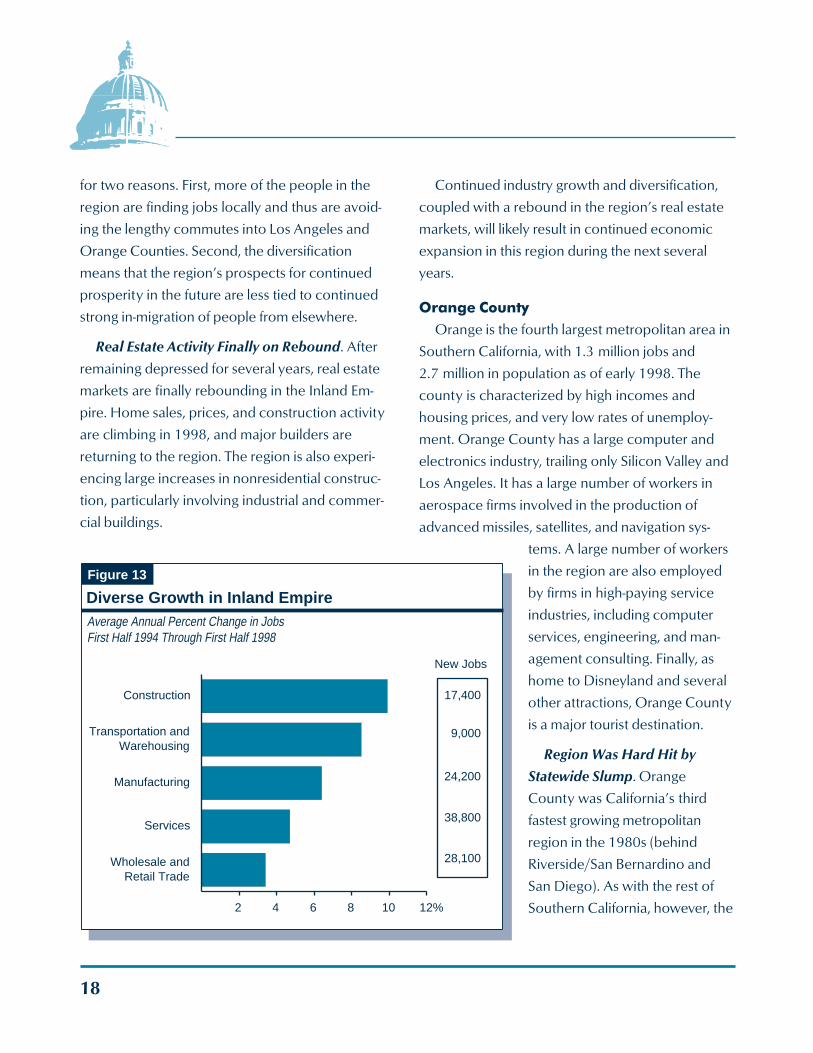
Economy Is Developing Its Own Industrial
Base. In more recent years, the Inland Empire has
experienced renewed growth, with employment
increases averaging about 4 percent annually
during the past three years. This growth has been
somewhat more subdued than experienced in the
1980s, but it also has been considerably more
balanced than in the past. While the area’s recent
economic gains have partly been related to im-
proving construction activity, there also has been
significant percentage job growth in transportation,
warehousing, manufacturing, services, and trade-
related industries (see Figure 13 on page 18). Many
jobs in the latter industries are related to the
shipping and distribution of internationally traded
goods flowing through the Ports of Los Angeles and
Long Beach.
The growth in these diverse industries is a
positive development for the Inland Empire region,
18
for two reasons. First, more of the people in the
region are finding jobs locally and thus are avoid-
ing the lengthy commutes into Los Angeles and
Orange Counties. Second, the diversification
means that the region’s prospects for continued
prosperity in the future are less tied to continued
strong in-migration of people from elsewhere.
Real Estate Activity Finally on Rebound. After
remaining depressed for several years, real estate
markets are finally rebounding in the Inland Em-
pire. Home sales, prices, and construction activity
are climbing in 1998, and major builders are
returning to the region. The region is also experi-
encing large increases in nonresidential construc-
tion, particularly involving industrial and commer-
cial buildings.
Continued industry growth and diversification,
coupled with a rebound in the region’s real estate
markets, will likely result in continued economic
expansion in this region during the next several
years.
Orange CountyOrange is the fourth largest metropolitan area in
Southern California, with 1.3 million jobs and
2.7 million in population as of early 1998. The
county is characterized by high incomes and
housing prices, and very low rates of unemploy-
ment. Orange County has a large computer and
electronics industry, trailing only Silicon Valley and
Los Angeles. It has a large number of workers in
aerospace firms involved in the production of
advanced missiles, satellites, and navigation sys-
tems. A large number of workers
in the region are also employed
by firms in high-paying service
industries, including computer
services, engineering, and man-
agement consulting. Finally, as
home to Disneyland and several
other attractions, Orange County
is a major tourist destination.
Region Was Hard Hit by
Statewide Slump. Orange
County was California’s third
fastest growing metropolitan
region in the 1980s (behind
Riverside/San Bernardino and
San Diego). As with the rest of
Southern California, however, the
Figure 13
Diverse Growth in Inland EmpireAverage Annual Percent Change in JobsFirst Half 1994 Through First Half 1998
New Jobs
28,100
24,200
9,000
17,400
38,800
2 4 6 8 10 12%
Wholesale andRetail Trade
Services
Manufacturing
Transportation andWarehousing
Construction
Legislative Analyst’s Office
19
region was hard hit by the defense cutbacks and
real estate slumps that took place in the early
1990s. The county lost nearly 5 percent of its job
base between 1990 and 1993, the second largest
percentage decline in a major subregion behind
that experienced in Los Angeles County.
Area’s Economy Among Strongest in State
During Past Year. Orange County began to
emerge from the 1990s’ recession along with the
rest of the state in late 1993. During the subse-
quent three years, however, the area’s job and
income growth was somewhat subdued by histori-
cal standards for a recovery period, and slower
than for many other parts of the state. This
changed dramatically during 1997 and early 1998.
Between the first half of 1997 and the first half of
1998, the county added 52,000
jobs, a 4.3 percent increase. The
growth was led by gains in such
industry subsectors as high
technology manufacturing,
business services, communica-
tions, wholesale trade, and
construction. The job gains have
pushed the unemployment rate
in Orange County down to
3 percent as of June 1998.
In other signs of economic
strength, the county’s real estate
markets have rebounded sharply
during the past two years. Home
sales, home prices, and new
residential construction have
been climbing. Nonresidential
construction activity is also up sharply, reflecting
major increases associated with the construction of
industrial and office buildings.
Overall, Orange County is among the fastest
growing regions in the state in mid-1998, and all
signs point toward continued growth during 1999
and beyond.
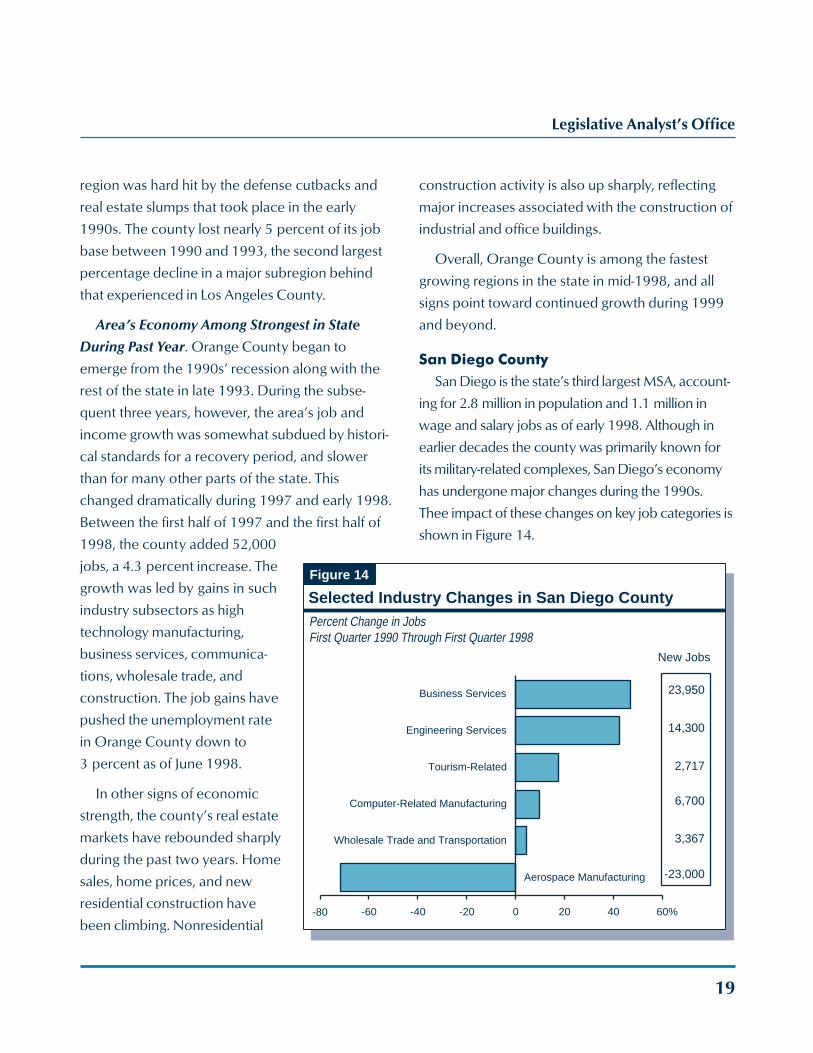
San Diego CountySan Diego is the state’s third largest MSA, account-
ing for 2.8 million in population and 1.1 million in
wage and salary jobs as of early 1998. Although in
earlier decades the county was primarily known for
its military-related complexes, San Diego’s economy
has undergone major changes during the 1990s.
Thee impact of these changes on key job categories is
shown in Figure 14.
Figure 14
Selected Industry Changes in San Diego CountyPercent Change in JobsFirst Quarter 1990 Through First Quarter 1998
New Jobs
3,367
-23,000
6,700
14,300
23,950
2,717
-80 -60 -40 -20 0 20 40 60%
Aerospace Manufacturing
Wholesale Trade and Transportation
Computer-Related Manufacturing
Tourism-Related
Engineering Services
Business Services
20
Major Declines in Aerospace Activity Have
Taken Place. In percentage terms, no other region
was harder hit than San Diego by the aerospace
cutbacks in the early 1990s. Between 1990 and
1995, San Diego lost most of its major aerospace
employers through industrial takeovers and consoli-
dations. As a result, employment in the aerospace
subsector dropped from 31,000 in 1988 to about
9,000 in 1998. The declines in this key industry in
the mid-1990s depressed job and income growth
during the early stages of the statewide economic
recovery.
At the same time, the region has seen significant
increases in several other major industries. Fig-
ure 14 shows that these include the business
services, engineering services, and computer-
related manufacturing industries. The figure also
shows that San Diego has experienced job in-
creases in wholesale trade and transportation
industries—which are related to expanded trade
with Mexico—as well as in tourism related industries.
Economy Currently Strong. The 1990s’ eco-
nomic expansion began somewhat unevenly in San
Diego. Due in part to the persistent job losses in
aerospace industries, the county faced concerns
that many of the new jobs being created were of
lower pay and benefits than those lost during the
aerospace cutbacks. However, the area’s economy
gained momentum in 1997, with many industries
posting job gains—including a variety of high
paying sectors such as engineering, software
development, health care technology, and biotech-
nology. The county is also experiencing a major
resurgence in building activity. The gains in both
residential and nonresidential construction activity
in 1998 are among the largest in the state. These
current positive trends appear likely to continue
through the end of the decade.
Ventura CountyVentura has a varied economic base, including
some defense and high technology businesses.
The county was one of the fastest growing regions
of the state in terms of population during the 1970s
and early 1980s, and its economic performance
reflected this in terms of gains in jobs and income.
Ventura’s economic growth rate in the 1990s,
however, has been fairly modest.
Ventura experienced a moderate downturn in
the early 1990s, primarily relating to losses in
defense and construction employment. Its
economy grew at a slow and uneven pace in the
early stages of the state’s post-recession recovery
and subsequent expansion, but has accelerated
during the past year. Industries contributing to this
strengthening include durable goods manufactur-
ing, trade, services, and construction. The unem-
ployment rate in the county stands at 4.9 percent,
somewhat below the statewide average.
TRENDS IN THE SAN FRANCISCO BAYAREA ECONOMIC REGION
The San Francisco Bay Area is the second
largest economic region in the state, accounting for
over one-fifth of California’s total population. As
shown in Figure 15, the region includes nine
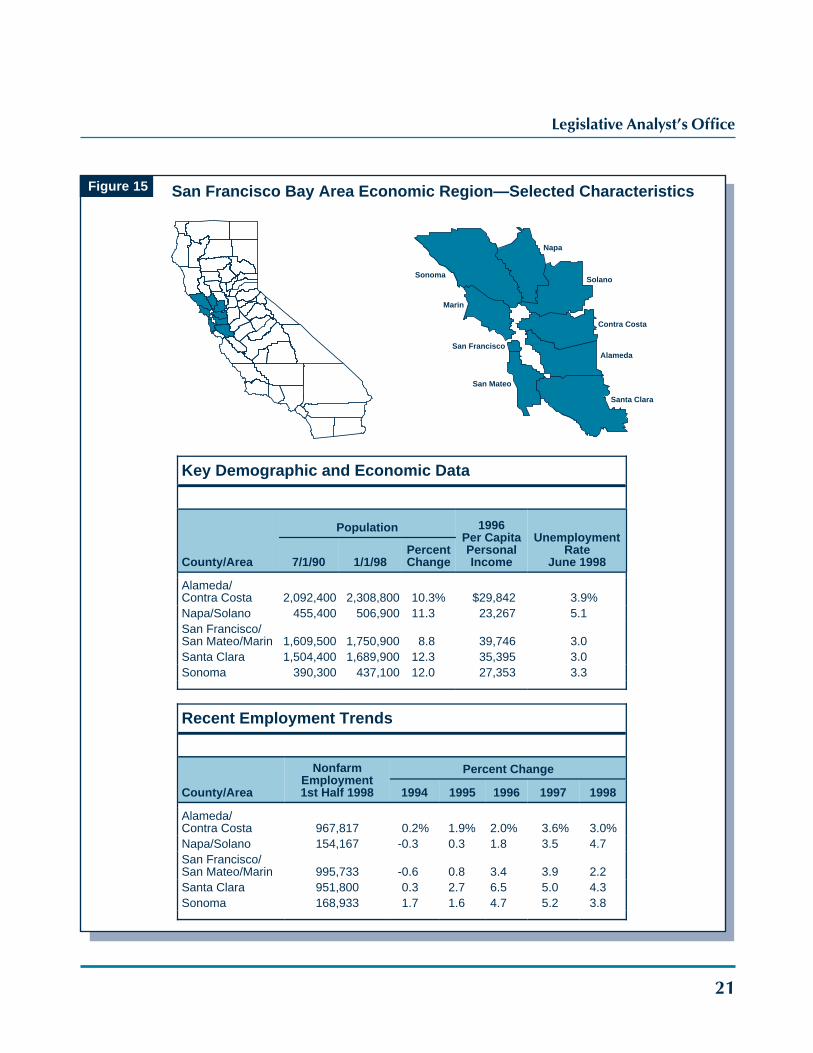
Legislative Analyst’s Office
21
Figure 15 San Francisco Bay Area Economic Region—Selected Characteristics
Sonoma
Napa
Solano
Marin
Contra Costa
Alameda
Santa Clara
San Mateo
San Francisco
Key Demographic and Economic Data
County/Area
Population 1996Per CapitaPersonalIncome
UnemploymentRate
June 19987/1/90 1/1/98PercentChange
Alameda/Contra Costa 2,092,400 2,308,800 10.3% $29,842 3.9%Napa/Solano 455,400 506,900 11.3 23,267 5.1San Francisco/San Mateo/Marin 1,609,500 1,750,900 8.8 39,746 3.0Santa Clara 1,504,400 1,689,900 12.3 35,395 3.0Sonoma 390,300 437,100 12.0 27,353 3.3
Recent Employment Trends
County/Area
NonfarmEmployment1st Half 1998
Percent Change
1994 1995 1996 1997 1998
Alameda/Contra Costa 967,817 0.2% 1.9% 2.0% 3.6% 3.0%Napa/Solano 154,167 -0.3 0.3 1.8 3.5 4.7San Francisco/San Mateo/Marin 995,733 -0.6 0.8 3.4 3.9 2.2Santa Clara 951,800 0.3 2.7 6.5 5.0 4.3Sonoma 168,933 1.7 1.6 4.7 5.2 3.8
22
counties, ranging from Santa Clara in the south to
Sonoma and Napa in the north. The majority of
workers and population are in three metropolitan
areas: (1) Santa Clara County, which is home to most
of the Silicon Valley; (2) the San Francisco MSA
(which includes San Francisco, Marin, and San Mateo
Counties); and (3) the Oakland MSA (which includes
Alameda and Contra Costa Counties).
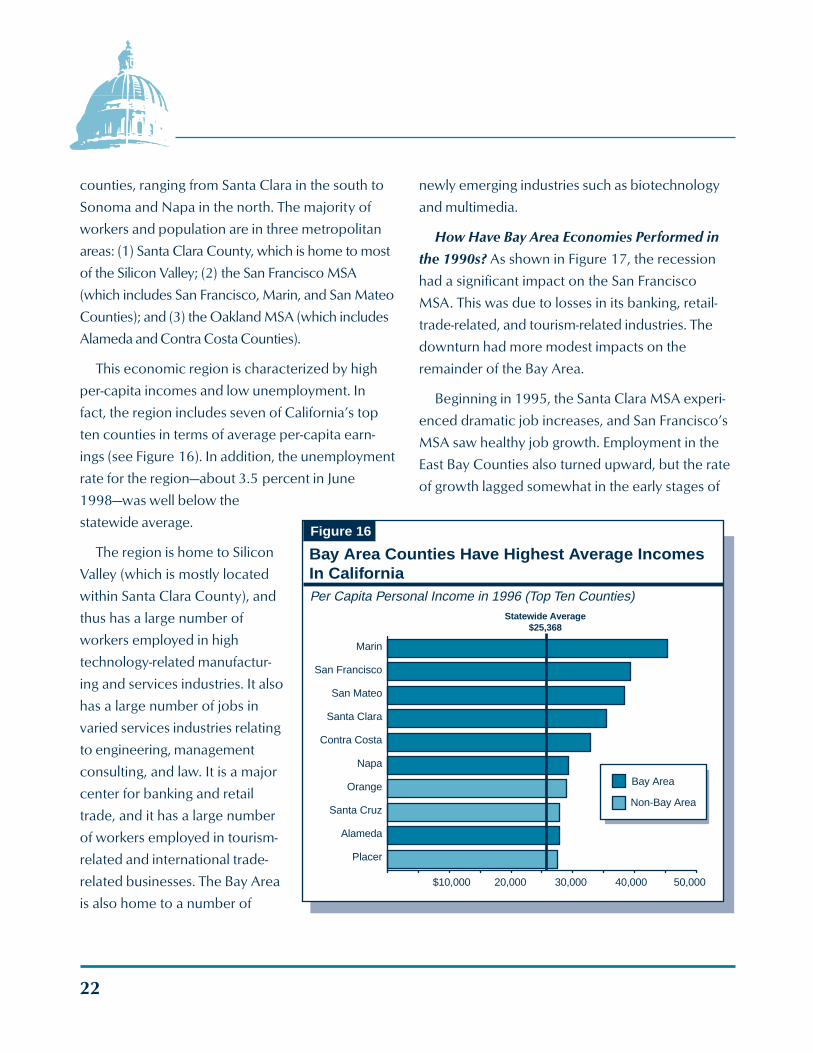
This economic region is characterized by high
per-capita incomes and low unemployment. In
fact, the region includes seven of California’s top
ten counties in terms of average per-capita earn-
ings (see Figure 16). In addition, the unemployment
rate for the region—about 3.5 percent in June
1998—was well below the
statewide average.
The region is home to Silicon
Valley (which is mostly located
within Santa Clara County), and
thus has a large number of
workers employed in high
technology-related manufactur-
ing and services industries. It also
has a large number of jobs in
varied services industries relating
to engineering, management
consulting, and law. It is a major
center for banking and retail
trade, and it has a large number
of workers employed in tourism-
related and international trade-
related businesses. The Bay Area
is also home to a number of
newly emerging industries such as biotechnology
and multimedia.
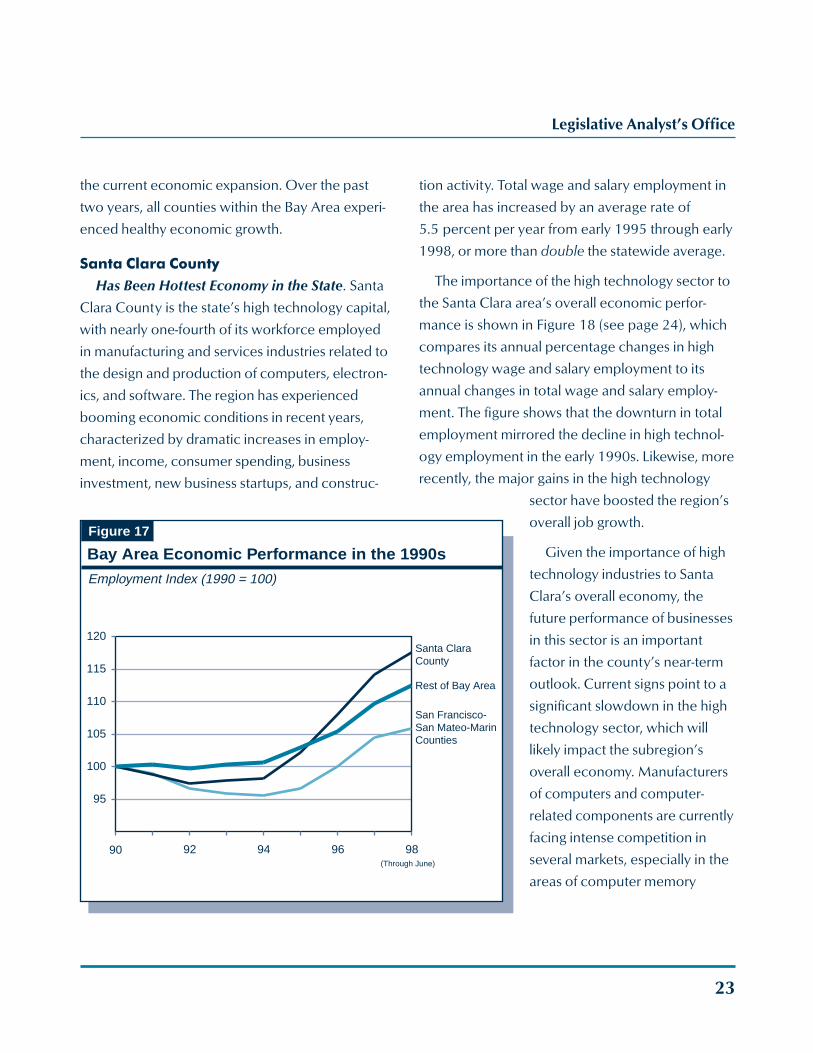
How Have Bay Area Economies Performed in
the 1990s? As shown in Figure 17, the recession
had a significant impact on the San Francisco
MSA. This was due to losses in its banking, retail-
trade-related, and tourism-related industries. The
downturn had more modest impacts on the
remainder of the Bay Area.
Beginning in 1995, the Santa Clara MSA experi-
enced dramatic job increases, and San Francisco’s
MSA saw healthy job growth. Employment in the
East Bay Counties also turned upward, but the rate
of growth lagged somewhat in the early stages of
Figure 16
Bay Area Counties Have Highest Average IncomesIn CaliforniaPer Capita Personal Income in 1996 (Top Ten Counties)
$10,000 20,000 30,000 40,000 50,000
Placer
Alameda
Santa Cruz
Orange
Napa
Contra Costa
Santa Clara
San Mateo
San Francisco
Marin
Statewide Average$25,368
Bay Area
Non-Bay Area
Legislative Analyst’s Office
23
the current economic expansion. Over the past
two years, all counties within the Bay Area experi-
enced healthy economic growth.
Santa Clara CountyHas Been Hottest Economy in the State. Santa
Clara County is the state’s high technology capital,
with nearly one-fourth of its workforce employed
in manufacturing and services industries related to
the design and production of computers, electron-
ics, and software. The region has experienced
booming economic conditions in recent years,
characterized by dramatic increases in employ-
ment, income, consumer spending, business
investment, new business startups, and construc-
tion activity. Total wage and salary employment in
the area has increased by an average rate of
5.5 percent per year from early 1995 through early
1998, or more than double the statewide average.
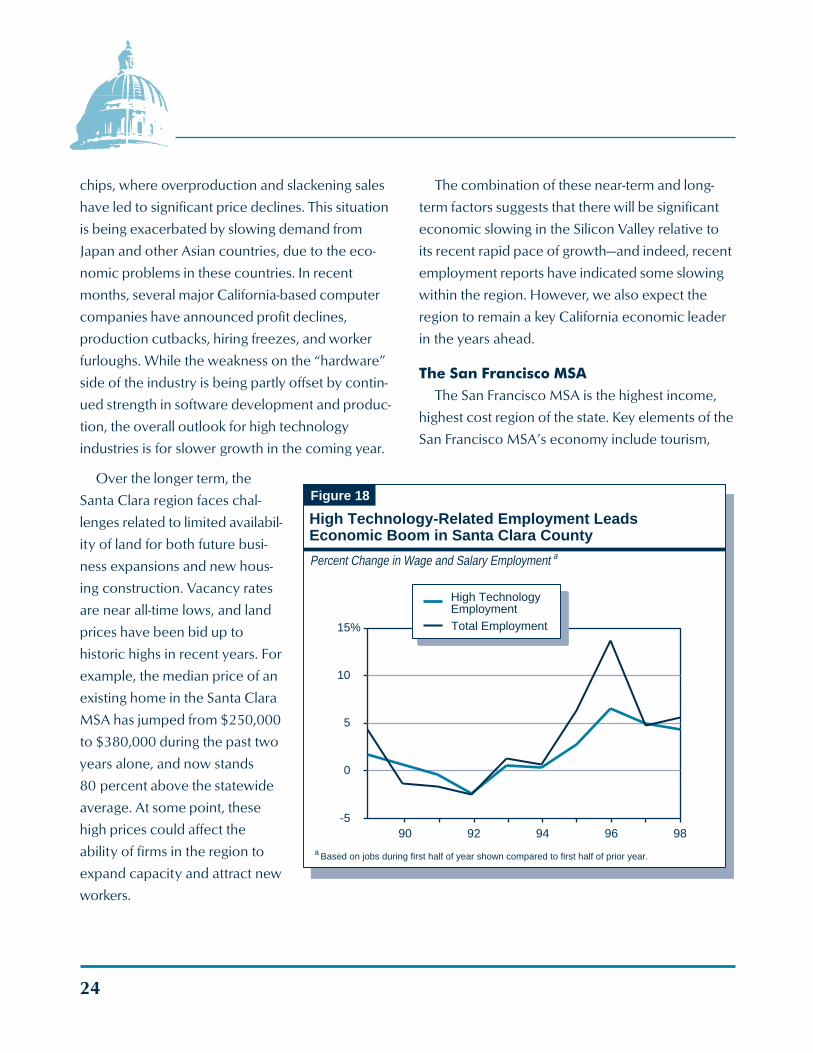
The importance of the high technology sector to
the Santa Clara area’s overall economic perfor-
mance is shown in Figure 18 (see page 24), which
compares its annual percentage changes in high
technology wage and salary employment to its
annual changes in total wage and salary employ-
ment. The figure shows that the downturn in total
employment mirrored the decline in high technol-
ogy employment in the early 1990s. Likewise, more
recently, the major gains in the high technology
sector have boosted the region’s
overall job growth.
Given the importance of high
technology industries to Santa
Clara’s overall economy, the
future performance of businesses
in this sector is an important
factor in the county’s near-term
outlook. Current signs point to a
significant slowdown in the high
technology sector, which will
likely impact the subregion’s
overall economy. Manufacturers
of computers and computer-
related components are currently
facing intense competition in
several markets, especially in the
areas of computer memory
Figure 17
Bay Area Economic Performance in the 1990s
Employment Index (1990 = 100)
Santa ClaraCounty
Rest of Bay Area
San Francisco-San Mateo-MarinCounties
(Through June)
95
100
105
110
115
120
90 92 94 96 98
24
chips, where overproduction and slackening sales
have led to significant price declines. This situation
is being exacerbated by slowing demand from
Japan and other Asian countries, due to the eco-
nomic problems in these countries. In recent
months, several major California-based computer
companies have announced profit declines,
production cutbacks, hiring freezes, and worker
furloughs. While the weakness on the “hardware”
side of the industry is being partly offset by contin-
ued strength in software development and produc-
tion, the overall outlook for high technology
industries is for slower growth in the coming year.
Over the longer term, the
Santa Clara region faces chal-
lenges related to limited availabil-
ity of land for both future busi-
ness expansions and new hous-
ing construction. Vacancy rates
are near all-time lows, and land
prices have been bid up to
historic highs in recent years. For
example, the median price of an
existing home in the Santa Clara
MSA has jumped from $250,000
to $380,000 during the past two
years alone, and now stands
80 percent above the statewide
average. At some point, these
high prices could affect the
ability of firms in the region to
expand capacity and attract new
workers.
The combination of these near-term and long-
term factors suggests that there will be significant
economic slowing in the Silicon Valley relative to
its recent rapid pace of growth—and indeed, recent
employment reports have indicated some slowing
within the region. However, we also expect the
region to remain a key California economic leader
in the years ahead.
The San Francisco MSAThe San Francisco MSA is the highest income,
highest cost region of the state. Key elements of the
San Francisco MSA’s economy include tourism,
Figure 18
High Technology-Related Employment Leads Economic Boom in Santa Clara County
Percent Change in Wage and Salary Employment
90 92 94 96 98-5
0
5
10
15%
a
Based on jobs during first half of year shown compared to first half of prior year.a
High TechnologyEmploymentTotal Employment
Legislative Analyst’s Office
25
professional services, international trade, and
finance. The San Francisco area also has a bur-
geoning multimedia industry.
Recent Job Growth Has Been Uncharacteristi-
cally Strong. After contracting by nearly 5 percent
between 1990 and 1994, the San Francisco MSA’s
economy turned upward in 1994, and accelerated
sharply beginning in 1995. For example, wage and
salary employment registered a 3.9 percent rise
between 1996 and 1997, before moderating to a
2.2 percent increase over the past year. These
gains have been led by rising international trade
activity, high levels of tourism and convention-
related spending, and growth in business and
professional services jobs. Even after accounting
for the slowdown over the past year, the recent job
performance has been quite
strong, given that the San Fran-
cisco economy is considered to
be a “mature” one. (That is, it is
characterized by little unused
land for population growth and
further development.) Unem-
ployment in the San Francisco
MSA had dropped to 3 percent
as of mid-1998—among the
lowest levels in the state.
The East Bay andNorth Bay
Although the East Bay and
North Bay Counties in the
overall San Francisco Bay Area
region experienced only a
modest economic downturn in the early 1990s,
growth in these areas lagged during the early
stages of the current economic expansion. This is
partly due to the closure of the Alameda Naval Air
Station and the Mare Island Naval Shipyard, which
had employed a large number of civilian person-
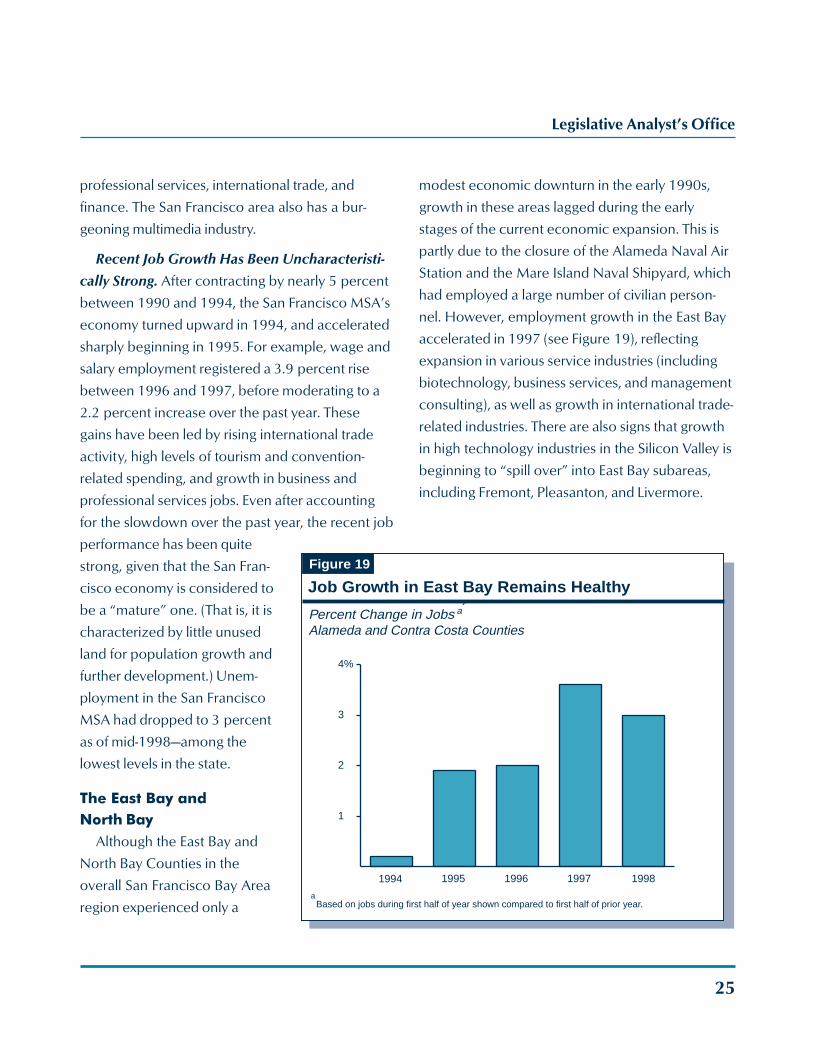
nel. However, employment growth in the East Bay
accelerated in 1997 (see Figure 19), reflecting
expansion in various service industries (including
biotechnology, business services, and management
consulting), as well as growth in international trade-
related industries. There are also signs that growth
in high technology industries in the Silicon Valley is
beginning to “spill over” into East Bay subareas,
including Fremont, Pleasanton, and Livermore.
Figure 19
Job Growth in East Bay Remains Healthy
Percent Change in JobsAlameda and Contra Costa Counties
1
2
3
4%
1994 1995 1996 1997 1998
a
Based on jobs during first half of year shown compared to first half of prior year.a
26
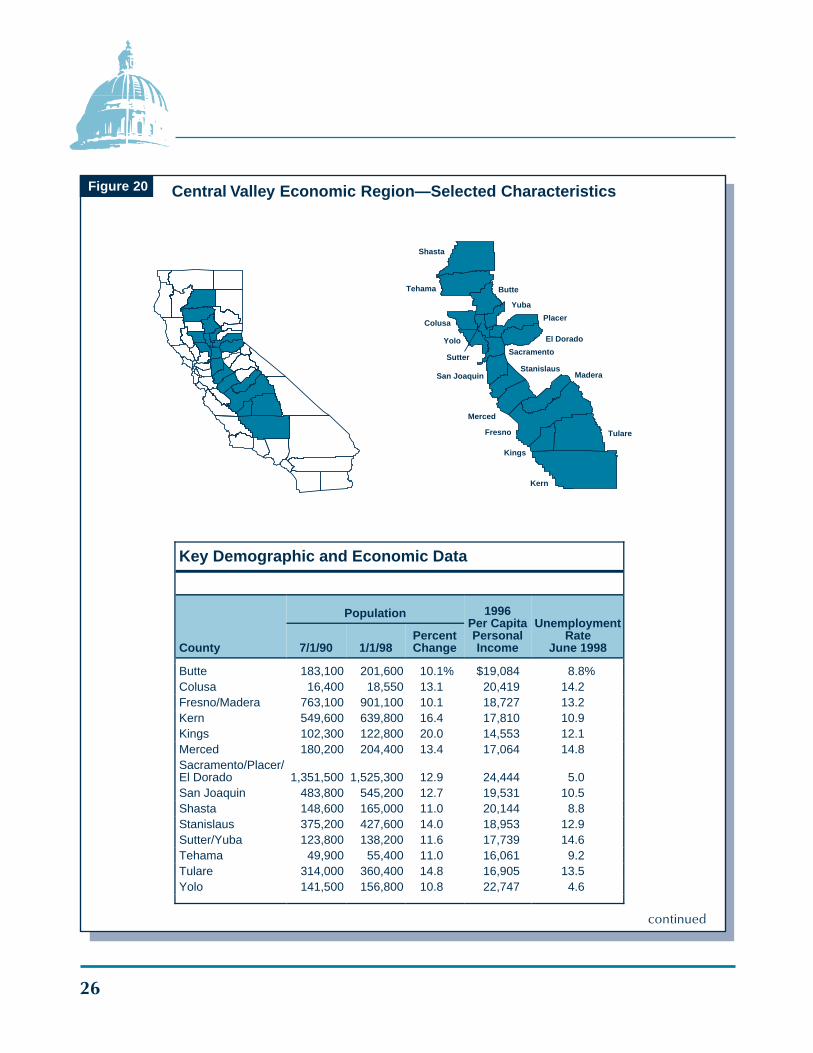
Figure 20 Central Valley Economic Region—Selected Characteristics
Butte
Colusa
Tehama
Shasta
Sutter
Yolo
Yuba
Placer
El Dorado
Sacramento
San JoaquinStanislaus
Madera
Merced
Fresno Tulare
Kings
Kern
Key Demographic and Economic Data
County
Population 1996Per CapitaPersonalIncome
UnemploymentRate
June 19987/1/90 1/1/98PercentChange
Butte 183,100 201,600 10.1% $19,084 8.8%Colusa 16,400 18,550 13.1 20,419 14.2Fresno/Madera 763,100 901,100 10.1 18,727 13.2Kern 549,600 639,800 16.4 17,810 10.9Kings 102,300 122,800 20.0 14,553 12.1Merced 180,200 204,400 13.4 17,064 14.8Sacramento/Placer/El Dorado 1,351,500 1,525,300 12.9 24,444 5.0San Joaquin 483,800 545,200 12.7 19,531 10.5Shasta 148,600 165,000 11.0 20,144 8.8Stanislaus 375,200 427,600 14.0 18,953 12.9Sutter/Yuba 123,800 138,200 11.6 17,739 14.6Tehama 49,900 55,400 11.0 16,061 9.2Tulare 314,000 360,400 14.8 16,905 13.5Yolo 141,500 156,800 10.8 22,747 4.6
continued
Legislative Analyst’s Office
27
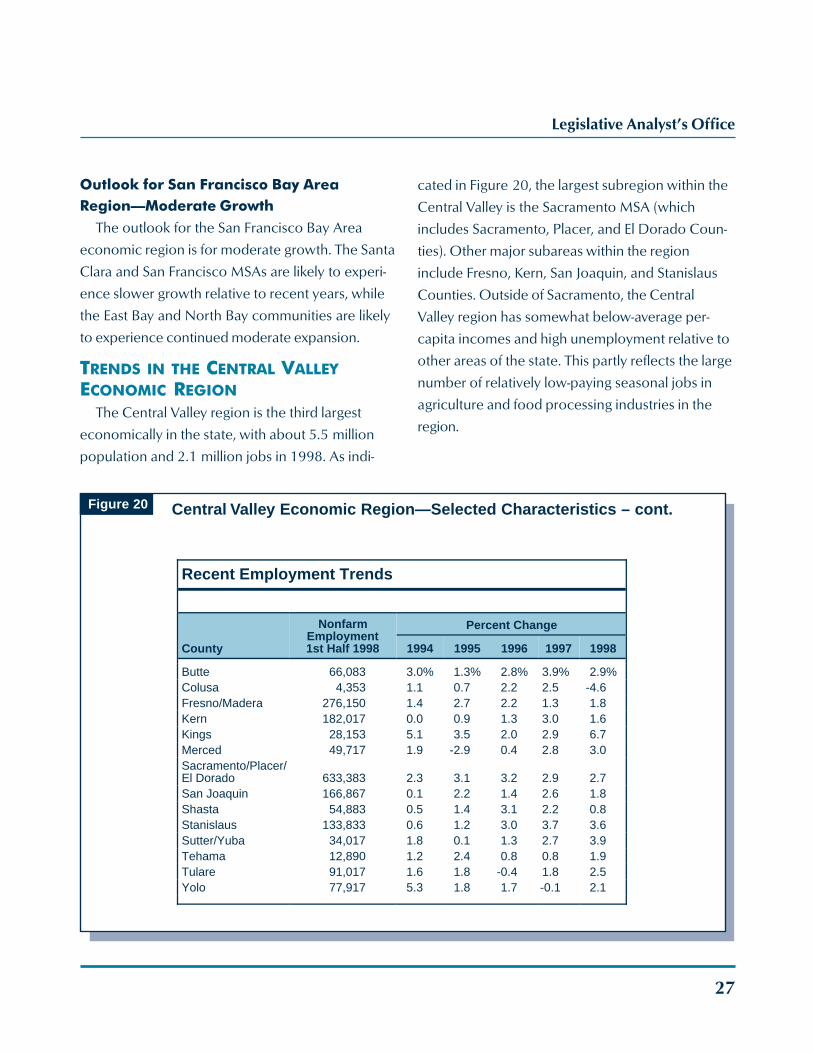
Figure 20 Central Valley Economic Region—Selected Characteristics – cont.
Outlook for San Francisco Bay AreaRegion—Moderate Growth
The outlook for the San Francisco Bay Area
economic region is for moderate growth. The Santa
Clara and San Francisco MSAs are likely to experi-
ence slower growth relative to recent years, while
the East Bay and North Bay communities are likely
to experience continued moderate expansion.
TRENDS IN THE CENTRAL VALLEYECONOMIC REGION
The Central Valley region is the third largest
economically in the state, with about 5.5 million
population and 2.1 million jobs in 1998. As indi-
cated in Figure 20, the largest subregion within the
Central Valley is the Sacramento MSA (which
includes Sacramento, Placer, and El Dorado Coun-
ties). Other major subareas within the region
include Fresno, Kern, San Joaquin, and Stanislaus
Counties. Outside of Sacramento, the Central
Valley region has somewhat below-average per-
capita incomes and high unemployment relative to
other areas of the state. This partly reflects the large
number of relatively low-paying seasonal jobs in
agriculture and food processing industries in the
region.
Recent Employment Trends
County
NonfarmEmployment1st Half 1998
Percent Change
1994 1995 1996 1997 1998
Butte 66,083 3.0% 1.3% 2.8% 3.9% 2.9%Colusa 4,353 1.1 0.7 2.2 2.5 -4.6Fresno/Madera 276,150 1.4 2.7 2.2 1.3 1.8Kern 182,017 0.0 0.9 1.3 3.0 1.6Kings 28,153 5.1 3.5 2.0 2.9 6.7Merced 49,717 1.9 -2.9 0.4 2.8 3.0Sacramento/Placer/El Dorado 633,383 2.3 3.1 3.2 2.9 2.7San Joaquin 166,867 0.1 2.2 1.4 2.6 1.8Shasta 54,883 0.5 1.4 3.1 2.2 0.8Stanislaus 133,833 0.6 1.2 3.0 3.7 3.6Sutter/Yuba 34,017 1.8 0.1 1.3 2.7 3.9Tehama 12,890 1.2 2.4 0.8 0.8 1.9Tulare 91,017 1.6 1.8 -0.4 1.8 2.5Yolo 77,917 5.3 1.8 1.7 -0.1 2.1
28
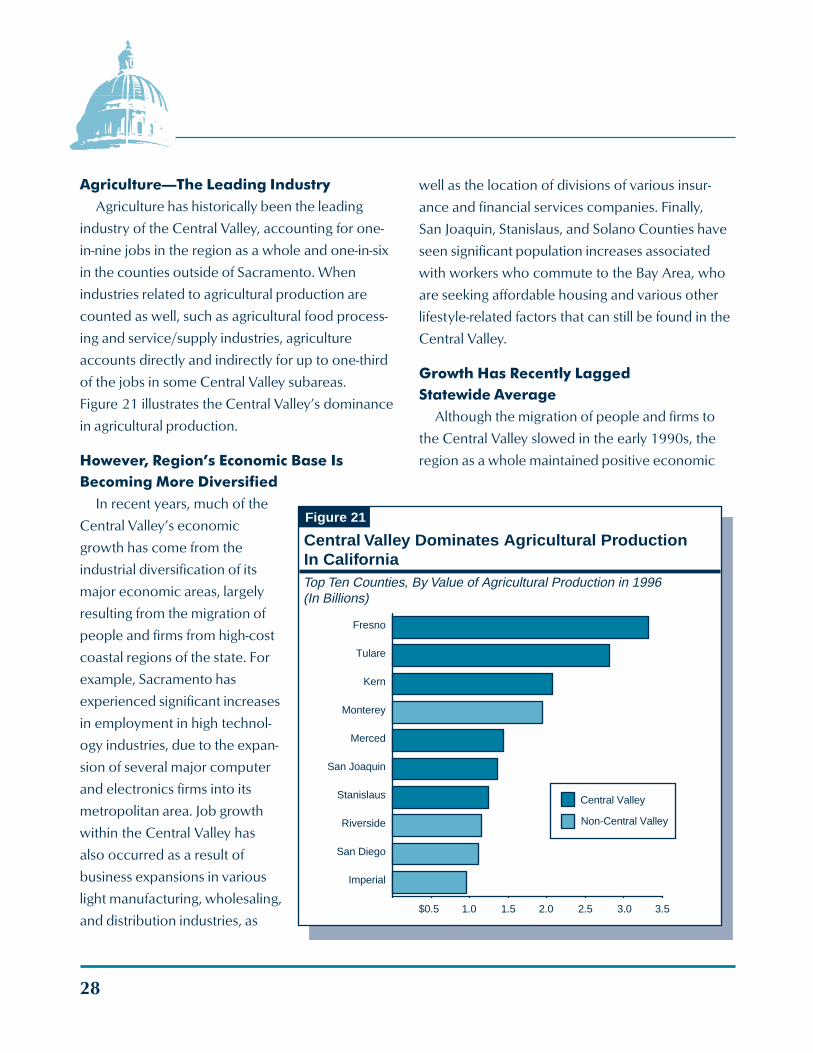
Agriculture—The Leading IndustryAgriculture has historically been the leading
industry of the Central Valley, accounting for one-
in-nine jobs in the region as a whole and one-in-six
in the counties outside of Sacramento. When
industries related to agricultural production are
counted as well, such as agricultural food process-
ing and service/supply industries, agriculture
accounts directly and indirectly for up to one-third
of the jobs in some Central Valley subareas.
Figure 21 illustrates the Central Valley’s dominance
in agricultural production.
However, Region’s Economic Base IsBecoming More Diversified
In recent years, much of the
Central Valley’s economic
growth has come from the
industrial diversification of its
major economic areas, largely
resulting from the migration of
people and firms from high-cost
coastal regions of the state. For
example, Sacramento has
experienced significant increases
in employment in high technol-
ogy industries, due to the expan-
sion of several major computer
and electronics firms into its
metropolitan area. Job growth
within the Central Valley has
also occurred as a result of
business expansions in various
light manufacturing, wholesaling,
and distribution industries, as
well as the location of divisions of various insur-
ance and financial services companies. Finally,
San Joaquin, Stanislaus, and Solano Counties have
seen significant population increases associated
with workers who commute to the Bay Area, who
are seeking affordable housing and various other
lifestyle-related factors that can still be found in the
Central Valley.
Growth Has Recently LaggedStatewide Average
Although the migration of people and firms to
the Central Valley slowed in the early 1990s, the
region as a whole maintained positive economic
Figure 21
Central Valley Dominates Agricultural ProductionIn CaliforniaTop Ten Counties, By Value of Agricultural Production in 1996(In Billions)
$0.5 1.0 1.5 2.0 2.5 3.0 3.5
Imperial
San Diego
Riverside
Stanislaus
San Joaquin
Merced
Monterey
Kern
Tulare
Fresno
Central Valley
Non-Central Valley
Legislative Analyst’s Office
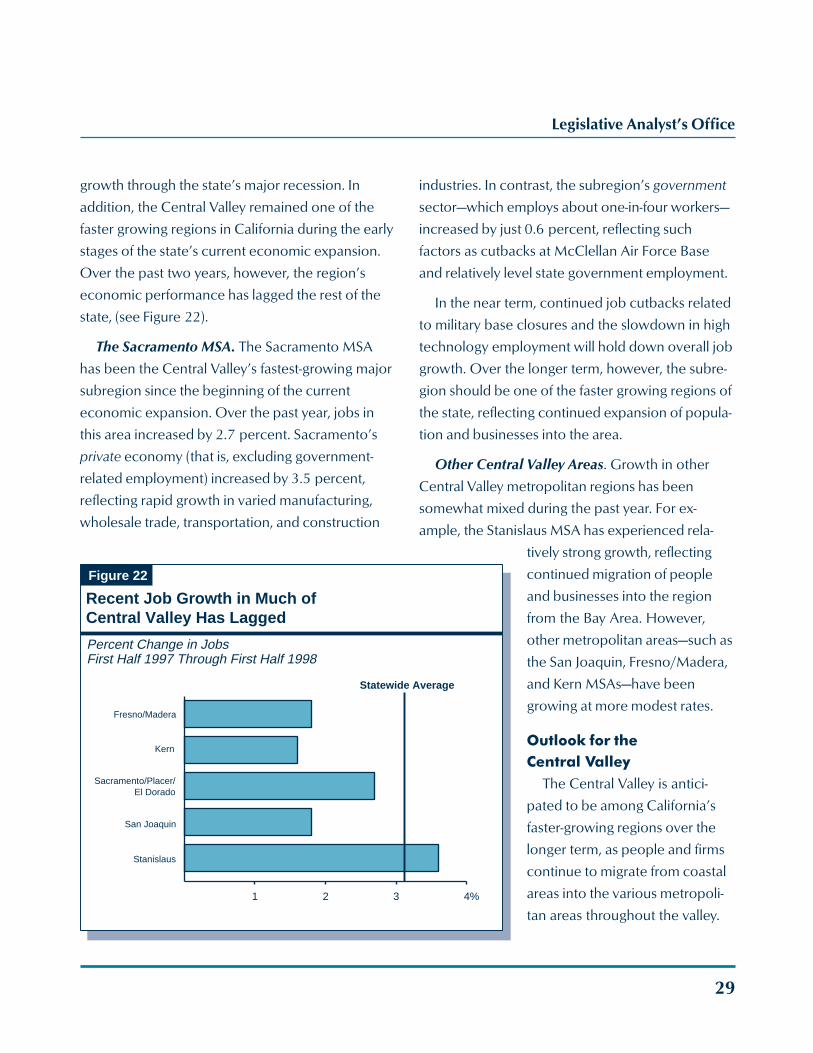
29
growth through the state’s major recession. In
addition, the Central Valley remained one of the
faster growing regions in California during the early
stages of the state’s current economic expansion.
Over the past two years, however, the region’s
economic performance has lagged the rest of the
state, (see Figure 22).
The Sacramento MSA. The Sacramento MSA
has been the Central Valley’s fastest-growing major
subregion since the beginning of the current
economic expansion. Over the past year, jobs in
this area increased by 2.7 percent. Sacramento’s
private economy (that is, excluding government-
related employment) increased by 3.5 percent,
reflecting rapid growth in varied manufacturing,
wholesale trade, transportation, and construction
industries. In contrast, the subregion’s government
sector—which employs about one-in-four workers—
increased by just 0.6 percent, reflecting such
factors as cutbacks at McClellan Air Force Base
and relatively level state government employment.
In the near term, continued job cutbacks related
to military base closures and the slowdown in high
technology employment will hold down overall job
growth. Over the longer term, however, the subre-
gion should be one of the faster growing regions of
the state, reflecting continued expansion of popula-
tion and businesses into the area.
Other Central Valley Areas. Growth in other
Central Valley metropolitan regions has been
somewhat mixed during the past year. For ex-
ample, the Stanislaus MSA has experienced rela-
tively strong growth, reflecting
continued migration of people
and businesses into the region
from the Bay Area. However,
other metropolitan areas—such as
the San Joaquin, Fresno/Madera,
and Kern MSAs—have been
growing at more modest rates.
Outlook for theCentral Valley
The Central Valley is antici-
pated to be among California’s
faster-growing regions over the
longer term, as people and firms
continue to migrate from coastal
areas into the various metropoli-
tan areas throughout the valley.
Figure 22
Recent Job Growth in Much of Central Valley Has Lagged
Percent Change in JobsFirst Half 1997 Through First Half 1998
Stanislaus
San Joaquin
Sacramento/Placer/El Dorado
Kern
Fresno/Madera
1 2 3 4%
Statewide Average
30
Figure 23 Central Coast Economic Region—Selected Characteristics
Santa Cruz
San Benito
Monterey
San LuisObispo
Santa Barbara
Key Demographic and Economic Data
County
Population 1996Per CapitaPersonalIncome
UnemploymentRate
June 19987/1/90 1/1/98PercentChange
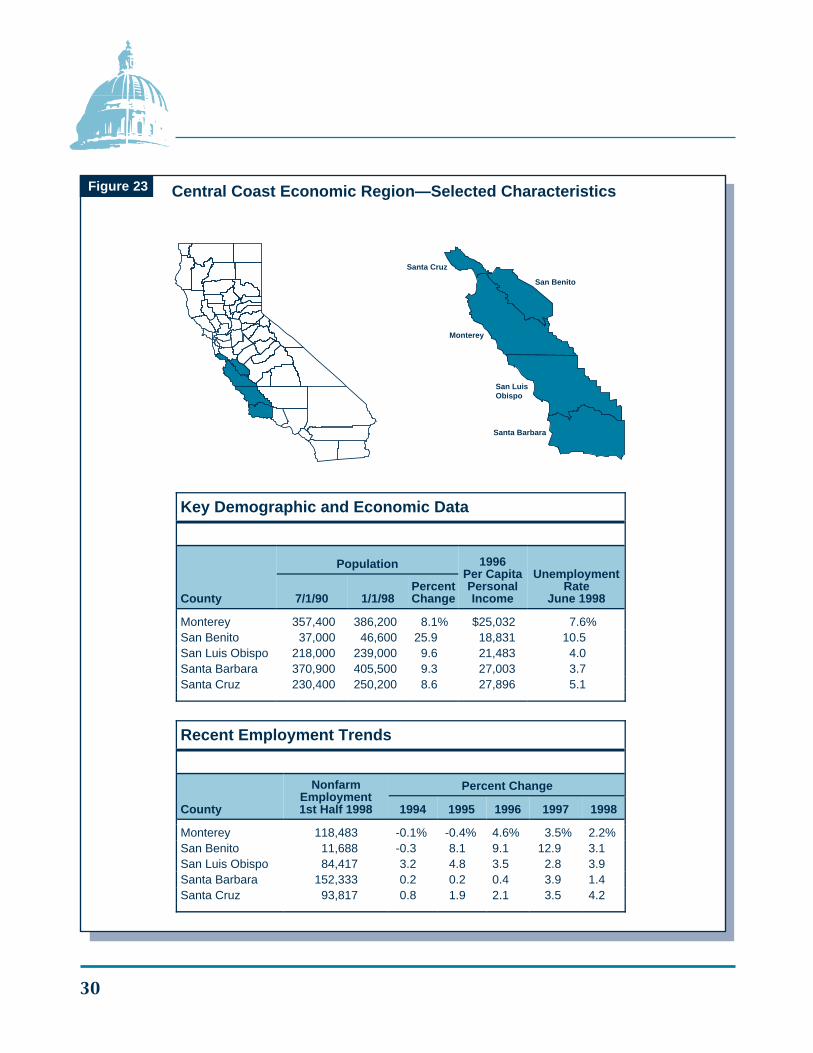
Monterey 357,400 386,200 8.1% $25,032 7.6%San Benito 37,000 46,600 25.9 18,831 10.5San Luis Obispo 218,000 239,000 9.6 21,483 4.0Santa Barbara 370,900 405,500 9.3 27,003 3.7Santa Cruz 230,400 250,200 8.6 27,896 5.1
Recent Employment Trends
County
NonfarmEmployment1st Half 1998
Percent Change
1994 1995 1996 1997 1998
Monterey 118,483 -0.1% -0.4% 4.6% 3.5% 2.2%San Benito 11,688 -0.3 8.1 9.1 12.9 3.1San Luis Obispo 84,417 3.2 4.8 3.5 2.8 3.9Santa Barbara 152,333 0.2 0.2 0.4 3.9 1.4Santa Cruz 93,817 0.8 1.9 2.1 3.5 4.2
Legislative Analyst’s Office
31
With high and rising home costs and other capac-
ity constraints in the Bay Area, a significant amount
of the underlying growth in that region is likely to
spill over into the Central Valley in the years ahead.
A key issue for the Central Valley will involve land
use decisions relating to tradeoffs between agricul-
tural, industrial, commercial, and residential
growth.
TRENDS IN THE CENTRAL COASTECONOMIC REGION
As shown in Figure 23, the Central Coast eco-
nomic region includes the counties of Santa
Barbara, San Luis Obispo, Monterey, San Benito,
and Santa Cruz. Together, these counties account
for about 1.3 million of the state’s population and
about one-half million of its total employment base.
The main industries in the region include: tourism;
computer, electronics and software-related services
(which are mostly centered in the Santa Barbara
and Santa Cruz areas); aerospace (which is cen-
tered in Santa Barbara County adjacent to
Vandenberg Air Force Base); and agriculture
(which is centered in Monterey County, the fourth
largest agricultural county in California).
In addition, there are a large number of employ-
ees working on and around the campuses of both
the University of California (in Santa Barbara and
Santa Cruz) and the California State University (in
San Luis Obispo and, more recently, Fort Ord in
Monterey).
The early 1990s’ recession resulted in modest
employment reductions in various manufacturing,
retail trade, tourism-related, services, finance, and
construction industries in the Central Coast region.
Also, defense-related reductions had a significant
adverse impact on the region. For example,
Monterey County was affected by the closure of
the Fort Ord Army Base, while cutbacks by de-
fense contractors lowered aerospace employment
in Santa Barbara County. Overall, wage and salary
employment in the Central Coast region fell by
about 3 percent between 1990 and 1993.
In more recent years, the Central Coast has
expanded in line with California’s overall economy.
Employment growth over the past year has ranged
from 1.4 percent (in Santa Barbara County) to
4.2 percent (in Santa Cruz County), reflecting
increases in services, trade, and manufacturing
industries.
32
Figure 24 Rest-of-State Economic Region—Selected Characteristics
Alpine
Amador
Calaveras
Del Norte
Glenn
Humboldt
Imperial
Inyo
Lake
Lassen
Mariposa1
7
3
9
5
11
2
8
4
10
6
14
13
16
18
12
15
17
19
20
12
3
4
5
6
7
8
9
10
11
12
13
14
15
16
18
19
21
22
Mendocino
Modoc
Mono
Nevada
Plumas
Sierra
Siskiyou
Trinity
Tuolumne
Key Demographic and Economic Data
County
Population
1996 Per CapitaPersonal Income
UnemploymentRate June 19987/1/90 1/1/98
PercentChange
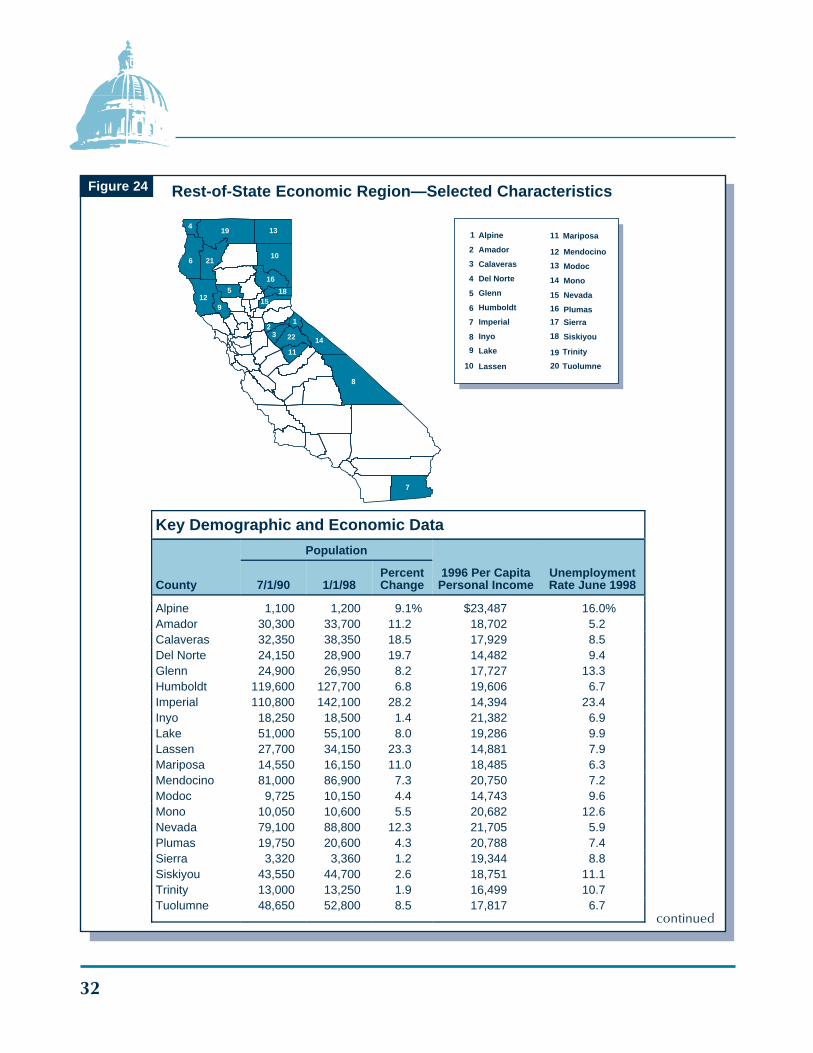
Alpine 1,100 1,200 9.1% $23,487 16.0%Amador 30,300 33,700 11.2 18,702 5.2Calaveras 32,350 38,350 18.5 17,929 8.5Del Norte 24,150 28,900 19.7 14,482 9.4Glenn 24,900 26,950 8.2 17,727 13.3Humboldt 119,600 127,700 6.8 19,606 6.7Imperial 110,800 142,100 28.2 14,394 23.4Inyo 18,250 18,500 1.4 21,382 6.9Lake 51,000 55,100 8.0 19,286 9.9Lassen 27,700 34,150 23.3 14,881 7.9Mariposa 14,550 16,150 11.0 18,485 6.3Mendocino 81,000 86,900 7.3 20,750 7.2Modoc 9,725 10,150 4.4 14,743 9.6Mono 10,050 10,600 5.5 20,682 12.6Nevada 79,100 88,800 12.3 21,705 5.9Plumas 19,750 20,600 4.3 20,788 7.4Sierra 3,320 3,360 1.2 19,344 8.8Siskiyou 43,550 44,700 2.6 18,751 11.1Trinity 13,000 13,250 1.9 16,499 10.7Tuolumne 48,650 52,800 8.5 17,817 6.7
continued
Legislative Analyst’s Office
33
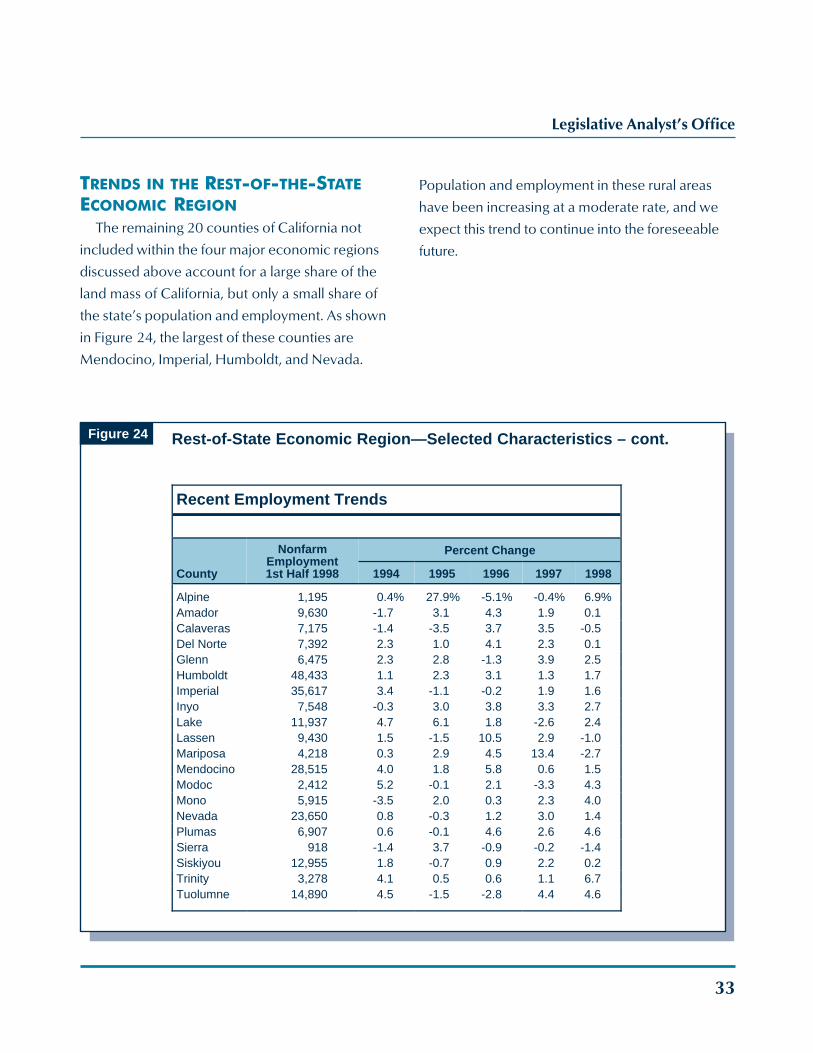
Figure 24 Rest-of-State Economic Region—Selected Characteristics – cont.
TRENDS IN THE REST-OF-THE-STATEECONOMIC REGION
The remaining 20 counties of California not
included within the four major economic regions
discussed above account for a large share of the
land mass of California, but only a small share of
the state’s population and employment. As shown
in Figure 24, the largest of these counties are
Mendocino, Imperial, Humboldt, and Nevada.
Population and employment in these rural areas
have been increasing at a moderate rate, and we
expect this trend to continue into the foreseeable
future.
Recent Employment Trends
County
NonfarmEmployment1st Half 1998
Percent Change
1994 1995 1996 1997 1998
Alpine 1,195 0.4% 27.9% -5.1% -0.4% 6.9%Amador 9,630 -1.7 3.1 4.3 1.9 0.1Calaveras 7,175 -1.4 -3.5 3.7 3.5 -0.5Del Norte 7,392 2.3 1.0 4.1 2.3 0.1Glenn 6,475 2.3 2.8 -1.3 3.9 2.5Humboldt 48,433 1.1 2.3 3.1 1.3 1.7Imperial 35,617 3.4 -1.1 -0.2 1.9 1.6Inyo 7,548 -0.3 3.0 3.8 3.3 2.7Lake 11,937 4.7 6.1 1.8 -2.6 2.4Lassen 9,430 1.5 -1.5 10.5 2.9 -1.0Mariposa 4,218 0.3 2.9 4.5 13.4 -2.7Mendocino 28,515 4.0 1.8 5.8 0.6 1.5Modoc 2,412 5.2 -0.1 2.1 -3.3 4.3Mono 5,915 -3.5 2.0 0.3 2.3 4.0Nevada 23,650 0.8 -0.3 1.2 3.0 1.4Plumas 6,907 0.6 -0.1 4.6 2.6 4.6Sierra 918 -1.4 3.7 -0.9 -0.2 -1.4Siskiyou 12,955 1.8 -0.7 0.9 2.2 0.2Trinity 3,278 4.1 0.5 0.6 1.1 6.7Tuolumne 14,890 4.5 -1.5 -2.8 4.4 4.6
34
IMPLICATIONS OF CALIFORNIA’S RENEWEDECONOMIC GROWTH
During California’s deep and prolonged 1990s’
recession, concerns emerged about whether
California’s growth prospects had permanently
deteriorated. The healthy and diversified economic
growth that has emerged over the past two years
indicates that the state remains economically
competitive with other geographic regions of the
country.
With this economic improvement comes a
major shift in the types of challenges facing state
and local policymakers. In contrast to the early
1990s, when the focus was on controlling budget-
ary deficits and retaining jobs and businesses in
California, the main challenge in future years is
likely to involve accommodating the significant
demographic and economic growth that will
inevitably occur over the next decade. The improv-
ing economy has already resulted in an accelera-
tion in statewide population growth, and such
higher growth trends will likely continue. The more
rapid growth in the state’s economy and popula-
tion bring back to the forefront many of the
growth-related issues and challenges which were
somewhat dormant during the early 1990s—issues
and challenges in areas such as land use planning,
education, air and water quality, water supplies,
transportation, and other infrastructure.
The key challenge facing state policymakers will
be to develop an appropriate mix of spending,
regulatory, and tax policies that will both sustain
economic growth, and address the challenges
posed by such growth in the future.

Legislative Analyst’s Office
35
Acknowledgments
This report was prepared by Brad Williams,with assistance from Robert Ingenito, andreviewed by David Vasché. The LegislativeAnalyst’s Office (LAO) is a nonpartisan officewhich provides fiscal and policy informationand advice to the Legislature.
LAO Publications
To request publications call (916) 445-2375.
This report and others, as well as an E-mailsubscription service, are available on theLAO’s World Wide Web site at http://www.lao.ca.gov. The LAO is located at 925L Street, Suite 1000, Sacramento, CA95814.
v
36
Recent Publications
Higher Education Enrollments: Is a Tidal WaveComing? (February 1998).
Taking Advantage of New Federal Higher EducationTax Credits (February 1998).
After the Transportation Blueprint: Developing andFunding and Efficient Transportation System(March 5, 1998)
Medi-Cal Managed Care Has Not Had an AdverseEffect on Rural Health Care Clinics(March 16, 1998)
Why County Revenues Vary: State Laws and LocalCondition Affecting County Finance (May 7, 1998)
California Counties A Look at Program Performance(May 1998)
A Primer on the Vehicle License Fee (June 17, 1998)
Reviews of Medi-Cal Managed Care Plans ShowDisappointing Results (August 1998)
State Superfund Reauthorization ExpeditingHazardous Substance Site Cleanups(August 17, 1998)
Major Features of the 1998 California Budget(August 24, 1998)
What the New Federal Act Means for CaliforniaTransportation Equity Act for the 21st Century(August 26, 1998)
Forthcoming Publications
California Spending Plan: The Budget Act andRelated Legislation (October 1998)
California’s Fiscal Outlook: The LAO’s Economicand Budget Projections, 1998-99 through 2000-01(November 1998)