LANKA ORIX LEASING COMPANY PLC · Lanka Orix Leasing Company PLC Statement of Financial Position As...
17
0 LANKA ORIX LEASING COMPANY PLC INTERIM FINANCIAL STATEMENTS YEAR ENDED 31 MARCH 2017
Transcript of LANKA ORIX LEASING COMPANY PLC · Lanka Orix Leasing Company PLC Statement of Financial Position As...
0
LANKA ORIX LEASING COMPANY PLCINTERIM FINANCIAL STATEMENTS
YEAR ENDED 31 MARCH 2017

Lanka Orix Leasing Company PLC
Interim Financial Statements
For the year ended 31 March 2017
Content
1 Statement of Financial Position
2 Statement of Profit or Loss
3 Statement of Other Comprehensive Income
4 Statement of Changes in Equity
5 Statement of Cash Flows
6 Notes to the Interim Financial Statements
7 Operating Segments
8 Valuation of Financial Assets and Liabilities
9
10 Top 20 Shareholders
Statement of Directors' Holding and Chief Executive Officer’s holding in Shares of the Entity

Lanka Orix Leasing Company PLC
Statement of Financial Position
As at 31-Mar-17 31-Mar-16 31-Mar-17 31-Mar-16
Rs'000 Rs'000 Rs'000 Rs'000
Un-audited Audited Un-audited Audited
Assets
Cash and cash equivalents 54,215,239 13,725,794 460,015 63,407
Trading assets - fair value through profit or loss 4,649,565 2,397,547 453,205 420,126
Investment securities 54,379,321 60,951,440 348,508 684,543
Finance lease receivables, hire purchases and operating leases 51,886,988 51,666,748 4,422 8,920
Advances and other loans 366,809,380 161,116,017 785,110 1,774,112
Insurance premium receivables 1,080,757 801,165 - -
Inventories 4,070,520 3,645,281 364,029 462,760
Current tax assets 1,404,427 1,011,854 131,566 178,334
Trade and other current assets 14,979,118 10,480,953 26,262,575 16,524,924
Prepaid lease rentals on leasehold properties 741,279 742,535 - -
Investment properties 12,684,514 9,073,216 376,600 353,000
Real estate stocks - -
Biological Assets;
Consumable Biological Assets 2,984,091 6,150,990 - -
Bearer Biological Assets 1,151,490 4,811,353 - -
Investments in group companies;
Subsidiary companies - - 61,670,678 42,615,931
Jointly controlled entities - - - -
Equity accounted investees - Associates 15,764,523 16,493,637 4,314,001 7,816,377
Deferred tax assets 1,492,249 490,243 - 80
Intangible assets 13,299,451 2,482,046 203,085 210,021
Property, plant and equipment 39,331,927 33,553,739 6,633,568 4,381,379
Total assets 640,924,839 379,594,558 102,007,362 75,493,914
Liabilities and equity
Liabilities
Bank overdrafts 7,365,332 9,302,310 1,691,299 3,354,589
Trading liabilities - fair value through profit or loss 65,287 17,859 1,252 -
Deposits liabilities 211,128,007 74,165,732 - -
Interest bearing borrowings 286,749,284 205,774,163 51,006,998 35,014,816
Insurance provision - life 2,048,421 1,519,563 - -
Insurance provision - general 2,729,985 2,136,529 - -
Current tax payables 3,636,203 2,084,537 623,434 322,774
Trade and other payables 17,682,263 11,572,669 1,238,198 1,115,435
Deferred tax liabilities 4,492,485 3,930,668 219,926 -
Deferred income 235,832 651,021 - -
Retirement benefit obligations 2,175,902 2,063,282 234,548 184,863
Total liabilities 538,309,001 313,218,333 55,015,655 39,992,477
Equity
Stated capital (475,200,000 shares) 475,200 475,200 475,200 475,200
Reserves 9,075,732 5,436,196 3,377,627 1,653,318
Retained earnings 49,298,766 31,786,984 43,138,880 33,372,919
Equity attributable to shareholders of the Company 58,849,698 37,698,380 46,991,707 35,501,437
Non-controlling interests 43,766,140 28,677,845 - -
Total equity 102,615,838 66,376,225 46,991,707 35,501,437
Total liabilities & equity 640,924,839 379,594,558 102,007,362 75,493,914
Net assets per share (Rs.) 123.84 79.33 98.89 74.71
I certify that these Financial Statements have been prepared and presented in compliance with the requirements of the Companies Act, No.07 of 2007.
Sgd.
Mrs. S.S. Kotakadeniya
Chief Financial Officer - LOLC Group
The board of directors is responsible for the preparation and the fair presentation of these Financial Statements.
Approved and signed for and on behalf of the Board;
Sgd. Sgd.
Mr. I C Nanayakkara Mr. W.D.K. Jayawardena
Deputy Chairman Group Managing Director / CEO
31st May 2017, Rajagiriya (Greater Colombo)
CompanyGroup

Lanka Orix Leasing Company PLC
Statement of Profit or Loss
31-Mar-17 31-Mar-16 Variance 31-Mar-17 31-Mar-16 Variance
Rs'000 Rs'000 Rs'000 Rs'000
Gross income 27,753,057 19,394,958 43 91,715,284 66,765,048 37
Interest income 15,631,264 11,096,197 41 54,573,084 38,654,652 41
Interest expense (11,415,296) (6,470,478) 76 (33,159,211) (18,850,392) 76
Net interest income 4,215,968 4,625,719 (9) 21,413,873 19,804,260 8
Revenue 6,697,735 5,622,324 19 23,478,451 20,228,126 16
Cost of sales (3,701,990) (2,839,659) 30 (14,121,284) (12,702,851) 11
Gross profit 2,995,745 2,782,665 8 9,357,167 7,525,275 24
Income (159,402) 1,252,321 (113) 7,650,036 6,751,926 13
Other income/(expenses) (Including net finance cost) 5,583,460 1,424,116 292 6,013,713 1,130,344 432
Profit before operating expenses 12,635,771 10,084,821 25 44,434,789 35,211,805 26
Operating expenses
VAT on financial services (857,249) (482,137) 78 (2,235,764) (1,299,682) 72
Other direct expenses excluding finance costs (1,498,584) (1,818,100) (18) (5,227,112) (3,863,958) 35
Personnel costs (3,813,565) (3,985,172) (4) (12,615,735) (10,309,111) 22
Net impairment (loss) / reversal on financial assets (2,293,418) (801,079) 186 (4,279,678) (2,978,061) 44
Depreciation and amortization (571,723) (507,059) 13 (1,862,658) (1,577,846) 18
Other operating expenses (714,999) (799,637) (11) (8,257,071) (6,470,433) 28
Results from operating activities 2,886,233 1,691,637 71 9,956,771 8,712,714 14
Share of profits of equity accounted investees 796,107 787,428 1 3,827,962 3,094,237 24
Results on acquisition and divestment of group investments 10,398,123 50,963 20,303 10,594,331 50,963 20,688
Profit before income tax expense 14,080,463 2,530,028 457 24,379,064 11,857,914 106
Income tax expense (1,046,484) (333,719) 214 (3,458,452) (2,526,527) 37
Profit for the period 13,033,979 2,196,309 493 20,920,612 9,331,387 124
Profit attributable to;
Equity holders of the Company 9,634,134 2,294,433 320 17,157,762 8,518,690 101
Non-controlling interests 3,399,845 (98,124) (3,565) 3,762,850 812,697 363
13,033,979 2,196,309 493 20,920,612 9,331,387 124
Basic earnings per share (Rs.) 20.27 4.83 320 36.11 17.93 101
Figures in brackets indicate deductions.
Group
Three Months Ended Year Ended
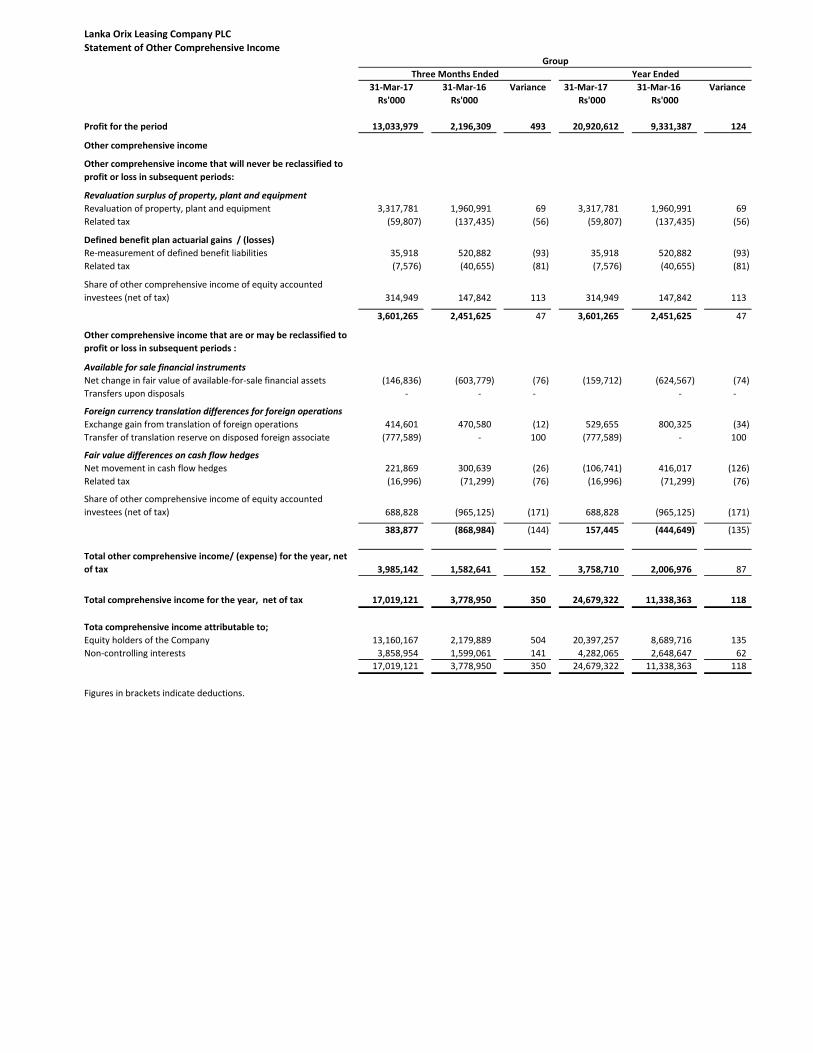
Lanka Orix Leasing Company PLC
Statement of Other Comprehensive Income
31-Mar-17 31-Mar-16 Variance 31-Mar-17 31-Mar-16 Variance
Rs'000 Rs'000 Rs'000 Rs'000
Profit for the period 13,033,979 2,196,309 493 20,920,612 9,331,387 124
Other comprehensive income
Other comprehensive income that will never be reclassified to
profit or loss in subsequent periods:
Revaluation surplus of property, plant and equipment
Revaluation of property, plant and equipment 3,317,781 1,960,991 69 3,317,781 1,960,991 69
Related tax (59,807) (137,435) (56) (59,807) (137,435) (56)
Defined benefit plan actuarial gains / (losses)
Re-measurement of defined benefit liabilities 35,918 520,882 (93) 35,918 520,882 (93)
Related tax (7,576) (40,655) (81) (7,576) (40,655) (81)
Share of other comprehensive income of equity accounted
investees (net of tax) 314,949 147,842 113 314,949 147,842 113
3,601,265 2,451,625 47 3,601,265 2,451,625 47
Other comprehensive income that are or may be reclassified to
profit or loss in subsequent periods :
Available for sale financial instruments
Net change in fair value of available-for-sale financial assets (146,836) (603,779) (76) (159,712) (624,567) (74)
Transfers upon disposals - - - - -
Foreign currency translation differences for foreign operations
Exchange gain from translation of foreign operations 414,601 470,580 (12) 529,655 800,325 (34)
Transfer of translation reserve on disposed foreign associate (777,589) - 100 (777,589) - 100
Fair value differences on cash flow hedges
Net movement in cash flow hedges 221,869 300,639 (26) (106,741) 416,017 (126)
Related tax (16,996) (71,299) (76) (16,996) (71,299) (76)
Share of other comprehensive income of equity accounted
investees (net of tax) 688,828 (965,125) (171) 688,828 (965,125) (171)
383,877 (868,984) (144) 157,445 (444,649) (135)
Total other comprehensive income/ (expense) for the year, net
of tax 3,985,142 1,582,641 152 3,758,710 2,006,976 87
Total comprehensive income for the year, net of tax 17,019,121 3,778,950 350 24,679,322 11,338,363 118
Tota comprehensive income attributable to;
Equity holders of the Company 13,160,167 2,179,889 504 20,397,257 8,689,716 135
Non-controlling interests 3,858,954 1,599,061 141 4,282,065 2,648,647 62
17,019,121 3,778,950 350 24,679,322 11,338,363 118
Figures in brackets indicate deductions.
Group
Three Months Ended Year Ended
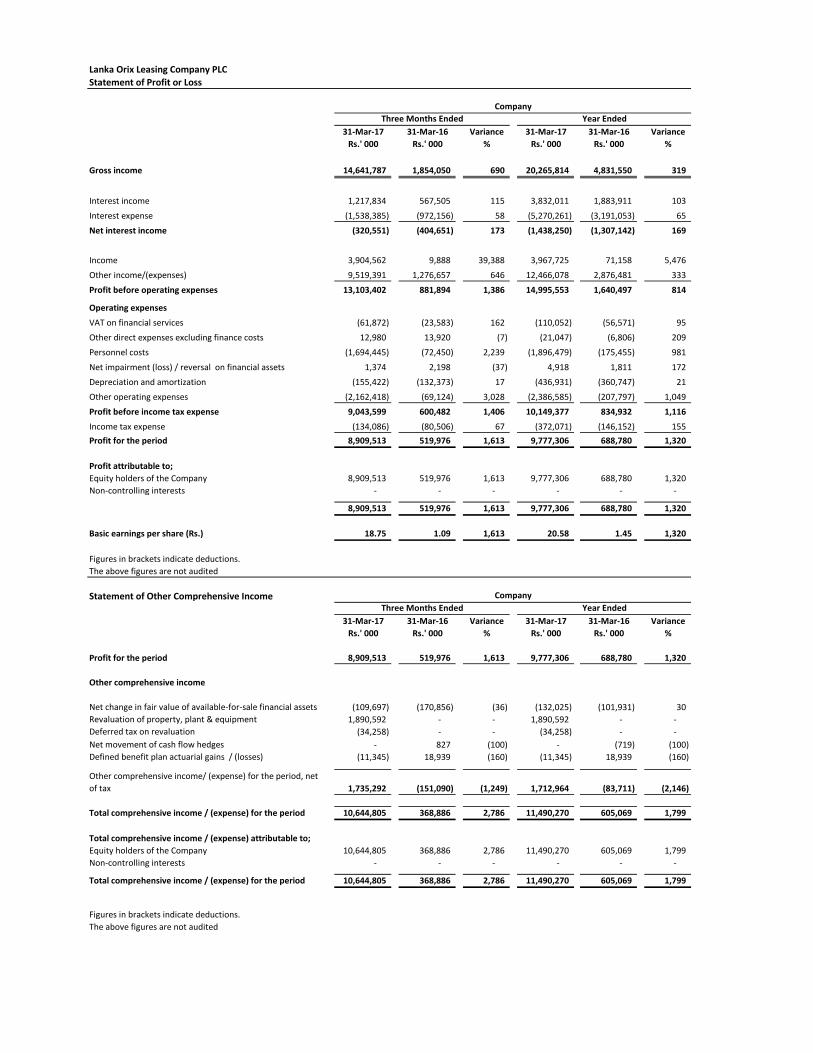
Lanka Orix Leasing Company PLC
Statement of Profit or Loss
31-Mar-17 31-Mar-16 Variance 31-Mar-17 31-Mar-16 Variance
Rs.' 000 Rs.' 000 % Rs.' 000 Rs.' 000 %
Gross income 14,641,787 1,854,050 690 20,265,814 4,831,550 319
Interest income 1,217,834 567,505 115 3,832,011 1,883,911 103
Interest expense (1,538,385) (972,156) 58 (5,270,261) (3,191,053) 65
Net interest income (320,551) (404,651) 173 (1,438,250) (1,307,142) 169
Income 3,904,562 9,888 39,388 3,967,725 71,158 5,476
Other income/(expenses) 9,519,391 1,276,657 646 12,466,078 2,876,481 333
Profit before operating expenses 13,103,402 881,894 1,386 14,995,553 1,640,497 814
Operating expenses
VAT on financial services (61,872) (23,583) 162 (110,052) (56,571) 95
Other direct expenses excluding finance costs 12,980 13,920 (7) (21,047) (6,806) 209
Personnel costs (1,694,445) (72,450) 2,239 (1,896,479) (175,455) 981
Net impairment (loss) / reversal on financial assets 1,374 2,198 (37) 4,918 1,811 172
Depreciation and amortization (155,422) (132,373) 17 (436,931) (360,747) 21
Other operating expenses (2,162,418) (69,124) 3,028 (2,386,585) (207,797) 1,049
Profit before income tax expense 9,043,599 600,482 1,406 10,149,377 834,932 1,116
Income tax expense (134,086) (80,506) 67 (372,071) (146,152) 155
Profit for the period 8,909,513 519,976 1,613 9,777,306 688,780 1,320
Profit attributable to;
Equity holders of the Company 8,909,513 519,976 1,613 9,777,306 688,780 1,320
Non-controlling interests - - - - - -
8,909,513 519,976 1,613 9,777,306 688,780 1,320
Basic earnings per share (Rs.) 18.75 1.09 1,613 20.58 1.45 1,320
Figures in brackets indicate deductions.
The above figures are not audited
Statement of Other Comprehensive Income
31-Mar-17 31-Mar-16 Variance 31-Mar-17 31-Mar-16 Variance
Rs.' 000 Rs.' 000 % Rs.' 000 Rs.' 000 %
Profit for the period 8,909,513 519,976 1,613 9,777,306 688,780 1,320
Other comprehensive income
Net change in fair value of available-for-sale financial assets (109,697) (170,856) (36) (132,025) (101,931) 30
Revaluation of property, plant & equipment 1,890,592 - - 1,890,592 - -
Deferred tax on revaluation (34,258) - - (34,258) - -
Net movement of cash flow hedges - 827 (100) - (719) (100)
Defined benefit plan actuarial gains / (losses) (11,345) 18,939 (160) (11,345) 18,939 (160)
Other comprehensive income/ (expense) for the period, net
of tax 1,735,292 (151,090) (1,249) 1,712,964 (83,711) (2,146)
Total comprehensive income / (expense) for the period 10,644,805 368,886 2,786 11,490,270 605,069 1,799
Total comprehensive income / (expense) attributable to;
Equity holders of the Company 10,644,805 368,886 2,786 11,490,270 605,069 1,799
Non-controlling interests - - - - - -
Total comprehensive income / (expense) for the period 10,644,805 368,886 2,786 11,490,270 605,069 1,799
Figures in brackets indicate deductions.
The above figures are not audited
Company
Company
Three Months Ended Year Ended
Three Months Ended Year Ended

Lanka Orix Leasing Company PLC
Statement of Changes in EquityFor the year ended 31 March 2017
Company
Stated Capital Revaluation
Reserve
Cash flow hedge
Reserve
Fair Value
Reserve on AFS
Future Taxation
Reserve
Retained
Earnings Total
Rs.' 000 Rs.' 000 Rs.' 000 Rs.' 000 Rs.' 000 Rs.' 000 Rs.' 000
Balance as at 01 April 2015 475,200 1,300,116 719 266,963 205,000 32,648,370 34,896,368
Total comprehensive income for the period
Profit for the period - - - - - 688,780 688,780
Other comprehensive income
Net change in fair value of available-for-sale financial assets (net of tax) - - - (101,931) - - (101,931)
Transfer to revaluation reserve - (16,830) - - - 16,830 -
Net movement of cash flow hedge - (719) - - - (719)
Deffered tax on re-measurement of defined benefit liabilities - - - - - 18,939 18,939
Total comprehensive income for the period - (16,830) (719) (101,931) - 724,549 605,069
Balance as at 31 March 2016 475,200 1,283,286 - 165,032 205,000 33,372,919 35,501,437
Balance as at 01 April 2016 475,200 1,283,286 - 165,032 205,000 33,372,919 35,501,437
Total comprehensive income for the period
Profit for the period - - - - - 9,777,306 9,777,306
Other comprehensive income
Net change in fair value of available-for-sale financial assets (net of tax) - - - (132,025) - - (132,025)
Transfer to revaluation reserve - - - - - - -
Revaluation of property, plant and equipment - 1,890,592 - - - - 1,890,592
Deferred tax on revaluation - (34,258) - - - - (34,258)
Defined benefit plan actuarial gains / (losses) - - - - - (11,345) (11,345)
Total comprehensive income for the period - 1,856,334 - (132,025) - 9,765,961 11,490,270
Balance as at 31 March 2017 475,200 3,139,620 - 33,007 205,000 43,138,880 46,991,707
Figures in brackets indicate deductions.
The above figures are not audited
Equity attributable to the shareholders of the Company
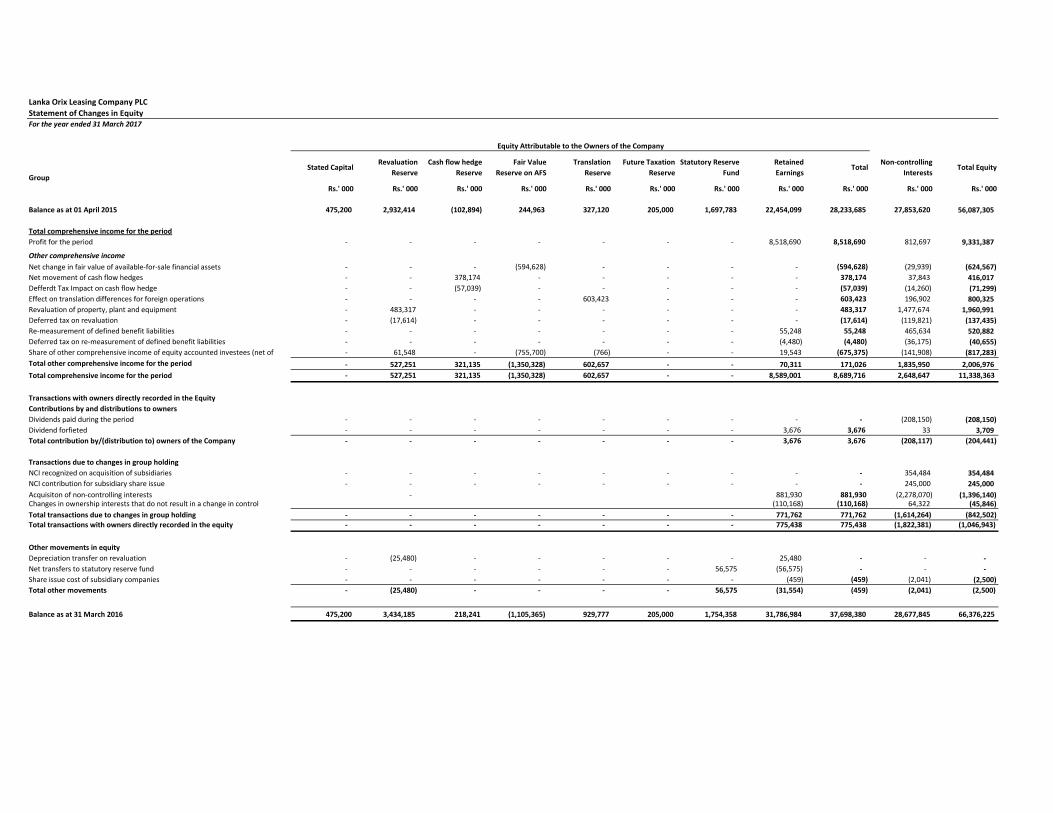
Lanka Orix Leasing Company PLC
Statement of Changes in EquityFor the year ended 31 March 2017
Group
Stated Capital Revaluation
Reserve
Cash flow hedge
Reserve
Fair Value
Reserve on AFS
Translation
Reserve
Future Taxation
Reserve
Statutory Reserve
Fund
Retained
Earnings Total
Non-controlling
Interests Total Equity
Rs.' 000 Rs.' 000 Rs.' 000 Rs.' 000 Rs.' 000 Rs.' 000 Rs.' 000 Rs.' 000 Rs.' 000 Rs.' 000 Rs.' 000
Balance as at 01 April 2015 475,200 2,932,414 (102,894) 244,963 327,120 205,000 1,697,783 22,454,099 28,233,685 27,853,620 56,087,305
Total comprehensive income for the period
Profit for the period - - - - - - - 8,518,690 8,518,690 812,697 9,331,387
Other comprehensive income
Net change in fair value of available-for-sale financial assets - - - (594,628) - - - - (594,628) (29,939) (624,567)
Net movement of cash flow hedges - - 378,174 - - - - - 378,174 37,843 416,017
Defferdt Tax Impact on cash flow hedge - - (57,039) - - - - - (57,039) (14,260) (71,299)
Effect on translation differences for foreign operations - - - - 603,423 - - - 603,423 196,902 800,325
Revaluation of property, plant and equipment - 483,317 - - - - - - 483,317 1,477,674 1,960,991
Deferred tax on revaluation - (17,614) - - - - - - (17,614) (119,821) (137,435)
Re-measurement of defined benefit liabilities - - - - - - - 55,248 55,248 465,634 520,882
Deferred tax on re-measurement of defined benefit liabilities - - - - - - - (4,480) (4,480) (36,175) (40,655)
Share of other comprehensive income of equity accounted investees (net of - 61,548 - (755,700) (766) - - 19,543 (675,375) (141,908) (817,283)
Total other comprehensive income for the period - 527,251 321,135 (1,350,328) 602,657 - - 70,311 171,026 1,835,950 2,006,976
Total comprehensive income for the period - 527,251 321,135 (1,350,328) 602,657 - - 8,589,001 8,689,716 2,648,647 11,338,363
Transactions with owners directly recorded in the Equity
Contributions by and distributions to owners
Dividends paid during the period - - - - - - - - - (208,150) (208,150)
Dividend forfieted - - - - - - - 3,676 3,676 33 3,709
Total contribution by/(distribution to) owners of the Company - - - - - - - 3,676 3,676 (208,117) (204,441)
Transactions due to changes in group holding
NCI recognized on acquisition of subsidiaries - - - - - - - - - 354,484 354,484
NCI contribution for subsidiary share issue - - - - - - - - - 245,000 245,000
Acquisiton of non-controlling interests - 881,930 881,930 (2,278,070) (1,396,140) Changes in ownership interests that do not result in a change in control (110,168) (110,168) 64,322 (45,846)
Total transactions due to changes in group holding - - - - - - - 771,762 771,762 (1,614,264) (842,502)Total transactions with owners directly recorded in the equity - - - - - - - 775,438 775,438 (1,822,381) (1,046,943)
Other movements in equity
Depreciation transfer on revaluation - (25,480) - - - - - 25,480 - - -
Net transfers to statutory reserve fund - - - - - - 56,575 (56,575) - - -
Share issue cost of subsidiary companies - - - - - - - (459) (459) (2,041) (2,500)
Total other movements - (25,480) - - - - 56,575 (31,554) (459) (2,041) (2,500)
Balance as at 31 March 2016 475,200 3,434,185 218,241 (1,105,365) 929,777 205,000 1,754,358 31,786,984 37,698,380 28,677,845 66,376,225
Equity Attributable to the Owners of the Company

Lanka Orix Leasing Company PLC
Statement of Changes in EquityFor the year ended 31 March 2017
Group
Stated Capital Revaluation
Reserve
Cash flow hedge
Reserve
Fair Value
Reserve on AFS
Translation
Reserve
Future Taxation
Reserve
Statutory Reserve
Fund
Retained
Earnings Total
Non-controlling
Interests Total Equity
Rs.' 000 Rs.' 000 Rs.' 000 Rs.' 000 Rs.' 000 Rs.' 000 Rs.' 000 Rs.' 000 Rs.' 000 Rs.' 000 Rs.' 000
Equity Attributable to the Owners of the Company
Balance as at 01 April 2016 475,200 3,434,185 218,241 (1,105,365) 929,777 205,000 1,754,358 31,786,984 37,698,380 28,677,845 66,376,225
Total comprehensive income for the period
Profit for the period - - - - - - - 17,157,762 17,157,762 3,762,850 20,920,612
Other comprehensive income
Net change in fair value of available-for-sale financial assets - - - (161,994) - - - - (161,994) 2,282 (159,712)
Net movement of cash flow hedges - - (83,034) - - - - - (83,034) (23,707) (106,741)
Defferdt Tax Impact on cash flow hedge - - (16,851) - - - - - (16,851) (145) (16,996)
Effect on translation differences for foreign operations - - - - 315,848 - - - 315,848 213,807 529,655
Revaluation of property, plant and equipment - 3,094,790 - - - - - - 3,094,790 222,991 3,317,781
Deferred tax on revaluation - (48,485) - - - - - - (48,485) (11,322) (59,807)
Re-measurement of defined benefit liabilities - - - - - - - (13,245) (13,245) 49,163 35,918
Deferred tax on re-measurement of defined benefit liabilities - - - - - - - (1,135) (1,135) (6,441) (7,576) Share of other comprehensive income of equity accounted investees (net of
tax) - 274,999 - 372,143 276,498 - - 7,550 931,190 72,587 1,003,777
Transfer of translation reserve on disposed foreign associate - - - - (777,589) - - (777,589) - (777,589)
Total other comprehensive income for the period - 3,321,304 (99,885) 210,149 (185,243) - - (6,830) 3,239,495 519,215 3,758,710
Total comprehensive income for the period - 3,321,304 (99,885) 210,149 (185,243) - - 17,150,932 20,397,257 4,282,065 24,679,322
Transactions with owners directly recorded in the Equity
Contributions by and distributions to owners
Dividends paid during the period - - - - - - - - - (237,209) (237,209)
Total contribution by/(distribution to) owners of the Company - - - - - - - - - (237,209) (237,209)
Transactions due to changes in group holding
NCI recognized on acquisition of subsidiaries - - - - - - - - - 17,744,244 17,744,244
Changes in ownership interests that do not result in a change in control - - - - - - - 754,061 754,061 (1,931,302) (1,177,241)
Total transactions due to changes in group holding - - - - - - - 754,061 754,061 15,812,942 16,567,003 Total transactions with owners directly recorded in the equity - - - - - - - 754,061 754,061 15,575,733 16,329,794
Other movements in equity
Depreciation transfer on revaluation - (10,592) - - - - - 10,592 - - -
Net transfers to statutory reserve fund - - - - - - 403,803 (403,803) - - -
Disposal of Subsidiary - - - - - - - - - (4,769,503) (4,769,503)
Total other movements - (10,592) - - - - 403,803 (393,211) - (4,769,503) (4,769,503)
-
Balance as at 31 March 2017 475,200 6,744,897 118,356 (895,216) 744,534 205,000 2,158,161 49,298,766 58,849,698 43,766,140 102,615,838
Figures in brackets indicate deductions.
The above figures are not audited

Lanka Orix Leasing Company PLC
Statement of Cash Flows
For the year ended 31 March 2017 2016 2017 2016
Rs.' 000 Rs.' 000 Rs.' 000 Rs.' 000
CASH FLOW FROM OPERATING ACTIVITIES
Profit before income tax expense 24,379,064 11,857,914 10,149,377 834,932
Adjustment for:
(Gain) / loss on sale of property, plant and equipment (40,942) (135,156) (59,256) (116,939)
Depreciation and amortization 1,862,658 1,577,846 436,931 360,747
Insurance provision 1,122,314 1,285,583 - -
Change in fair value of forward contracts 28,699 (108,825) - -
Provision for gratuity 537,318 351,302 57,219 14,978
Net impairment (loss) / reversal on financial assets 4,279,678 2,978,061 (4,918) (1,811)
Provision for fall/(increase) in value of investments (161,706) 99,615 - 89,959
Investment Income (56,552) (1,809,205) - (287,397)
Finance costs 33,159,211 20,098,345 5,270,261 3,191,053
Interest income (3,409,180) - (309,111) -
(Profit)/loss on sale of quoted and non-quoted shares 21,448 (130,108) (12,011) 1,654
Share of profits of equity accounted investees (3,827,962) (3,094,237) - -
Foreign exchange gain / (loss) (38,925) 80,402 - -
Results on acquisition and divestment of Group investment (10,594,331) (50,963) (9,099,508) -
Gain in fair value of consumer biological assets (214,815) 194,354 - -
Change in fair value of investment properties (855,409) (135,120) (23,600) (9,000)
Amortization of deferred income (85,169) (34,610) (32,691) -
Provision for slow moving inventories 53,448 (88,519) - -
Allowance for trade and other receivables 215,963 83,181 - -
Transaction cost on acquisition of subsidiaries 303,970 - - -
Loss on disposal of subsidiaries - 4,864 - -
Fair value of previously held interest in BRAC 46,678,780 33,024,724 6,372,693 4,078,176
Working capital changes
Increase/(decrease) in trade and other payables 1,736,478 3,984,128 384,311 (1,144,775)
(Increase)/decrease in investment in leases, hire purchase and others (863,888) (11,194,861) 4,499 (7,237)
(Increase)/decrease in investment in advances and other loans (36,113,361) (64,705,539) 993,918 (462,041)
(Increase)/decrease in premium receivables (279,592) (199,066) - -
(Increase)/decrease in inventories (893,689) (1,723,090) 98,731 (452,510)
(Increase)/decrease in trade and other receivables (3,682,126) (1,612,642) (9,928,268) (11,092,217)
Increase/(decrease) in customer deposits 29,344,211 23,578,493 - -
Cash generated from operations 35,926,813 (18,847,853) (2,074,116) (9,080,604)
Finance cost paid (31,393,879) (19,835,244) (5,219,512) (3,275,596)
Income tax and Economic Service Charge paid (2,219,132) (1,612,220) (41,713) (1,525)
Defined benefit plan costs paid (428,258) (284,887) (7,534) (4,630)
Net cash from/(used in) operating activities 1,885,544 (40,580,204) (7,342,875) (12,362,355)
CASH FLOW FROM INVESTING ACTIVITIES
Investment in subsidiary companies - - (19,004,747) (189,881)
Net cash and cash equivalents on acquisition of subsidiary (7,364,823) (393,826) - -
Net cash and cash equivalents received on disposal of subsidiary 4,932,202 4,740 12,601,885 -
Investment in equity accounted investees (1,055,383) (276,539) - (166,172)
Proceeds from disposal of equity accounted investees 12,601,885 1,103,230 - -
Acquisition of Jointly controlled entities - - - -
Acquisition of non-controlling interests (996,108) - - -
Acquisition of property, plant and equipment and leasehold rights (8,541,071) (5,424,129) (879,320) (1,209,031)
Acquisition / (Disposal) of intangible assets (212,780) (176,861) 6,937 (70,000)
Net additions to trading assets (2,125,305) (1,260,613) 11,624 (2,573)
Net additions to investment securities 7,160,958 (42,693,744) 336,035 2,816
Proceeds from the sale of property, plant and equipment 896,351 465,137 215,046 343,610
Investment income received 3,409,180 1,809,205 - -
Dividend received 810,635 479,514 240,193 101,660
Net additions to biological assets (491,421) (280,964) - -
Payment of lease rentals (376,240) (408,683) - -
Net cash flow from investing activities 8,648,080 (47,053,533) (6,472,347) (1,189,571)
CASH FLOW FROM FINANCING ACTIVITIES
Net cash proceeds from short-term interest bearing borrowings (7,227,244) 21,850,963 16,944,232 8,023,432
Principal repayment under finance lease liabilities (719,091) (307,777) (80,344) (119,511)
Proceeds from long-term interest bearing loans and borrowings 37,277,060 87,200,910 1,007,081 5,415,716
Repayments of long-term interest bearing loans and borrowings (15,835,231) (22,218,903) (1,855,849) (1,823,826)
Issue/(repayment) of debentures (140,000) 5,000,000 (140,000) (1,110,000)
Dividends paid to non-controlling interests (237,209) (208,150) - -
NCI contributions to share issue of subsidiaries - 245,000 - -
Receipt of deferred income 142,924 77,976 - -
Share issue cost of subsidiaries - (2,500) - -
NCI contribution to subsidiary share issues 18,631,591 (1,396,140) - -
Net cash generated from financing activities 31,892,800 90,241,379 15,875,120 10,385,811
Net increase/(decrease) in cash and cash equivalents during the period 42,426,423 2,607,642 2,059,898 (3,166,115)
Cash and cash equivalents at the beginning of the period 4,423,484 1,815,842 (3,291,182) (125,067)
Cash and cash equivalents at the end of the period 46,849,907 4,423,484 (1,231,284) (3,291,182)
Analysis of cash and cash equivalents at the end of the period
Cash in Hand and Favorable Bank Balances 54,215,239 13,725,794 460,015 63,407
Unfavorable Bank Balances used for cash management purposes (7,365,332) (9,302,310) (1,691,299) (3,354,589)
46,849,907 4,423,484 (1,231,284) (3,291,182)
Figures in brackets indicate deductions.
The above figures are not audited
Group Company
Lanka Orix Leasing Company PLC
Notes to the Interim Financial Statements
1
2
3
4
5
6
7
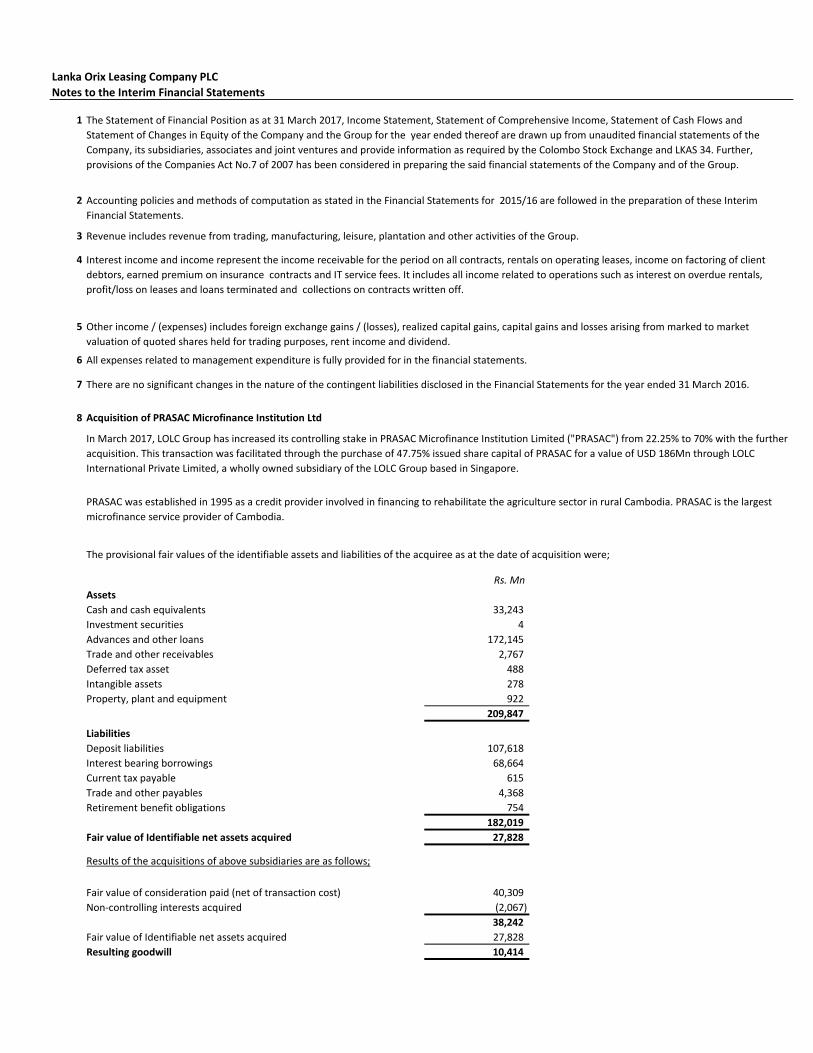
8 Acquisition of PRASAC Microfinance Institution Ltd
Rs. Mn
Assets
Cash and cash equivalents 33,243
Investment securities 4
Advances and other loans 172,145
Trade and other receivables 2,767
Deferred tax asset 488
Intangible assets 278
Property, plant and equipment 922
209,847
Liabilities
Deposit liabilities 107,618
Interest bearing borrowings 68,664
Current tax payable 615
Trade and other payables 4,368
Retirement benefit obligations 754
182,019
Fair value of Identifiable net assets acquired 27,828
Results of the acquisitions of above subsidiaries are as follows;
Fair value of consideration paid (net of transaction cost) 40,309
Non-controlling interests acquired (2,067)
38,242
Fair value of Identifiable net assets acquired 27,828
Resulting goodwill 10,414
There are no significant changes in the nature of the contingent liabilities disclosed in the Financial Statements for the year ended 31 March 2016.
In March 2017, LOLC Group has increased its controlling stake in PRASAC Microfinance Institution Limited ("PRASAC") from 22.25% to 70% with the further
acquisition. This transaction was facilitated through the purchase of 47.75% issued share capital of PRASAC for a value of USD 186Mn through LOLC
International Private Limited, a wholly owned subsidiary of the LOLC Group based in Singapore.
The provisional fair values of the identifiable assets and liabilities of the acquiree as at the date of acquisition were;
PRASAC was established in 1995 as a credit provider involved in financing to rehabilitate the agriculture sector in rural Cambodia. PRASAC is the largest
microfinance service provider of Cambodia.
All expenses related to management expenditure is fully provided for in the financial statements.
The Statement of Financial Position as at 31 March 2017, Income Statement, Statement of Comprehensive Income, Statement of Cash Flows and
Statement of Changes in Equity of the Company and the Group for the year ended thereof are drawn up from unaudited financial statements of the
Company, its subsidiaries, associates and joint ventures and provide information as required by the Colombo Stock Exchange and LKAS 34. Further,
provisions of the Companies Act No.7 of 2007 has been considered in preparing the said financial statements of the Company and of the Group.
Accounting policies and methods of computation as stated in the Financial Statements for 2015/16 are followed in the preparation of these Interim
Financial Statements.
Revenue includes revenue from trading, manufacturing, leisure, plantation and other activities of the Group.
Interest income and income represent the income receivable for the period on all contracts, rentals on operating leases, income on factoring of client
debtors, earned premium on insurance contracts and IT service fees. It includes all income related to operations such as interest on overdue rentals,
profit/loss on leases and loans terminated and collections on contracts written off.
Other income / (expenses) includes foreign exchange gains / (losses), realized capital gains, capital gains and losses arising from marked to market
valuation of quoted shares held for trading purposes, rent income and dividend.

Lanka Orix Leasing Company PLC
Notes to the Interim Financial Statements
8.1
Rs. Mn
Carrying amount of the previously held interest of PRASAC 6,353
Fair value of the previously held interest 12,602
Gain on associate become subsidiary 6,249
Total Results of the PRASAC Acquisition
Gain on disposal of associate 6,249
778
Total gain recognized in income statement 7,027
9 Disposal of Subsidiaries
During the current financial year group has divested following subsidiaries,
Subsidiary Controlling interest sold
Consideration
Received (net of
transaction cost)
Fair value of the
remaining stake
Fair value of the total
consideration
received
Rs. Mn Rs. Mn Rs. Mn
FLMC Plantations (Pvt) Ltd 45.10% 4,636 1,000 5,636
72.13% 541 N/A 541
Fair values of the identifiable assets and liabilities of the disposed groups at the date of disposal were;
FLMC Group Lotus Hydro Group
Rs. Mn Rs. Mn
Cash and cash equivalents 275 36
Investment securities 306 -
Trade and other receivables 491 61
Inventories 407 8
Bialogical assets 7,134
Deferred tax asset 210 -
Property, plant and equipment 1,050 864
9,873 969
Bank overdraft 65 2
Interest bearing borrowings 372 136
Trade and other payables 684 94
Deferred tax liabilities 924 -
Deferred income 473 -
Retirement benefit obligations 712 4
3,230 236
Net assets disposed 6,643 734
2,265 344
5,636 541
Gain on disposal 3,371 196
LOLC group had 22.25% stake in PRASAC which was accounted as Associate in the LOLC group financials till 31st March 2017 using equity accounting under
LKAS 27. With the acquisition of 47.75% issued share capital of the PRASAC, it has become a subsidiary of the LOLC group and accounted as subsidiary
under SLFRS 10.
Reclassify the previously recognized Foreign Currency Translation Reserve to Income Statement
Lotus Hydro Power PLC (Formerly known
as Browns Hydro Power PLC)
Net assets attributable to the group
Fair value of consideration received (net of transaction cost)

Lanka Orix Leasing Company PLC
Notes to the Interim Financial Statements
10 Deconsolidation of Agalawatte Plantations PLC
Date of the transaction Description Value
Rs. '00014th July, 2016 Cost of acquisition of APL group 306,166
28th March, 2017 Disposal proceeds form sale of APL Group 272,708
Loss on disposal (33,458)
11
12
Joint Investment agreement to develop Excel World Property
13
Rs.
Closing price 61.00
Highest Price (10th January, 2017) 79.00
Lowest Price (07th March, 2017) 59.00
Market prices of ordinary shares recorded during the quarter ended 31st March 2017 are as follows;
No circumstances have arisen since the reporting date, which would require adjustments to or disclosure in the financial statements other than disclosed
as follows.
Browns Investments PLC, sub subsidiary of the group entered into a joint investment agreement with Zhongtian Ding Hui (Pvt) Ltd on 6th April 2017
pertaining to co-develop the Excel World Property.
Zhongtian Ding Hui (Pvt) Ltd and Browns Investments PLC in terms of the agreement entered into shall invest in the share capital of Excel Global Holdings
(Pvt) Ltd, in order to co-develop the project location situated at 338, TB Jaya Mawatha, Colombo of which the lease hold rights are held by Millenium
Development (Pvt) Ltd.
Subsequent to the re-audit, the auditor of APL has issued a disclaimed audit opinion on the re-audited financial statements for the financial year ended
2014 and as at the date in which the financial statements of the Group is authorised for issue by the directors, no audited financial statements of APL for
Financial years 2015 and 2016 are available. Since it was impracticable to obtain reliable financial information after making every reasonable effort to do
so and considering the significant limitations and uncertainty described above, the management is of the view that consolidation of the results of APL may
not represent a true and fair view of the financial statements. Consequently, in order to present the substance of the transaction and its effect, the
management concluded that the investment in APL be not treated as an investment in subsidiary from the date of acquisition for the purpose of preparing
Group financial statements for the year ended 31st March 2017.
During the period, the group acquired the remaining 40% of Ceylon Roots (Pvt) Ltd for Rs. 8Mn.
Browns Investments PLC, at present holds 100% of Excel Global Holdings (Pvt) Ltd, and that shareholding is valued at USD 20 Million. Browns Investments
PLC shall further infuse USD 15 Million, and arrange Excel Global Holdings (Pvt) Ltd a USD 20 Million loan. Browns Investments PLC shall hold 51% of total
shares of Excel Global Holdings (Pvt) Ltd and Zhongtian Ding Hui (Pvt) Ltd shall invest USD 35 Million in this project and acquire a shareholding of 49% of
the total share in Excel Global Holdings (Pvt) Ltd. Both parties agreed that the total development cost for constructing the proposed life style shopping mall
cum family leisure center shall be USD 70 Million.
The details of the investment in APL, disposal and resultant loss on disposal recognized in the Group financial statements is stated below.
In July 2016, the Group acquired 60.80% stake in Agalawatte Plantations PLC (APL) with a long term view and considered it as an investment in Subsidiary
of the Group. Accordingly, Agalawatte Plantations PLC was consolidated and unaudited financial statements for the quarters ended 30th September 2016
and 31st December 2016 was presented.
By a letter dated 28th September 2016, The Sri Lanka Accounting and Auditing Standards Monitoring Board (SLAASMB), issued a direction to the Board of
Directors of APL to re-audit the published financial statements of the company for the year ended 31st December 2014. Consequent to the re-audit, which
was finalized in March 2017, it was revealed that the liabilities of APL were significantly higher than what was in the publicly available financial statements
at the time of acquisition. The management evaluated the significance of such risk that poses on the Group and consequently the management changed
its intention on the investment in APL and divested the Investment in March 2017

Lanka Orix Leasing Company PLC
Notes to the Interim Financial Statements
14
14.1 Interest rate of comparable government security
Buying and Selling prices of Treasury Bonds of the bond market as at 31 March 2017
Buying Selling
4 Year Bond
Price 98.05 98.14
Yield - % 10.74 10.55
5 Year Bond
Price 95.88 96.15
Yield - % 10.48 11.68
14.2 Market prices and yield during the period (ex interest)
4 Year Bond 5 Year Bond
Price 97.31 97.39
Yield - % 10.47 10.91
Current period
Yield to maturity of trade done on 20 March 2017 13.00
Debt to equity 1.17 times
Interest cover 2.93 times
Quick asset ratio 7.68 times
14.3 The market prices during the period (ex interest)
Highest price 93.60
Lowest price 90.30
Last traded price 91.20
15 Backed to backed deposits details As at 31 March 2017
Rs. '000
Back to back deposits on foreign funding 13,138,299
Interest income earned on back to back deposits 993,279
16 Group Portfolio information As at 31 March 2017
Rs. '000
Gross portfolio 427,365,086
Non-performing portfolio > 6 months 7,736,075
Allowance for non-performing portfolio 8,668,718
Information on Company's listed debentures

Lanka Orix Leasing Company PLC
Operating Segments
For the year ended 31 March 2017
Rs.' 000 Rs.' 000 Rs.' 000 Rs.' 000 Rs.' 000 Rs.' 000 Rs.' 000 Rs.' 000
Gross income 83,040,289 5,099,982 18,567,797 2,785,890 11,422,106 - (29,200,780) 91,715,284
Net interest cost (34,407,470) - (1,231,633) (971,794) (634,777) - 4,086,463 (33,159,211)
Cost of sales - - (11,343,469) (1,112,339) (1,734,630) - 69,154 (14,121,284)
Profit before operating expenses 48,632,819 5,099,982 5,992,695 701,757 9,052,699 - (25,045,163) 44,434,789
Operating expenses (28,856,496) (4,467,909) (3,803,924) (1,604,664) (4,229,081) - 8,484,056 (34,478,018)
Results from operating activities 19,776,323 632,073 2,188,771 (902,907) 4,823,618 - (16,561,107) 9,956,771 Share of profits of equity accounted investees - - - - - 3,827,962 - 3,827,962
Results of Acquisition/ Divestment of Group Investment - - - - - - 10,594,331 10,594,331 Profit before taxation 19,776,323 632,073 2,188,771 (902,907) 4,823,618 3,827,962 (5,966,776) 24,379,064
For the year ended 31 March 2016
Gross income 49,013,466 4,271,572 15,384,503 1,319,006 5,734,203 - (8,957,702) 66,765,048
Net interest cost (20,677,797) - (792,472) (455,481) (319,433) - 3,394,791 (18,850,392)
Cost of sales - - (10,247,716) (303,285) (2,255,059) - 103,209 (12,702,851)
Profit before operating expenses 28,335,669 4,271,572 4,344,315 560,240 3,159,711 - (5,459,702) 35,211,805
Operating expenses (18,659,128) (4,347,920) (3,220,298) (1,177,761) (3,828,987) - 4,735,003 (26,499,091)
Results from operating activities 9,676,541 (76,348) 1,124,017 (617,521) (669,276) - (724,699) 8,712,714
Share of profits of equity accounted investees - - - - - 3,094,237 - 3,094,237 Results on acquisition and divestment of group investments - - - - - 50,963 50,963
Profit before taxation 9,676,541 (76,348) 1,124,017 (617,521) (669,276) 3,094,237 (673,736) 11,857,914
For the year ended 31 March 2017
Rs.' 000 Rs.' 000 Rs.' 000 Rs.' 000 Rs.' 000 Rs.' 000 Rs.' 000 Rs.' 000
Net impairment (loss) / reversal on financial assets (4,081,329) (861) (197,488) - - - - (4,279,678)
Depreciation and amortization (857,531) (47,896) (269,199) (282,151) (386,855) - (19,026) (1,862,658)
Total assets (as at 31 March 2017) 623,139,736 9,030,458 31,631,751 40,999,938 19,428,821 - (83,305,865) 640,924,839
Total liabilities (as at 31 March 2017) 525,837,051 5,920,706 14,146,667 15,062,881 8,254,854 - (30,913,158) 538,309,001
For the year ended 31 March 2016
Net impairment (loss) / reversal on financial assets 2,965,890 13,493 (1,322) - - - - 2,978,061
Depreciation and amortization 588,667 45,238 305,651 260,094 353,605 - 24,591 1,577,846
Total assets (as at 31 March 2016) 353,254,187 6,817,848 28,552,395 26,914,287 19,364,499 - (55,308,658) 379,594,558
Total liabilities (as at 31 March 2016) 304,171,205 4,427,509 12,951,776 7,693,670 8,206,692 - (24,232,519) 313,218,333
Others /
Eliminations
Total
Financial Services
Long term &
General Insurance
Manufacturing &
Trading
Leisure &
Entertainment
Plantation &
Hydro power
Equity Accounted
Investees
Others /
Eliminations Total
Financial Services
Long term &
General Insurance
Manufacturing &
Trading
Leisure &
Entertainment
Plantation &
Hydro power
Equity Accounted
Investees

Lanka Orix Leasing Company PLC
Valuation of Financial Assets and Liabilities
Fair value -
derivatives
Fair value - held for
trading
Fair value through
other comprehensive
income - available for
sale
Amortised cost / Not
measured at fair value Total carrying amount Fair value
Fair value measurement
level
- 4,649,565 - - 4,649,565 4,649,565 Level 1 and Level 2
- - 8,449,097 45,930,224 54,379,321 54,379,321 Level 1 and Level 2
- - - 51,886,988 51,886,988 51,347,363 Level 3
- - - 366,809,380 366,809,380 366,572,054 Level 3
- 4,649,565 8,449,097 464,626,592 477,725,254 476,948,304
65,287 - - - 65,287 65,287 Level 1
- - - 211,128,007 211,128,007 212,394,775 Level 3
- - - 286,749,284 286,749,284 288,469,780 Level 3
65,287 - - 497,877,291 497,942,578 500,929,842
Fair value -
derivatives
Fair value - held for
trading
Fair value through
other comprehensive
income - available for
sale
Amortised cost / Not
measured at fair value Total carrying amount Fair value
Fair value measurement
level
- 2,397,547 - - 2,397,547 2,397,547 Level 1 and Level 2
- - 11,092,834 49,858,606 60,951,440 59,332,190 Level 1 and Level 2
- - - 51,666,748 51,666,748 51,056,981 Level 3
- - - 161,116,017 161,116,017 161,486,583 Level 3
- 2,397,547 11,092,834 262,641,371 276,131,752 274,273,301
Trading liabilities - fair value through profit or loss 17,859 - - - 17,859 17,859 Level 1
- - - 74,165,732 74,165,732 72,562,994 Level 3
- - - 205,774,163 205,774,163 204,361,672 Level 3
17,859 - - 279,939,895 279,957,754 276,942,525
For the cash and cash equivalents, short term receivables and payables, the fair value reasonably approximates its costs.
Rs'000
Rs'000
Deposits liabilities
Interest bearing borrowings
Total financial liabilities
Advances and other loans
Total financial assets
As at 31st March 2016 - Group
Trading assets - fair value through profit or loss
Investment securities
Finance lease receivables, hire purchases and operating
leases
Total financial liabilities
Total financial assets
Trading liabilities - fair value through profit or loss
Advances and other loans
Interest bearing borrowings
Deposits liabilities
Finance lease receivables, hire purchases and operating
leases
As at 31 March 2017 - Group
Trading assets - fair value through profit or loss
Investment securities

172,492,292 36.299
59,895,500 12.604
- -
23,760,000 5.000
- -
12,600 0.003
- -
- -
- -
- -
Shareholder No. of % of Issued
Shares Capital
1 Mr. R M Nanayakkara (Decd) 172,492,292 36.299
2 Orix Corporation 142,560,000 30.000
3 Mr. I C Nanayakkara 59,895,500 12.604
4 Mrs. K U Amarasinghe 23,760,000 5.000
5 Employees Provident Fund 15,182,259 3.195
6 HSBC Intl Nom Ltd - BBH - Mathews International Funds 12,121,473 2.551
7 Renaissance Capital (Private) Limited 8,671,625 1.825
8 HSBC Intl Nom Ltd - State Street Luxembourg C/O SSBT-ABN
AMRO MULTI - MANAGER FUND 6,937,775 1.460
9 Mrs. I Nanayakkara 2,827,948 0.595
10 Employees Trust Fund Board 2,740,493 0.577
11 Mr. R C De Silva 1,634,000 0.344
12 Mr. G G Ponnambalam 1,044,960 0.220
13 Dr. M Ponnambalam 1,044,960 0.220
14 Swasthika Mills LTD 1,006,800 0.212
15 Mrs. S N Fernando 818,440 0.172
16 National Savings Bank 606,900 0.128
17 CONFIFI Management Services Ltd 600,000 0.126
18 HSBC Intl Nom Ltd - BBH - Mathews Emerging Asia Fund 573,466 0.121
19 Mr. G C Goonetileke 525,000 0.110
20 Ms. A C Radhakrishnan 500,000 0.105
21 Mr. R. Maheswaran 500,000 0.105
22 Ms. M P Radhakrishnan 500,000 0.105
456,543,891 96.074
The Public Shareholding as at 31 March 2017 was 15.499 % comprising of 3,144 shareholders.
Alternate Director to H Nishio
Lanka Orix Leasing Company PLC
Statement of Directors' holding and Chief Executive Officer's holding in shares of the Entity as at 31 March
2017
Mr. Takehisa Kaneda
Directors Name No of shares %
Alternate Director to H Yamaguchi
Mr. R M Nanayakkara
Deshamanya M D D Peiris
Mr. W D K Jayawardena
Group Managing Director / CEO
Mr. H Yamaguchi
Mr. H Nishio
Top 20 shareholders as at 31 March 2017
Mr. I C Nanayakkara
Deputy Chairman (Alternate to Mr. R M Nananayakkara up to -
22.03.2017)
Mrs. K U Amarasinghe
Deseased - 22.03.2017
Mr. R A Fernando
Mr. K Okuno