Landscape resilience of Khweng, Ri Bhoi & Umsawwar, East ...
19
Landscape resilience of Khweng, Ri Bhoi & Umsawwar, East Khasi Hills Meghalaya
Transcript of Landscape resilience of Khweng, Ri Bhoi & Umsawwar, East ...

Landscape resilience of Khweng, Ri Bhoi & Umsawwar, East Khasi Hills Meghalaya

Copyright @ NESFAS
All Rights Reserved. No part of this book may be reproduced or u:lized in any form or by any means, electronic or mechanical, including photocopying, recording or any informa:on or any informa:on storage and retrieval system, without wri?en permission from the publisher.
October 2019, Shillong
ISSN:
Technical Supervisor: Lukas Pawera & Bhogtoram Mawroh Facilitators -‐
i. Gra:a Dkhar, Associate, NESFAS ii. Merrysha Nongrum, Associate, NESFAS iii. Naphishisha Nongsiej, Field Coordinator, NESFAS

Introduction Indigenous people in Meghalaya, North East
India and across the world are experiencing changing climate which has affected their agriculture, food and nutri:onal security. Indigenous people have coped with these changes using their own tradi:onal knowledge. Besides, the landscape has also been affected by external forces of materialism and consumerism which has also led to the exploita:on of natural resources in indigenous lands.
It is therefore impera:ve to understand the condi:on of their landscapes so that they can take relevant ac:on towards conserving their resources which will become a source of food and livelihood to improve their well being.

What is a resilience? Resilience can be described as a capacity to absorb/withstand shock (e.g. survive and recover aUer drought, flood, storm, wind, fire). And also to con:nually change, adapt and transform in response to external drivers, internal processes; and to have the opportunity for novelty and innova:on
Example 1: During a long drought, some crop species/varie:es were able to withstand the drought and ensure harvest for the farmers. And farmers were able to learn and in the next season plant more of drought-‐resilient crops. (resilience through agrobiodiversity)
Example 2: A farmer manages two land-‐use systems (wet paddy field in the lowland, and fruit agroforestry in the hills). The farmer lost paddy rice due to river floods caused by heavy rains, but the fruit agroforestry supported him as back-‐up land use. (resilience through land-‐use diversity)

What are the resilience indicators?
• The social-‐ecological resilience indicators “measure” the interrelated features of a landscape that confer resilience.
• The indicators are based on 20 ques:ons that need to be answered and discussed by community in a workshop/FGD.
• The indicators are grouped in five areas:
Ø Landscape diversity and ecosystem protecFon (4 ques:ons)
Ø Biodiversity (including agrobiodiversity) (3 ques:ons) Ø Knowledge and innovaFon (4 ques:ons) Ø Governance and social equity (4 ques:ons) Ø Livelihoods and well-‐being (5 ques:ons)

Resilience indicators, what for?
THE RESULTS OF RESILIENCE ASSESSMENT ARE USED TO
IDENTIFY CURRENT GAPS AND WAYS TO ENHANCE RESILIENCE (E.G. THROUGH LANDSCAPE
RESTORATION, FARM DIVERSIFICATION, BETTER
GOVERNANCE)
THE COMMUNITY CAN REACH CONSENSUS ON WAY
FORWARD, MAKE AN ACTION PLAN, AND START INCREASING
RESILIENCE OF THEIR LANDSCAPES, FARMING
SYSTEMS, AND COMMUNITIES

Toolkit This toolkit was developed as part of a Collabora:ve
Ac:vity by the United Na:ons University Ins:tute for the Advanced Study of Sustainability (UNU-‐IAS), Bioversity Interna:onal, Ins:tute for Global Environmental Strategies (IGES), and the United Na:ons Development Programme (UNDP) under the Interna:onal Partnership for the Satoyama Ini:a:ve (IPSI). The toolkit is based on the experiences of field tes:ng of the first set of the indicators conducted by Bioversity Interna:onal and UNDP. Na:onal Coordinators from the UNDP-‐implemented Global Environment Facility Small Grants Programme (GEF-‐SGP) in the twenty UNDP-‐COMDEKS countries provided valuable inputs to the development of the first set of the indicators, and have been playing a pivotal role in the tes:ng of the indicators, capturing the perspec:ves of communi:es in the field.

Procedure step by step
1. IntroducFon of the tool
2. ExplanaFon of the landscape
3. ExplanaFon of the climate change – Timeline drawing
4. ExplanaFon of the resilience and adaptaFon
5. Asking 20 quesFons – resilience indicators
6. Rapid data analysis
7. Sharing the findings and brainstorming soluFons with the community

FGD in Khweng 21.10.2019 10 participants FGD in Umsawwar 28.11.2019 17 participants
D u r a : o n : 2 . 5 h o u r s including sharing of results and brainstorming solu:ons.

Timeline results
Year Event Impact in Khweng
1979 Hailstorm All crops got destroeyd; fer:lity of land seem to have decreased
2007 Windstorm
Houses were damaged; trees were uprooted
2009 Pest damage to paddy rice
Very poor yield of wet and hill paddy; fer:lity of paddy in subsequent year was low
2016 Hail storm Houses were damaged; there was mimimal impact to agriculture because crops were not sown yet
Since the last decade
Changing rainfall pa?ern
Less predictable rainfall pa?ern is causing some problems, but the farmers do not perceive to be impacted strongly as they have been doing mul:cropping and certain crops always perform be?er than the others
Year Event Impact in Umsawwar
2007 Heavy rainfall and windstorm
Top soil washed away by rainwater down the rivers; landslide in agricultural lands
2010 Less dew Winter crops like green leafy vegetables suffered losses
2011 Windstorm Trees were uprooted and houses were damaged
2014 Drought Broom s:ck harvest suffered losses
2015 Drought Crop harvest suffered losses
2017 Strong wind and hailstorm
School got damaged due to strong winds
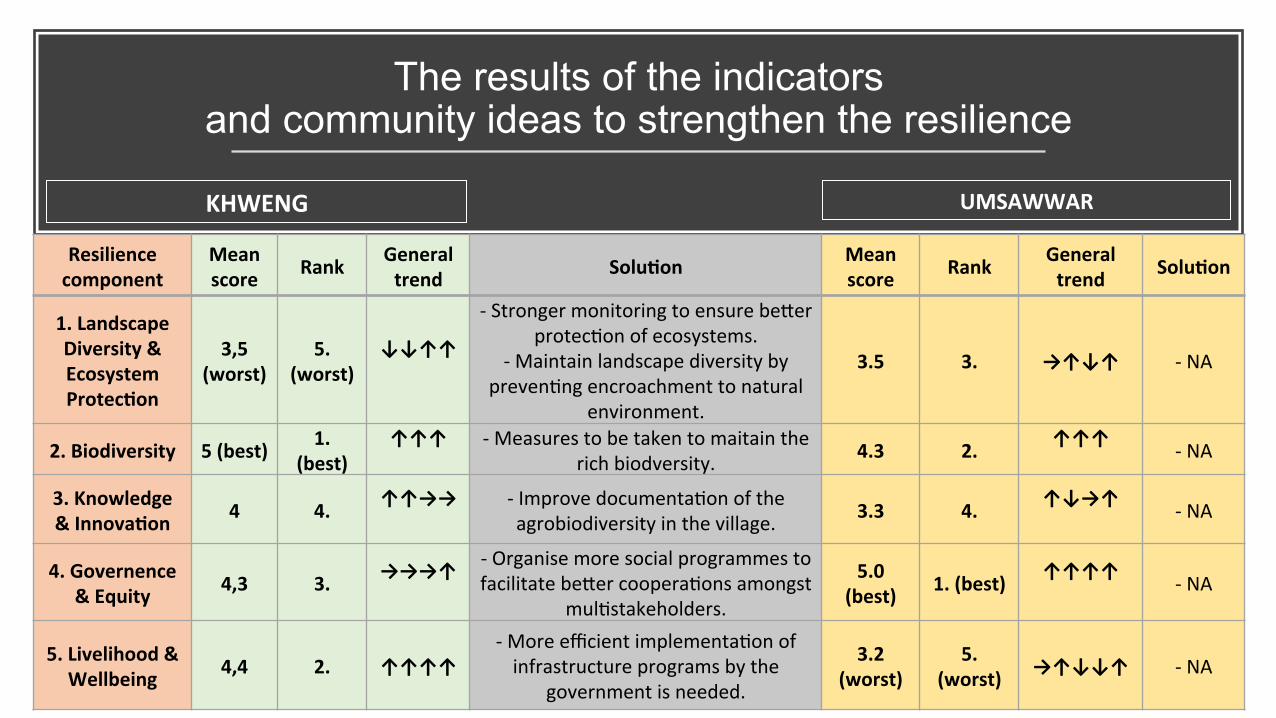
The results of the indicators and community ideas to strengthen the resilience
Resilience component
Mean score Rank General
trend SoluFon Mean score Rank General
trend SoluFon
1. Landscape Diversity & Ecosystem ProtecFon
3,5 (worst)
5. (worst)
↓↓↑↑
-‐ Stronger monitoring to ensure be?er protec:on of ecosystems.
-‐ Maintain landscape diversity by preven:ng encroachment to natural
environment.
3.5 3. →↑↓↑ -‐ NA
2. Biodiversity 5 (best) 1. (best)
↑↑↑
-‐ Measures to be taken to maitain the rich biodversity. 4.3 2. ↑↑↑
-‐ NA
3. Knowledge & InnovaFon 4 4. ↑↑→→
-‐ Improve documenta:on of the agrobiodiversity in the village. 3.3 4. ↑↓→↑
-‐ NA
4. Governence & Equity 4,3 3. →→→↑
-‐ Organise more social programmes to facilitate be?er coopera:ons amongst
mul:stakeholders.
5.0 (best) 1. (best) ↑↑↑↑
-‐ NA
5. Livelihood & Wellbeing 4,4 2. ↑↑↑↑
-‐ More efficient implementa:on of infrastructure programs by the
government is needed.
3.2 (worst)
5. (worst) →↑↓↓↑ -‐ NA
KHWENG UMSAWWAR

Example of indicators for the weakest component in Khweng:
Landscape Diversity and Ecosystem Protection INDICATOR QUESTION SCORE TREND REASON/NOTE
1. Landscape diversity
Is the landscape composed of diverse natural ecosystems and land uses? 3 ↓
Due to increasing popula:on, their is a gradual decline in the landscape diversity
2. Ecosystem protecFon
Are there areas in the landscape which are protected under formal or informal protec:on? 4 ↑
Water catchment and community forest are managed and protected
3. InteracFons between landscape components
Are ecological interac:ons between different landscape components considered while
managing natural resources? 3 ↓
Residents are aware of the ecological interac:ons but there are some who disregard
the importance of these interac:ons.
4. Landscape recovery
Does the landscape has the ability to recover and regenerate aUer extreme environmental shocks? 4 ↑
The landscape have the capacity to regenerate aUer shock but it takes :me

Example of indicators for the weakest component in Umsawwar:
Livelihood and Well Being INDICATOR QUESTION SCORE TREND REASON/NOTE
1. Socioeconomic infrastructure
Is the socio-‐economic infrastructure adequate for the needs of the community? 3 →
Infrastructure has improved from the past with MGNREGA playing a very important role
but is s:ll inadequate
2. Environment and human health
What is the general health situa:on of local people also considering the prevailing
environmental condi:ons? 4 ↑
Visits of workers from PHC and organisa:on like NESFAS and World Vision has improved
the health situa:on
3. Income diversity Are households in the community involved in a
variety of sustainable, income-‐genera:ng ac:vi:es?
2 ↓ Except for farming and daily wage labour
during off season there’s not much variety of income genera:ons ac:vi:es
4. Biodiversity based livelihood
Does the community develop innova:ve use of the local biodiversity for its livelihoods? 2 ↓
Only for subsistence and not for commercial purposes
5. Livelihood mobility Are households and communi:es able to move around between different produc:on ac:vi:es
and loca:ons as necessary? 5 ↑
Within the rules of village management council the community is free to move
between different ac:vi:es and loca:ons

Example of indicators for the strongest component in Khweng:
Biodiversity Indicator QuesFon Score Trend Reason/Note
5. Food system diversity
Does the community consume a diversity of locally-‐produced
food? 5 ↑
Most of the crops are cul:vated for own consump:on. Wild edibles are also highly
consumed by the community
6. Maintenance of agrobiodiversity
Are different local crops, varie:es and animal breeds conserved and used in
the community? 5 ↑
The seeds of local crops are saved tradi:onally. The local seeds are more
resilient than hybrid seeds according to the community.
7. Resource management
Are common resources managed sustainably? 5 ↑
The common resources are under the protec:on of the village administra:on

Example of indicators for the strongest component in Umsawwar: Governance and Equity
Indicator QuesFon Score Trend Reason/Note
6. Resource Rights
Does the community have customary and/or formally recognized rights over land, pastures,
water and natural resources? 5 ↑
Customary rights are protected by the village council which thinks about the future
genera:ons
7. Landscape governance
Is there a mul:-‐stakeholder landscape planorm or ins:tu:on able to effec:vely plan and manage
landscape resources? 5 ↑
Stakeholders like village council, SHG, women’s group, youth group, VEC group have important stakes in landscape governance
8. Social Capital
Is there connec:on, coordina:on and coopera:on within and between communi:es for the
management of natural resources? 5 ↑ Coopera:on and coordina:on is very close
9. Social and gender equity
Is access to opportuni:es and resources fair and equitable for all community members, including women, at household, community and landscape
level?
5 ↑ The village council ensures fair and equitable
access to all

Summary of Findings of Khweng
I. In Khweng community, the most resilient component was Biodiversity, followed by Livelihood and Well-‐being, Governence and Equity and Knowledge and Innova:on.
II. The least resilient component was Landscape Diversity and Ecosystem Protec:on.
III. In terms of trends, the most posi:ve trend across all indicators have two components, Livelihood and Wellbeing and Biodiversity. Then, Knowledge and Innova:on is par:ally stable and par:ally increasing followed by Land Governence and Equity is rather stable with a slight improvement, and lastly Landscape Diversity and Ecosystem Protec:on reached 50% of increasing and 50% of decreasing indicators, so there should be taken ac:on for reversing the downward trends.

Summary of Findings of Umsawwar
I. In Umsawwar community, the most resilient component was Governance and Equity followed by Biodiversity, Landscape Diversity and Ecosystem Protec:on, Knowledge and Innova:on.
II. The weakest component in the community is livelihood and wellbeing
III. In terms of trends the indicators under Governance and Biodiversity followed by Biodiversity showed the most posi:ve trends, in fact in all of them. Landscape Diversity and Ecosystem protec:on showed more stability with 50% of the indicators increasing with the remaining indicators showing a decrease or stable trend. Landscape Diversity and Ecosystem Protec:on had 50% of the indicators decreasing and other half stable or increasing.

Strengths & Limitations Strength of the tool:
According to the facilitators who used the tool in the communi:es, the strength of the tool is that it covered all aspects of resilience that will help community to adequately map out an integrated resource management plans, it helps communities realise their strengths and weaknesses of their own village and the the tool enables communi:es to iden:fy the solu:ons which could make them more resilient in future. This is extremely useful especially for those villages which suffer from rapid landscape changes and from low resilience.
Weakness of the tool:
Although the tool is covering complex set of socio-‐ecological landscape components and different capitals, it is somewhat neglec:ng the issues of soil, agriculture and agroecology. This is a bit surprising as the tool is designed to be operated predominantly in the rural farming landscape. For example, at the beginning during the :meline, Khweng community oUen talked about soil fer:lity and that they are improving its fer:lity (and resilience) by organic ma?er. But this issue remained untouched during running the 20 resilience indicators.

NESFAS way forward…
Sharing results to a larger audience in Khweng & Umsawwar and turning the results into a community ac:on plan
Conduc:ng RI in the villages of the fellows
Replica:ng the tool by the research team and FC in villages which might be suffering from low resilience (list of villages, workplan..)
Experienced facilitators could train other members of the staff