LANDSCAPE AND URBAN PLANNING - Accueil · 1 LANDSCAPE AND URBAN PLANNING ELSEVIER TAMA NEW TOWN,...
35
1 LANDSCAPE AND URBAN PLANNING ELSEVIER TAMA NEW TOWN, WEST OF TOKYO: ANALYSIS OF A SHRINKING SUBURB Estelle DUCOM 1 Graduate School of Systems and Information Engineering Institute of Policy and Planning Sciences University of Tsukuba TSUKUBA, Ibaraki, 305-8573 JAPAN e.mail: [email protected] Tel. 33 (1) 40 46 40 00 Fax :33 (1) 40 46 40 09 1 Present address : Associate Professor Paris 4 Sorbonne University – Institute of geography 191 rue Saint Jacques – 75005 Paris e.mail : [email protected]
Transcript of LANDSCAPE AND URBAN PLANNING - Accueil · 1 LANDSCAPE AND URBAN PLANNING ELSEVIER TAMA NEW TOWN,...

1
LANDSCAPE AND URBAN PLANNING
ELSEVIER
TAMA NEW TOWN, WEST OF TOKYO: ANALYSIS OF A SHRINKING SUBURB
Estelle DUCOM1
Graduate School of Systems and Information Engineering Institute of Policy and Planning Sciences
University of Tsukuba TSUKUBA, Ibaraki, 305-8573 JAPAN
e.mail: [email protected]
Tel. 33 (1) 40 46 40 00 Fax :33 (1) 40 46 40 09
1 Present address : Associate Professor Paris 4 Sorbonne University – Institute of geography 191 rue Saint Jacques – 75005 Paris e.mail : [email protected]

2
TAMA NEW TOWN, WEST OF TOKYO: ANALYSIS OF A SHRINKING SUBURB.
Abstract: This paper aims at analyzing the process of urban shrinkage in the Japanese frame.
It focuses on the case of Tama New town, developed at the end of the sixties 40 km West of
Tokyo during a period of demographic boom. Nowadays, this ageing new town is
representative of Tokyo’s shrinking suburb. Criteria of shrinkage are defined and tested in
Tama. Thus, it is possible to delimit a form of retraction or shrinkage characteristic of that
kind of suburb. As a result, applied solutions are proposed, calling into question a model of
urbanization (endless urban sprawl) and bringing to the fore new debates concerning
reversibility and sustainability of town planning.
Key words: new town, suburb, ageing, shrinkage, planning, reversibility.
Introduction
The traditional Japanese urban model is currently undergoing major transformations. Large
cities, which had been continuously sprawling, are now experiencing an adverse process, due
to population’s decline (Fujimasa, Furukawa, 2000) and ageing and sluggish land markets
(Aveline, 2003, 2004). This began some years ago, but it is now reaching a critical point. It
mostly concerns more distant suburbs. According to Yutaka Harada, chief economist at
Daiwa Institute of Research Ltd., “a shrinking population will bring a better living
environment for each individual in this small crowded country, including fewer commuters on
rush-hour trains and greater residential space per person” (The Japan Times, January 1st,
2005). But at a local scale, it raises the question about the effects of urban shrinkage. A
notable instance of this is the case of new towns like Kozoji New Town (20 km from
Nagoya), Senri (30 km of Osaka), Tama New Town, (35 km West of Tokyo), etc. These new

3
towns were developed by metropolitan governments at the end of the 1960’s, in a context of
rapid economic and demographic growth, in order to prevent unplanned urbanization in the
suburbs, endless urban sprawl, and to provide a large amount of housing with a good living
environment (Homma, 1998). At present, these new towns are becoming old towns and
concentrating declining suburbs’ problems: massive population ageing and loss, convulsed
neighbourhoods, buildings emptiness, landscape degradation, urban life erosion. This burning
issue awaits detailed consideration by the full range of disciplines and professions concerned
with cities. The reality of shrinking cities, an increasing phenomenon, has until very recently
been overlooked. But research on this topic has been developing in the last five years,
especially in Germany (Bontje 2005, Kabisch 2006, Lötscher, 2004, Müller 2003, Oswalt
2006, Weidner, 2004), and it is now possible to understand the impact of urban shrinkage and
what strategies of urban transformation can be implemented.
The first part of this paper will provide a brief general outline of the shrinking process and of
the Japanese case in particular. Then, we will focus on the case of Tama New Town,
developed from 1967, 35 km West of Tokyo. We will try to demonstrate to what extent Tama
New Town is representative of Japanese shrinking suburbs. As a result, this analysis provides
an opportunity to clearly understand the phenomenon. Planning perspectives and propositions
to solve this problem are addressed in the third and last part of the paper.
I) URBAN SHRINKAGE: INTERNATIONAL PERSPECTIVES
A- AN EMERGING PROCESS
Urban growth processes and their implications for urban form have been widely analysed.
However, until recently, relatively little attention had been given to urban shrinkage, despite
its significance at present in many parts of the world: Japan, Korea, Germany, Eastern
Europe, United Kingdom, United States…(Oswalt, 2006). Now the issue starts to be studied
4
in details, especially in Germany where the process has already begun (cf references in the
introduction). This helps to sharpen the definition. What does one mean by shrinkage?
According to the international shrinking cities project group, it is characterized by “a
sustained loss in population accompanied by symptoms of economic crisis2”. To avoid a
confusion with counter-urbanization, migration beyond the municipal or metropolitan
boundaries (Berry, 1976), a morphological criteria could be added. It seems that in European
urban models, decreasing suburbanization is necessary to talk about shrinkage. Whereas
counter-urbanization implies urban contraction on a local scale by the movement of people
and employment away from large cities to places outside the cities, including small towns,
villages and rural areas (Berry, 1976), urban shrinkage tends to involve a transfer of
population towards centres. According to Müller and Siedentop (2004), in Germany, “as long
ago as the mid-1990s, dynamic migration from cities to surrounding areas meant that
population decline in core cities was more intensive than in peripheral rural areas. But since
1997 annual population decline in core cities has steadily eased, while not only rural areas
nevertheless suburban communities are also shrinking”. For both authors, it raises an
important question: “will suburbanisation and dispersion intensity continue to diminish under
the specific conditions of demographic decline”? A number of large cities that had been
extending their built-up areas over a very long period are now physically contracting,
associated with, for example, industrial decline (Pallagst, 2005, Oswalt, 2006), population
shrinkage (Fujimasa and Furukawa, 2000), sluggish land markets (Aveline and Ling-Hin,
2004) and political changes (Oswalt, 2006). The forces involved are sometimes acting in
concert and sometimes independently. This process of contraction is liable to affect an
increasing number of cities in the near future. The phenomenon of shrinkage seems to be a
multidimensional and complex process (Pallagst, 2005).
2 World Planning Schools Congress: Diversity and Multiplicity—A New Agenda for the World Planning Community. July 11–16, 2006. Palacio de Minería, Mexico City, Mexico.

5
B- THE JAPANESE CONTEXT
In Japan, the traditional urban model is currently undergoing major transformations. “In the
postwar period, national and local governments in Japan made their spatial planning policies
by assuming ever-growing socioeconomic conditions” (Feldhoff 2005). Until the beginning of
the 1990’s, the traditional Japanese urban model was based on both demographic and
economic expansion, which led to a huge urban sprawl. But important changes occurred: first,
the end of the economic bubble and second, ageing and even population decline since 2005
(Ducom 2007). That is part of the second demographic transition (Van de Kaa, 2002). If the
current fertility rate remains (1,24), demographic projections claim that the Japanese
population could fall from 127 millions under 100 millions in 20383. Figure 1 illustrates this
changing demographic structure. Until recently, the problem of aging and shrinking
population was highly present in the countryside. But many urban areas are now facing the
same situation. It is new, but according to demographic projections, the trend should last. As a
spatial consequence, large cities, which had been continuously sprawling, are now
experiencing an adverse process (Flüchter, 2006, Fujii, Yasuyuki, 2006). Even in Tokyo
itself, which is still slowly growing (figure 2), remote suburbs are almost not growing any
more, whereas the city centre’s population, which had been continuously decreasing since the
1970’s, is now increasing. At very local scales, some areas included in more distant suburbs
are now already losing residents (Ducom and Yokohari, 2006). There seems to be a transfer
of population towards the city centre, which is currently being ‘densified’ by private
developers, encouraged by the law on urban renewal of 2002. Several districts, like
Shiodome in Minato-Ku (central Tokyo, figure 3), have recently been transformed from
railway terminals to skycraper districts of offices, hotels, restaurants, shops and luxury
housing. Such projects, supported by Tokyo metropolitan government, widen the gap
3 Source : Japanese National Institute of Population and Social Security Research

6
between increasingly powerful and compact centres and declining peripheries (Aveline,
2003). Is this “more than a short-term, cyclical interruption of an enduring deconcentration
process”? Will demographic shrinkage “diminish suburbanisation”? (Müller, 2003). Despite
the deepening problem, planning practitioners continue to concentrate their energy on
managing urban renewal and redeveloping city centres, thus exacerbating the problems of
distant suburbs.
Tama New Town is a typical example of these remote declining suburbs. It illustrates the
challenges faced by individuals and organizations, in both the public and private sectors, in
addressing the consequences of shrinkage.
II) THE PARADOX OF 惇AN OLD NEW TOWN敦
A- OUTLINE OF TAMA NEW TOWN PROJECT
Tama New Town is located in the Southwestern part of Tokyo, at a distance of 35 km from
Tokyo Station (figure 4). It is connected to Shinjuku, one of the major business areas in
Tokyo, by to railways. The new town has an East-West length of 14 km and a North-South
width of 2 to 4 km. Around 1960, the demographic boom, the sharp rise of land prices and the
high housing demand in Tokyo led to an important urban sprawl. To prevent further random
developments and unplanned urbanization in the suburbs, and to supply a large amount of
housing offering a good living environment, Tokyo Metropolitan Government set up Tama
New Town project in 1965. The new town is straddling the municipalities of Tama, Hachioji,
Inagi and Machida. As illustrated in table 1, three public organizations carried out the project:
Tokyo Metropolitan Government, the Tokyo Metropolitan Housing Supply Corporation
(TMHSC: a Tokyo Metropolitan Governmental agency for housing supply) and the Japan
Housing Corporation (JHC: a national agency for housing supply) which became the Housing

7
and Urban Development Corporation (HUD, a national agency established in 1981 through
integration of the JHC), and then the Urban Renaissance Agency (UR, a national agency
established in 2004 by integration of former HUD). The new town was divided into two types
of areas: new residential development programs on hills, and land readjustment programs in
valleys.
The new residential development program areas were divided into 21 neighbourhood units.
Each unit consisted in 100 ha containing 3000 to 5000 dwellings supposed to host 12000 to
20000 people, two elementary and one secondary schools, neighbourhood centres with stores
and facilities along pedestrianized streets. In 1971, the first housing estates of Tama New
Town opened in Suwa and Nagayama districts. Many danchi were developed (figures 5-6:
standardized apartments buildings with five stories, parallel located). Each dwelling unit of
around 50 m² consists of two or three rooms and a dining room with a kitchen (2DK, 3DK).
In 1975, the number of supplied houses per year reached a peak. In contrast, JHC mass
housing began to lose popularity, being judged remote from Tokyo, expensive and small.
From 1975 to 1985, new types of multiple dwelling housing were sought. At the end of the
1980’s, under the asset-inflated bubble economy, high density housing complexes were built
by the Tokyo Metropolitan Housing Supply Corporation and the Housing and Urban
Development Corporation. Eventually, after the bubble economy in the 1990’s, the land prices
decline and the redevelopment projects in central Tokyo have caused the return of population
into central Tokyo and the unpopularity of old housing remote from stations in Tama New
Town. The private sector took over supply of owner-occupied housing in Tama New Town
from public sector, and in 2000, Tokyo Metropolitan Government and the Urban Renaissance
Agency declared completion of Tama New Town development project. The evolution of land
8
prices in the new town from the beginning (figure 7) illustrates these changes: after reaching a
peak in 1994, the prices have decreased until now.
B- CURRENT DEMOGRAPHIC SITUATION
Tama New Town's population is now rapidly ageing, faster actually than the national average
(Doteuchi, Shiraishi, 1998). Fewer children are being born and beside, fewer young couples
have settled in Tama New Town. Table 1 shows that the formerly projected population of
342200 people is far from having been reached. According to Tama Development Office,
Tama New Town had 201443 inhabitants in 2004, hardly 60% of the projected population. Of
noticeable interest is that the population is not evolving equally in the whole new town. It is
striking that the units of early development are the most declining. Tama City for instance,
chore of the new town’s development, roughly 70 percent of whose population lives in Tama
New Town, peaked at 145,677 inhabitants in 1994 before sliding to 141,180 as of 2002,
whereas Inagi or Hachioji population were still growing (figure 8). In areas such as South of
Nagayama Station, developed at the beginning of the 1970’s, where newcomers massively
belonged to a similar age group, residents have massively grown old (25% of residents are
more than 65 years old). As illustrated on figure 9, the population distribution by age can be
very different from one district to another. In the area of Wakabadai, developed in the late
1990’s, most of the population is between 30 and 44 years old, whereas in Toyogaoka,
developed in the early 1970’s, most of the residents are between 50 and 69 years old. Last but
not least, the family structure is changing. In 1991, the average number of family members
per dwelling unit was 2.9, and 2.3 in 2004. When people moved in, there used to be children
everywhere. Tama was a lively place. But the number of pupils at Tama's public schools has

9
halved from a peak of 16,779 in 1988 to 7,487 in 2002, leading local authorities to close six
out of 37 schools over the past decade. According to the National Institute of Population and
Social Security Research, the percentage of elderly people (at least 65 years old) could reach
70% in some districts in 2030. The new town, once the symbol of a rising Japan, now
represents a population in decline. This situation has of course important implications in terms
of spatial organization.
C- A REPRESENTATIVE CASE STUDY
These demographic trends and sluggish housing market are key features of decline. They
imply spatial impacts including more and more vacancies, emerging social problems,
abandoned facilities, landscape degradation. This special pattern of shrinkage essentially due
to demographic decline is not specific to Tama New Town, which is rather typical and
representative of what is happening in that kind of remote suburb, as illustrated on figure 2.
Indeed, if we check different criteria such as demographic statistics, landscape evolution,
land-use, perceptions, then we understand that similar schemes are occurring all around
Japan.
We conducted a detailed follow-up in Tama New Town by data (statistics, photos, maps,
interviews ) and methodologies crossing. Elements of urban life erosion are the first
indications of shrinkage in Tama. The neighbourhood centres in the units of early
development are declining. Concerning housing, according to the Nagayama danchi
information centre, the rate of vacancy in rented apartments can reach 20%. This phenomenon
massively concentrates in the apartments built in 1971 (figures 10-11). It is obvious that these
apartments don’t correspond to current aspirations any more. Many young couples are no
longer interested in old apartment units with small rooms built on earlier standards. In the

10
same way, small shops located on first floors of buildings, along pedestrianized streets, don’t
attract visitors any more. They are deserted, being judged to small, old-fashioned and hardly
accessible by car or train. Bigger malls are preferred. As a result, these small neighbourhood
shops are closing one after another (figure 12). According to Tama City Development Office,
the vacancy rate of first floor shops reached 30% in 2004. In terms of perception, interviews
conducted by the author by local population in Tama (Ducom, 2006) stress a strong feeling of
loneliness and desertion. The expression 惇ghost city敦 was often pronounced to describe the
new town’s atmosphere nowadays. Residents suffer from a lack of social interaction; they
don’t feel themselves as members of a community. The inhabitants also seem to have felt
abandoned by local authorities since Tokyo Metropolitan Government and the Urban
Renaissance Agency declared completion of Tama New Town development project, leaving
further developments in the hands of the private sector. It recalls the “simulation city”
described by Yatsuka (1994).
Landscape constitutes the most obvious indicator of change. A degradation is detectable. The
comparison of figures 5-6 and figures 10-11 underlines that danchi have grown old and look
unattractive. In addition, abandoned elements lead to the construction of the “ghost city”
image: closed schools for lack of pupils (figure 13), abandoned playgrounds for lack of
children (figures 14-15). A place might be shrinking when its image, in terms of perception, is
shrinking… Beside, some planning concept now avoid accessibilities to basic services and
amenities. For example, the principe of separation of cars and pedestrianized streets
contributes to important accessibility problems. Highways are located in the valleys and
pedestrianized streets on the hills (figures 16-17). As a result, elderly people encounter more
and more difficulties to move through the new town. Pedestrianized streets become

11
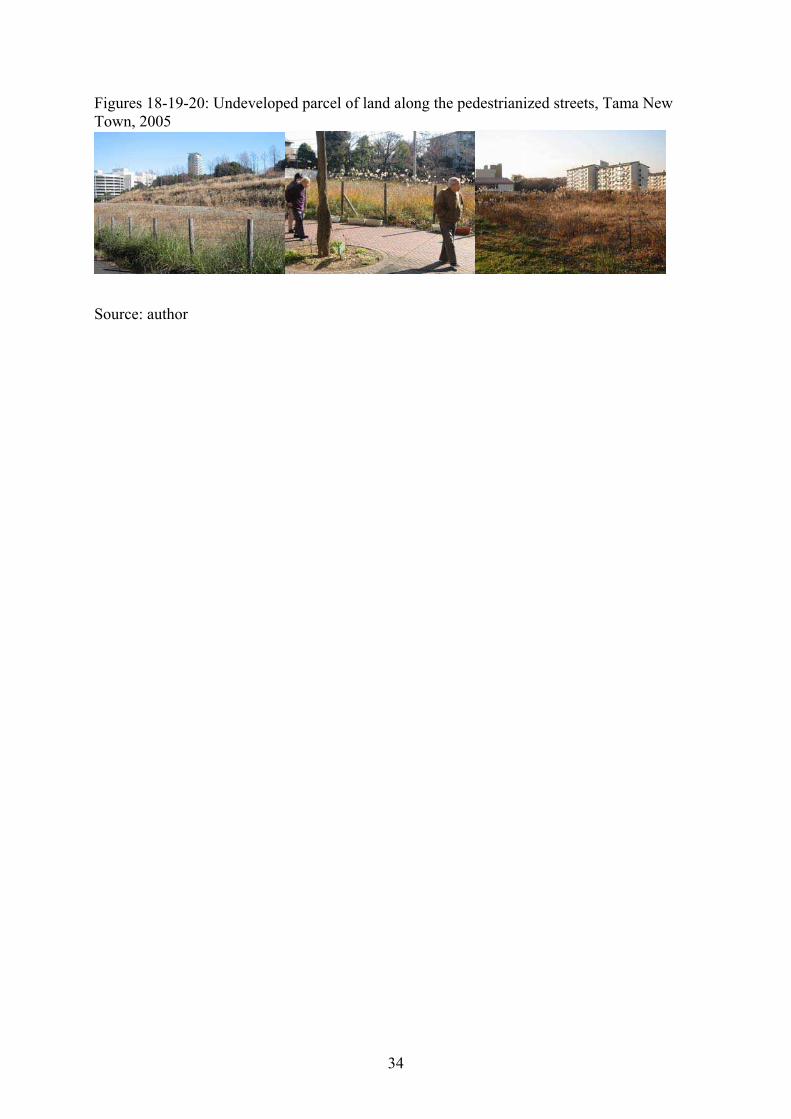
underused, often empty. Along them, the last free parcels don’t interest developers any more
and vegetation is claiming back land (figures 18 to 20). A study of similar un-urbanized
housing land developments in the new town of Tsukuba (North East of Tokyo) was conducted
by Yoshida (2003). To understand if this landscape slow degradation reflects deeper spatial
transformations, it is necessary to analyse the land use. We conducted a follow up of Tama
New Town land use from 1991 to 2002, using geographical information systems (Arcgis) with
Tokyo Metropolitan Government digital data. Figure 21 represents the evolution of land use,
with three different categories: residential sectors, public and private equipments (public
equipments such as schools, halls, hospital… and private equipments such as offices,
industries, shops…), open spaces (parks, playgrounds, agricultural land, brownfields).
Residential sectors have considerably expanded, which is not surprising for a dormitory
settlement. What is striking is that the open spaces category has retracted through time.
Fallow lands have been replaced by residential developments. In terms of land occupation, it
would be inaccurate to speak about urban contraction, at least until 2002. Nevertheless,
developments essentially expanded between 1991 and 1996. Between 1996 and 2002, it is
interesting to notice that expansion slows down. It illustrates a decrease of pressure for land
occupation in this area. Since the data are approximately updated every sixth year, the next
ones should be available around 2008 and should cast new light on shrinking processes. After
the relative stagnation observed between 1996 and 2002 in terms of land use, the last period
might be the scene of spatial retraction of suburban settlements (demolitions of empty
buildings, closed schools, etc…). This phenomenon of disurbanization, “Rückbau” in
German, has already taken place in certain cities of Eastern Germany (Bontje 2005, Pallagst
2005, Siedentop and Kausch, 2004). It would mean that shrinkage first occurs with population
decline, urban life erosion, and then physically and spatially, with urban contraction.

12
Several conclusions can be drawn from these observations. First, the shrinkage observed in
Tama is of a particular kind. On the contrary of the “classical” shrinking cities general pattern
in the world, where industrial production and investment moved elsewhere, leading to
characteristic inactive factories and brownfields, Tama New Town “only” suffers from
ageing. Therefore, it looks like a dormitory settlement slowly emptying of its social contents.
Along landscape lines, it shows itself selectively, at a microscale. Second, the time-lag
between social and physical modifications reflects a phenomenon of inertia, in other words a
dichotomy between the container and the contents. In this regard, physical urban contraction
might constitute the last step of urban shrinkage. This point has to be checked and dealt with.
Third, this specific Japanese way of urban shrinkage of which Tama New Town is
representative can be explained by the gap between former needs (to answer to which the new
town was developed) and current needs, a growing inadequacy between obsolete urban forms
and changing aspirations (for example, oversizing educational services, undersizing health
and elder car services). Put simply, there are hardly any newcomers since it is now possible to
find better options of housing nearer from Tokyo centre. Tama New Town can have been an
optimum residential solution in a particular context, which is not the case any more. Fourth,
Japanese distant suburbs currently experience a very classical situation: they were brought
into existence relatively recently during mounting pressure on land, and they are proving to be
the first to be abandoned as pressure decreases. (Flüchter, 2005). General geographical
models of settlement and desertion have been developed, not only for urban studies (Ducom,
2003). But The transition from urban sprawl to urban shrinkage raises questions about the
sustainability and reversibility of urban developments and about the appropriateness of the
traditional urban model and its capacity for adaptation.
III) SOLUTIONS AND NEW DEBATES
A- CALLING INTO QUESTION A MODEL OF URBANIZATION

13
This new situation calls into question the traditional Japanese model of urbanization, based on
economic and demographic expansion, and which created endless urban sprawl of mass
housing for people who could not afford to settle near the city centre and who were ready to
commute several hours a day between home and work. This model has been criticized for a
few years now (Tanabe, 1991, Doteuchi, 1998, see also the movie Pompoko). Obviously, in
view of the shrinking cities phenomena, some planning concepts need revision. It is for
example amazing to see how little consideration was given to new residents’ aging in the
future, especially in terms of accessibility: medium-rise buildings with no elevators and hilly
landscape of Tama New Town are now challenging elderly people. But all these elements
could have been taken in account from the beginning in a more long-term view. That is the
principle of sustainability. Indeed, in terms of demography, projections can be reliable.
Therefore, new towns, which might have constituted the solution at a time, could have been
planned in a more reversible way. A notable and applied instance of this is the case of a
school built in Tama in order to be transformable into an elderly people’s home, which it
became in 2005, after the school closed. As a product of cycles of development and desertion,
new towns could have been considered and planned as transient, reversible settlements. The
increasing part of elderly now generates demand for new kind of urban services like
transportation, medical assistance, adapted housing, leisure. It raises the question of
accommodating specifically for elderly people (Pihet, 2006). The risk is to produce
segregated retirement communities. This trend implies that the population will decrease in the
near future. At that moment, authorities will have to face abandoned and empty urban
territories. The challenge Tama New Town has now to face is to adapt the urban spatial
structure so as to accommodate new specific needs due to changes in the population structure.
Adaptations can be of many kinds. Concerning existing structures, light modifications such as
installing elevators in danchi (95% of which are not equipped for the moment) could be easily

14
implemented. The use of closed schools for new functions such as community centres is also
a solution already successfully implemented in Tama New Town. But in terms of governance,
who should do what? Public and private initiatives are articulated. In Tama New Town, Non
Profit Organizations (NPO) are the key-actors playing a major role in the adaptation process
(Bothwell, 2003). 40% of the existing NPO deal with the problem of accessibility by offering
alternative and light transit systems. Other NPO operate as day-care service centres. The
Fukushitei for example, situated in one of the first floor ancient shops along the
pedestrianized street in Nagayama district, welcomes everyday around 40 elderly people, all
living in the neighbourhood, and often clients and volunteers at the same time. Medical meals
and services are provided. Beside, people can enjoy an atmosphere of community.
B- GROWTH VERSUS SHRINKAGE: A NEW PARADIGM
Local authorities have recognised the importance of the issue, but there is little consensus on
policy. An international workshop was organised in 2006 by Tokyo Metropolitan University
and the 4-MET centre to deal with the specific problems of in Tama New Town. It is obvious
that completely novel action is required. However, there is a curious failure to acknowledge
the situation and the implications of projections of declining populations. When the issue is
broached, it is only to debate about reversing the process, in order to achieving growth. For
example, the first strategy elaborated by local authorities is the adoption of measures to
support child-raising households, including dispatching helpers for pregnant women and
households with infants, but there is no reversing effect for the moment. Other example: in
Tsukuba (another new town, 60 km North East of Tokyo), a development project is planned
to host 80000 new comers by 2030, even if the housing demand has already started
decreasing... (Yoshida, 2003). Of course, these solutions are less and less appropriate to the
new challenges. Wrong solutions are chosen because of a firm belief

15
in the short-term nature of shrinkage and the expectation that the “natural
state” of growth will return. Whereas in Germany, authorities have already implemented
several responses to shrinkage (Weidner, 2003), with the concept of Rückbau, in Japan, it is
as if growth was the “normal” situation. Despite the extent of the problem, planning practice
continues to concentrate on managing urban renewal and redevelopment of the city centre,
thus exacerbating the problems of distant suburbs. There is a curious failure to acknowledge
the implications of projections of declining populations. But as underlined by Müller (2004)
“fundamental rethinking is required. Growth-oriented approaches must be paralleled by a
"decline paradigm". It is less a question of what infrastructure should be provided than how
and under what conditions infrastructure systems can be maintained or have to be
redesigned”. Will demolition of substantial portions of the housing stock form the only
possible to avoid the appearance of “ghost towns” in Tama? Who will finance this? Again, the
question of governance is raised.
The phenomenon of shrinkage is discontinuous and comprises fragmented areas. Therefore, it
has to be taken in account at a global and local scale at the same time. Suburban shrinkage
and downsizing address the scale of metropolitan regions and requires policy-makers to
“redefine traditional paths of regional governance” (Pallagst, 2005).
Conclusion:
In the light of international research, we demonstrated a specific type of shrinkage due to
population aging and decrease. If conclusions in terms of land use are still limited to stress
spatial urban contraction, it is obvious that shrinkage has started in Japanese distant suburbs.
The transition from urban sprawl to urban shrinkage raises after-sprawl planning perspectives.
It questions the sustainability and reversibility of urban developments and the appropriateness
of the traditional urban model and its capacity for adaptation. The way the Japanese urban
society will face this dramatic situation should give Japan a leading role in terms of

16
challenging population ageing and shrinkage and the spatial implications. As Feldhoff (2005)
asks, “wether new forms of bottom-up urban and regional governance instead of top-down
urban and regional planning will be born out of the ongoing changes is a question that has yet
to be answered”. Population decline can also be considered as an opportunity in high density
areas. The problematic in such shrinking suburbs is indeed quite different from the one in
desert regions, where the alternative is maintain or abandonment of services, structures,
general environment. Here, on the contrary, it can be the moment to rethink urban design and
quality improvement (new open spaces, new green areas…), mobilizing endogenous
resources. Many scenario have already been thought (Ducom, Yokohari, 2006). Some of them
sound realistic, others very utopian. Nevertheless, they prove that in a way, shrinkage can
represent a chance for acting.
References
Aveline N., (2003) « L'expérience particulière du Japon en matière de renouvellement
urbain », Droit et Ville 55, p.59-69.
Aveline N., Ling-Hin L. (dir.) (2004) Property Markets and Land Policies in Northeast Asia.
The Case of Five Cities: Tokyo, Seoul, Shanghai, Taipei and Hong Kong, Hongkong, Tokyo,
Maison Franco-Japonaise / Center for Real Estate and Urban Economics.
Bontje M ; (2005). “ Facing the challenge of shrinking cities in East Germany: the case of
Leipzig”. Geojournal, Springer, vol. 61, N°1, p. 13-21.
Berry, B. J. L. (ed.) (1976) Urbanization and counterurbanization (Sage, Beverly Hills, CA).
Bothwell, Robert O. (2003). The challenges of growing the NPO and voluntary sector in
Japan. In: Osborne, Stephen P. (ed.). The Voluntary and Non-Profit Sector in Japan. The
challenge of change. London, New York: Routledge Curzon, 121–149.
Cunningham-Sabot E., Fol S., 2006, Shrinking Cities in Western Europe: Case Studies from
France and Great Britain, International Symposium "Coping with City Shrinkage and

17
Demographic Change - Lessons from around the Globe" 30.-31.03.2006 Dresden, Germany.
De Geyler, X. (2000). Research for the contemporary city after sprawl. NAI Publication.
Doteuchi, A. Shiraishi, M. (1998). Aging issues in new towns developments: the Tama
Newtown case. Socioeconomics 5.
Ducom, E. (2003). La dynamique spatiale d’un « vide » breton : les Landes de Lanvaux
depuis la fin du XIXème siècle. Mappemonde 71.3, 19-24.
Ducom, E. Yokohari, M. (2006). L’involution démographique et urbaine dans l’aire tokyoïte.
Les Annales de la recherche urbaine 100, 23-29.
Ducom, E. (2007). Vieillissement et aménagement : la « laboratoire » japonais. Population et
Avenir 683, 4-7 + 20.
Feldhoff, Thomas (2005): Bau-Lobbyismus in Japan. Institutionelle Grundlagen –
Akteursnetzwerke – Raumwirksamkeit. Dortmund: Dortmunder Vertrieb für Bau- und
Planungsliteratur.
Flüchter, W. (2006). Megalopolises and Rural Peripheries. Shrinking Cities in Japan. In:
Oswalt, Philipp (ed.) (2006). Shrinking Cities. Vol. 1: International Research. Ostfildern-Ruit:
Hatje Cantz, p. 83-92.
Fujii, Yasuyuki (2006): Shrinkage in Japan. In: Oswalt, Philipp (ed.): Shrinking Cities. Vol.
1: International Research. Ostfildern-Ruit: Hatje Cantz, pp. 96–100.
Fujimasa, I., Furukawa, T. (2000). Welcome Jinko Gensho Shakai (Welcome Population
Decrease Era). Tokyo: Bungeishunju.
Ghékière, JF. (2006). La distribution des âges dans la ville ; le vieillissement des espaces
urbains conçu pour les jeunes. Les Annales de la recherche urbaine 100, 7-15.
Homma, T. (1998). Tokyo suburbia. Tokyo : Korinsha Press.

18
Kabisch, S., Haase, A., Haase, D. (2006): “Beyond growth - urban development in shrinking
cities as a challenge for modeling approaches”. IEMSS Annual Conference 2006, conference
proceedings, 6 S., ISBN 1-4243-0852-6 (CD-Rom)
Kabisch, S. (2006): „Stadtumbau Ost und West: Chancen und Grenzen von Schrumpfung“.
In: Kulke, E., Monheim, H., Wittmann, P. (Hrsg.): Grenzwerte, Tagungsbericht und
wissenschaftliche Abhandlungen des 55. Deutschen Geographentages Trier 2005, Berlin,
Leipzig, Trier 2006, p. 257-265
Kabisch, S. (2005) “Empirical analyses on housing vacancy and urban shrinkage”. In: Hurol,
Yonca; Vestbro Dick, Urban; Wilkinson, Nicholas: Methodologies in Housing Research. The
urban international press, Gateshead, GB, p. 188-205
Kabisch, S., Bernt, M., Peter, A. (2004): Stadtumbau unter Schrumpfungsbedingungen: Eine
sozialwissenschaftliche Fallstudie. Wiesbaden, vs Verlag für Sozialwissenschaften.
Lötscher L., Howest F., Basten L. (2004). Eisenhüttenstadt: Monitoring a shrinking German
city. Dela 21. 361-370
Müller, B. (2003), Regionalentwicklung unter Schrumpfungsbedingungen, in:
Raumforschung und Raumordnung, H. 1-2, 28-42.
Müller B., Siedentop S. (2004): “Growth and Shrinkage in Germany - Trends, Perspectives
and Challenges for Spatial Planning and Development”, German Journal of Urban Studies
Vol. 44‚ No. 1.
Oswalt, Philipp (ed.) (2006). Shrinking Cities. Vol. 1: International Research. Ostfildern-Ruit:
Hatje Cantz.
Pallagst, K. (2005). The End of the Growth Machine: New Requirements for Regional
Governance in an Era of Shrinking Cities. Kansas City: ACSP Congress.
Peter F. (2004): Shrinking Cities - Shrinking Economy? The Case of East Germany. German
Journal of Urban Studies Vol. 44‚ No. 1.

19
Pihet, C. (2006). Du vieillissement dans les villes à des villes pour le vieillissement?
Réflexion sur quelques exemples français. Les Annales de la recherche urbaine 100, 15-23.
Siedentop, S./Kausch, S. (2003). Der Übergang in die "schrumpfende Gesellschaft".
Räumliche Ausprägung von Wachstums- und Schrumpfungsprozessen in deutschen
Agglomerationsräumen - ein Überblick, in: Hutter, G./Iwanow, I./Müller, B. (eds.):
Demographischer Wandel und Strategien der Bestandsentwicklung in Städten und Regionen,
Dresden (Reihe IÖR-Schriften, H. 41).
Tanabe, H. (1991). Problems of the New Towns in Japan. Geojournal, Springer vol.2, number
1, 39-46.
Vann de Kaa D.J. (2002). The idea of a second demographic transition in industrialized
countries. Paper presented at the 6th Welfare Policy Seminar of the National Institute of
Population and Social Security, Tokyo, 29 january 2002.
Weidner S. (2004): Urban development in shrinking cities - a step by step guide. doctorate
thesis, Institut für Stadtentwicklung und Bauwirtschaft (ISB), University of Leipzig.
Yoshida, T. (2003). Land ownership of un-urbanized housing land developments permitted by
old housing land development law – A case of SR District in Tsukuba City. Journal of
Architecture Planning and Environmental Engineering 573, 117-124.
Yatsuka, H. (1994). Ecologia dei nuovi sobborghi di Tokyo. Tama Newtown. Casabella 608-
609.

20
figure 1 : age pyramids 2005, 2030, Japan
Source : www.stat.go.jp
< 65
15 - 64
> 15
2005 2030

21
Figure 2 : Evolution of Tokyo metropolitan population according to the distance to Tokyo center
-10
-5
0
5
10
15
20
25
30
35
1970-1975 1975-1980 1980-1985 1985-1990 1990-1995 1995-2000
year
Po
pu
lati
on
evo
luti
on
rate
(%
)
0 to 10 km 10 to 20 km 20 to 30 km
30 to 40 km 40 to 50 km
Source : Tokyo Statistical Yearbook, National Institute of Population and Security Research.

22
Figure 3: Shiodome Source: author

23
Figure 4: Tama New Town
Source: Author + V. Lahaye.

24
Table 1: Tama New Town development project
Surface in
ha
Projected
population
(1967)
Population in
2004
Number of
housing units
in 2004
2217.4 282000 151806 55007
738.4 96800 47927 17204
49.7 10500 6082 2372
New Residential Program
* Tokyo Metropolitan government
* TMHSC
* JHC, HUD, UR 1429.3 174700 97797 35431
Land readjustment Program 666.5 60200 49637 23697
Total 2883.9 342200 201443 78704
Source: Urban Renaissance Agency.

25
Figures 5-6: Danchi, Nagayama district, 1971
Source : Tama New Town Digital Library .

26
Figure 7: Land prices evolution in Tama New Town from 1971 to 2000 Source : www.machisen.net.
10000yens/m²
Land price
year
Nagayama
Suwa

27
Figure 8: Population distribution in Tama New Town
Source : www.machisen.net.
19
74
19
76
19
78
19
80
19
82
19
84
19
86
19
88
19
90
19
92
19
94
19
96
19
98
20
00
20
02
20
04
Tama Hachioji Inagi Machida

28
Figure 9: Population structure in Wakabadai and Toyogaoka Source : XXX. Modification : E. Ducom Source : www.machisen.net.
Wakabadai Toyogaoka
age
people

29
Figures 10-11 : Old danchi, Nagayama district, 2006.
Source: author

30
Figures 12: Closed shops along the pedestrianized streets, Nagayama district, 2005.
Source: author

31
Figures 13: Closed school, Tama New Town, 2005
Source: author

32
Figures 14-15: Abandoned playground, Tama New Town, 2005
Source: author

33
Figures 16-17: difficult accessibility for elderly through pedestrianized streets. Tama New Town, 2005
Source: author
34
Figures 18-19-20: Undeveloped parcel of land along the pedestrianized streets, Tama New Town, 2005
Source: author

35
Figure 21: Land use evolution in Tama New Town from 1991 to 2002.


![UNESCO Constitution, 1945 - Aventri · UNESCO-Recommendations. single monument urban landscape ensemble urban landscape. landscape approach to „[…] maintain urban identity“](https://static.fdocuments.us/doc/165x107/5fa596629897da76da21984b/unesco-constitution-1945-aventri-unesco-recommendations-single-monument-urban.jpg)