LandCare Report · Web viewThis study assesses public opinion of regional councils’ freshwater...
45
Evolving Public Perceptions of Freshwater Management in Three New Zealand Regions This research was carried out as part of the Values, Monitoring and Outcomes MBIE programme and the Our Land and Water National Science Challenge Collaboration Lab project June 2017
-
Upload
trinhthuan -
Category
Documents
-
view
213 -
download
0
Transcript of LandCare Report · Web viewThis study assesses public opinion of regional councils’ freshwater...

Evolving Public Perceptions of Freshwater Management in Three New Zealand Regions This research was carried out as part of the Values, Monitoring and Outcomes MBIE programme and the Our Land and Water National Science Challenge Collaboration Lab project
June 2017

Evolving Public Perceptions of Freshwater Management in Three New Zealand Regions
Contract Report: LC3171
Pamela Booth, Pike BrownManaaki Whenua – Landcare Research
Jim SinnerCawthron Institute
Reviewed by:Ben WiercinskiAssociate Economist Manaaki Whenua – Landcare Research
Approved for release by:Suzie GreenhalghPortfolio Leader – Supporting Business & PolicyManaaki Whenua – Landcare Research

Contents
Summary................................................................................................................v1 Introduction....................................................................................................1
1.1 Collaborative freshwater planning....................................................................11.2 Research objectives..........................................................................................2
2 Scope.............................................................................................................32.1 Northland..........................................................................................................42.2 Waikato.............................................................................................................52.3 Hawke’s Bay.....................................................................................................6
3 Methods..........................................................................................................73.1 Telephone survey..............................................................................................73.2 Recruitment......................................................................................................73.3 Data analysis....................................................................................................8
4 Results............................................................................................................94.1 Demographics of survey respondents...............................................................94.2 Participation in freshwater management........................................................104.3 Awareness of collaborative planning process..................................................134.4 Regional council management of freshwater..................................................144.5 Level of agreement or conflict over freshwater management.........................164.6 Fairness of water management.......................................................................194.7 Confidence that interests will be taken into account.......................................21
5 Discussion....................................................................................................236 Conclusion....................................................................................................257 Acknowledgements......................................................................................268 References...................................................................................................26
Appendix: Results of Multivariate Regressions.....................................................29
- iii -

Summary This study assesses public opinion of regional councils’ freshwater management in areas with and without collaborative planning processes. The study also assesses change in the general public’s opinions compared to a baseline study conducted in 2015. A telephone survey of 450 people from three North Island regions — Northland, Waikato, and Hawke’s Bay — was conducted from 17 to 19 March 2017.
The survey sought the general public’s opinions of certain areas of freshwater management, namely:
Awareness of collaborative processes among the general publicPerceived effectiveness of the regional council’s freshwater management
strategyPerceived level of agreement or conflict of competing interests in freshwater
managementPerceived fairness of freshwater management practices, and Confidence that interests and concerns of respondents regarding freshwater
management will be taken into account by the regional council.
Our hypothesis is that in areas with collaboration, the community will have a more positive opinion of the regional council’s freshwater management, will perceive greater agreement across competing freshwater interests, will have a greater sense that the council is fair, and will have more confidence that their interests will be taken into account during the planning process relative to regions in which there is no collaborative planning process.
This is the second round of this survey design analysing the effects of collaborative planning on public perceptions of freshwater management. As such, it builds on findings presented in Sinner et al. (2016a, 2016b).
In contrast to the previous survey, this survey was undertaken after the majority of the collaborative groups submitted their planning proposals for public comment. However, we find neither a significant improvement in awareness of a collaborative planning process from the baseline nor a significant effect of collaborative planning except in the level of agreement within Northland. Changes in public perceptions of freshwater management depend on region and level of participation in freshwater management. We suspect that progress on a management plan by the collaborative catchments is positively correlated with public opinion across the whole region, not just within the collaborative areas.
We use multivariate regression analyses for each response question to identify whether differences in responses are correlated with region, collaborative planning, and various demographics. We find that, in 2017:
respondents in Hawke’s Bay believe there is less agreement, on average, than respondents in other regions. This result is consistent with the 2015 survey results
- v -

respondents who participate in freshwater management at a medium or high level are less positive about freshwater management, believe that there is less fairness in freshwater management, perceive lower levels of agreement over freshwater management, and have lower confidence that their interests will be taken into account by the regional council. These results are larger in magnitude than found in the 2015 survey results
women and Māori are significantly less positive about the level of fairness and confidence that their interests will be taken into account. Māori are also significantly less positive about the effectiveness of their regional council’s freshwater management
respondents employed in forestry are less positive about the effectiveness of their regional council’s freshwater management and the level of fairness, while those in government are more positive about the effectiveness of their regional council’s freshwater management and confidence that interests will be taken into account. These results differ from the 2015 survey results where those in forestry were more positive, and no difference was found for those in government.
- vi -

1 Introduction
1.1 Collaborative freshwater planning
New Zealand’s freshwater resources are strained by demands on both quality and quantity from land-use intensification, an increasing array of stakeholders, and legacy uses. The country’s freshwater management is evolving to reflect the complex challenges and current gaps in approaches across the country (Ministry for the Environment and Statistics New Zealand 2015). Approaches to environmental management in general and freshwater management in particular (Scholz & Stiftel 2005; Pahl-Wostl et al. 2008) that engage stakeholders in the decision-making process, called collaborative planning, are recognized as being well suited for resolving more complex issues (Dietz et al. 2003; Ansell & Gash 2008; Innes & Booher 2010).
In an effort to address the challenges of freshwater management, the New Zealand government sought advice from the Land and Water Forum (LAWF) and opted for a collaborative governance approach in 2009. LAWF was formed by various freshwater management stakeholders, including industry, iwi, non-government organizations, and scientists, with the express purpose of developing a shared vision of management using a stakeholder-led collaborative process (Land and Water Forum 2016). Following the LAWF’s report, the government issued the National Policy Statement for Freshwater Management (NPS-FM) in 2011 (Ministry for the Environment 2011) and updated the statement in 2014 with clarified objectives and policies for national consistency of freshwater management (Ministry for the Environment 2014). Under the NPS-FM, regional councils are required to set objectives for freshwater bodies that reflect national and local values on water allocation, flow, and quality. More recently, the government has proposed additional revisions to the NPS-FM targeting water quality (Ministry for the Environment 2017a).
In addition to developing the NPS-FM, in 2017 the government also amended the Resource Management Act 1991 to enable regional councils to choose collaborative approaches to freshwater decision making with limited rights of appeal (Ministry for the Environment 2017b). However, by the time the amendments were passed, use of collaborative planning processes was already underway in Northland, Waikato, Hawke’s Bay, Wellington, Tasman, and Canterbury.
Collaborative planning processes in New Zealand have piqued scientific interest both domestically and abroad. For example, early research focused primarily on Canterbury’s Water Management Strategy, analysing the process design (Lomax et al. 2010), the effectiveness of the process and impact on institutional norms (Salmon 2012), and the role of Māori participation (Memon & Kirk 2012). More recent analysis has identified a suite of best practices in collaborative processes for freshwater management based on the experiences of collaborative groups in Northland and Hawke’s Bay (Cradock-Henry et al. 2017) and have added conceptual guidance for policy makers seeking policy levers (Kaine et al. 2017b) while considering both equity and efficiency concerns (Kaine et al. 2017a).
- 1 -

Studies exploring the representativeness of (Nissen 2014) and engagement in (Sinner et al. 2015) the collaborative process found potential self-selection bias in which those most interested in freshwater management were also those more likely to participate in collaborative processes, even if those people are not the most representative of the general public’s views. Sinner et al. (2015) even found that when members of the general public who were not involved in the planning process were told about collaborative planning groups, they were sceptical that their views would be represented. That study recognised the need to explore community perceptions of collaborative freshwater planning with a larger sample across multiple regions.
Hence, Sinner et al. (2016a, 2016b) reported on a 2015 survey of the general public in Northland, Waikato, and Hawke’s Bay regarding perceptions of freshwater management. That survey elicited 450 responses from people both inside and outside the collaborative catchments areas and compared the responses to identify potential effects of the collaborative planning process. Specifically, Sinner et al. (2016a, 2016b) evaluated awareness of collaborative processes among the general public, and perceived the effectiveness of the regional council’s freshwater management strategy, the level of agreement or conflict of competing interests in freshwater management, the fairness of freshwater management practices, and confidence that the interests and concerns of respondents regarding freshwater management would be taken into account by the regional council.
They found that knowledge of collaborative processes for freshwater management was generally low and that living in a catchment with a collaborative process did not significantly impact respondents’ perceptions of management, agreement, fairness, or interests in Northland or Waikato. However, relative to Hawke’s Bay respondents living outside the collaborative catchment, respondents inside the collaborative catchment believed that the regional council had better management practices and that their management of freshwater was fairer. Moreover, Hawke’s Bay residents living inside the collaborative catchment perceived more agreement over freshwater management than those living outside the collaborative catchment. Sinner et al. (2016a, 2016b) also reported that respondents who participated more actively in planning processes had somewhat less favourable perceptions of their council’s freshwater management. They noted, however, that the survey was conducted before consensus was reached in any of the catchments and that awareness and perceptions of collaborative processes were likely to evolve as the processes themselves matured.
1.2 Research objectives
This study follows Sinner et al. (2016a, 2016b) by surveying 450 residents of Northland, Waikato, and Hawke’s Bay in March 2017. In addition to facilitating comparisons across regions and across collaborative and non-collaborative catchments within each region, the repeated cross-section enables an analysis of changes in the general public’s opinions compared with the baseline study conducted in 2015.
- 2 -

Our hypothesis is that in areas with mature collaborative processes the community will have a more positive opinion of the effectiveness of the regional council’s freshwater management, will perceive greater agreement across competing freshwater interests, will have a greater sense that the council is fair, and will have greater confidence that their interests will be taken into account during freshwater planning relative to areas in which collaborative planning processes are not being undertaken. In contrast to the survey described in Sinner (2016a, 2016b), collaborative groups in two of the three regions under study have now submitted their planning proposals for council approval and subsequent public comment.
2 Scope
This research involves three New Zealand regions – Northland, Waikato, and Hawke’s Bay (Fig. 1) – in which selected catchments have undertaken collaborative planning for freshwater management. Each region also has catchments in which collaborative planning is not used in freshwater management, providing a comparison group against which to test the effect of the collaborative planning process.
Figure 1. Map of Northland, Waikato, and Hawke’s Bay regions.
- 3 -

2.1 Northland
Northland’s collaborative freshwater planning experience began in 2012 with the ‘Waiora Northland Water’ programme.1. Under this programme, the Northland Regional Council collaborates with communities and stakeholders to set goals and standards for managing freshwater resources. Five catchments were prioritized initially for the collaborative planning process: Doubtless Bay, Waitangi, Mangere, Whangarei, and Puoto.
In each area, a collaborative planning group was formed to provide the Northland Regional Council with recommendations on catchment-level management of water resources. The group is comprised of representatives nominated by the various stakeholder groups including iwi, landowners, farming, forestry, environmental groups, recreation use, and local government.
Figure 2. Map of Northland Region and Northland Collaborative Catchments.
Since the last survey, there have been several changes to the Waiora Northland Water programme. Draft plans from Doubtless Bay, Waitangi, Mangere, Whangarei, and Pouto received public feedback late 2016. The revised catchment plans and revised recommendations to the Northland Regional Council are expected from all five collaborative catchment groups
1 http://www.nrc.govt.nz/Your-Council/Council-Projects/Waiora-Northland-Water/What-is-Waiora-Northland-Water
- 4 -

mid-2017. A sixth catchment, Ngunguru, was added to the programme2 and the catchment group is currently developing land-use management plans for soil erosion and sedimentation reduction. The Ngunguru plan is due in 2018.
2.2 Waikato
In response to the Three Rivers Act that established co-governance of the Waikato and Waipa Rivers catchments, the Waikato Regional Council, and local iwi launched the Healthy Rivers: Plan for Change/Wai Ora: He Rautaki Whakapaipai project. The project seeks to develop land and water management recommendations for reduction in nutrient, bacteria, and sediments inputs into the Waikato and Waipa rivers. The project’s collaborative stakeholder group has 17 sector representatives (e.g. from dairy, horticulture, energy, environment, tourism, forestry, and Maori) and seven community representatives. Most sectors nominated their own representatives although a selection panel for the project chose the community representatives and the remaining sector representatives.
Figure 3. Map of Waikato Region and Waikato Collaborative Catchments.
The group gave public notification of a proposed management plan in October 2016 and closed submission of comments as of March 2017. However, a portion of the plan covering the north-eastern area of Waikato River 2 Since the collaborative catchment group in Ngunguru is still in the beginning phases, the catchment was not included as one of our treatment catchments in this survey.
- 5 -

Catchment was withdrawn as of December 2016 for additional consultation with the Hauraki Iwi Authorities. Revised recommendations for the withdrawn area are expected in June 2017, with public notification of the revised plan change expected shortly afterward (Waikato Regional Council 2016).
2.3 Hawke’s Bay
In Hawke’s Bay, the regional council is reviewing the management of land and water in the Tūtaekurī, Ahuriri, Ngaruroro and Karamu (TANK) catchments, in which more than 85% of the population of Hawke’s Bay resides. The collaborative stakeholder group (hereafter, the ‘TANK group’) was established to provide recommendations built on consensus of water allocation and water quality issues to the Hawke’s Bay Regional Council for the regional resource management plan change (HBRC 2016).
The TANK group is comprised of approximately 30 people who represent the broad range of interests including environmental managers, farmers, business operators, forestry managers, recreational users, and representatives of iwi. The Hawke’s Bay Regional Council has ‘given a good faith commitment to support any consensus recommendations from the TANK Group’ (HBRC 2016).
Figure 4. Map of Hawke’s Bay Region and TANK Collaborative Catchments.
The TANK group first met in 2012 and produced its first report with ‘Interim Agreements’ in 2014. Since then, the Hawke’s Bay Regional Council has
- 6 -

supported the development of various hydrologic and nutrient models connecting ground and surface flows within the TANK catchments. The TANK group is waiting on that information to integrate into their plan recommendations. The TANK group is expected to release their proposed recommendations for public comment by December 2017 (HBRC 2016).
3 Methods
3.1 Telephone survey
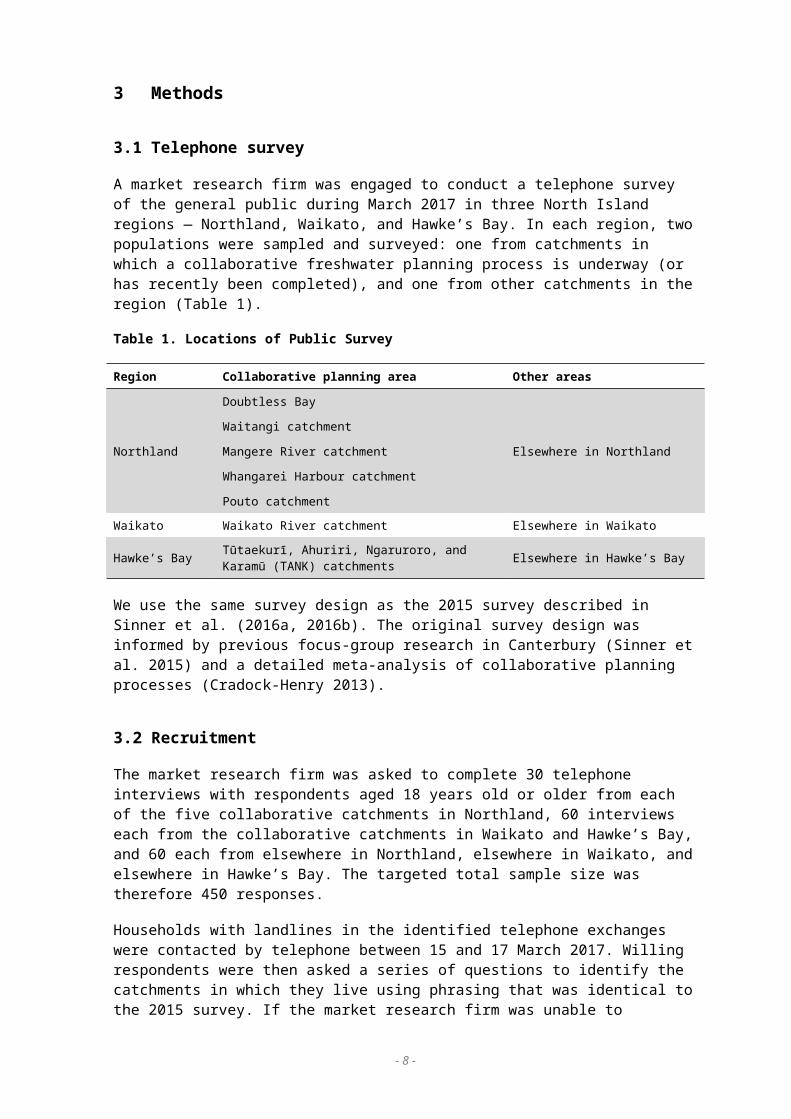
A market research firm was engaged to conduct a telephone survey of the general public during March 2017 in three North Island regions — Northland, Waikato, and Hawke’s Bay. In each region, two populations were sampled and surveyed: one from catchments in which a collaborative freshwater planning process is underway (or has recently been completed), and one from other catchments in the region (Table 1).
Table 1. Locations of Public Survey
Region Collaborative planning area Other areas
Northland
Doubtless Bay
Elsewhere in NorthlandWaitangi catchmentMangere River catchmentWhangarei Harbour catchmentPouto catchment
Waikato Waikato River catchment Elsewhere in Waikato
Hawke’s Bay Tūtaekurī, Ahuriri, Ngaruroro, and Karamū (TANK) catchments Elsewhere in Hawke’s Bay
We use the same survey design as the 2015 survey described in Sinner et al. (2016a, 2016b). The original survey design was informed by previous focus-group research in Canterbury (Sinner et al. 2015) and a detailed meta-analysis of collaborative planning processes (Cradock-Henry 2013).
3.2 Recruitment
The market research firm was asked to complete 30 telephone interviews with respondents aged 18 years old or older from each of the five collaborative catchments in Northland, 60 interviews each from the collaborative catchments in Waikato and Hawke’s Bay, and 60 each from elsewhere in Northland, elsewhere in Waikato, and elsewhere in Hawke’s Bay. The targeted total sample size was therefore 450 responses.
Households with landlines in the identified telephone exchanges were contacted by telephone between 15 and 17 March 2017. Willing respondents were then asked a series of questions to identify the catchments in which they live using phrasing that was identical to the 2015 survey. If the market research firm was unable to determine the catchment with confidence, the
- 7 -
respondents were excluded from the survey sample. This introduction was followed by a series of questions about collaborative freshwater planning in the catchment, including respondents’ opinions of the regional council. Results are presented in Section 4 of this report.
Households surveyed in 2015 were not excluded from the market firm’s list of exchanges and therefore were eligible for re-sampling. However, survey responses were person-specific and not necessarily representative of household opinions and perceptions. In total, 28 of the 450 households that responded to the 2017 survey also responded to the 2015 survey; among these 28 households, just 13 individuals responded to both surveys.3
The 2015 survey was conducted in accordance with the Cawthron Institute’s policy on ethics for research with human subjects. Because the questionnaire was unchanged and because the survey was conducted by a third party who did not provide any individual-identifying characteristics to the researchers, we determined that the research was of low risk to survey participants and that no further protections were necessary.
3.3 Data analysis
Survey data were analysed using Microsoft Excel and Stata (http://www.stata.com). Except where noted, results from this survey were considered statistically significant at the 90% level, indicating there is a less than 10% chance that results would occur randomly if the null hypothesis were true.
Four questions are used to assess public perceptions of collaboration. Specifically, the survey asked:
Using a scale from 0 to 10, where 0 means very poorly, and 10 means very well, in your opinion, how well does the regional council manage freshwater bodies? (Management)
Thinking about conflict or agreement between competing interests over water management in your area, using a scale of 0 to 10 where 0 means lots of conflict and 10 means strong agreement, would you say there is conflict or agreement between competing interests over water management in your area? (Agreement)
Using a scale from 0 to 10, where 0 means not fair at all and 10 means very fair, in your opinion, how fair do you think the water management processes are in the [name of region] regional council area? (Fairness)
Using a scale from 0 to 10, where 0 means not confident at all, and 10 means very confident, if you had concerns about how you, your family, or your business was affected by freshwater management, how confident are you that your interests and concerns would be taken into account by the regional council? (Interests)
3 The market research firm identified 28 resampled households based on landline number and 13 resampled individuals by landline and same first names. The researchers were not provided with any individual identifying characteristics.
- 8 -

In addition, respondents were asked whether they (rightly or wrongly) knew about collaborative processes for managing freshwater in their catchments as follows:
Are you aware of any collaborative catchment groups working with the regional council in your catchment?
We use multivariate regression to identify whether differences in responses are correlated with region, collaborative planning, and demographic measures. Since responses are truncated at 0 and 10, we use a Tobit functional form for the regressions. Hawke’s Bay and Northland are included as individual binary variables with Waikato as the default region. We also include interaction terms for collaborative catchments in Hawke’s Bay and collaborative catchments in Northland.
The demographic explanatory variables are included in the models as binary and are as follows:
FemaleSelf-identified as MāoriCurrent or past employment in:
Farming, Forestry, Water or environmental management, and Regional or local government
Regression results for all four questions are given in the Appendix.
4 Results
4.1 Demographics of survey respondents
The average respondent is a New Zealand European (80%) female (60%) in her mid-50s. Respondent ages range from 18 to 71+, with the median age of respondents in the mid-60s. In terms of ethnicity, New Zealand Māori (12%) are the next largest group followed by British and Other European (10%), and Pacific Island, Asian, and other ethnicities (5%) (Table 2).
- 9 -

Table 2. Respondent Demographics
Northland
Waikato Hawke's Bay
Total Northland
Waikato Hawke's Bay
Total
no. no. no. no. % % % %DemographicsFemale 126 76 70 272 60 63 58 60NZ Maori 29 8 16 53 14 7 13 12NZ European 165 99 95 359 79 83 79 80Other ethnicities 33 21 16 70 16 17 13 16
N (sample size) 210 120 120 450
EmploymentFarming 78 38 45 161 37 32 38 36Construction 25 9 8 42 12 8 7 9Forestry 22 6 7 35 10 5 6 8Government 15 10 6 31 7 8 5 7Water/Env. 14 7 8 29 7 6 7 6N (sample size) 210 120 120 450
Note: Numbers do not sum to ‘N’ because some groups are omitted and respondents could chose multiple ethnicities and employment. Percentages are rounded to the whole number.
Survey respondents were asked whether they are currently or were previously employed in sectors with an interest in freshwater management. Of the sample, 36% reported employment in farming, followed by construction/civil planning (9%), forestry (8%), central or regional government (7%), environmental management (4%), water management company/organization (3%), and other organizations involved in water management (6%).
Women are better represented and fewer respondents have worked in water management relative to the 2015 survey. Similar to the previous survey, farmers are over-represented in the sample based on available data from the most recent employment data from Statistics New Zealand, which indicates that 15–17% of the population in these three regions is engaged in farming. This discrepancy suggests those with a greater interest in freshwater management may have been more likely to participate in the survey.
4.2 Participation in freshwater management
We classify the forms of freshwater management participation into three levels of participation: low, medium, or high. A respondent’s level of participation is classified by his or her highest form of participation even if he or she also participated in an activity that is classified at a lower level.
- 10 -

The most common means of participation was reading media articles (73%) (Fig. 5) followed by discussing freshwater management issues with others (66%). Respondents who participated in either one or both of these activities are classified as having low participation. Respondents who participated in a meeting with a non-governmental organisation (14%), who contacted local or central government (11%), who attended a public meeting (11%), and/or who participated in meeting with industry representatives (6%) are classified as having medium participation. Respondents who made a submission to central or local government (7%) or who spoke at a council meeting (4%) are classified as having high participation.
Figure 5. Freshwater management activity. Note: Respondents could list multiple forms of participation. Each form of participation is the percent of total respondents (N = 450).
Of the entire sample, 82% reported participating in at least one activity related to freshwater management. This figure is an increase of 7 percentage points (pp) from the 2015 survey (p<0.05). Figure 6 shows the breakdown of participation levels. As in Sinner et al. (2016a, 2016b), it is conceivable that individuals with a greater interest in water management issues are more likely to participate in the survey as 28% of respondents participated at a medium or high level.
- 11 -

54
18
18
9
LowNoneMediumHigh
Figure 6. Participation level in freshwater management. Note: Respondents were categorized by participation level by their highest form of participation. Percentage is of total respondents (N = 450).
Participation rates are similar between collaborative and non-collaborative catchments, but respondents in non-collaborative catchments are more likely to participate at the medium level than respondents in collaborative catchments (p<0.05). Respondents in Northland are less likely to participate than are respondents in Waikato (p<0.01) and Hawke’s Bay (p<0.01) (Fig. 7). This finding contrasts with findings for the 2015 survey reported in Sinner et al. (2016a, 2016b), in which respondents in Hawke’s Bay were found to be less likely to participate than were respondents in Northland and Waikato. The change in participation rates across years likely stems from an increase in participation in Hawke’s Bay (diff = 9.2, p<0.05) and an increase in participation in Waikato (diff = 15.8, p<0.01).
- 12 -

Figure 7. Participation level in freshwater management by region and collaborative catchment. Note: Hawke’s Bay and Waikato each have 120 total respondents; 60 in collaborative and 60 in non-collaborative catchments. Northland has 210 total respondents; 154 in collaborative and 56 in non-collaborative catchments. There are 274 total respondents in collaborative catchments and 176 in non-collaborative catchments. Percentages are out of each region and catchment.
4.3 Awareness of collaborative planning process
Respondents were asked about their awareness of any collaborative freshwater management process occurring within their region.
Are you aware of any collaborative catchment groups working with the regional council in your catchment?
Overall, 20% of respondents in collaborative planning areas are correctly aware that collaboration is occurring and 23% of respondents in non-collaborative areas incorrectly think that collaborative planning is occurring (Table 3). Compared with the 2015 survey, there is no significant change in correct awareness, but there is an increase of 8 percentage points of incorrect awareness (p<0.1) of collaborative planning occurring within the catchment.
- 13 -

Table 3. Awareness of collaborative planning process by region and collaborative catchment
Respondents Aware
Not aware Unsure
Region Area (n) % % %Northland Doubtless Bay catchment 30 23 67 10
Waitangi catchment 30 7 80 13Mangere River catchment 34 26 65 9Whangarei Harbour 30 20 70 10Pouto catchment 30 17 73 10Total Northland collaborative 154 19 71 10
Anywhere else in Northland 56 20 77 4
Waikato Waikato River catchment 60 20 77 3Elsewhere in Waikato 60 23 72 5
Hawke's Bay TANK catchments 60 23 73 3Elsewhere in Hawkes Bay 60 27 70 3
Combined Collaborative 274 20 73 7Non-collaborative 176 23 73 4
Respondents in the Waitangi catchment are the least aware of ongoing collaborative processes, with 7% aware and 13% unsure. In other collaborative catchments in Northland, between 17% and 26% of respondents are aware that collaboration is occurring, while 9–10% of respondents are unsure whether collaborative planning is occurring in their region. However, there is no change (in a statistical sense) in awareness in any of the collaborative catchments compared to the 2015 survey.
4.4 Regional council management of freshwater
Respondents were asked on a scale from 0 to 10 how well they believe their regional council is managing freshwater within the region.
Using a scale from 0 to 10, where 0 means very poorly, 10 means very well, in your opinion how well does the [specific region] regional council manage freshwater bodies?
This question was based on the hypothesis that collaboration will result in better communication of the freshwater management process.
Overall, the scores for regional councils’ management of freshwater in non-collaborative catchments (mean = 5.16) are higher than in collaborative catchments (mean = 4.79), but this difference is not statistically different (p<0.19) (Fig. 8). Respondents in Waikato score their regional council’s freshwater management statistically higher (mean = 5.6) than do respondents
- 14 -

in Northland (mean = 4.84, p<0.05) or Hawke’s Bay (mean = 4.46, p<0.01), regardless of collaborative planning process.
Compared with the previous survey, the management score for TANK catchments declines on average by 1.56 (p<0.01), while the average management score elsewhere in Hawke’s Bay remains about the same. The average management score in Northland’s Pouto catchment also declines by 1.53 points (p<0.05). However, the overall average perceived effectiveness of freshwater management in collaborative catchments in Northland is not significantly different than in 2015. Additionally, the overall average score in Waikato increases by 0.65 points from the 2015 survey (p<0.1).
Figure 8. Perceived effectiveness of freshwater management by collaborative catchment. Note: Respondents answered on an eleven point scale, where 0 = very poorly and 10 = very well. Error bars denote 95% confidence intervals.
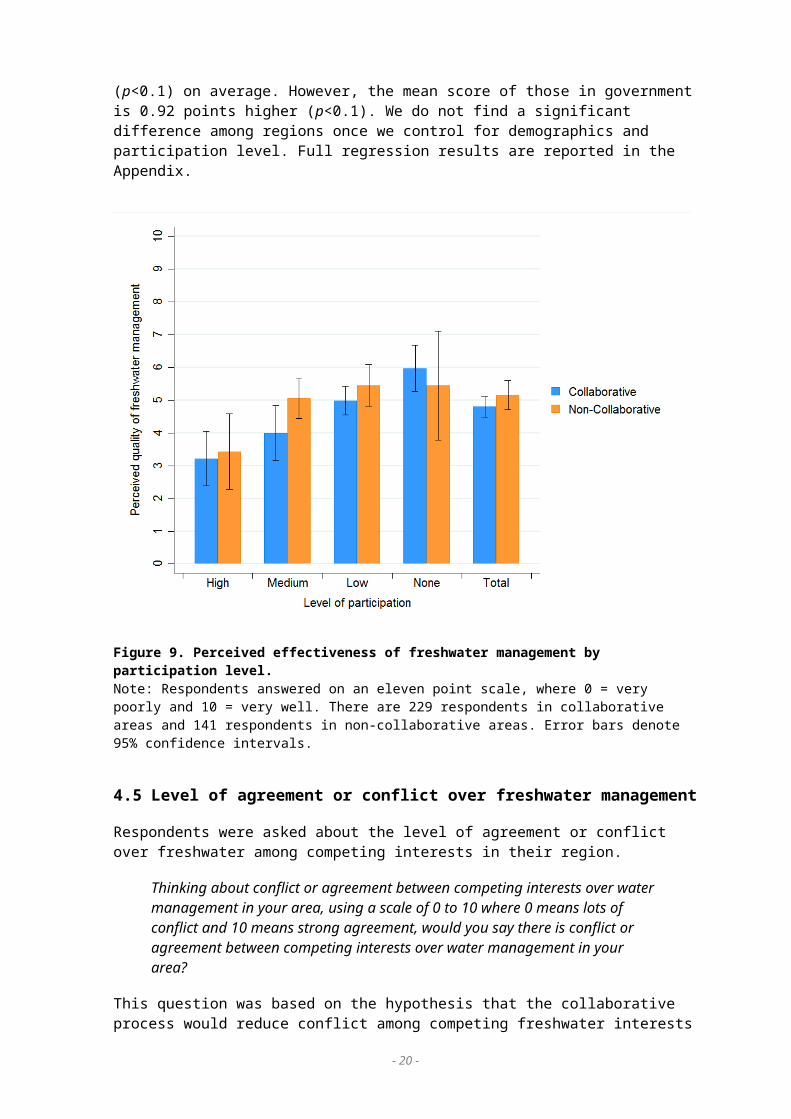
Participation in freshwater planning inversely affects perceptions of how well the regional council is managing freshwater (Fig. 9). Those who participate the most score their regional council’s freshwater management the lowest (mean = 3.3) compared with those who do not participate (mean = 5.79, p<0.01), those with low participation (mean = 5.15, p<0.01), and those who participate at the medium level (mean = 4.5, p<0.01). Compared with the 2015 survey results reported in Sinner et al. (2016a, 2016b), this is a decline of 1.2 points by those who participate the most (p<0.05).
- 15 -

We use a multivariate regression analysis to parse out factors influencing people’s perception of their regional council’s freshwater management and find that participation level and demographics are significant influencers. Those who participate at a medium to high level score their regional council 1.07 points lower (p<0.01) on a 0–10 point scale. Māori have a less favourable perception of their regional council’s freshwater management, giving a score of 1.47 points lower (p<0.01) on average, as did those in forestry, giving a management score 1.25 points lower (p<0.1) on average. However, the mean score of those in government is 0.92 points higher (p<0.1). We do not find a significant difference among regions once we control for demographics and participation level. Full regression results are reported in the Appendix.
Figure 9. Perceived effectiveness of freshwater management by participation level. Note: Respondents answered on an eleven point scale, where 0 = very poorly and 10 = very well. There are 229 respondents in collaborative areas and 141 respondents in non-collaborative areas. Error bars denote 95% confidence intervals.
4.5 Level of agreement or conflict over freshwater management
Respondents were asked about the level of agreement or conflict over freshwater among competing interests in their region.
Thinking about conflict or agreement between competing interests over water management in your area, using a scale of 0 to 10 where 0 means lots of conflict and 10 means strong agreement, would you
- 16 -

say there is conflict or agreement between competing interests over water management in your area?
This question was based on the hypothesis that the collaborative process would reduce conflict among competing freshwater interests compared to other planning processes. Additionally, as the collaborative planning process continues over time, we expect residents in collaborative catchments to perceive increased agreement of competing interests compared to non-collaborative catchments.
Overall, there is no statistical difference in the level of conflict/agreement between collaborative and non-collaborative catchments. Collaborative catchments in Northland have less agreement (mean = 4.71) than elsewhere in Northland (mean = 5.64) (p<0.1) (Fig. 10). However, there is no difference between collaborative and non-collaborative catchments in Hawke’s Bay or Waikato. On average, respondents in Hawke’s Bay score the level of agreement within their region lower (mean = 3.83) than do respondents in either Northland or Waikato (p<0.01). Interestingly, respondents in Northland’s Waitangi catchment are by and large positive about the level of agreement among competing freshwater interests (mean = 6.28), despite being the least aware that a collaborative process is occurring within their catchment.
Compared with the 2015 survey results presented in Sinner et al. (2016a, 2016b), perception of conflict in collaborative catchments is higher in 2017 (p<0.1). Respondents in Doubtless Bay (–1.45 points, p<0.1) and Pouto (–1.38 points, p<0.1) catchments believe that there is more conflict now, while respondents in Waitangi believe there is more agreement (1.55 points, p<0.1). However, the average level of conflict/agreement across all collaborative catchments in Northland did not change from 2015. Interestingly, respondents in non-collaborative catchments in Northland believe there is greater agreement among competing water interests, with a 1.05 point increase from 2015 (p<0.05).
- 17 -

Figure 10. Perceived level of conflict or agreement by collaborative catchment.Note: Respondents answered on an eleven point scale, where 0 = lots of conflict and 10 = strong agreement. Error bars denote 95% confidence intervals.
Participation in freshwater management is inversely related to perceptions of conflict/agreement within each region (Fig. 11). However, there is no significant difference between collaborative and non-collaborative catchments. Those who do not participate score the level of agreement in their region twice as high (mean = 5.48) as those with high participation (mean = 2.6) (p<0.01). Respondents with high participation believe that there is significantly less agreement among competing interests than those with low participation (mean = 5.2, p<0.01) and those with medium participation (mean = 3.8, p<0.05). Respondents who participate the most believe that there is also significantly less agreement among competing interests now than was reported by the highest participating respondents in Sinner et al. (2016a, 2016b) in 2015 (–1.24, p<0.05). The decrease in perceived level of agreement is significant in collaborative catchments (–1.7, p<0.05). Additionally, while those with low participation perceive an increase of agreement of 0.43 points (p<0.1) from 2015, only respondents in non-collaborative catchments believe that there is a significant increase in the level of agreement since 2015 (1.04, p<0.01).
Using a multivariate regression on perceived level of agreement, we find a significant effect at both region and participation level. Respondents in Hawke’s Bay score the level of agreement within their region 1.5 points lower
- 18 -

(p<0.01) than do respondents in Waikato. Those with medium to high participation also have a less favourable view of their region’s level of agreement, averaging 1.89 points lower (p<0.01) on an 11 point scale. This effect is statistically indistinguishable from that reported by Sinner et al. (2016a, 2016b) for the 2015 survey. None of the demographic variables has a statistically distinguishable effect on perceptions of agreement. Full regression results are reported in the Appendix.
Figure 11. Perceived level of conflict of agreement by participation level.Note: Respondents answered on an eleven point scale, where 0 = lots of conflict and 10 = strong agreement. There are 205 respondents in collaborative areas and 143 respondents in non-collaborative areas. Error bars denote 95% confidence intervals.
4.6 Fairness of water management
The third question focused on perceptions of the fairness of freshwater management processes. Specifically, respondents were asked
Using a scale from 0 to 10, where 0 means not fair at all, 10 means very fair, in your opinion, how fair do you think the water management processes are in the [specific region] regional council area?
This question was asked based on the hypothesis that by bringing multiple water-management stakeholders together into a collaborative management process, water management would be perceived as being fairer to those
- 19 -
interests. Additionally, we hypothesise that the perception of fairness will increase over time as interests have more time to collaborate.
In total and across all regions, there is no significant difference of perceived level of fairness between catchments with collaborative and non-collaborative management (Fig. 12). Respondents in Waikato perceive that the management processes are more fair (mean = 5.67) than do respondents in Hawke’s Bay (mean = 4.8, p<0.05). However, there is no significant change in any region or catchment in the perceived level of fairness compared with the 2015 perceived level of fairness reported in Sinner et al. (2016a, 2016b).
Figure 12. Perceived level of fairness by collaborative catchment. Note: Respondents answered on an eleven point scale, where 0 = not fair at all and 10 = very fair. Error bars denote 95% confidence intervals.
As above, participation is inversely correlated with perceptions of fairness, with those not participating perceiving the highest level of fairness (mean = 6.6) compared with those who participate at any level (p<0.01), and almost twice as a high as those who participate the most (mean = 3.5, p<0.01) (Fig. 13). The multivariate regression confirms this result, with those participating at the medium or high level scoring 1.79 points lower (p<0.01) on average. Interestingly, those who do not participate perceive water management to be 1 point fairer than those who did not participate in 2015 (p<0.05) and those with low participation perceive water management to be 0.5 points fairer than those with low participation in 2015 (p<0.05) (Sinner et al. 2016a, 2016b).
- 20 -

In the multivariate regression, we also find that Māori (–1.81, p<0.01), women (–0.76, p<0.05), and those employed in forestry (–1.22, p<0.05) have lower perceptions of fairness, ceteris paribus. In contrast to the results from the 2015 survey (Sinner et al. 2016a, 2016b), there is a significant decline in the average perceptions of fairness by those in forestry (diff = 2.53 points, p<0.01) and Māori (diff = 1.82, p<0.01). Comparing the change in mean perceptions of fairness within regions, those in forestry in Hawke’s Bay (diff = 3.5, p<0.1) and Northland (diff = 1.78, p<0.05) perceive water management to be less fair in 2017 than in 2015, while those in forestry in Waikato do not perceive a difference in fairness since the 2015 survey (Sinner et al. 2016a, 2016b). We do not find a statistically significant effect of region or of being in a collaborative catchment on the 2017 perceived level of fairness using multivariate regression. Full regression results are reported in the Appendix.
Figure 13. Perceived level of fairness by participation level.Note: Respondents answered on an eleven point scale, where 0 = not fair at all and 10 = very fair. There are 220 respondents in collaborative areas and 145 respondents in non-collaborative areas. Error bars denote 95% confidence intervals.
4.7 Confidence that interests will be taken into account
Our fourth question asked survey participants about their confidence that their interests and concerns will be considered by the regional council.
Using a scale from 0 to 10, where 0 means not confident at all, 10 means very confident, if you had concerns about how you, your family, or your business was affected by freshwater management,
- 21 -

how confident are you that your interests and concerns would be taken into account by the xxx regional council.
Across all regions and in total, we do not find a significant difference in the level of confidence that respondents’ interests will be taken into account between collaborative and non-collaborative catchments. Respondents in Waikato are more confident, on average (mean = 5.2), than respondents in Northland (mean = 4.6, p<0.1). However, there is no significant change in any region or catchment in the level of confidence reported in Sinner et al. (2016a, 2016b).
Figure 14. Confidence that interests and concerns will be taken into account by collaborative catchment. Note: Respondents answered on an eleven point scale, where 0 = not confident at all and 10 = very confident. Error bars denote 95% confidence intervals.
Participation is inversely correlated with confidence that interests and concerns will be taken into account, although there is no statistical difference between collaborative and non-collaborative catchments at any participation level. Those who do not participate have the highest confidence (mean = 5.39), significantly higher than those who participate at the medium level (mean = 4.32, p<0.05) or the highest level (mean = 3.56, p<0.01) (Fig. 15). Those who do not participate do not have significantly different confidence than those who participate at low levels. There is also no significant change in
- 22 -

level of confidence across any participation level from 2015 (Sinner et al. 2016a, 2016b).
Results from the multivariate regression support these findings, with those who participate at the medium to high levels scoring 0.94 points lower (p<0.01), on average, a similar result as that reported for the 2015 survey by Sinner et al. (2016a, 2016b). Māori and women are 1.68 (p<0.01) and 0.75 (p<0.05) less confident that their interests will be taken into account, on average, while those who work in government are 1.45 (p<0.05) more confident. There is no distinguishable difference between regions.
Figure 15. Confidence that interests and concerns will be taken into account by participation level. Note: Respondents answered on a ten point scale, where 0 = not confident at all and 10 = very confident. There are 257 respondents in collaborative areas and 164 respondents in non-collaborative areas. Error bars denote 95% confidence intervals.
5 Discussion
Overall, awareness of a collaborative process occurring has declined slightly from 21% to 20% in collaborative catchments, while belief that a collaborative process is occurring in non-collaborative catchments has increased from 15% to 23%. Opportunities for public comment closed shortly before the survey was conducted in Northland and Waikato, yet in both cases, awareness levels were not significantly higher than they were in 2015. Moreover, two different collaborative catchments in Northland had single-digit awareness in both 2015
- 23 -

and 2017. While a low level of awareness may not necessarily be a concern during the early stages of collaborative processes, the continued low level of awareness may indicate the need to improve public outreach and may be of concern if a collaborative group relies on public input during the submission process or public support during plan implementation.
While we expect to find a significant effect of collaborative planning on public perceptions as the collaborative planning groups have matured, we also suspect the continued low levels of awareness will mitigate the effect of collaborative planning. Similar to the results presented in Sinner et al. (2016a, 2016b) for the 2015 survey, we do not find a significant effect of collaborative planning when pooling regions’ responses on public perceptions of effectiveness of freshwater management, level of agreement/conflict, the level of fairness, and level of confidence that interests will be taken into account. We also do not find a significant change in average opinion between 2015 and 2017 except in perceived level of agreement within collaborative catchments.
Respondents in Waikato score effectiveness of management the highest overall and the level of agreement and level of fairness higher than do respondents in Hawke’s Bay. The perceived effectiveness of freshwater management in Waikato is significantly higher in 2017 than in 2015 (p<0.1), but respondents in Hawke’s Bay believe that their regional council has become less effective since 2015 (p<0.01). This could be the result of a major incident involving contamination of a public drinking water supply within the TANK catchments in August 2016, in which over 5,000 people become ill (Hawke’s Bay District Health Board 2016).
Respondents in the non-collaborative catchments in Northland believe that there is a greater level of agreement among competing water interests than do respondents in the collaborative catchments (p<0.1). Additionally, respondents in non-collaborative catchments in Northland perceive a higher level of agreement in 2017 than in 2015 (p<0.05). Across all collaborative catchments, however, the average level of agreement declined since 2015 (p<0.1).
Releasing a proposed managed plan for public review may be positively correlated with perceptions of management effectiveness, level of agreement, level of fairness, and confidence that one’s interests will be taken into account. Respondents in collaborative and non-collaborative catchments in Waikato are more positive overall, while respondents in non-collaborative catchments in Northland perceive higher levels of agreement among competing interests.
In addition to the aforementioned contamination incident, delays in releasing a proposed plan may have lowered perceptions of management in Hawke’s Bay. Respondents in Hawke’s Bay and within the TANK catchments give lower scores for effectiveness of management in 2017 than in 2015 (both p<0.01). Progress on a proposed management plan from the collaborative TANK group was delayed for some months as the group waited for improved hydrologic modelling. This delay may have affected perceptions of management as well as other perception responses.
- 24 -

Using a multivariate regression analysis, we find that participation in freshwater management at the medium to high level has a large and significant negative effect on perceptions of effectiveness of management (–1.07, p<0.01), level of agreement (–1.89, p<0.01), level of fairness (-1.79, p<0.01), and confidence that interests are taken into account (–0.94, p<0.05). These results are larger than the results reported in Sinner et al. (2016a, 2016b) for the 2015 survey. It would seem that those most familiar with and engaged in freshwater management planning process are more sceptical than those with less familiarity. Interestingly, those who do not participate at all in the freshwater management process have higher perceptions of fairness than they did in 2015 (p<0.05) and those who participate at low levels have higher perceptions of fairness (p<0.05) and level of agreement (p<0.1) than they did in 2015.
In addition, women and Māori are less positive than men and non-Māori about the level of fairness and confidence that their interests will be taken into account. Māori are also less positive about the effectiveness of freshwater management and perceive the freshwater management process of be less fair in 2017 than they did in 2015. This finding perhaps reflects a need for better engagement of traditionally marginalized groups in the management process.
The lack of improvement in awareness of collaborative processes is concerning given that collaborative groups in Northland and Waikato have already received public comments on their plans. Despite the continued low awareness, there does appear to be at least a positive correlation of making tangible progress on the management plan and improving public perception of the regional council’s freshwater management process across the whole region, regardless of collaborative process. Finally, while more participation in the management process is negatively correlated with public perceptions of freshwater management, this result could reflect gaps in public engagement generally and gaps in engagement of traditionally marginalized groups by the collaborative groups and regional councils.
6 Conclusion
This report presents the results of a telephone survey of 450 residents in three New Zealand regions — Northland, Waikato, and Hawke’s Bay — on the topic of freshwater management. It also compares the survey results with a similar telephone survey conducted in 2015. The aims of this report are to assess the general public’s perceptions of freshwater management and to describe changes in perceptions of freshwater management in catchments with and without collaborative planning processes.
Awareness of a collaborative planning process remains low. In two of the three regions, public comment windows closed shortly before the survey was conducted. However, in neither case was the awareness level significantly higher than they were in 2015. Moreover, one collaborative catchment had single-digit awareness in both 2015 and 2017.
- 25 -

We analyse four specific questions regarding public perceptions of freshwater management, each question asked on an eleven-point scale: effectiveness of management, level of agreement among competing interests, level of fairness of planning process, and confidence that the respondent’s interests will be taken into account. While there is no significant difference in average scores between collaborative and non-collaborative catchments, there is a difference over time in level of agreement. However, these effects depend on regional council and the degree of participation in the freshwater management process.
We use a Tobit multivariate regression analysis for each question to identify specific factors that influence perceptions. Participation in freshwater management is the most significant factor in determining perceptions, with those who participated the most giving the lowest score across all four questions. We also find that women and Māori have lower opinions than do men and non-Māori regarding the level of fairness and confidence that interests will be taken into account by the regional council, on average. We suspect that while more participation in the management process in general is associated with a large negative effect on public perceptions, this result could be reflective of gaps in public engagement and gaps in engagement of traditionally marginalized groups by the collaborative groups and regional councils.
Since 2015, there has been progress by the collaborative catchments in their management proposals. Two of the three regions have collaborative catchments that have submitted plan proposals for public comment. Compared with 2015, both those regions have seen improvement in public perceptions. Additionally, the region that has seen delays in its proposed plan has lower public opinions than the other regions, on average, and compared with 2015, although this may be due to an unrelated water contamination incident. This result is true in catchments with and without collaboration, significantly so for perceptions of management in the collaborative catchment.
7 Acknowledgements
We gratefully acknowledge Mark Newton from the Cawthron Institute and Suzie Greenhalgh from Landcare Research. Data collection for this project was supported by the Ministry of Business, Innovation, and Employment through the Freshwater Values, Monitoring, and Outcomes programme in collaboration with the Our Land and Water National Science Challenge Collaborative Lab.
8 References
Ansell C, Gash A 2008. Collaborative governance in theory and practice. Journal of Public Administration Research and Theory 18(4): 543–571.
Cradock-Henry N 2013. Evaluating a collaborative process. Policy Brief No. 2. Landcare Research.
- 26 -

Cradock-Henry N A, Greenhalgh S, Brown P, Sinner J 2017. Factors influencing successful collaboration for freshwater management in Aotearoa, New Zealand. Ecology and Society 22(2):14. doi: 10.5751/ES-09126-220214
Dietz T, Ostrom E, Stern PVC 2003. The struggle to govern the commons. Science 302(5652): 1907–1912. doi: 10.1126/science.1091015
Hawke’s Bay District Health Board 2016. Havelock North campylobacter outbreak update November 2016. http://www.ourhealthhb.nz/healthy-communities/current-public-health-warnings-and-alerts/havelock-north-gastro-outbreak-august-2016/ (retrieved May 2017).
Hawke’s Bay Regional Council 2016. Master plan for the Greater Heretaunga and Ahuriri (TANK) Plan Change. http://www.hbrc.govt.nz/hawkes-bay/projects/tank/resources (retrieved May 2017).
Innes JE, Booher De 2010. Planning with complexity: an introduction to collaborative rationality for public policy. Oxford, UK, Routledge/Taylor & Francis.
Kaine G, Greenhalgh S, Boyce W, Lourey R, Young J, Reed E, Keenan B, Mackay S 2017a. A microeconomic perspective on the role of efficiency and equity criteria in designing natural resource policy. Ecology and Society 22(1):50. doi: 10.5751/ES-09133-220150
Kaine G, Young J, Lourey R, Greenhalgh S 2017b. Policy choice framework: guiding policy makers in changing farmer behaviour. Ecology and Society 22(2):2. doi: 10.5751/ES-09135-220202
Land and Water Forum 2016. A common direction for water management in New Zealand. http://www.landandwater.org.nz/
Lomax A, Memon A, Painter BD 2010. The Canterbury Water Management Strategy as a collaborative planning initiative: a preliminary assessment. Lincoln, NZ, Lincoln Ventures Ltd.
Memon PA, Kirk N 2012. Role of indigenous Māori people in collaborative water governance in Aotearoa/New Zealand. Journal of Environmental Planning and Management, 55(7): 1–19.
Ministry for the Environment 2011. National Policy Statement for Freshwater Management. Wellington, NZ, Ministry for the Environment. Reference number INFO 598.
Ministry for the Environment 2014. National Policy Statement for Freshwater Management 2014. Wellington, NZ, Ministry for the Environment. Reference number ME 1155.
Ministry for the Environment 2017a. Clean Water: 90% of Rivers and Lakes Swimmable by 2040. Wellington, NZ, Ministry for the Environment. Reference number ME 1293.
Ministry for the Environment 2017b. Resource Legislation Amendments 2017 – Fact Sheet 6: A new option collaborative planning process [Fact Sheet]. Wellington, NZ, Ministry for the Environment. Reference number INFO 784g
Ministry for the Environment and Statistics New Zealand 2015. New Zealand's Environmental Reporting Series: Environment Aotearoa 2015. Available from www.mfe.govt.nz and www.stats.govt.nz.
- 27 -

Nissen S 2014. Who's in and who's out? Inclusion and exclusion in Canterbury's freshwater governance. New Zealand Geographer 70(1): 33–46. doi: 10.1111/nzg.12038
Pahl-Wostl C, Tàbara D, Bouwen R, Craps M, Dewulf A, Mostert E, Ridder D, Taillieu T 2008. The importance of social learning and culture for sustainable water management. Ecological Economics 64(3): 484–495.
Salmon G 2012. Canterbury Water Management Strategy – a case study in collaborative governance. Wellington, NZ, Ministry for the Environment.
Scholz JT, Stiftel B 2005. Adaptive governance and water conflict: new institutions for collaborative planning. Washington, DC, Resources for the Future Press.
Sinner J, Newton M, Duncan R 2015. Representation and legitimacy in collaborative freshwater planning. Ministry of Business, Innovation and Employment Contract CO9X1003. Cawthron Report No. 2787. 45 p + appendix.
Sinner J, Newton M, Brown P 2016a. Community perceptions of collaborative freshwater planning in three New Zealand regions. Funded by Ministry of Business Innovation and Employment’s Science and Innovation Group. Cawthron Report No. 2844. 33 p. + appendix.
Sinner J, Brown P, Newton M 2016b. Community perceptions of collaborative processes for managing freshwater resources. Ecology and Society 21(4): 5. http://dx.doi.org/10.5751/ES-08851-210405
Waikato Regional Council 2016. Waikato Reginal Plan Change 1—Waikato and Waipa River Catchments. from https://www.waikatoregion.govt.nz/council/policy-and-plans/plans-under-development/healthy-rivers-plan-for-change/ (retrieved May 2017).
- 28 -

Appendix: Results of Multivariate Regressions
For each response question, we use a Tobit multivariate regression to identify whether differences in responses are correlated with region, collaborative planning, and demographics.
We run seven models for each of the four responses questions. In each case, we start with the dummy for being in a collaborative catchment as an explanatory variable, and then progressively add more explanatory variables. We are primarily looking for consistent correlations in coefficient sign and significance across multiple models.
The detailed results are reported in Tables A1, A2, A3 and A4 below. The number of responses (N) is different for each question because not every respondent answered every question.
Table A1. Multivariate regression of perceptions of effectiveness of freshwater management
(1) (2) (3) (4) (5) (6) (7)Collaborative catchment –0.388 –0.362 –0.435 –0.447 –0.441 –0.493 –0.484
(–1.18) (–1.07) (–0.75) (–0.77) (–0.78) (–0.87) (–0.87)
Northland–
0.759** –1.198* –1.148* –0.901 –1.058 –0.852(–2.02) (–1.74) (–1.68) (–1.33) (–1.55) (–1.25)
Hawke's Bay
–1.204**
*–0.976 –0.845 –0.776 –0.796 –0.742
(–2.90) (–1.60) (–1.35) (–1.26) (–1.31) (–1.24)Northland x collab 0.605 0.673 0.557 0.578 0.489
(0.74) (0.83) (0.69) (0.71) (0.61)Hawke's Bay x collab –0.452 –0.561 –0.409 –0.38 –0.268
(–-0.54) (–0.66) (–0.50) (–0.46) (-0.33)Farming 0.166 0.13 0.402 0.336
(0.46) (0.36) (1.13) (0.95)
Forestry–
1.460**–
1.462** –1.213 –1.252*(–1.98) (–2.06) (–1.63) (–1.74)
Water/Env. Management –0.911 –0.705 –0.569 –0.429(–1.38) (–1.13) (–0.86) (–0.67)
Government 0.998* 0.901* 1.014* 0.917*(1.85) (1.74) (1.96) (1.81)
Female –0.349 –0.344(–1.11) (–1.12)
Maori
–1.657**
*
–1.468**
*(–3.20) (–2.82)
Medium to High Participation
-1.215**
*
–1.072**
*(-3.53) (–3.14)
Constant5.123**
*5.793**
*5.831**
*5.817**
*6.104**
*6.024**
*6.281**
*(19.27) (16.37) (12.66) (12.58) (11.91) (13.17) (12.43)
Collab + (Northland x collab) (F-test) 0.17 0.226 0.116 0.085 0.005Collab + (Hawke's Bay x collab) (F-test) –0.887 –1.008 –0.85 –0.873 –0.752Log likelihood –868.0 –863.8 –862.9 –858.6 –851.7 –852.8 –847.1McFadden's pseudo R-squared
0.000822 0.00570 0.00674 0.0116 0.0195 0.0183 0.0248
- 29 -

N 370 370 370 370 370 370 370Note: t-statistics in parentheses. * p<0.1, ** p<0.05, *** p<0.01
Table A2. Multivariate regression of perceptions of level of agreement among competing interests
(1) (2) (3) (4) (5) (6) (7)Collaborative catchment –0.231 –0.387 –0.219 –0.405 –0.419 –0.358 –0.371
(-0.62) (–1.04) (–0.37) (–0.69) (–0.71) (–0.59) (–0.61)Northland –0.226 0.367 0.374 0.482 0.425 0.491
(–0.57) (0.54) (0.54) (0.71) (0.62) (0.73)
Hawke's Bay
–1.654**
*
–1.921**
*–
1.760**–
1.755***
–1.496**
–1.500**
(–3.55) –-2.89) (–2.54) (–2.59) (–2.23) (–2.26)Northland x collab –0.886 –0.708 –0.679 –0.745 –0.711
(–1.07) (–0.85) (–0.82) (–0.89) (–0.86)Hawke's Bay x collab 0.546 0.312 0.414 0.393 0.435
(0.59) (0.32) (0.43) (0.43) (0.47)Farming –0.554 –0.652 –0.218 –0.341
(–1.33) (–1.56) (–0.54) (–0.84)Forestry –0.894 –0.943 –0.646 –0.732
(–1.34) (–1.43) (-0.98) (–1.12)Water/Env. Management –0.171 0.0238 0.453 0.538
(–0.20) (0.03) (0.52) (0.62)Government –0.171 –0.287 –0.0246 –0.143
(–0.22) (–0.38) (–0.03) (–0.19)Female -0.588 –0.580
(–1.62) (–1.63)
Maori–
1.252** –0.822(–2.33) (–1.56)
Medium to High Participation
-2.014**
*
–1.886**
*(-5.48) (–5.18)
Constant4.772**
*5.477**
*5.393**
*5.736**
*6.210**
*5.998**
*6.421**
*(16.39) (15.11) (11.77) (12.11) (11.49) (12.52) (11.75)
Collab + (Northland x collab) (F-test) –1.105* –1.113* –1.098* –1.103* –1.082*Collab + (Hawke's Bay x collab) (F-test) 0.327 –0.093 –0.005 0.035 0.064Log likelihood –828.8 –821.0 –819.6 –816.9 –812.2 –803.8 –800.8McFadden's pseudo R-squared
0.000239 0.00959 0.0113 0.0146 0.0202 0.0303 0.0340
N 348 348 348 348 348 348 348Note: t-statistics in parentheses. * p<0.1, ** p<0.05, *** p<0.01
- 30 -

Table A3: Multivariate regression of perceptions of fairness
(1) (2) (3) (4) (5) (6) (7)Collaborative catchment –0.00845 0.00202 0.0382 –0.0177 –0.0316 –0.0712 –0.0805
(–0.03) (0.01) (0.06) (–0.03) (–0.05) (–0.11) (–0.14)Northland –0.659* –0.629 –0.655 –0.482 –0.585 –0.459
(–1.70) (–0.89) (–0.93) (–0.73) (–0.85) (–0.71)
Hawke's Bay–
0.980** –0.954 -0.954 –0.959 –0.822 -0.845(–2.21) (–1.47) (–1.44) (–1.53) (–1.31) (-1.41)
Northland x collab –0.0519 0.0863 0.068 –0.0126 -0.00647
(–0.06) (0.10) (0.09) (–0.02) (–0.01)Hawke's Bay x collab –0.0497 –0.0116 0.198 0.204 0.342
(–0.06) (–0.01) (0.23) (0.24) (0.42)Farming 0.262 0.165 0.640* 0.502
(0.75) (0.49) (1.87) (1.51)
Forestry –1.298*–
1.370** –1.083*–
1.218**(–1.95) (–2.26) (–1.70) (–2.07)
Water/Env. Management –0.710 –0.295 0.0309 0.305(–1.01) (–0.47) (0.05) (0.49)
Government 0.600 0.408 0.535 0.343(0.87) (0.65) (0.87) (0.60)
Female–
0.717**–
0.755**(–2.29) (–2.50)
Maori
–2.185**
*
–1.814**
*(–4.31) (–3.61)
Medium to High Participation
–1.997**
*
–1.790**
*(–5.85) (–5.42)
Constant 5.173***5.754**
*5.735**
*5.738**
*6.378**
*6.103**
*6.711**
*(19.46) (14.95) (11.06) (10.63) (11.44) (11.49) (12.22)
Collab + (Northland x collab) (F-test) –0.0137 0.0686 0.0364 –0.0838 –
0.08697Collab + (Hawke's Bay x collab) (F-test) –0.0115 –0.0293 0.1664 0.1328 0.2615Log likelihood –854.3 –851.5 –851.5 –848.6 –834.2 –832.5 –820.6McFadden's pseudo R-squared
0.000000395 0.00326 0.00326 0.00664 0.0235 0.0255 0.0394
N 365 365 365 365 365 365 365Note: t-statistics in parentheses. * p<0.1, ** p<0.05, *** p<0.01
- 31 -

Table A4. Multivariate regression of confidence that interest will be taken into account
(1) (2) (3) (4) (5) (6) (7)Collaborative catchment –0.147 –0.0854 0.589 0.614 0.593 0.57 0.558
(–0.40) –-0.22) (0.82) (0.85) (0.83) (0.79) (0.79)Northland –0.693 –0.275 –0.229 –0.0818 –0.179 –0.0677
(-1.57) (–0.36) (–0.30) (–0.11) (–0.23) (–0.09)Hawke's Bay –0.797 –0.205 –0.134 –0.117 –0.0683 –0.0692
(–1.54) (–0.30) (–0.20) (–0.17) (–0.10) (–0.10)Northland x collab –0.775 –0.748 –0.749 –0.799 –0.783
(–0.83) (–0.79) (–0.81) (–0.85) (–0.85)Hawke's Bay x collab –1.196 –1.218 –1.06 -1.081 –0.98
(–1.15) (–1.18) (–1.05) (–1.06) (–0.98)Farming 0.192 0.0432 0.390 0.202
(0.48) (0.11) (0.98) (0.51)Forestry –1.114* –1.133* –0.902 –0.987
(–1.72) (–1.86) (–1.37) (–1.58)Water/Env. Management –0.531 –0.261 –0.195 –0.0337
(–0.68) (–0.34) (–0.25) (–0.04)Government 1.517** 1.411** 1.574** 1.454**
(2.38) (2.29) (2.49) (2.35)
Female–
0.734**–
0.745**(–2.02) (–2.07)
Maori
–1.922**
*
–1.675**
*(–3.40) (–2.88)
Medium to High Participation
–1.182**
*–
0.937**(–3.08) (–2.42)
Constant4.740**
*5.242**
*4.900**
*4.778**
*5.419**
*4.991**
*5.584**
*(16.38) (12.32) (8.90) (8.04) (8.43) (8.21) (8.55)
Collab + (Northland x collab) (F-test) –0.186 –0.134 –0.156 –0.229 –0.225Collab + (Hawke's Bay x collab) (F-test) –0.607 –0.604 –0.467 –0.511 –0.422Log likelihood –1012.3 –1010.7 –1009.9 –1007.0 –998.3 –1002.9 –995.7McFadden's pseudo R-squared
0.0000788 0.00169 0.00245 0.00526 0.0139 0.00934 0.0165
N 421 421 421 421 421 421 421Note: t-statistics in parentheses. * p<0.1, ** p<0.05, *** p<0.01
- 32 -