Land-Use Requirements of Modern Wind Power Plants in the United ...
46
Technical Report NREL/TP-6A2-45834 August 2009 Land-Use Requirements of Modern Wind Power Plants in the United States Paul Denholm, Maureen Hand, Maddalena Jackson, and Sean Ong
Transcript of Land-Use Requirements of Modern Wind Power Plants in the United ...
Technical Report NREL/TP-6A2-45834 August 2009
Land-Use Requirements of Modern Wind Power Plants in the United States Paul Denholm, Maureen Hand, Maddalena Jackson, and Sean Ong
National Renewable Energy Laboratory 1617 Cole Boulevard, Golden, Colorado 80401-3393 303-275-3000 • www.nrel.gov
NREL is a national laboratory of the U.S. Department of Energy Office of Energy Efficiency and Renewable Energy Operated by the Alliance for Sustainable Energy, LLC
Contract No. DE-AC36-08-GO28308
Technical Report NREL/TP-6A2-45834 August 2009
Land-Use Requirements of Modern Wind Power Plants in the United States Paul Denholm, Maureen Hand, Maddalena Jackson, and Sean Ong Prepared under Task No. WER9.3550
NOTICE This report was prepared as an account of work sponsored by an agency of the United States government. Neither the United States government nor any agency thereof, nor any of their employees, makes any warranty, express or implied, or assumes any legal liability or responsibility for the accuracy, completeness, or usefulness of any information, apparatus, product, or process disclosed, or represents that its use would not infringe privately owned rights. Reference herein to any specific commercial product, process, or service by trade name, trademark, manufacturer, or otherwise does not necessarily constitute or imply its endorsement, recommendation, or favoring by the United States government or any agency thereof. The views and opinions of authors expressed herein do not necessarily state or reflect those of the United States government or any agency thereof.
Available electronically at http://www.osti.gov/bridge
Available for a processing fee to U.S. Department of Energy and its contractors, in paper, from:
U.S. Department of Energy Office of Scientific and Technical Information P.O. Box 62 Oak Ridge, TN 37831-0062 phone: 865.576.8401 fax: 865.576.5728 email: mailto:[email protected]
Available for sale to the public, in paper, from: U.S. Department of Commerce National Technical Information Service 5285 Port Royal Road Springfield, VA 22161 phone: 800.553.6847 fax: 703.605.6900 email: [email protected] online ordering: http://www.ntis.gov/ordering.htm
Printed on paper containing at least 50% wastepaper, including 20% postconsumer waste

i
Acknowledgments
Substantial assistance in preparing this analysis, including the land-cover data, mapping, as well as general advice and guidance, was provided by Donna Heimiller, Anelia Milbrandt, and Billy Roberts at the National Renewable Energy Laboratory (NREL). Additional graphics and editorial support were provided by Jim Leyshon and Michelle Kubik.
ii
Table of Contents
Acknowledgments .......................................................................................................................... i 1 Introduction .................................................................................................................................1 2 Wind Power Plant Land-Use Metrics .......................................................................................1
2.1 Direct Impact Area ...............................................................................................................4 2.2 Total Wind Plant Area .........................................................................................................4
3 Wind Power Plant Land-Use Data ............................................................................................5 3.1 Direct Impact Area ...............................................................................................................6 3.2 Total Wind Plant Area .........................................................................................................6 3.3 Wind Power Plant Land-Cover and Configuration Data .....................................................6
4 Results ..........................................................................................................................................9 4.1 Summary Results ...............................................................................................................10 4.2 Direct Impact Area Results ................................................................................................11 4.3 Total Area Results ..............................................................................................................13
5 Alternative Area Metrics and Measurement Methods ..........................................................20 5.1 Habitat Impact Area ...........................................................................................................21 5.2 Uniform Estimation of Total Area Requirements ..............................................................21
6 Conclusions ................................................................................................................................22 References .....................................................................................................................................24

iii
List of Figures
Figure 1. Illustration of the two types of wind plant land use: total area and direct impact area (including permanent and temporary) ......................................................................................3 Figure 2. Example of direct impact area ..........................................................................................6 Figure 3. Examples of wind power plant configurations .................................................................8 Figure 4. Locations of wind power plants evaluated in this study...................................................9 Figure 5. Distribution of permanent direct impact area .................................................................11 Figure 6. Distribution of temporary direct impact area .................................................................12 Figure 7. Distribution of total area requirements ...........................................................................14 Figure 8. Distribution of total area expressed as capacity density .................................................15 Figure 9. Direct impact area requirements (hectare/MW) as a function of wind power
plant size ..................................................................................................................................19 Figure 10. Capacity density as a function of wind power plant size .............................................20 Figure 11. Possible methodologies for assigning uniform land metrics to total area of
wind power plants ....................................................................................................................22 List of Tables
Table 1. Summary of Collected Wind Power Plant Area Data ......................................................10 Table 2. Projects with Detailed Direct Impact Data ......................................................................13 Table 3. Distribution of Direct Impact Area ..................................................................................13 Table 4. Wind Power Plant Configuration .....................................................................................16 Table 5. Land-Cover Data ..............................................................................................................17 Table 6. Relationship between Configuration and Land-Use Area ...............................................18 Table 7. Relationship between Land-Cover and Average Land-Use Area ....................................18 Table 8. Relationship between Land Cover and Configuration .....................................................19 Table 9. Direct impact area requirements (hectare/MW) as a function of wind power plant
size ...........................................................................................................................................19

1
1 Introduction
By the end of 2008, a combination of environmental, economic, and policy factors resulted in the cumulative deployment of more than 25 gigawatts (GW) of wind generation capacity in the United States (AWEA 2009a). Continued growth is anticipated due to renewable portfolio standards and expected constraints on carbon emissions in the electric sector. One of the concerns regarding large-scale deployment of wind energy is its potentially significant land use. Estimates of land use in the existing literature are often based on simplified assumptions, including power plant configurations that do not reflect actual development practices to date. Land-use descriptions for many projects are available from various permitting agencies and other public sources, but we are not aware of any single source that compiles or summarizes this data. In addition, there is limited information comparing land use for wind power plants across different terrain and plant configurations. The existing data and analyses limit the effective quantification of land-use impacts for existing and future wind energy generation, particularly in comparison to other electricity generation technologies. In this report, we provide data and analysis of the land use associated with modern, large wind power plants (defined as greater than 20 megawatts (MW) and constructed after 2000). We begin by discussing standard land-use metrics as established in the life-cycle assessment literature, and then discuss their applicability to wind power plants. We identify two major “classes” of wind plant land use: 1) direct impact (i.e., disturbed land due to physical infrastructure development), and 2) total area (i.e., land associated with the complete wind plant project). We also provide data for each of these classes, derived from project applications, environmental impact statements, and other sources. We also attempt to identify relationships among land use, wind plant configuration, and geography. We evaluated 172 existing or proposed projects, which represents more than 26 GW of capacity.
In addition to providing land-use data and summary statistics, we identify several limitations to the existing wind project area data sets, and suggest additional analysis that could aid in evaluating actual land use and impacts associated with deployment of wind energy. 2 Wind Power Plant Land-Use Metrics
There are a number of existing and proposed metrics for evaluating land-use impacts. While there is no generally accepted methodology (Canals et al. 2007), review of the life-cycle assessment (LCA) literature suggests at least three general categories for evaluating land-use impacts: 1) the area impacted, 2) the duration of the impact, and 3) the quality of the impact (Koellner and Scholz 2008).
In this report, we focus on quantifying and summarizing the first component of land-use impact identified above (area of impact), recognizing that the quality and duration of the impact must be evaluated on a case-by-case basis. The quality of impact, which may also be stated as a “damage function,” evaluates both the initial state of the land impacted, and

2
the final states across a variety of factors including soil quality and overall ecosystem quality (Koellner and Scholz 2008).
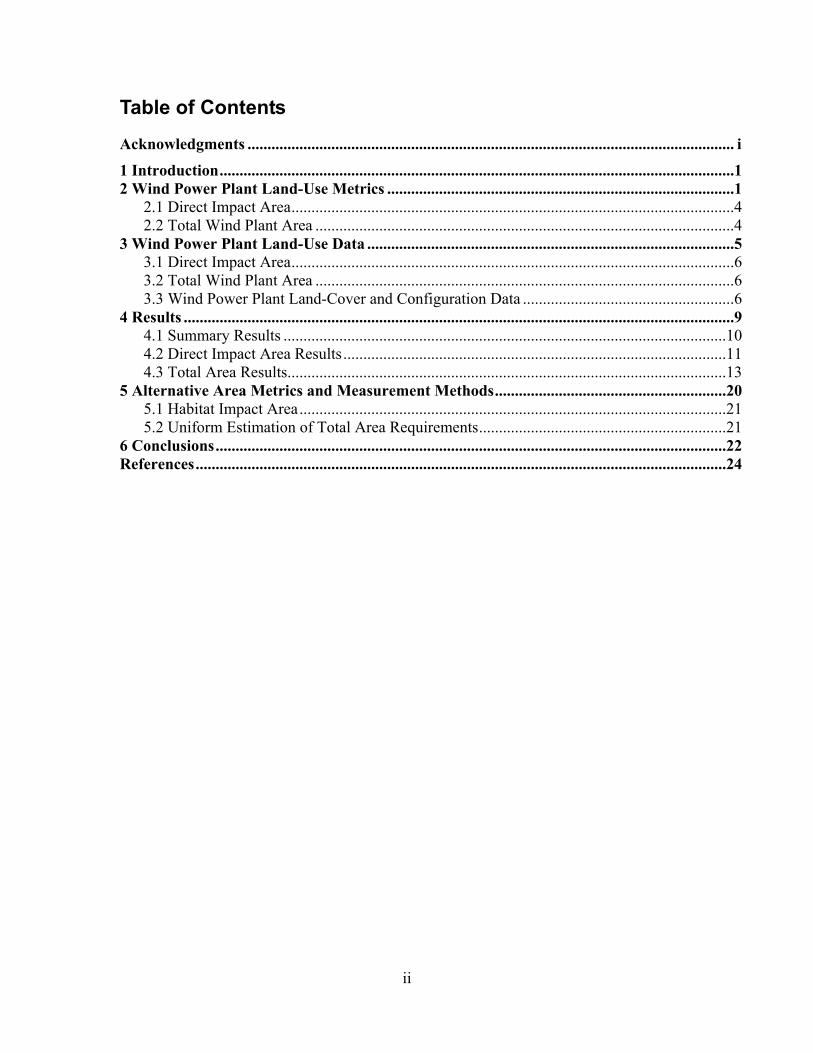
Quantifying the area of a wind power plant is challenging given the discontinuous nature of its configuration. “Area” includes not only land directly disturbed by installation of the turbines, but also the surrounding area that potentially may be impacted. In reviewing various environmental impact assessments and other evaluations of wind plant land use, it appears that there are two general types of “areas” considered. The first is the direct surface area impact (i.e., disturbed land) due to plant construction and infrastructure. The second is more vaguely defined, but is associated with the total area of the wind power plant as a whole. Figure 1 provides a simplified illustration of the two types of areas, which are vastly different in both quantity and quality of impacts as discussed in subsequent sections.
3
Figure 1. Illustration of the two types of wind plant land use: total area and direct impact area
(including permanent and temporary)1
1 The total project area map is adapted from an actual project application (U.S. DOE 2005). The direct impact area is a simplified illustration meant to represent typical components and does NOT represent this or any actual project.

4
2.1 Direct Impact Area Development of a wind power plant results in a variety of temporary and permanent (lasting the life of the project) disturbances. These disturbances include land occupied by wind turbine pads, access roads, substations, service buildings, and other infrastructure which physically occupy land area, or create impermeable surfaces. Additional direct impacts are associated with development in forested areas, where additional land must be cleared around each turbine. While land cleared around a turbine pad does not result in impervious surfaces, this modification represents a potentially significant degradation in ecosystem quality (Arnett et al. 2007).
In addition to permanent impacts, which last the life of the facility, there are temporary impacts from plant construction. These impacts are associated with temporary construction-access roads, storage, and lay-down. After plant construction is completed, these areas will eventually return to their previous state. The amount of time required to return to its “pre-disturbance condition” is estimated at two-three years for grasslands and “decades” in desert environments (Arnett et al. 2007).
An illustration of the direct impact area is shown in the magnified section of Figure 1, and demonstrates the components of direct impact, including the impermeable turbine pad and road, the permanently altered clearing around the turbine, and the temporary lay-down area. This illustration is not meant to represent any specific project and the actual components and configuration of direct impact area will vary among projects.
2.2 Total Wind Plant Area While the area and impacts associated with physical infrastructure described in Section 2.1 may be the easiest to quantify, the more commonly cited land-use metric associated with wind power plants is the footprint of the project as a whole. However, unlike the area occupied by roads and pads, the total area is more challenging to define and subjective in nature. Generally, the total area of a wind power plant consists of the area within a perimeter surrounding all of the turbines in the project. However, the perimeter is highly dependent on terrain, turbine size, current land use, and other considerations such as setback regulations. An example of the total area of a project is illustrated in Figure 1, showing the individual turbine strings, and the very irregular perimeter. There is no uniform definition of the perimeter or boundary surrounding a wind power plant – in fact, the total area of a wind power plant could have a number of definitions. The boundary could be defined based on the required turbine spacing as a function of rotor diameter, or use a standardized setback from turbines at the edge of a project. As discussed in Section 3, this paper relies on the area defined through project applications or other documentation associated with each project. The character of impact of the total area of a wind power plant is very different from the direct impact area, or the area associated with other types of energy production facilities. Many previous comparisons of total land use associated with energy production only include the total area affected, and provide little discussion of the damage function as a comparative metric. A wind plant in an agricultural area with low population and minimum avian impacts would have a much lower damage function than an area mined for coal or flooded by a hydropower project, for example. As a result, using the total area
5
metric without qualification may significantly overstate the land impacts of wind power compared to other sources. Alternatively, wind power projects should consider the impacts associated with habitat disruption, avian impacts, and aesthetics. Ultimately, the actual quality of impacts, captured in a damage function, is needed to compare the land impacts of wind to other sources. 3 Wind Power Plant Land-Use Data
Our goal was to collect and provide a summary of reported land-use data associated with modern, large wind power plants. As a result, we restricted the sample of sites to projects constructed after 2000 and with a nameplate capacity greater than 20 MW.2
A variety of sources for land-use data were used for this study and fell into three general categories. First, where available, we collected official project data from federal, state, and local regulatory agencies, including environmental impact statements (EIS), environmental assessments (EA), and project applications to utility regulatory bodies. The availability of this data is highly dependent on state and local regulations. Some states require very detailed environmental assessments, while others require little in the way of analysis of potential land use. Second, we collected project fact sheets, news releases, and other data provided by the project owner or developer. When no other source of data could be located, we used news articles, Web sites and other secondary sources. As a supplement to area data, we also collected location and land-cover data for individual turbines from publicly available data sets. The following sections provide details about the specific types and sources of data collected.
We included proposed projects, but only those with detailed, formal applications (or environmental assessments) to a regulatory agency.
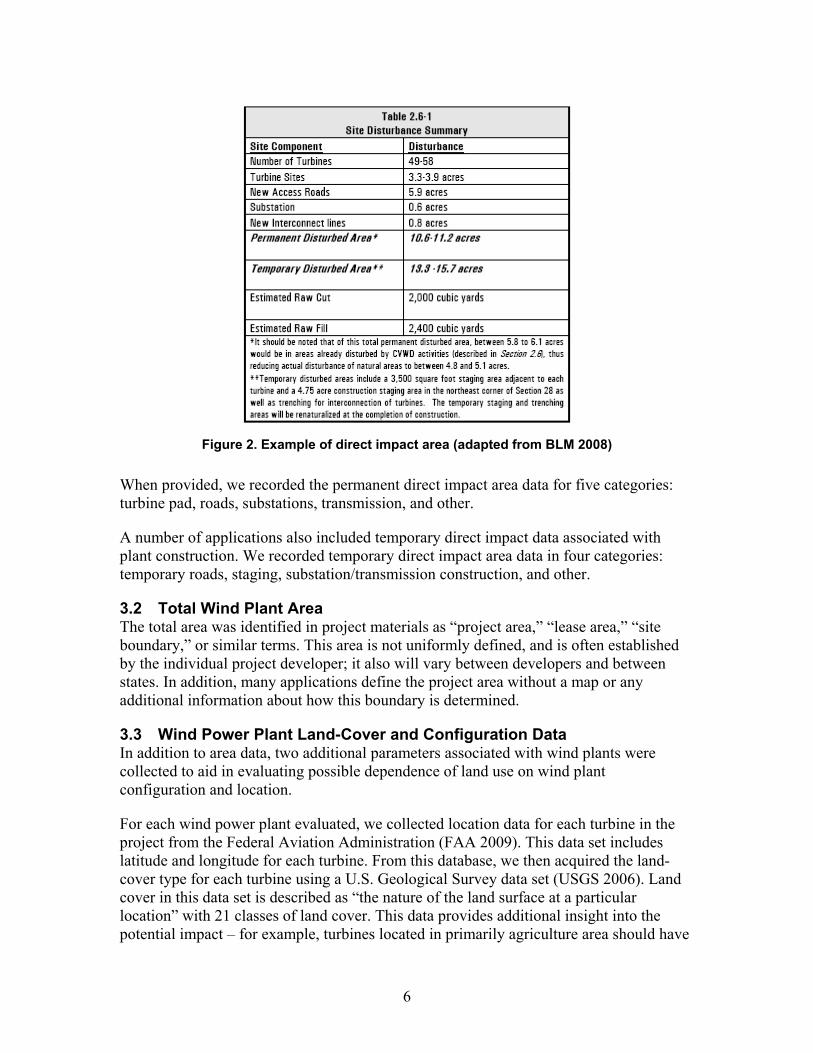
3.1 Direct Impact Area The direct impact area was identified in project materials as land “permanently occupied,” “permanently disturbed,” or using similar wording. When provided, most projects report a single number for land directly occupied; however, some provide a breakdown of occupation categories. Figure 2 provides an example of a detailed table of occupied area from a project application.
2 We excluded older projects largely because they use turbines less than 1 MW. This excludes several large projects such as those in the Altamont Pass and Tehachapi regions in California.
6
Figure 2. Example of direct impact area (adapted from BLM 2008)
When provided, we recorded the permanent direct impact area data for five categories: turbine pad, roads, substations, transmission, and other.
A number of applications also included temporary direct impact data associated with plant construction. We recorded temporary direct impact area data in four categories: temporary roads, staging, substation/transmission construction, and other.
3.2 Total Wind Plant Area The total area was identified in project materials as “project area,” “lease area,” “site boundary,” or similar terms. This area is not uniformly defined, and is often established by the individual project developer; it also will vary between developers and between states. In addition, many applications define the project area without a map or any additional information about how this boundary is determined.
3.3 Wind Power Plant Land-Cover and Configuration Data In addition to area data, two additional parameters associated with wind plants were collected to aid in evaluating possible dependence of land use on wind plant configuration and location.
For each wind power plant evaluated, we collected location data for each turbine in the project from the Federal Aviation Administration (FAA 2009). This data set includes latitude and longitude for each turbine. From this database, we then acquired the land- cover type for each turbine using a U.S. Geological Survey data set (USGS 2006). Land cover in this data set is described as “the nature of the land surface at a particular location” with 21 classes of land cover. This data provides additional insight into the potential impact – for example, turbines located in primarily agriculture area should have
7
significantly less impact than turbines located in forested area, which are more likely to require additional clearing and have a greater potential for habitat fragmentation and other adverse environmental impacts.
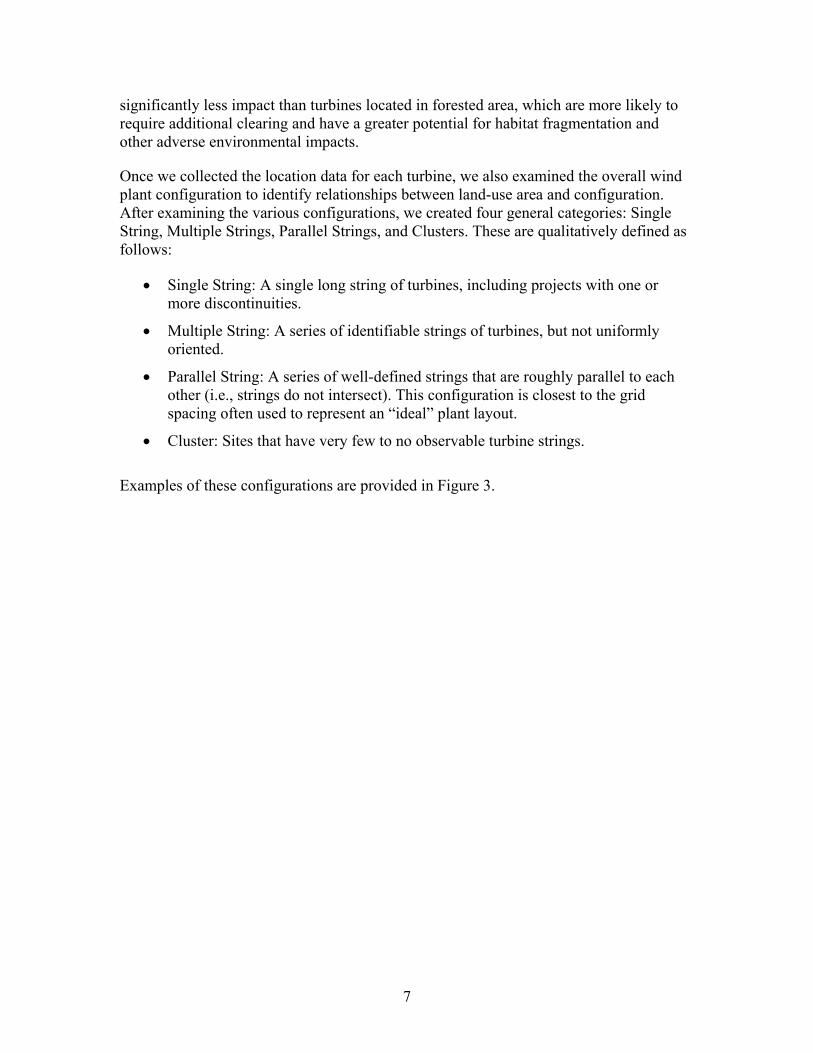
Once we collected the location data for each turbine, we also examined the overall wind plant configuration to identify relationships between land-use area and configuration. After examining the various configurations, we created four general categories: Single String, Multiple Strings, Parallel Strings, and Clusters. These are qualitatively defined as follows:
• Single String: A single long string of turbines, including projects with one or more discontinuities.
• Multiple String: A series of identifiable strings of turbines, but not uniformly oriented.
• Parallel String: A series of well-defined strings that are roughly parallel to each other (i.e., strings do not intersect). This configuration is closest to the grid spacing often used to represent an “ideal” plant layout.
• Cluster: Sites that have very few to no observable turbine strings.
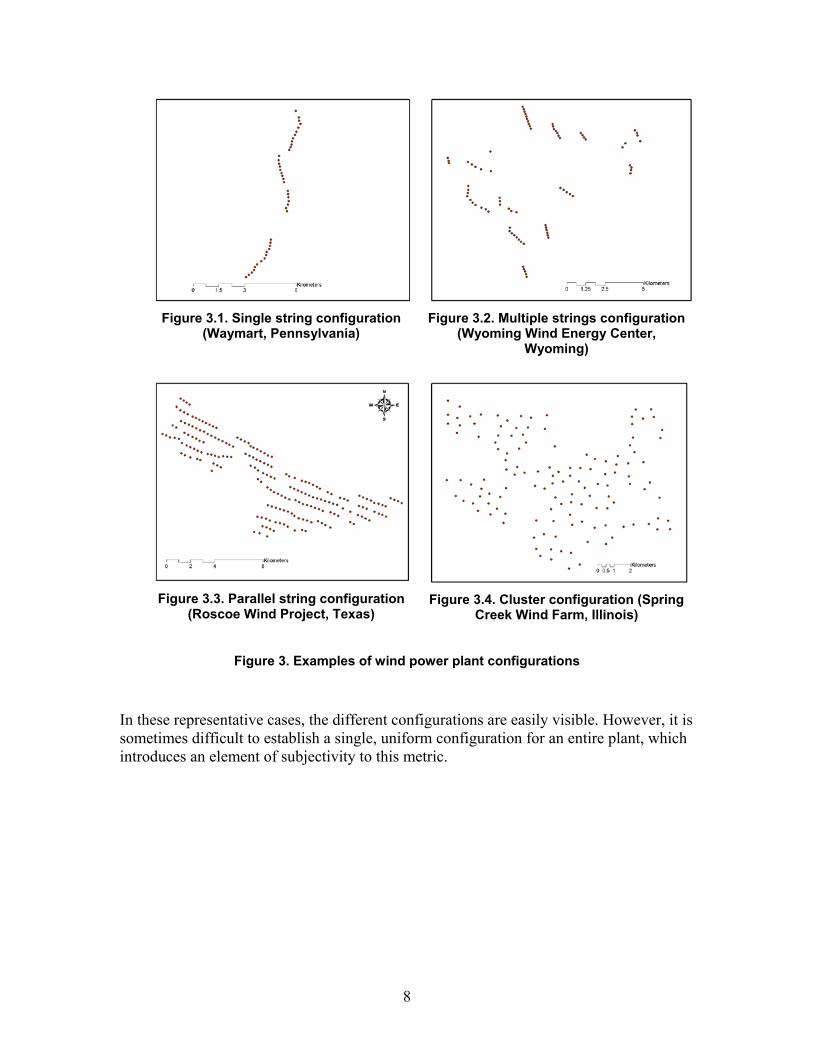
Examples of these configurations are provided in Figure 3.
8
Figure 3.1. Single string configuration
(Waymart, Pennsylvania)
Figure 3.2. Multiple strings configuration
(Wyoming Wind Energy Center, Wyoming)
Figure 3.3. Parallel string configuration
(Roscoe Wind Project, Texas)
Figure 3.4. Cluster configuration (Spring
Creek Wind Farm, Illinois)
Figure 3. Examples of wind power plant configurations
In these representative cases, the different configurations are easily visible. However, it is sometimes difficult to establish a single, uniform configuration for an entire plant, which introduces an element of subjectivity to this metric.

9
4 Results
We obtained one or more categories of land-use data for 172 individual projects, representing 26,462 MW of proposed or installed capacity. Of this capacity, 19,834 MW was completed as of March 2009, 2,892 MW was under construction, and the remainder consists of proposed projects. According to a the American Wind Energy Association (2009b), as of March 2009, 28,206 MW wind capacity had been completed in the United States, with 24,640 MW meeting our criteria as a large modern plant with a capacity of at least 20 MW and constructed after 2000. As a result, we collected at least some information on about 80% of the targeted installed wind capacity in the United States. Figure 4 provides a map of project locations. A complete listing of all projects, data sources, and individual project data is provided in the Appendix.
Figure 4. Locations of wind power plants evaluated in this study
10
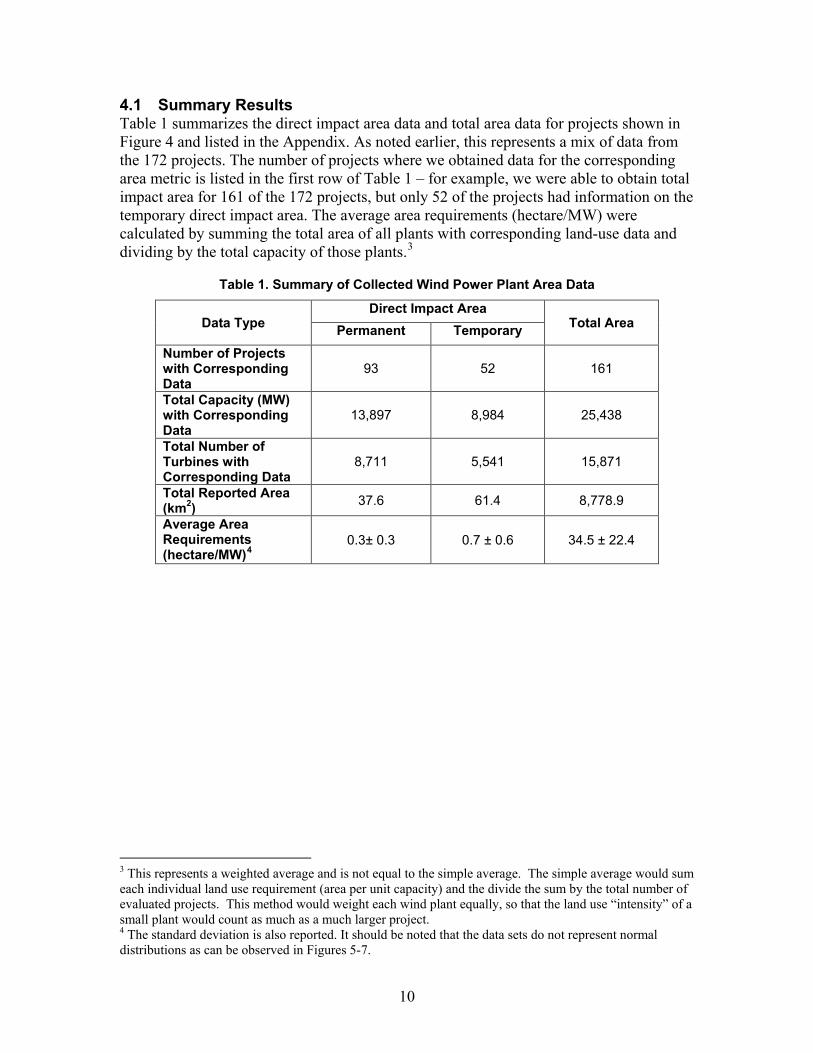
4.1 Summary Results Table 1 summarizes the direct impact area data and total area data for projects shown in Figure 4 and listed in the Appendix. As noted earlier, this represents a mix of data from the 172 projects. The number of projects where we obtained data for the corresponding area metric is listed in the first row of Table 1 – for example, we were able to obtain total impact area for 161 of the 172 projects, but only 52 of the projects had information on the temporary direct impact area. The average area requirements (hectare/MW) were calculated by summing the total area of all plants with corresponding land-use data and dividing by the total capacity of those plants.3
Table 1. Summary of Collected Wind Power Plant Area Data
Data Type Direct Impact Area
Total Area Permanent Temporary Number of Projects with Corresponding Data
93 52 161
Total Capacity (MW) with Corresponding Data
13,897 8,984 25,438
Total Number of Turbines with Corresponding Data
8,711 5,541 15,871
Total Reported Area (km2) 37.6 61.4 8,778.9
Average Area Requirements (hectare/MW)4
0.3± 0.3
0.7 ± 0.6 34.5 ± 22.4
3 This represents a weighted average and is not equal to the simple average. The simple average would sum each individual land use requirement (area per unit capacity) and the divide the sum by the total number of evaluated projects. This method would weight each wind plant equally, so that the land use “intensity” of a small plant would count as much as a much larger project. 4 The standard deviation is also reported. It should be noted that the data sets do not represent normal distributions as can be observed in Figures 5-7.
11
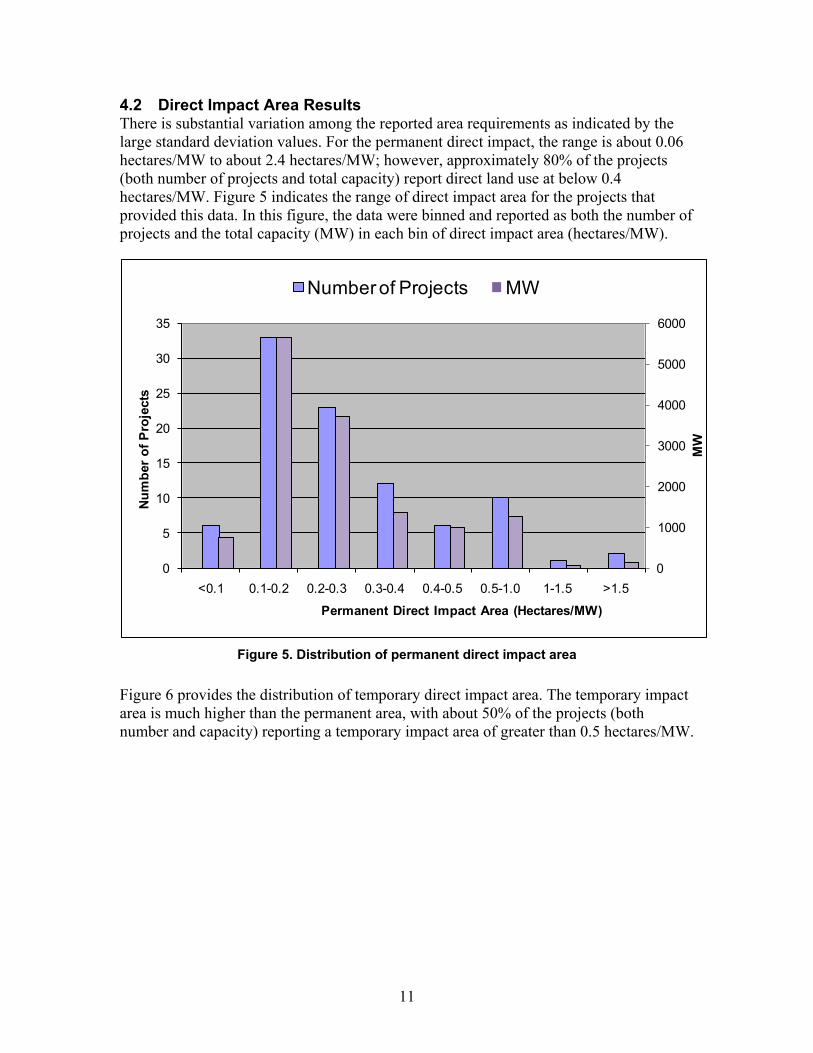
4.2 Direct Impact Area Results There is substantial variation among the reported area requirements as indicated by the large standard deviation values. For the permanent direct impact, the range is about 0.06 hectares/MW to about 2.4 hectares/MW; however, approximately 80% of the projects (both number of projects and total capacity) report direct land use at below 0.4 hectares/MW. Figure 5 indicates the range of direct impact area for the projects that provided this data. In this figure, the data were binned and reported as both the number of projects and the total capacity (MW) in each bin of direct impact area (hectares/MW).
0
1000
2000
3000
4000
5000
6000
0
5
10
15
20
25
30
35
<0.1 0.1-0.2 0.2-0.3 0.3-0.4 0.4-0.5 0.5-1.0 1-1.5 >1.5
MW
Num
ber o
f Pro
ject
s
Permanent Direct Impact Area (Hectares/MW)
Number of Projects MW
Figure 5. Distribution of permanent direct impact area
Figure 6 provides the distribution of temporary direct impact area. The temporary impact area is much higher than the permanent area, with about 50% of the projects (both number and capacity) reporting a temporary impact area of greater than 0.5 hectares/MW.

12
0
500
1000
1500
2000
2500
0
2
4
6
8
10
12
14
<0.1 0.1-0.2 0.2-0.3 0.3-0.4 0.4-0.5 0.5-1.0 1-1.5 >1.5
MW
Num
ber o
f Pro
ject
s
Temporary Direct Impact Area (Hectares/MW)
Number of Projects MW
Figure 6. Distribution of temporary direct impact area
The overall average direct impact area is 0.3 ± 0.3 hectares/MW for permanent impact and 0.7 ± 0.6 hectares/MW for temporary impact, or a total direct surface area disruption of about 1.0 ± 0.7 hectares/MW.
The reported values can be compared to previous estimates of direct impacts. The Bureau of Land Management (BLM 2005) estimated a direct impact area (both permanent and temporary) of 0.4 to 1.2 hectares per turbine in the western United States. Assuming a 1.5 MW turbine, this corresponds to total direct impact area of 0.3 to 0.8 hectares/MW. Strickland and Johnson (2006) estimate permanent infrastructure impacts of 0.3 to 0.4 hectares per turbine, and temporary impacts of 0.2 to 1.0 hectares per turbine. Assuming a 1.5 MW turbine, this corresponds to a permanent impact area of 0.2 to 0.5 hectares/MW and temporary impact area of 0.1 to 0.7 hectares/MW.
Where provided, we collected data that breaks out the occupation categories as described previously. Less than a third of the projects that reported direct impact area provided detailed data. Tables 2 and 3 provide summary statistics of this data.

13
Table 2. Projects with Detailed Direct Impact Data
Permanent Temporary Number of Projects with Detailed Data 23 17
Total MW 4,257 3,642
Table 3. Distribution of Direct Impact Area
Permanent Impact Category % of Area Temporary Impact
Category % of Area
Turbine Area 10% Staging Area 30% Roads 79% Temp Roads 62%
Substation 6% Sub/Trans construction 6%
Transmission 2% Other 3% Other 2%
Table 3 indicates that the majority of direct impacts are associated with roads. In most cases, the road area provided in the documents only counts new road development or road improvement. For further studies, it would be useful to more closely review project documents to determine the amount of new roads that were constructed versus the extent to which the project used the preexisting road network.
4.3 Total Area Results For total area requirements, the range of values is from about 9 hectares/MW to 100 hectares/MW, with five “outliers” – three projects with requirements below 6 hectares/MW and two projects with reported areas of greater than 135 hectares/MW.
Figure 7 provides a distribution of the total area requirements (hectares/MW).

14
0
1000
2000
3000
4000
5000
6000
7000
8000
9000
0
10
20
30
40
50
60
<10 10-20 20-30 30-40 40-50 50-60 60-70 >70
MW
Num
ber o
f Pro
ject
s
Total Project Area (Hectares/MW)
Number of Projects MW
Figure 7. Distribution of total area requirements
Many estimates of total area often express wind plant land use in terms of capacity density (capacity per unit area, typically MW/km2). Excluding the outliers, the reported data represents a capacity density range of 1.0 to 11.2 MW/km2 and an overall average capacity density of 3.0 ± 1.7 MW/km2. Figure 8 provides a distribution of the capacity density data. Of the 161 projects with total land-use area data, 125 (representing 80% of the evaluated capacity) have reported area of between 10 and 50 hectares/MW (or a capacity density range of 2-10 MW/km2).

15
0
1000
2000
3000
4000
5000
6000
0
5
10
15
20
25
30
35
40
<1 1--2 2--3 3--4 4--5 5--6 6--7 7--8 >8
MW
Num
ber o
f Pro
ject
s
Capacity Density (MW/km2)
Number of Projects MW
Figure 8. Distribution of total area expressed as capacity density
Previous estimates of total area are often based on theoretical potential to extract energy over a particular area, such as the U.S. DOE (2008) estimate of 20 hectares/MW (equal to a capacity density of 5 MW/km2). Other estimates assume turbines are configured in a grid with a fixed array spacing, such as 5 rotor diameters by 10 rotor diameters (a 5D by 10D array), or some alternative fixed spacing (Manwell et al. 2002, Fthenakis and Kim 2009). For modern wind turbines, a 5D by 10D array yields an area of 13-20 hectares/MW, equal to a capacity density of 5-8 MW/km2 (Denholm 2006). These estimates represent minimum spacing to optimize energy extraction.
The overall average land use reported in this study is higher than estimates that use optimal grid spacing due, in part, to irregular spacing seen in actual projects. However, in reviewing the project applications and environmental assessments, we found several potentially significant sources of overestimates of the land use associated with some projects.
In some cases, developers lease (or propose to lease) all the land deemed necessary for a multiphase project at once, and all of that land then gets associated with an initial phase of the project rather than the final (larger) project.
We have also found that in several states, project areas are mapped based on discrete sections (where a section is defined as a 1 square mile parcel5
5 http://www.nationalatlas.gov/articles/boundaries/a_plss.html
), and that an entire section is included if there is a turbine located anywhere on that section. This can actually lead to double counting of sections, when two separate projects overlap on the same section, and
16
that section is assigned to both projects. Additional complete or partial sections may be assigned to the project area surrounding the outermost edge of turbines. These factors will tend to increase the reported land use, decreasing the reported capacity density of wind projects.
One example of potential land-use overestimation is the Moraine II Project in Minnesota (PPM Energy 2007). This project has the greatest total area of all evaluated projects equal to 226 hectares/MW, or a capacity density of 0.44 MW/km2. This value was based on the application, which states that “The site boundary in Minnesota encompasses an area of approximately 26,992 acres.” Examining the project map, the site boundary includes 40 complete sections of land, while turbines are located on only six of these sections. While this is the most extreme example, many other projects include large areas unoccupied by “initial phase” wind turbines or associated infrastructure.
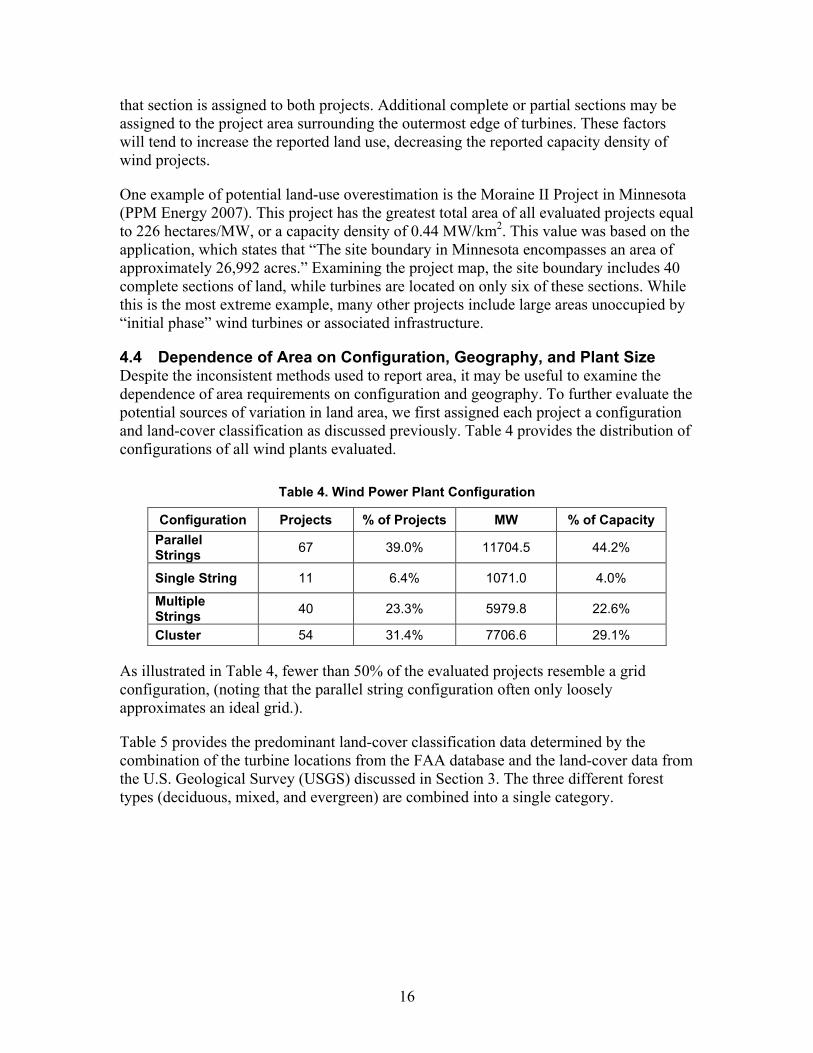
4.4 Dependence of Area on Configuration, Geography, and Plant Size Despite the inconsistent methods used to report area, it may be useful to examine the dependence of area requirements on configuration and geography. To further evaluate the potential sources of variation in land area, we first assigned each project a configuration and land-cover classification as discussed previously. Table 4 provides the distribution of configurations of all wind plants evaluated.
Table 4. Wind Power Plant Configuration
Configuration Projects % of Projects MW % of Capacity Parallel Strings 67 39.0% 11704.5 44.2%
Single String 11 6.4% 1071.0 4.0%
Multiple Strings 40 23.3% 5979.8 22.6%
Cluster 54 31.4% 7706.6 29.1% As illustrated in Table 4, fewer than 50% of the evaluated projects resemble a grid configuration, (noting that the parallel string configuration often only loosely approximates an ideal grid.).
Table 5 provides the predominant land-cover classification data determined by the combination of the turbine locations from the FAA database and the land-cover data from the U.S. Geological Survey (USGS) discussed in Section 3. The three different forest types (deciduous, mixed, and evergreen) are combined into a single category.

17
Table 5. Land-Cover Data
Primary Land Type Projects % of Projects MW % of
Capacity Shrubland 38 22.1% 7,169 27.1%
Forest 15 8.7% 1,711 6.5%
Grasslands/Herbaceous 34 19.8% 5,324 20.1%
Pasture/Hay 16 9.3% 1,997 7.5%
Row Crops 54 31.4% 8,199 31.0%
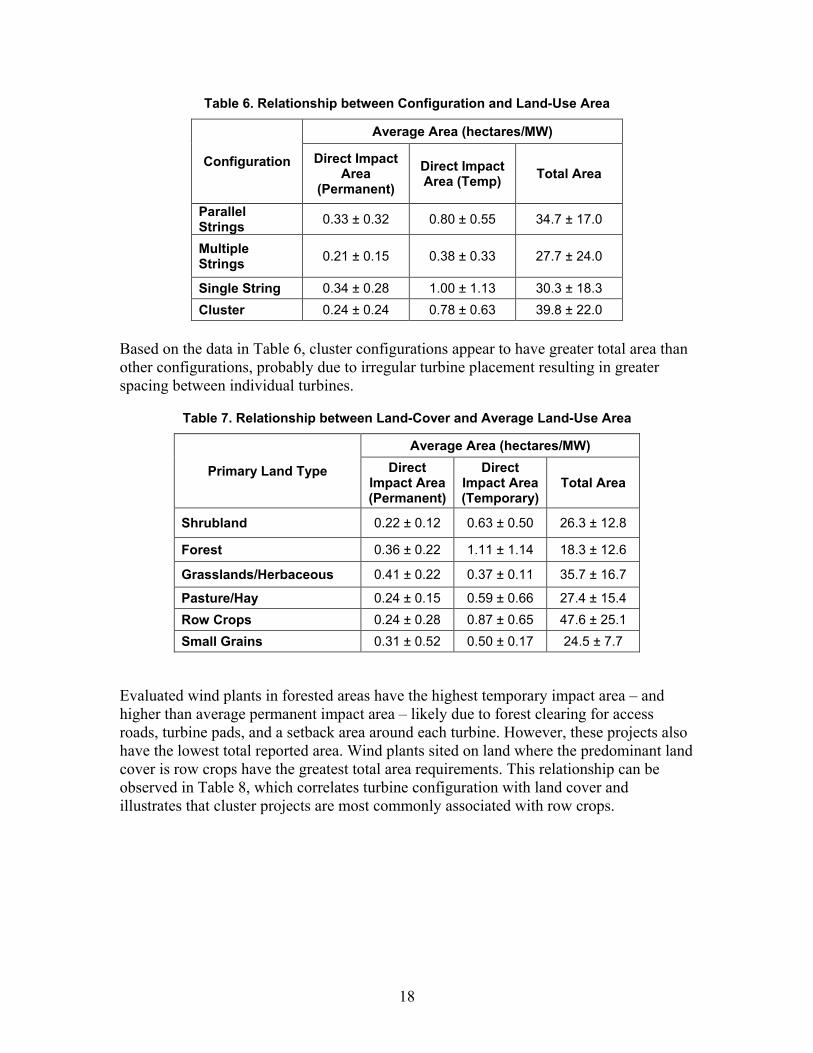
Small Grains 15 8.7% 2,063 7.8% Tables 6 and 7 provide the average land-use data by configuration and land-cover classification. It should be noted that by splitting the project data by category, we substantially reduced the number of plants in each category. For example, while we identified 67 projects having the parallel strings configuration, only 11 had temporary land-use data available. We also calculate the average area and standard deviation using all reported data, despite the fact that there are significant outliers (reflected in the large standard deviation).
18
Table 6. Relationship between Configuration and Land-Use Area
Configuration
Average Area (hectares/MW)
Direct Impact Area
(Permanent) Direct Impact Area (Temp) Total Area
Parallel Strings 0.33 ± 0.32 0.80 ± 0.55 34.7 ± 17.0
Multiple Strings 0.21 ± 0.15 0.38 ± 0.33 27.7 ± 24.0
Single String 0.34 ± 0.28 1.00 ± 1.13 30.3 ± 18.3 Cluster 0.24 ± 0.24 0.78 ± 0.63 39.8 ± 22.0
Based on the data in Table 6, cluster configurations appear to have greater total area than other configurations, probably due to irregular turbine placement resulting in greater spacing between individual turbines.
Table 7. Relationship between Land-Cover and Average Land-Use Area
Primary Land Type
Average Area (hectares/MW) Direct
Impact Area (Permanent)
Direct Impact Area (Temporary)
Total Area
Shrubland 0.22 ± 0.12 0.63 ± 0.50 26.3 ± 12.8
Forest 0.36 ± 0.22 1.11 ± 1.14 18.3 ± 12.6
Grasslands/Herbaceous 0.41 ± 0.22 0.37 ± 0.11 35.7 ± 16.7
Pasture/Hay 0.24 ± 0.15 0.59 ± 0.66 27.4 ± 15.4 Row Crops 0.24 ± 0.28 0.87 ± 0.65 47.6 ± 25.1 Small Grains 0.31 ± 0.52 0.50 ± 0.17 24.5 ± 7.7
Evaluated wind plants in forested areas have the highest temporary impact area – and higher than average permanent impact area – likely due to forest clearing for access roads, turbine pads, and a setback area around each turbine. However, these projects also have the lowest total reported area. Wind plants sited on land where the predominant land cover is row crops have the greatest total area requirements. This relationship can be observed in Table 8, which correlates turbine configuration with land cover and illustrates that cluster projects are most commonly associated with row crops.

19
Table 8. Relationship between Land Cover and Configuration
Primary Land Type Number of Projects
Parallel Strings
Multiple Strings
Single String Cluster
Shrubland 21 13 2 2 Forest 1 5 6 3 Grasslands/Herbaceous 20 6 3 5
Pasture/Hay 0 3 0 13
Row Crops 17 7 0 30
Small Grains 8 6 0 1 We also examined the relationship between overall wind power plant capacity (MW) and reported land-use requirements (hectare/MW). Figures 9 and 10 relate direct impact area and total area as a function of project size. In Figure 9, one temporary impact point equal to 4.5 hectare/MW has been omitted for chart clarity.
0
0.25
0.5
0.75
1
1.25
1.5
1.75
2
2.25
2.5
0 100 200 300 400 500 600 700 800 900 1000
Wind Power Plant Size (MW)
Dire
ct Im
pact
Are
a (h
ecta
re/M
W)
Permanent
Temporary
Figure 9. Direct impact area requirements (hectare/MW) as a function of wind power plant size

20
Figure 10 illustrates the relationship between total area (measured in terms of capacity density) and project size. Three outliers above 12 MW/km2 are not shown. As with Figure 9, there appears to be no significant trends, and very little correlation (with r-values less than 0.05 for all relationships in the figures.)6
0
2
4
6
8
10
12
0 100 200 300 400 500 600 700 800 900 1000
Wind Power Plant Size (MW)
Capa
city
Den
sity
(MW
/km
2)
Figure 10. Capacity density as a function of wind power plant size
5 Alternative Area Metrics and Measurement Methods
There are a number of limitations to the evaluation of land use in existing data sets. Primarily, any metric that includes only area and does not include the quality of impact (damage function) will be unable to completely capture the land-use impacts of wind power plants or any electricity generation technology. However, there are additional “area only” metrics that could improve understanding of the land-use impacts of wind power plants. In this section, we suggest two additional area measurements that could be generally applied. The first is habitat impact area, which attempts to more directly measure the area of ecosystem impact. The second is a more general measure of total area, incorporating a standardized methodology.
6 We also examined the relationship between turbine size and land use, hypothesizing that larger turbines would require less direct land impact area per unit of capacity. However, we found no significant relationship trends in the reported data.

21
5.1 Habitat Impact Area One additional land-use metric that could be considered more generally would be a “habitat impact area,” which measures the area of fragmentation or decrease in habitat quality. (Impact on habitat is often considered and reported in individual project applications and environmental assessments.) Summary estimates of regional ecosystem impacts are provided by the National Research Council (2007) and Arnet et al. (2007). As an example, Robel (2002) estimates turbines placed in certain grassland areas will reduce the available habitat for greater prairie-chicken nesting by about 800 hectares for each turbine (about 530 hectares/MW, assuming a 1.5 MW turbine). Turbines placed in forested areas can create an “edge effect” (Jordaan et al. 2009), which results in disruptions that can exceed 340 meters in all directions for certain species (Wood et al. 2006), or a habitat impact of more than 24 hectares/MW, assuming a 1.5 MW turbine. These examples show the limitations of the simple metrics provided in this report, as well as the limitation of quantifying wind power plant land use without qualifying their impacts on a regional basis.
5.2 Uniform Estimation of Total Area Requirements As discussed previously, there is no uniform definition of the total area of a wind power plant. This paper describes the wind plant area in the United States that is reported to be leased or otherwise associated with a project application. As discussed previously, the measurement of total area varies by project developer and by state, and provides a limited basis to compare projects regionally or to estimate land use in future wind generation scenarios.
Addressing the limitations caused by using developer’s estimates of project areas would require developing a more uniform metric for the total area of wind power plants based on setbacks or other relation to turbines. Figure 11 provides an example of three potential measures of total area that could be generally applied based on the availability of individual turbine locations from the FAA database or other sources. The method is based on the geometric concept of a “convex hull,” which can be described by visualizing a rubber band stretched around the perimeter of a set of points. Applying this method to calculate wind plant area requires establishment of several parameters. First, the setback from the outermost edge of the wind turbines must be standardized. Second, the amount of “relaxation” into the interior of the project must be established. The effect of different relaxations is illustrated by buffer areas 2 and 3, where some of the open space inside the outermost perimeter is eliminated. A final element to consider is the effect of any large discontinuities in the project. A complicating issue in establishing these three parameters is that they would probably vary depending on land-cover type. For example, setbacks would be greater for turbines located in forested areas. If these parameters are established, it should be relatively easy to determine the total land use associated with all wind energy production in the United States.

22
Figure 11. Possible methodologies for assigning uniform land metrics to total area of wind
power plants
6 Conclusions
Although there is no uniformly accepted single metric of land use for wind power plants, two primary indices of land use do exist – the infrastructure/direct impact area (or land temporarily or permanently disturbed by wind power plant development) and the total area (or overall area of the power plant as a whole).
Based on the collected data, direct impact is mostly caused by road development, as opposed to the turbine pads and electrical support equipment. For 93 projects representing about 14 GW of proposed or installed capacity, the average permanent direct impact value reported was 0.3 ± 0.3 hectares/MW of capacity. Fewer projects (52 representing 9 GW of capacity) provide temporary direct impact data, with an overall average of 0.7 ± 0.6 hectares/MW of capacity. This implies a total direct impact area (both temporary and permanently disturbed land) of about 1 ± 0.7 hectare/MW, but with a wide variation in this area.
We also found reported total-area data for 161 projects representing about 25 GW of proposed or installed capacity. Excluding several outliers, the average value for the total project area was about 34 ± 22 hectares/MW, equal to a capacity density of 3.0 ± 1.7
23
MW/km2. This capacity density is less than grid-based estimates used for optimizing energy extraction. We believe that some of this difference is due to inclusion of land that was set aside for future project expansion and double counting of land where projects overlap. The limited detailed data available for many projects, including a number of large projects, limits the ability to precisely identify the discrepancy between common estimates and reported data. However, it is clear that the ideal grid configuration used for some estimates is rarely used in practice, resulting in more widely spaced turbines.
Common estimates of wind land-use requirements represent, in part, the theoretical potential to extract energy over a particular area. For example, estimates for wind resource potential assign wind project capacity to geographic areas as small as 200 m2 based on average wind resource over that grid cell. Existing projects site turbines in locations that maximize energy capture accounting for normal terrain variations, avoiding depressions, and exploiting ridges. While the theoretical approaches are often useful (as indicated by the fact that many projects achieve capacity densities equal to or greater than 5 MW/km2), practical considerations tend to increase the area actually used by projects. Without a systematic method to define project boundaries based solely on turbine spacing, the total land area required for wind projects to effectively extract energy from the flow cannot be determined. Although this paper presents the land area reported by wind project developers in the United States at this time, additional methods are needed to systematically determine land-use requirements for energy extraction, all while considering continuing advances in turbine design and plant configurations.
Total land-area metrics for wind projects are not consistently defined and provide information for different purposes. This paper explores the land area reportedly associated with U.S. wind projects based on official documents. Other approaches would explore turbine-specific dimensions (such as rotor diameter) to assess U.S. wind project area optimized for energy extraction – perhaps leading to new “rule of thumb” estimates. Finally, an automated methodology that defines a standard setback based on relative turbine locations within projects would result in a systematic approach that may reduce variation among projects.
24
References
Arnett, E.B.; Inkley, D.B; Johnson, D.H.; Larkin, R.P.; Manes, S.; Manville, A.M.; Mason, R.; Morrison, M.; Strickland, M.D.; Thresher, R. (September 2007). “Impacts of Wind Energy Facilities on Wildlife and Wildlife Habitat.” Wildlife Society Technical Review 07-2, 49 pp. The Wildlife Society, Bethesda, Maryland, USA.
American Wind Energy Association (AWEA). (2009a). Annual Wind Industry Report http://www.awea.org/publications/reports/AWEA-Annual-Wind-Report-2009.pdf
AWEA. (2009b.) http://www.awea.org/projects/ Accessed June 2, 2009.
Bureau of Land Management (BLM). (2008). Final Environmental Impact Statement/Environmental Impact Report for the Mountain View IV Wind Energy Project. Final EIR/EIS, October 2008. http://www.blm.gov/ca/st/en/fo/palmsprings/mtnview_windenergy.html. February 15, 2009.
BLM. (2005). Final Programmatic Environmental Impact Statement on Wind Energy Development on BLM Administered Land in the Western United States. http://windeis.anl.gov/documents/fpeis/index.cfm Accessed March 9, 2009.
Canals, L. M.; Bauer, C.; Depestele, J.; Dubreuil, A.; Freiermuth Knuchel, R.; Gaillard, G.; Michelsen, O.; Müller-Wenk, R.; Rydgren, B. (2007). “Key elements in a framework for land use impact assessment in LCA.” The International Journal of Life Cycle Assessment 12 (1) 5–15.
Denholm, P. (2006). “Improving the Technical, Environmental, and Social Performance of Wind Energy Systems Using Biomass-Based Energy Storage.” Renewable Energy. 31; pp. 1,355-1,370.
Federal Aviation Administration (FAA). (2009). “Obstruction Evaluation/Airport Airspace Analysis.” https://oeaaa.faa.gov/oeaaa/external/portal.jsp Accessed May 1, 2008 – March 6, 2009.
Fthenakis, V.; Kim, H. C. (2009). “Land use and electricity generation: A life-cycle analysis.” Renewable and Sustainable Energy Reviews. 13, 1465-1474.
Jordaan, S; Keith, D.; Stelfox, B. (2009) “Quantifying land use of oil sands production: a life cycle perspective.” Environmental Research Letters, 4 02004
Koellner, T.; Scholz, R. (2008). “Assessment of land use impacts on the natural environment.” The International Journal of Life Cycle Assessment, Vol. 13, No. 1. pp. 32-48.
Manwell, J.F.; McGowan, J.G.; Rogers, A.L. (2002). Wind Energy Explained: Theory, Design and Application. West Sussex, UK: John Wiley & Sons.
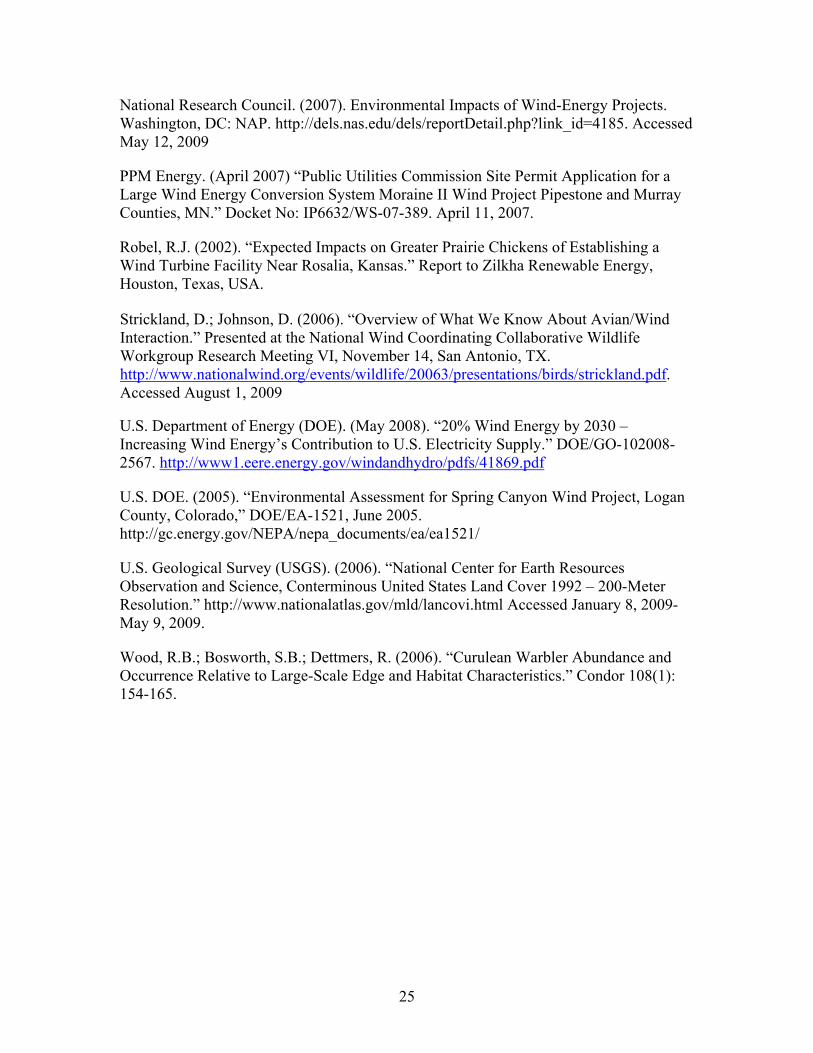
25
National Research Council. (2007). Environmental Impacts of Wind-Energy Projects. Washington, DC: NAP. http://dels.nas.edu/dels/reportDetail.php?link_id=4185. Accessed May 12, 2009
PPM Energy. (April 2007) “Public Utilities Commission Site Permit Application for a Large Wind Energy Conversion System Moraine II Wind Project Pipestone and Murray Counties, MN.” Docket No: IP6632/WS-07-389. April 11, 2007.
Robel, R.J. (2002). “Expected Impacts on Greater Prairie Chickens of Establishing a Wind Turbine Facility Near Rosalia, Kansas.” Report to Zilkha Renewable Energy, Houston, Texas, USA.
U.S. Department of Energy (DOE). (May 2008). “20% Wind Energy by 2030 – Increasing Wind Energy’s Contribution to U.S. Electricity Supply.” DOE/GO-102008-2567. http://www1.eere.energy.gov/windandhydro/pdfs/41869.pdf
U.S. DOE. (2005). “Environmental Assessment for Spring Canyon Wind Project, Logan County, Colorado,” DOE/EA-1521, June 2005. http://gc.energy.gov/NEPA/nepa_documents/ea/ea1521/
U.S. Geological Survey (USGS). (2006). “National Center for Earth Resources Observation and Science, Conterminous United States Land Cover 1992 – 200-Meter Resolution.” http://www.nationalatlas.gov/mld/lancovi.html Accessed January 8, 2009-May 9, 2009.
Wood, R.B.; Bosworth, S.B.; Dettmers, R. (2006). “Curulean Warbler Abundance and Occurrence Relative to Large-Scale Edge and Habitat Characteristics.” Condor 108(1): 154-165.
Strickland, D.; Johnson, D. (2006). “Overview of What We Know About Avian/Wind Interaction.” Presented at the National Wind Coordinating Collaborative Wildlife Workgroup Research Meeting VI, November 14, San Antonio, TX. http://www.nationalwind.org/events/wildlife/20063/presentations/birds/strickland.pdf. Accessed August 1, 2009

26
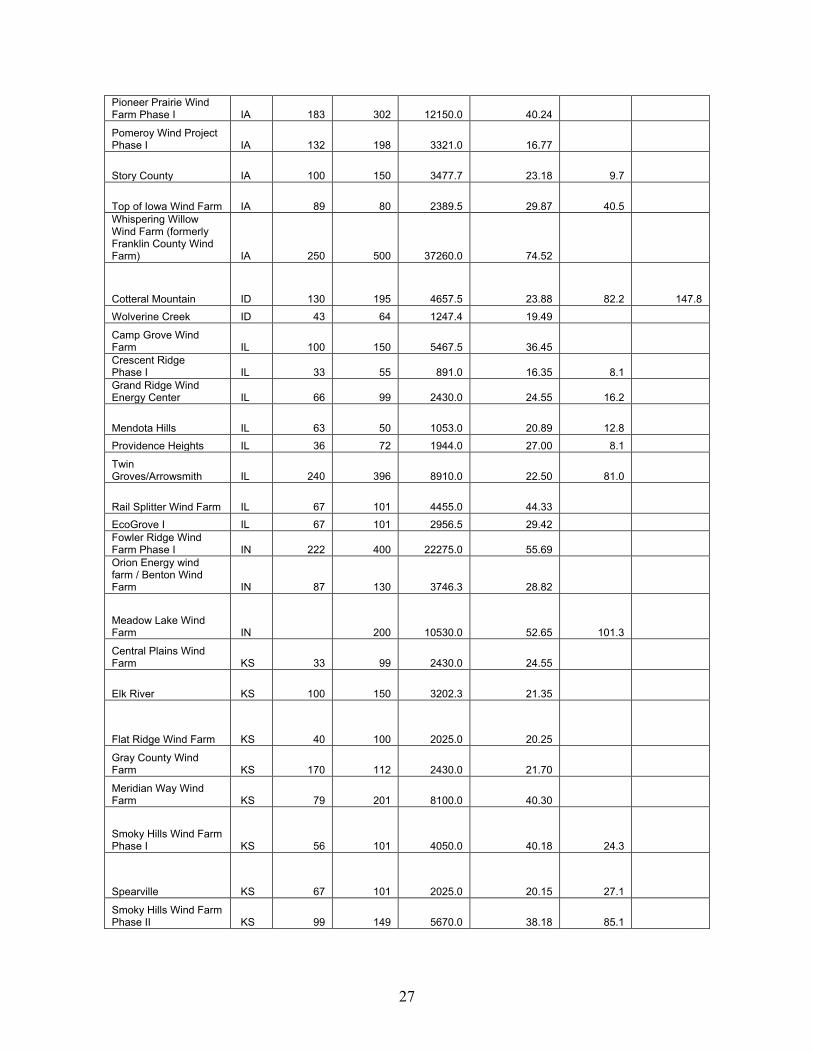
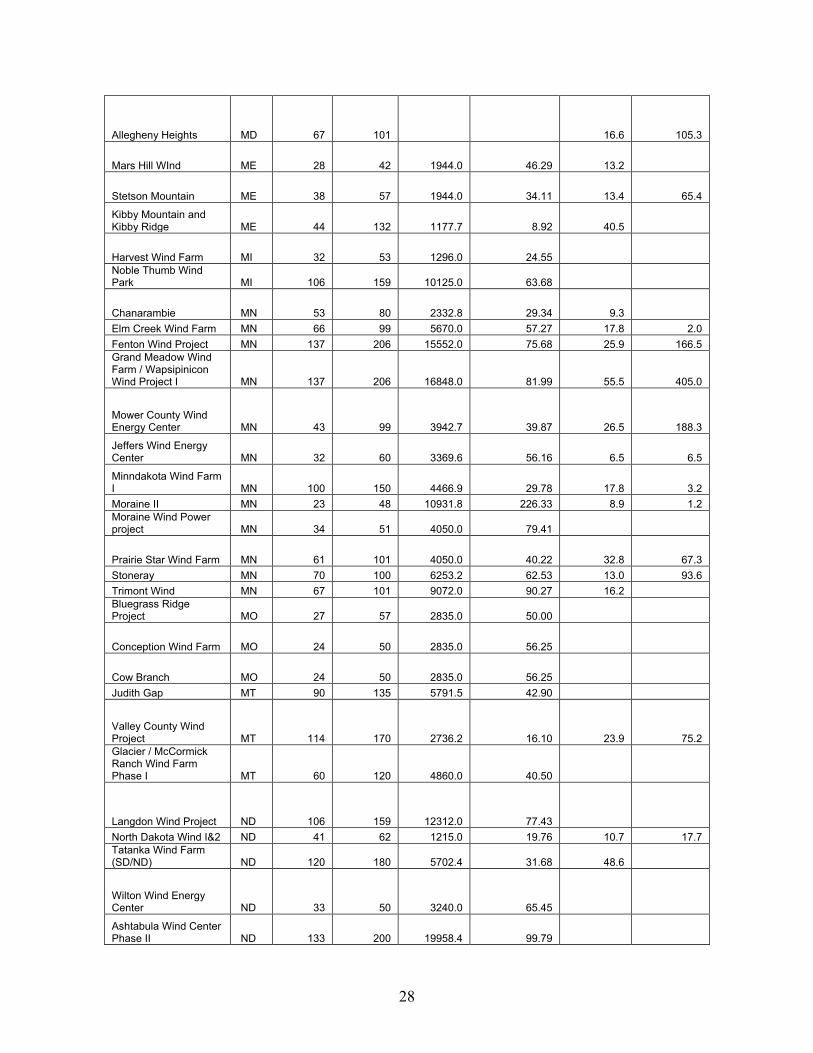
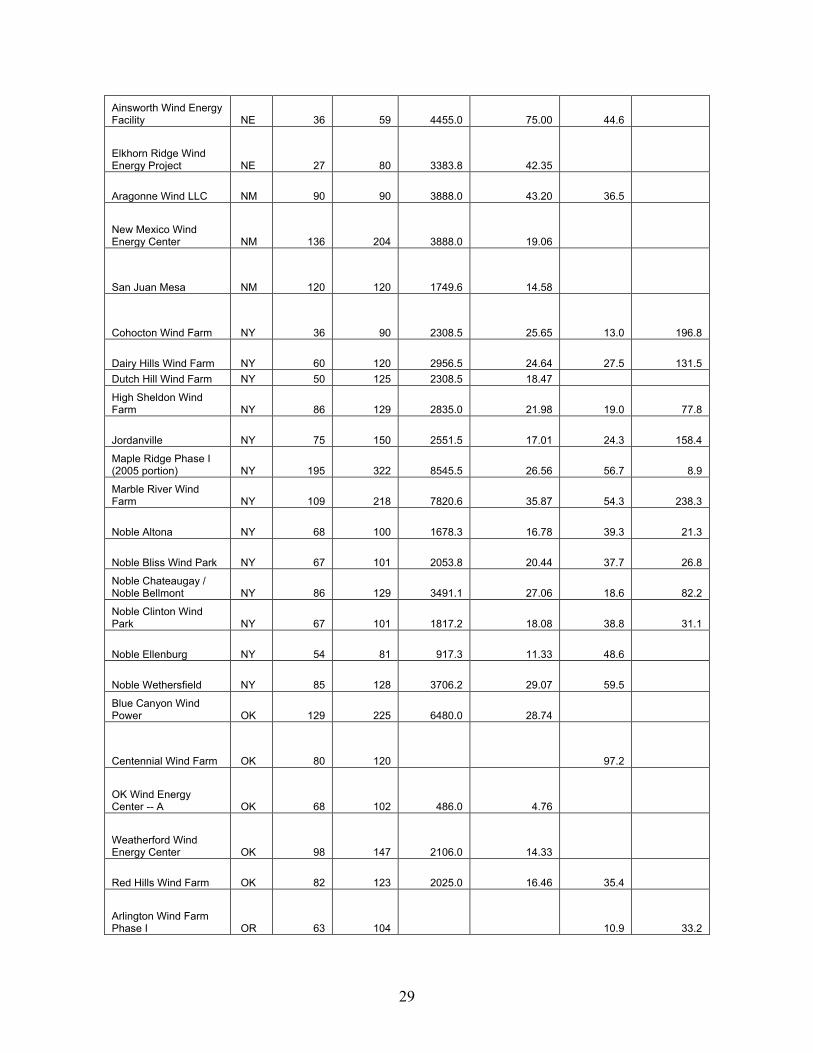
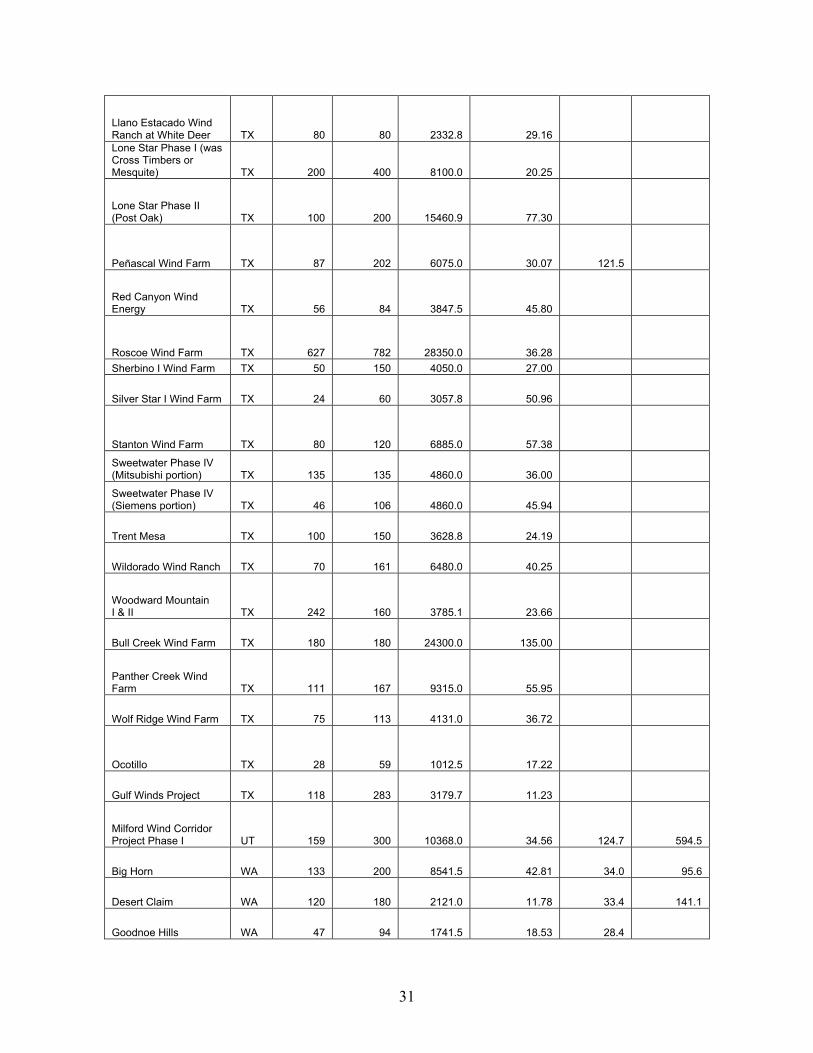
Appendix. Wind Power Plant Land-Use Data Table A1. Land-Use Data
Name State # Turbines
Capacity MW
Total Area (hectares)
Total Area Per Unit Capacity
(Hectares /MW)
Direct Impact Area
(Perm.) (hectares)
Direct Impact Area
(Temp.) (hectares)
Steel Park Wind Farm AZ 15 15 448.7 29.92
Dry Lake Wind Project I AZ 42 63 2430.0 38.57
Bear River Wind Power Project CA 35 70 4.0 12.6
Hatchet Ridge Wind Project CA 49 125 1193.9 9.55 29.6 55.1
High Winds I & II CA 90 162 2430.0 15.00 42.5 Mountain View IV CA 49 49 671.9 13.71 4.5 5.8
Pine Tree Wind Project aka Wind Turbine Prometheus CA 80 120 3240.0 27.00 53.5 42.8
Shiloh I CA 100 150 2754.0 18.36 33.8
Shiloh II CA 88 176 2470.5 14.04 20.4 57.9
Solano Wind Project, Phase IIB CA 66 85 1417.5 16.68
Cedar Creek Wind Farm CO 274 300 15390.0 51.30
Cedar Point Wind Project CO 150 300 8100.0 27.00
Colorado Green Wind Project CO 108 162 4795.2 29.60
Spring Canyon CO 87 130 8931.9 68.71 27.9 62.0
Twin Buttes Wind Power Project CO 50 75 3645.0 48.60
Buffalo Creek Wind Farm IA 75 150 4455.0 29.70 Crystal Lake IA 180 350 16848.0 48.14 Endeavor IA 40 100 1822.5 18.23
Floyd County Wind Farm Phase I IA 50 75 5.1
Hancock County Wind Farm IA 148 98 7776.0 79.35 24.3 Intrepid IA 107 161 4860.0 30.28 21.7
27
Pioneer Prairie Wind Farm Phase I IA 183 302 12150.0 40.24
Pomeroy Wind Project Phase I IA 132 198 3321.0 16.77
Story County IA 100 150 3477.7 23.18 9.7
Top of Iowa Wind Farm IA 89 80 2389.5 29.87 40.5 Whispering Willow Wind Farm (formerly Franklin County Wind Farm) IA 250 500 37260.0 74.52
Cotteral Mountain ID 130 195 4657.5 23.88 82.2 147.8 Wolverine Creek ID 43 64 1247.4 19.49
Camp Grove Wind Farm IL 100 150 5467.5 36.45 Crescent Ridge Phase I IL 33 55 891.0 16.35 8.1 Grand Ridge Wind Energy Center IL 66 99 2430.0 24.55 16.2
Mendota Hills IL 63 50 1053.0 20.89 12.8 Providence Heights IL 36 72 1944.0 27.00 8.1
Twin Groves/Arrowsmith IL 240 396 8910.0 22.50 81.0
Rail Splitter Wind Farm IL 67 101 4455.0 44.33 EcoGrove I IL 67 101 2956.5 29.42 Fowler Ridge Wind Farm Phase I IN 222 400 22275.0 55.69 Orion Energy wind farm / Benton Wind Farm IN 87 130 3746.3 28.82
Meadow Lake Wind Farm IN 200 10530.0 52.65 101.3
Central Plains Wind Farm KS 33 99 2430.0 24.55
Elk River KS 100 150 3202.3 21.35
Flat Ridge Wind Farm KS 40 100 2025.0 20.25
Gray County Wind Farm KS 170 112 2430.0 21.70
Meridian Way Wind Farm KS 79 201 8100.0 40.30
Smoky Hills Wind Farm Phase I KS 56 101 4050.0 40.18 24.3
Spearville KS 67 101 2025.0 20.15 27.1
Smoky Hills Wind Farm Phase II KS 99 149 5670.0 38.18 85.1
28
Allegheny Heights MD 67 101 16.6 105.3
Mars Hill WInd ME 28 42 1944.0 46.29 13.2
Stetson Mountain ME 38 57 1944.0 34.11 13.4 65.4
Kibby Mountain and Kibby Ridge ME 44 132 1177.7 8.92 40.5
Harvest Wind Farm MI 32 53 1296.0 24.55 Noble Thumb Wind Park MI 106 159 10125.0 63.68
Chanarambie MN 53 80 2332.8 29.34 9.3 Elm Creek Wind Farm MN 66 99 5670.0 57.27 17.8 2.0 Fenton Wind Project MN 137 206 15552.0 75.68 25.9 166.5 Grand Meadow Wind Farm / Wapsipinicon Wind Project I MN 137 206 16848.0 81.99 55.5 405.0
Mower County Wind Energy Center MN 43 99 3942.7 39.87 26.5 188.3
Jeffers Wind Energy Center MN 32 60 3369.6 56.16 6.5 6.5
Minndakota Wind Farm I MN 100 150 4466.9 29.78 17.8 3.2 Moraine II MN 23 48 10931.8 226.33 8.9 1.2 Moraine Wind Power project MN 34 51 4050.0 79.41
Prairie Star Wind Farm MN 61 101 4050.0 40.22 32.8 67.3 Stoneray MN 70 100 6253.2 62.53 13.0 93.6 Trimont Wind MN 67 101 9072.0 90.27 16.2 Bluegrass Ridge Project MO 27 57 2835.0 50.00
Conception Wind Farm MO 24 50 2835.0 56.25
Cow Branch MO 24 50 2835.0 56.25 Judith Gap MT 90 135 5791.5 42.90
Valley County Wind Project MT 114 170 2736.2 16.10 23.9 75.2 Glacier / McCormick Ranch Wind Farm Phase I MT 60 120 4860.0 40.50
Langdon Wind Project ND 106 159 12312.0 77.43 North Dakota Wind I&2 ND 41 62 1215.0 19.76 10.7 17.7 Tatanka Wind Farm (SD/ND) ND 120 180 5702.4 31.68 48.6
Wilton Wind Energy Center ND 33 50 3240.0 65.45
Ashtabula Wind Center Phase II ND 133 200 19958.4 99.79
29
Ainsworth Wind Energy Facility NE 36 59 4455.0 75.00 44.6
Elkhorn Ridge Wind Energy Project NE 27 80 3383.8 42.35
Aragonne Wind LLC NM 90 90 3888.0 43.20 36.5
New Mexico Wind Energy Center NM 136 204 3888.0 19.06
San Juan Mesa NM 120 120 1749.6 14.58
Cohocton Wind Farm NY 36 90 2308.5 25.65 13.0 196.8
Dairy Hills Wind Farm NY 60 120 2956.5 24.64 27.5 131.5 Dutch Hill Wind Farm NY 50 125 2308.5 18.47
High Sheldon Wind Farm NY 86 129 2835.0 21.98 19.0 77.8
Jordanville NY 75 150 2551.5 17.01 24.3 158.4
Maple Ridge Phase I (2005 portion) NY 195 322 8545.5 26.56 56.7 8.9
Marble River Wind Farm NY 109 218 7820.6 35.87 54.3 238.3
Noble Altona NY 68 100 1678.3 16.78 39.3 21.3
Noble Bliss Wind Park NY 67 101 2053.8 20.44 37.7 26.8
Noble Chateaugay / Noble Bellmont NY 86 129 3491.1 27.06 18.6 82.2
Noble Clinton Wind Park NY 67 101 1817.2 18.08 38.8 31.1
Noble Ellenburg NY 54 81 917.3 11.33 48.6
Noble Wethersfield NY 85 128 3706.2 29.07 59.5
Blue Canyon Wind Power OK 129 225 6480.0 28.74
Centennial Wind Farm OK 80 120 97.2
OK Wind Energy Center -- A OK 68 102 486.0 4.76
Weatherford Wind Energy Center OK 98 147 2106.0 14.33
Red Hills Wind Farm OK 82 123 2025.0 16.46 35.4
Arlington Wind Farm Phase I OR 63 104 10.9 33.2

30
Biglow Canyon Phase I OR 225 400 10125.0 25.31 71.7 159.3
Cascade Wind Project OR 40 60 2349.0 39.15 22.9 20.6
Combine Hills 1 OR 105 105 5416.9 51.59 7.3 Condon Wind Project OR 83 50 1701.0 34.16 15.4 42.1
Elkhorn Wind Power Project OR 61 101 4050.0 40.10 60.8
Klondike II OR 50 75 1782.0 23.76 178.2
Klondike III OR 124 300 7128.0 23.76 30.0 119.5
Leaning Juniper (Arlington) OR 133 200 3468.8 17.34 26.0 282.9
Shepherd's Flat OR 303 910 13000.5 14.29 103.1 178.9
Stateline 3 OR 279 184 8100.0 44.02 30.4 139.7 Hay Canyon OR 48 105 13.8
Allegheny Ridge Wind Farm I PA 40 80 16.2
Allegheny Ridge Wind Farm II PA 35 70 14.2
Waymart Wind Farm PA 47 60 347.5 5.79
MinnDakota Wind Farm II SD 36 54 1608.1 29.78 121.5
South Dakota Wind Energy Center SD 27 41 1012.5 25.00
Wessington Springs SD 66 99 2430.0 24.55
White Wind Farm SD 103 200 7257.6 36.29 37.7 253.5 Buffalo Ridge Wind Farm (SD) SD 204 306 20032.5 65.47 Brazos Wind Ranch TX 160 160 7776.0 48.60
Callahan Divide TX 76 114 2430.0 21.32
Champion Wind Farm TX 55 127 5670.0 44.82 Desert Sky TX 107 161 3888.0 24.22
Elbow Creek Wind Project TX 53 122 2713.5 22.26
Forest Creek Wind Project TX 54 124 6075.0 48.91
Goat Mountain Wind Ranch TX 109 150 4252.5 28.35
Horse Hollow Wind Energy Center TX 419 733 19035.0 25.99
King Mountain (I&II) TX 214 278 6075.0 21.84
31
Llano Estacado Wind Ranch at White Deer TX 80 80 2332.8 29.16 Lone Star Phase I (was Cross Timbers or Mesquite) TX 200 400 8100.0 20.25
Lone Star Phase II (Post Oak) TX 100 200 15460.9 77.30
Peñascal Wind Farm TX 87 202 6075.0 30.07 121.5
Red Canyon Wind Energy TX 56 84 3847.5 45.80
Roscoe Wind Farm TX 627 782 28350.0 36.28 Sherbino I Wind Farm TX 50 150 4050.0 27.00
Silver Star I Wind Farm TX 24 60 3057.8 50.96
Stanton Wind Farm TX 80 120 6885.0 57.38
Sweetwater Phase IV (Mitsubishi portion) TX 135 135 4860.0 36.00
Sweetwater Phase IV (Siemens portion) TX 46 106 4860.0 45.94
Trent Mesa TX 100 150 3628.8 24.19
Wildorado Wind Ranch TX 70 161 6480.0 40.25
Woodward Mountain I & II TX 242 160 3785.1 23.66
Bull Creek Wind Farm TX 180 180 24300.0 135.00
Panther Creek Wind Farm TX 111 167 9315.0 55.95
Wolf Ridge Wind Farm TX 75 113 4131.0 36.72
Ocotillo TX 28 59 1012.5 17.22
Gulf Winds Project TX 118 283 3179.7 11.23
Milford Wind Corridor Project Phase I UT 159 300 10368.0 34.56 124.7 594.5
Big Horn WA 133 200 8541.5 42.81 34.0 95.6
Desert Claim WA 120 180 2121.0 11.78 33.4 141.1
Goodnoe Hills WA 47 94 1741.5 18.53 28.4

32
Hopkins Ridge Wind Project WA 83 150 4455.0 29.70 66.8 87.9
Kittitas Valley Wind Power Project WA 121 182 2835.0 15.62 37.7 126.0
Maiden Wind Farm WA 330 494 5265.0 10.66 101.7 430.5
Marengo Phase I WA 78 140 5390.6 38.39 Nine Canyon I and II WA 49 64 2073.6 32.55 19.8
Stateline 1&2 Combined WA 454 300 65.6 89.1
White Creek Wind I WA 89 205 3847.5 18.77 25.9 34.8 Wild Horse Wind Power Project WA 136 204 3483.0 17.07 66.7 Windy Point Phase I WA 97 250 6031.7 24.13 62.4 126.4
Marengo Phase II WA 39 70 1741.5 24.81
Blue Sky Green Field WI 88 203 4293.0 21.20 28.4 100.0
Cedar Ridge Wind Farm WI 41 68 3175.2 46.94 34.4 164.0 Forward Wind Energy Center WI 133 200 13122.0 65.61 28.4 65.6
Beech Ridge Wind Farm WV 124 186 810.0 4.35 121.5
Mountaineer Wind II WV 44 66 1782.0 27.00 79.4 298.1
Mt. Storm Phase I WV 200 300 3240.0 10.80 97.2
Foote Creek 1 WY 69 41 846.5 20.45 10.8
Glenrock Wind Energy Project WY 66 99 5670.0 57.27
Seven Mile Hill/Campbell Hill Wind Project WY 66 99 4050.0 40.91

33
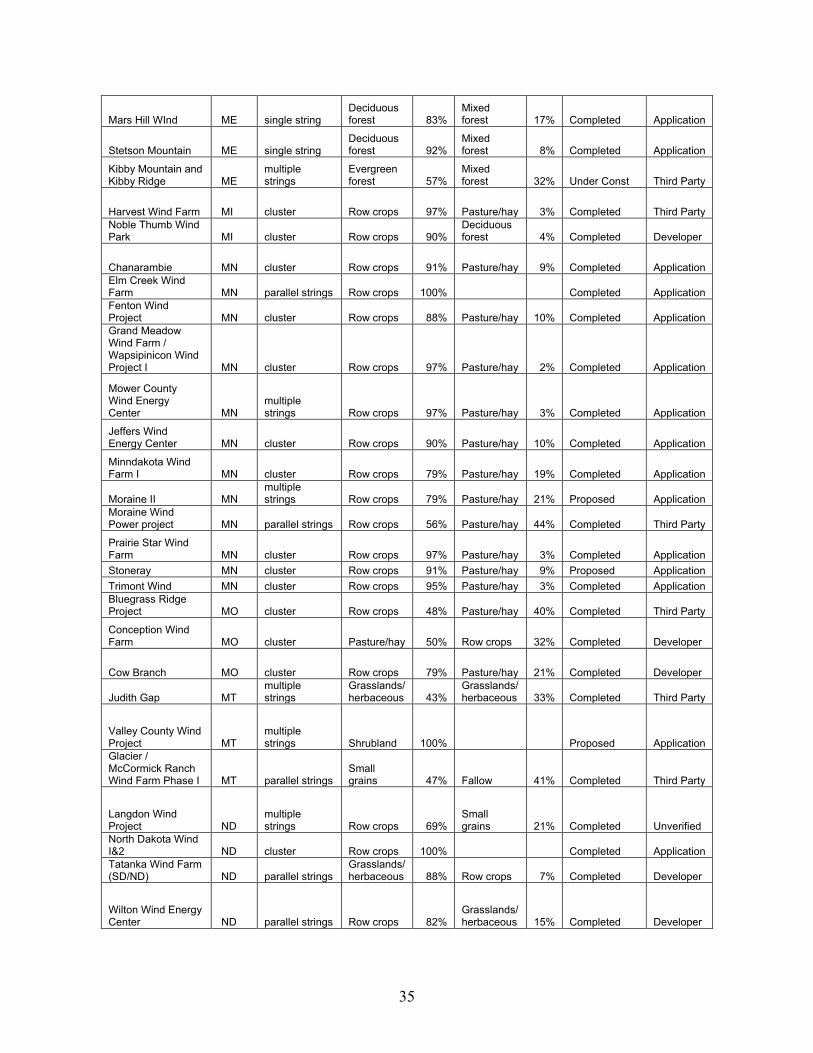
Table A2. Configuration, Land Cover, Status, and Data Source
Name State Configuration Primary Land Type % Secondary
Land Type % Development Status
Source Type
Steel Park Wind Farm AZ parallel strings Shrubland 73%
Evergreen forest 20% Proposed Developer
Dry Lake Wind Project I AZ parallel strings Shrubland 88%
Grasslands/herbaceous 8% Under Const Third Party
Bear River Wind Power Project CA single string
Grasslands/herbaceous 100% Proposed Application
Hatchet Ridge Wind Project CA single string
Evergreen forest 92% Shrubland 8% Proposed Application
High Winds I & II CA multiple strings Shrubland 55%
Grasslands/herbaceous 45% Completed Developer
Mountain View IV CA parallel strings Shrubland 100% Proposed Application Pine Tree Wind Project aka Wind Turbine Prometheus CA
multiple strings
Grasslands/herbaceous 69% Shrubland 28% Under Const Application
Shiloh I CA multiple strings
Grasslands/herbaceous 64% Pasture/hay 36% Completed Developer
Shiloh II CA multiple strings Pasture/hay 51%
Grasslands/herbaceous 49% Completed Application
Solano Wind Project, Phase IIB CA
multiple strings Pasture/hay 98%
Grasslands/herbaceous 2% Completed Application
Cedar Creek Wind Farm CO parallel strings
Grasslands/herbaceous 76% Fallow 12% Completed Developer
Cedar Point Wind Project CO parallel strings
Grasslands/herbaceous 44%
Small grains 29% Under Const Developer
Colorado Green Wind Project CO parallel strings
Grasslands/herbaceous 92%
Small grains 8% Completed Developer
Spring Canyon CO single string Grasslands/herbaceous 78% Fallow 20% Completed Application
Twin Buttes Wind Power Project CO parallel strings
Grasslands/herbaceous 98%
Small grains 2% Completed Developer
Buffalo Creek Wind Farm IA parallel strings Row crops 88%
Grasslands/herbaceous 10% Proposed Third Party
Crystal Lake IA parallel strings Row crops 93% Pasture/hay 7% Completed Application
Endeavor IA multiple strings Row crops 86% Pasture/hay 9% Completed Developer
Floyd County Wind Farm Phase I IA parallel strings Row crops 98%
Grasslands/herbaceous 2% Completed Third Party
Hancock County Wind Farm IA cluster Row crops 91%
Grasslands/herbaceous 3% Completed Developer
Intrepid IA multiple strings Row crops 92% Pasture/hay 6% Completed Developer
Pioneer Prairie Wind Farm Phase I IA parallel strings Row crops 94%
Grasslands/herbaceous 2% Completed Third Party
Pomeroy Wind Project Phase I IA cluster Row crops 94%
Grasslands/herbaceous 2% Completed Developer

34
Story County IA parallel strings Row crops 97% Grasslands/herbaceous 3% Completed Application
Top of Iowa Wind Farm IA parallel strings Row crops 85%
Grasslands/herbaceous 11% Completed Application
Whispering Willow Wind Farm (formerly Franklin County Wind Farm) IA cluster Row crops 95% Pasture/hay 2% Under Const Developer
Cotteral Mountain ID single string Shrubland 100% Proposed Application Wolverine Creek ID cluster Pasture/hay 44% Shrubland 33% Completed Developer
Camp Grove Wind Farm IL cluster Row crops 99% Pasture/hay 1% Completed Developer Crescent Ridge Phase I IL cluster Row crops 91% Pasture/hay 9% Completed Third Party Grand Ridge Wind Energy Center IL cluster Row crops 91% Pasture/hay 9% Completed Third Party
Mendota Hills IL cluster Row crops 89% Pasture/hay 10% Completed Third Party
Providence Heights IL cluster Row crops 98% Deciduous forest 2% Completed Developer
Twin Groves/Arrowsmith IL cluster Row crops 100% Completed Developer
Rail Splitter Wind Farm IL cluster Row crops 88% Pasture/hay 8% Under Const Third Party EcoGrove I IL parallel strings Row crops 83% Pasture/hay 15% Under Const Third Party Fowler Ridge Wind Farm Phase I IN cluster Row crops 95% Pasture/hay 4% Completed Developer Orion Energy wind farm / Benton Wind Farm IN cluster Row crops 79% Pasture/hay 15% Completed Developer
Meadow Lake Wind Farm IN parallel strings Row crops 82% Pasture/hay 17% Under Const Developer
Central Plains Wind Farm KS parallel strings
Small grains 48%
Grasslands/herbaceous 33% Completed Developer
Elk River KS parallel strings Grasslands/herbaceous 79% Pasture/hay 14% Completed Developer
Flat Ridge Wind Farm KS parallel strings
Small grains 52%
Grasslands/herbaceous 32% Completed Developer
Gray County Wind Farm KS parallel strings
Small grains 64%
Grasslands/herbaceous 30% Completed Developer
Meridian Way Wind Farm KS cluster
Grasslands/herbaceous 71%
Small grains 15% Completed Third Party
Smoky Hills Wind Farm Phase I KS cluster
Grasslands/herbaceous 88% Pasture/hay 5% Completed Developer
Spearville KS parallel strings Small grains 60%
Grasslands/herbaceous 28% Completed Third Party
Smoky Hills Wind Farm Phase II KS
multiple strings
grasslands/herbaceous 81% Pasture/hay 7% Completed Developer
Allegheny Heights MD single string Deciduous forest 100% Proposed Application
35
Mars Hill WInd ME single string Deciduous forest 83%
Mixed forest 17% Completed Application
Stetson Mountain ME single string Deciduous forest 92%
Mixed forest 8% Completed Application
Kibby Mountain and Kibby Ridge ME
multiple strings
Evergreen forest 57%
Mixed forest 32% Under Const Third Party
Harvest Wind Farm MI cluster Row crops 97% Pasture/hay 3% Completed Third Party Noble Thumb Wind Park MI cluster Row crops 90%
Deciduous forest 4% Completed Developer
Chanarambie MN cluster Row crops 91% Pasture/hay 9% Completed Application Elm Creek Wind Farm MN parallel strings Row crops 100% Completed Application Fenton Wind Project MN cluster Row crops 88% Pasture/hay 10% Completed Application Grand Meadow Wind Farm / Wapsipinicon Wind Project I MN cluster Row crops 97% Pasture/hay 2% Completed Application
Mower County Wind Energy Center MN
multiple strings Row crops 97% Pasture/hay 3% Completed Application
Jeffers Wind Energy Center MN cluster Row crops 90% Pasture/hay 10% Completed Application
Minndakota Wind Farm I MN cluster Row crops 79% Pasture/hay 19% Completed Application
Moraine II MN multiple strings Row crops 79% Pasture/hay 21% Proposed Application
Moraine Wind Power project MN parallel strings Row crops 56% Pasture/hay 44% Completed Third Party
Prairie Star Wind Farm MN cluster Row crops 97% Pasture/hay 3% Completed Application Stoneray MN cluster Row crops 91% Pasture/hay 9% Proposed Application Trimont Wind MN cluster Row crops 95% Pasture/hay 3% Completed Application Bluegrass Ridge Project MO cluster Row crops 48% Pasture/hay 40% Completed Third Party
Conception Wind Farm MO cluster Pasture/hay 50% Row crops 32% Completed Developer
Cow Branch MO cluster Row crops 79% Pasture/hay 21% Completed Developer
Judith Gap MT multiple strings
Grasslands/herbaceous 43%
Grasslands/herbaceous 33% Completed Third Party
Valley County Wind Project MT
multiple strings Shrubland 100% Proposed Application
Glacier / McCormick Ranch Wind Farm Phase I MT parallel strings
Small grains 47% Fallow 41% Completed Third Party
Langdon Wind Project ND
multiple strings Row crops 69%
Small grains 21% Completed Unverified
North Dakota Wind I&2 ND cluster Row crops 100% Completed Application Tatanka Wind Farm (SD/ND) ND parallel strings
Grasslands/herbaceous 88% Row crops 7% Completed Developer
Wilton Wind Energy Center ND parallel strings Row crops 82%
Grasslands/herbaceous 15% Completed Developer
36
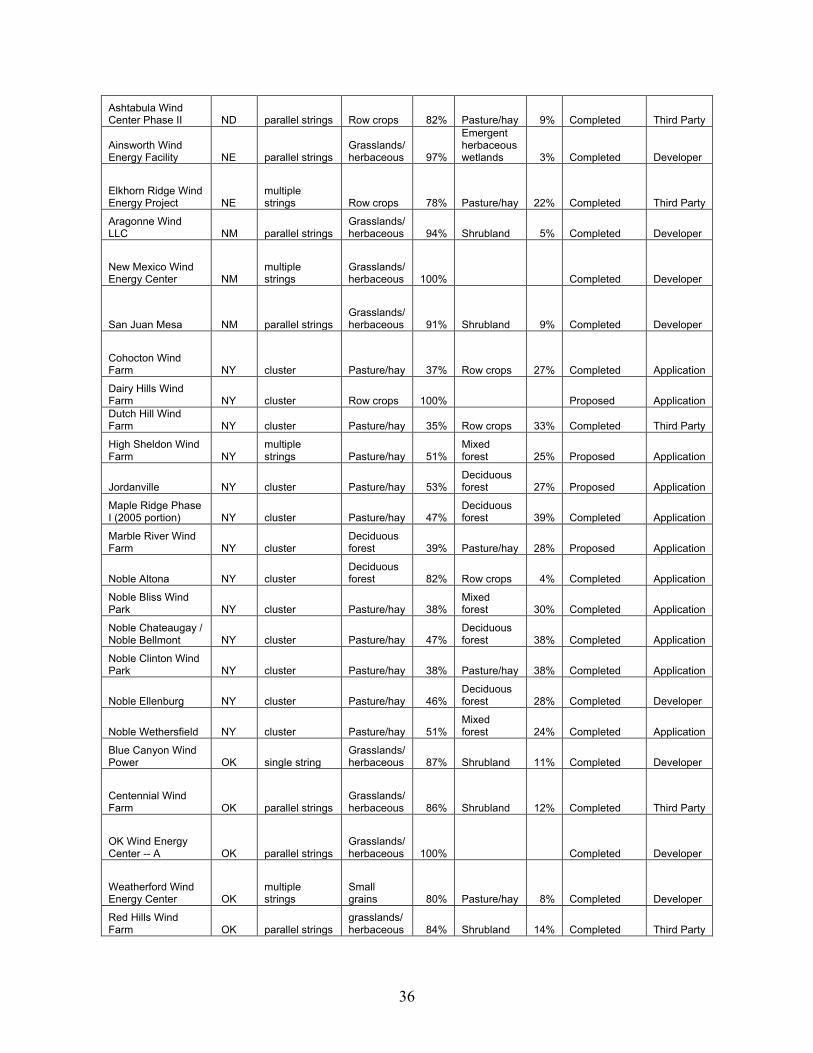
Ashtabula Wind Center Phase II ND parallel strings Row crops 82% Pasture/hay 9% Completed Third Party
Ainsworth Wind Energy Facility NE parallel strings
Grasslands/herbaceous 97%
Emergent herbaceous wetlands 3% Completed Developer
Elkhorn Ridge Wind Energy Project NE
multiple strings Row crops 78% Pasture/hay 22% Completed Third Party
Aragonne Wind LLC NM parallel strings
Grasslands/herbaceous 94% Shrubland 5% Completed Developer
New Mexico Wind Energy Center NM
multiple strings
Grasslands/herbaceous 100% Completed Developer
San Juan Mesa NM parallel strings Grasslands/herbaceous 91% Shrubland 9% Completed Developer
Cohocton Wind Farm NY cluster Pasture/hay 37% Row crops 27% Completed Application
Dairy Hills Wind Farm NY cluster Row crops 100% Proposed Application Dutch Hill Wind Farm NY cluster Pasture/hay 35% Row crops 33% Completed Third Party
High Sheldon Wind Farm NY
multiple strings Pasture/hay 51%
Mixed forest 25% Proposed Application
Jordanville NY cluster Pasture/hay 53% Deciduous forest 27% Proposed Application
Maple Ridge Phase I (2005 portion) NY cluster Pasture/hay 47%
Deciduous forest 39% Completed Application
Marble River Wind Farm NY cluster
Deciduous forest 39% Pasture/hay 28% Proposed Application
Noble Altona NY cluster Deciduous forest 82% Row crops 4% Completed Application
Noble Bliss Wind Park NY cluster Pasture/hay 38%
Mixed forest 30% Completed Application
Noble Chateaugay / Noble Bellmont NY cluster Pasture/hay 47%
Deciduous forest 38% Completed Application
Noble Clinton Wind Park NY cluster Pasture/hay 38% Pasture/hay 38% Completed Application
Noble Ellenburg NY cluster Pasture/hay 46% Deciduous forest 28% Completed Developer
Noble Wethersfield NY cluster Pasture/hay 51% Mixed forest 24% Completed Application
Blue Canyon Wind Power OK single string
Grasslands/herbaceous 87% Shrubland 11% Completed Developer
Centennial Wind Farm OK parallel strings
Grasslands/herbaceous 86% Shrubland 12% Completed Third Party
OK Wind Energy Center -- A OK parallel strings
Grasslands/herbaceous 100% Completed Developer
Weatherford Wind Energy Center OK
multiple strings
Small grains 80% Pasture/hay 8% Completed Developer
Red Hills Wind Farm OK parallel strings
grasslands/herbaceous 84% Shrubland 14% Completed Third Party

37
Arlington Wind Farm Phase I OR
multiple strings Shrubland 51%
Grasslands/herbaceous 28% Completed Application
Biglow Canyon Phase I OR
multiple strings
Small grains 52% Fallow 40% Completed Application
Cascade Wind Project OR
multiple strings
Deciduous forest 100% Proposed Application
Combine Hills 1 OR multiple strings Shrubland 100% Completed Third Party
Condon Wind Project OR
multiple strings
Small grains 55% Shrubland 27% Completed Application
Elkhorn Wind Power Project OR parallel strings Shrubland 95%
Grasslands/herbaceous 5% Completed Developer
Klondike II OR parallel strings Small grains 65% Fallow 35% Completed Developer
Klondike III OR parallel strings Small grains 49%
Small grains 39% Completed Application
Leaning Juniper (Arlington) OR parallel strings Shrubland 44% Fallow 27% Completed Application
Shepherd's Flat OR multiple strings Shrubland 54%
Grasslands/herbaceous 31% Proposed Application
Stateline 3 OR parallel strings Shrubland 66% Fallow 16% Completed Application
Hay Canyon OR multiple strings
Small grains 33% Fallow 33% Completed Application
Allegheny Ridge Wind Farm I PA cluster
Deciduous forest 83%
Mixed forest 18% Completed Developer
Allegheny Ridge Wind Farm II PA
multiple strings
Deciduous forest 54%
Mixed forest 40% Proposed Developer
Waymart Wind Farm PA single string
Deciduous forest 88%
Mixed forest 12% Completed Third Party
MinnDakota Wind Farm II SD cluster Row crops 81% Pasture/hay 19% Completed Developer
South Dakota Wind Energy Center SD
multiple strings
Grasslands/herbaceous 70%
Small grains 11% Completed Developer
Wessington Springs SD parallel strings Grasslands/herbaceous 63% Pasture/hay 31% Under Const Developer
White Wind Farm SD cluster Row crops 52% Pasture/hay 48% Proposed Application Buffalo Ridge Wind Farm (SD) SD parallel strings Row crops 67% Pasture/hay 31% Under Const Application
Brazos Wind Ranch TX parallel strings Row crops 42% Grasslands/herbaceous 38% Completed Developer
Callahan Divide TX multiple strings
Evergreen forest 38% Shrubland 30% Completed Developer
Champion Wind Farm TX parallel strings Row crops 78% Shrubland 7% Completed Developer
Desert Sky TX multiple strings Shrubland 89%
Grasslands/herbaceous 11% Completed Third Party
Elbow Creek Wind Project TX cluster Shrubland 81%
Grasslands/herbaceous 17% Completed Developer
Forest Creek Wind Project TX parallel strings Shrubland 89%
Grasslands/herbaceous 11% Completed Third Party
Goat Mountain Wind Ranch TX parallel strings Shrubland 100% Completed Third Party
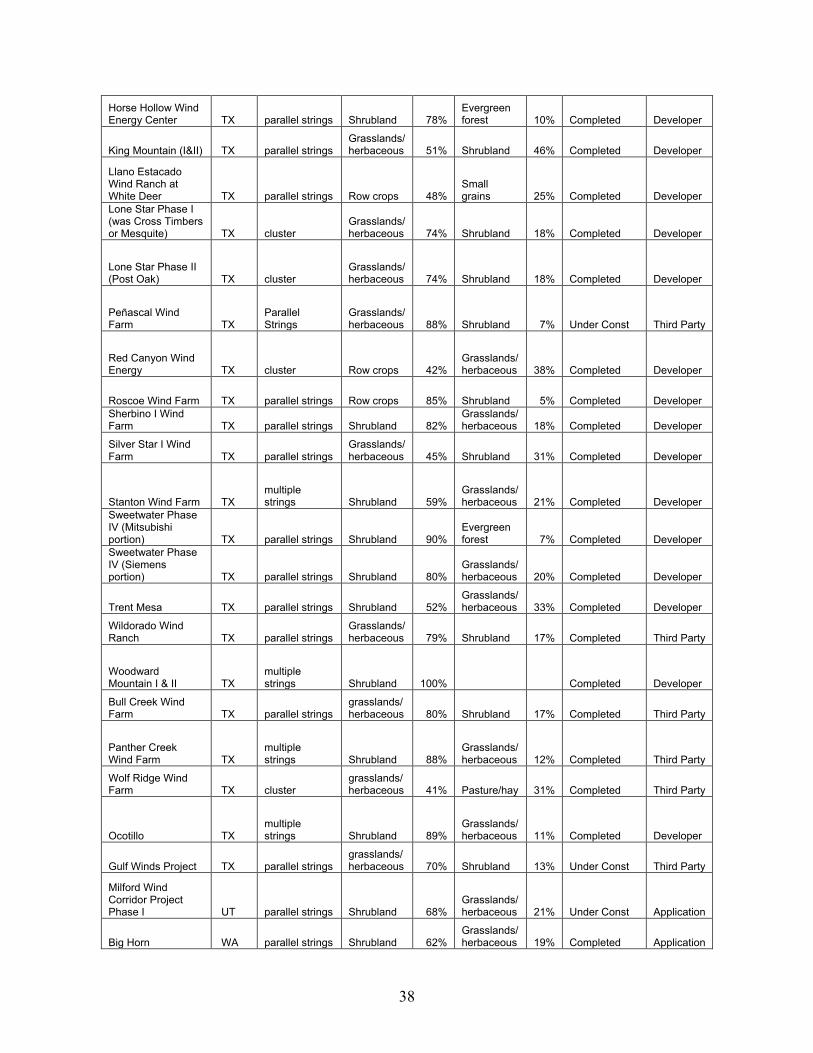
38
Horse Hollow Wind Energy Center TX parallel strings Shrubland 78%
Evergreen forest 10% Completed Developer
King Mountain (I&II) TX parallel strings Grasslands/herbaceous 51% Shrubland 46% Completed Developer
Llano Estacado Wind Ranch at White Deer TX parallel strings Row crops 48%
Small grains 25% Completed Developer
Lone Star Phase I (was Cross Timbers or Mesquite) TX cluster
Grasslands/herbaceous 74% Shrubland 18% Completed Developer
Lone Star Phase II (Post Oak) TX cluster
Grasslands/herbaceous 74% Shrubland 18% Completed Developer
Peñascal Wind Farm TX
Parallel Strings
Grasslands/herbaceous 88% Shrubland 7% Under Const Third Party
Red Canyon Wind Energy TX cluster Row crops 42%
Grasslands/herbaceous 38% Completed Developer
Roscoe Wind Farm TX parallel strings Row crops 85% Shrubland 5% Completed Developer Sherbino I Wind Farm TX parallel strings Shrubland 82%
Grasslands/herbaceous 18% Completed Developer
Silver Star I Wind Farm TX parallel strings
Grasslands/herbaceous 45% Shrubland 31% Completed Developer
Stanton Wind Farm TX multiple strings Shrubland 59%
Grasslands/herbaceous 21% Completed Developer
Sweetwater Phase IV (Mitsubishi portion) TX parallel strings Shrubland 90%
Evergreen forest 7% Completed Developer
Sweetwater Phase IV (Siemens portion) TX parallel strings Shrubland 80%
Grasslands/herbaceous 20% Completed Developer
Trent Mesa TX parallel strings Shrubland 52% Grasslands/herbaceous 33% Completed Developer
Wildorado Wind Ranch TX parallel strings
Grasslands/herbaceous 79% Shrubland 17% Completed Third Party
Woodward Mountain I & II TX
multiple strings Shrubland 100% Completed Developer
Bull Creek Wind Farm TX parallel strings
grasslands/herbaceous 80% Shrubland 17% Completed Third Party
Panther Creek Wind Farm TX
multiple strings Shrubland 88%
Grasslands/herbaceous 12% Completed Third Party
Wolf Ridge Wind Farm TX cluster
grasslands/herbaceous 41% Pasture/hay 31% Completed Third Party
Ocotillo TX multiple strings Shrubland 89%
Grasslands/herbaceous 11% Completed Developer
Gulf Winds Project TX parallel strings grasslands/herbaceous 70% Shrubland 13% Under Const Third Party
Milford Wind Corridor Project Phase I UT parallel strings Shrubland 68%
Grasslands/herbaceous 21% Under Const Application
Big Horn WA parallel strings Shrubland 62% Grasslands/herbaceous 19% Completed Application
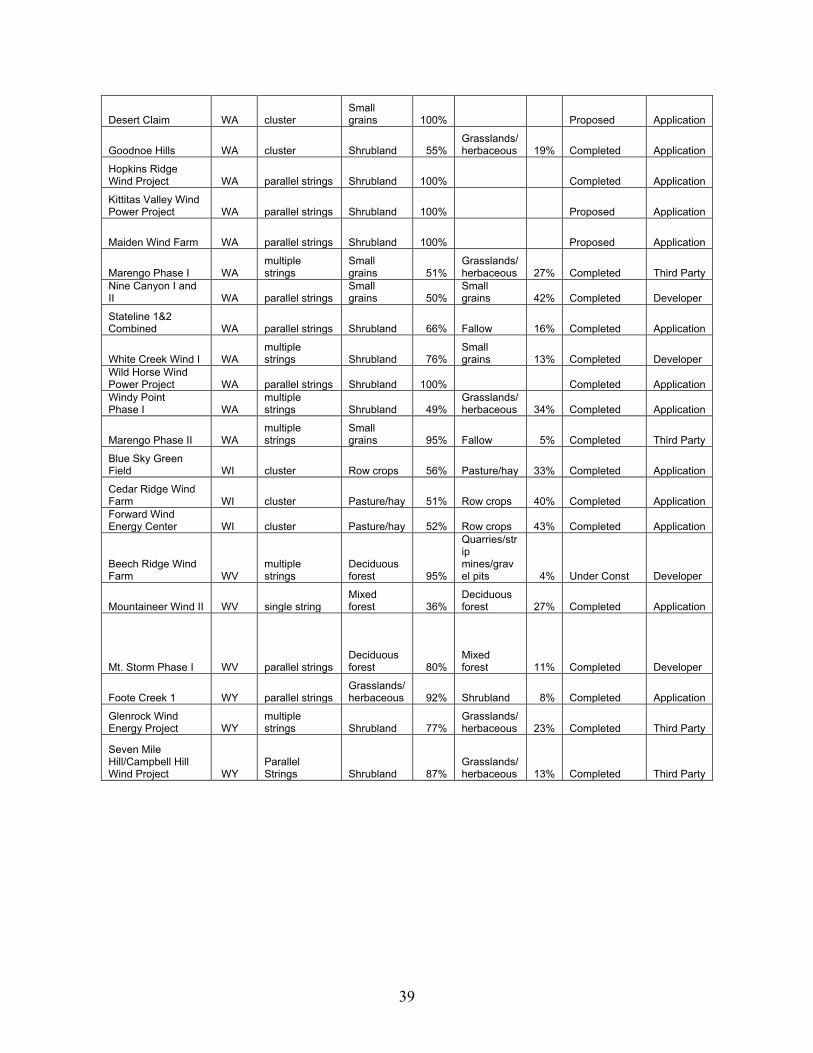
39
Desert Claim WA cluster Small grains 100% Proposed Application
Goodnoe Hills WA cluster Shrubland 55% Grasslands/herbaceous 19% Completed Application
Hopkins Ridge Wind Project WA parallel strings Shrubland 100% Completed Application
Kittitas Valley Wind Power Project WA parallel strings Shrubland 100% Proposed Application
Maiden Wind Farm WA parallel strings Shrubland 100% Proposed Application
Marengo Phase I WA multiple strings
Small grains 51%
Grasslands/herbaceous 27% Completed Third Party
Nine Canyon I and II WA parallel strings
Small grains 50%
Small grains 42% Completed Developer
Stateline 1&2 Combined WA parallel strings Shrubland 66% Fallow 16% Completed Application
White Creek Wind I WA multiple strings Shrubland 76%
Small grains 13% Completed Developer
Wild Horse Wind Power Project WA parallel strings Shrubland 100% Completed Application Windy Point Phase I WA
multiple strings Shrubland 49%
Grasslands/herbaceous 34% Completed Application
Marengo Phase II WA multiple strings
Small grains 95% Fallow 5% Completed Third Party
Blue Sky Green Field WI cluster Row crops 56% Pasture/hay 33% Completed Application
Cedar Ridge Wind Farm WI cluster Pasture/hay 51% Row crops 40% Completed Application Forward Wind Energy Center WI cluster Pasture/hay 52% Row crops 43% Completed Application
Beech Ridge Wind Farm WV
multiple strings
Deciduous forest 95%
Quarries/strip mines/gravel pits 4% Under Const Developer
Mountaineer Wind II WV single string Mixed forest 36%
Deciduous forest 27% Completed Application
Mt. Storm Phase I WV parallel strings Deciduous forest 80%
Mixed forest 11% Completed Developer
Foote Creek 1 WY parallel strings Grasslands/herbaceous 92% Shrubland 8% Completed Application
Glenrock Wind Energy Project WY
multiple strings Shrubland 77%
Grasslands/herbaceous 23% Completed Third Party
Seven Mile Hill/Campbell Hill Wind Project WY
Parallel Strings Shrubland 87%
Grasslands/herbaceous 13% Completed Third Party

F1147-E(10/2008)
REPORT DOCUMENTATION PAGE Form Approved OMB No. 0704-0188
The public reporting burden for this collection of information is estimated to average 1 hour per response, including the time for reviewing instructions, searching existing data sources, gathering and maintaining the data needed, and completing and reviewing the collection of information. Send comments regarding this burden estimate or any other aspect of this collection of information, including suggestions for reducing the burden, to Department of Defense, Executive Services and Communications Directorate (0704-0188). Respondents should be aware that notwithstanding any other provision of law, no person shall be subject to any penalty for failing to comply with a collection of information if it does not display a currently valid OMB control number. PLEASE DO NOT RETURN YOUR FORM TO THE ABOVE ORGANIZATION. 1. REPORT DATE (DD-MM-YYYY)
August 2009 2. REPORT TYPE
Technical Report 3. DATES COVERED (From - To)
4. TITLE AND SUBTITLE
Land-Use Requirements of Modern Wind Power Plants in the United States
5a. CONTRACT NUMBER DE-AC36-08-GO28308
5b. GRANT NUMBER
5c. PROGRAM ELEMENT NUMBER
6. AUTHOR(S) P. Denholm; M. Hand; M. Jackson; and S. Ong
5d. PROJECT NUMBER NREL/TP-6A2-45834
5e. TASK NUMBER WER9.3550
5f. WORK UNIT NUMBER
7. PERFORMING ORGANIZATION NAME(S) AND ADDRESS(ES) National Renewable Energy Laboratory 1617 Cole Blvd. Golden, CO 80401-3393
8. PERFORMING ORGANIZATION REPORT NUMBER NREL/TP-6A2-45834
9. SPONSORING/MONITORING AGENCY NAME(S) AND ADDRESS(ES)
10. SPONSOR/MONITOR'S ACRONYM(S) NREL
11. SPONSORING/MONITORING AGENCY REPORT NUMBER
12. DISTRIBUTION AVAILABILITY STATEMENT National Technical Information Service U.S. Department of Commerce 5285 Port Royal Road Springfield, VA 22161
13. SUPPLEMENTARY NOTES
14. ABSTRACT (Maximum 200 Words) This report provides data and analysis of the land use associated with modern, large wind power plants (defined as greater than 20 megawatts (MW) and constructed after 2000). The analysis discusses standard land-use metrics as established in the life-cycle assessment literature, and then discusses their applicability to wind power plants. The report identifies two major “classes” of wind plant land use: 1) direct impact (i.e., disturbed land due to physical infrastructure development), and 2) total area (i.e., land associated with the complete wind plant project). The analysis also provides data for each of these classes, derived from project applications, environmental impact statements, and other sources. It attempts to identify relationships among land use, wind plant configuration, and geography. The analysts evaluated 172 existing or proposed projects, which represents more than 26 GW of capacity. In addition to providing land-use data and summary statistics, they identify several limitations to the existing wind project area data sets, and suggest additional analysis that could aid in evaluating actual land use and impacts associated with deployment of wind energy. 15. SUBJECT TERMS
NREL; life-cycle assessment; wind power; wind energy; wind power plants; land use; wind capacity; wind project; United States; land impact; Paul Denhom; Maureen Hand; Maddalena Jackson; Sean Ong
16. SECURITY CLASSIFICATION OF: 17. LIMITATION OF ABSTRACT
UL
18. NUMBER OF PAGES
19a. NAME OF RESPONSIBLE PERSON a. REPORT
Unclassified b. ABSTRACT Unclassified
c. THIS PAGE Unclassified 19b. TELEPHONE NUMBER (Include area code)
Standard Form 298 (Rev. 8/98) Prescribed by ANSI Std. Z39.18