Land Use Planning in Metro Manila and the Urban Fringe ...
54
For comments, suggestions or further inquiries please contact: Philippine Institute for Development Studies The PIDS Discussion Paper Series constitutes studies that are preliminary and subject to further revisions. They are be- ing circulated in a limited number of cop- ies only for purposes of soliciting com- ments and suggestions for further refine- ments. The studies under the Series are unedited and unreviewed. The views and opinions expressed are those of the author(s) and do not neces- sarily reflect those of the Institute. Not for quotation without permission from the author(s) and the Institute. DISCUSSION PAPER SERIES NO. 2000-20 June 2000 Marife Magno-Ballesteros Land Use Planning in Metro Manila and the Urban Fringe: Implications on the Land and Real Estate Market The Research Information Staff, Philippine Institute for Development Studies 3rd Floor, NEDA sa Makati Building, 106 Amorsolo Street, Legaspi Village, Makati City, Philippines Tel Nos: 8924059 and 8935705; Fax No: 8939589; E-mail: [email protected] Or visit our website at http://www.pids.gov.ph
Transcript of Land Use Planning in Metro Manila and the Urban Fringe ...

For comments, suggestions or further inquiries please contact:
Philippine Institute for Development Studies
The PIDS Discussion Paper Seriesconstitutes studies that are preliminary andsubject to further revisions. They are be-ing circulated in a limited number of cop-ies only for purposes of soliciting com-ments and suggestions for further refine-ments. The studies under the Series areunedited and unreviewed.
The views and opinions expressedare those of the author(s) and do not neces-sarily reflect those of the Institute.
Not for quotation without permissionfrom the author(s) and the Institute.
DISCUSSION PAPER SERIES NO. 2000-20
June 2000
Marife Magno-Ballesteros
Land Use Planning in Metro Manilaand the Urban Fringe: Implicationson the Land and Real Estate Market
The Research Information Staff, Philippine Institute for Development Studies3rd Floor, NEDA sa Makati Building, 106 Amorsolo Street, Legaspi Village, Makati City, PhilippinesTel Nos: 8924059 and 8935705; Fax No: 8939589; E-mail: [email protected]
Or visit our website at http://www.pids.gov.ph

TABLE of CONTENTS Page 1. Introduction 1 2. The Urban Landscape: Metro Manila and its 2
Peripheral Areas The Physical Environment 2 Pattern of Urban Settlement 4 Pattern of Land Ownership 9 3. The Institutional Environment:
Urban Management and Land Use Planning 11 The Historical Precedents 11 Government Efforts Toward Comprehensive 14 Urban Planning The Development Control Process: 17 Centralization vs. Decentralization
4. Institutional Arrangements: 28
Procedural Short-cuts and Relational Contracting Sources of Transaction Costs in the Urban 28 Real Estate Market Grease/Speed Money 33 Procedural Short-cuts 36
5. Transaction Costs and Urban Real Estate Prices 39 6. Conclusions and Policy Recommendations 44 References 48
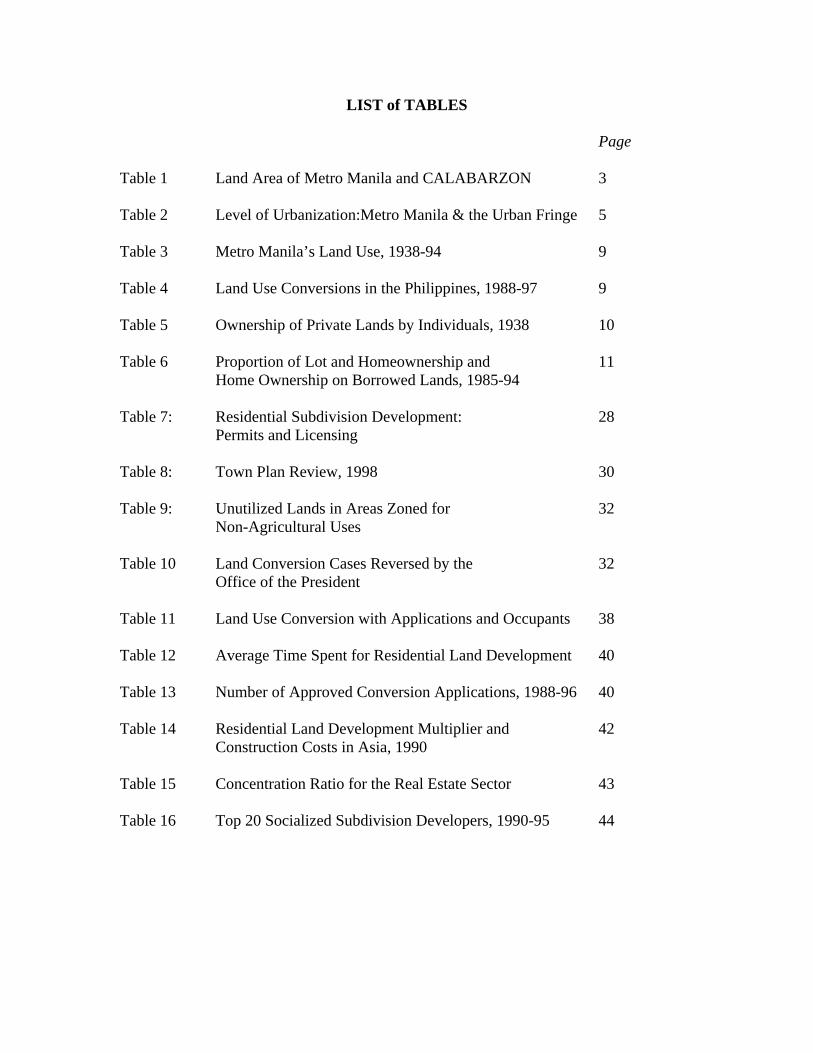
LIST of TABLES Page Table 1 Land Area of Metro Manila and CALABARZON 3 Table 2 Level of Urbanization:Metro Manila & the Urban Fringe 5 Table 3 Metro Manila’s Land Use, 1938-94 9 Table 4 Land Use Conversions in the Philippines, 1988-97 9 Table 5 Ownership of Private Lands by Individuals, 1938 10 Table 6 Proportion of Lot and Homeownership and 11 Home Ownership on Borrowed Lands, 1985-94 Table 7: Residential Subdivision Development: 28
Permits and Licensing Table 8: Town Plan Review, 1998 30 Table 9: Unutilized Lands in Areas Zoned for 32 Non-Agricultural Uses Table 10 Land Conversion Cases Reversed by the 32 Office of the President Table 11 Land Use Conversion with Applications and Occupants 38 Table 12 Average Time Spent for Residential Land Development 40 Table 13 Number of Approved Conversion Applications, 1988-96 40 Table 14 Residential Land Development Multiplier and 42 Construction Costs in Asia, 1990 Table 15 Concentration Ratio for the Real Estate Sector 43 Table 16 Top 20 Socialized Subdivision Developers, 1990-95 44
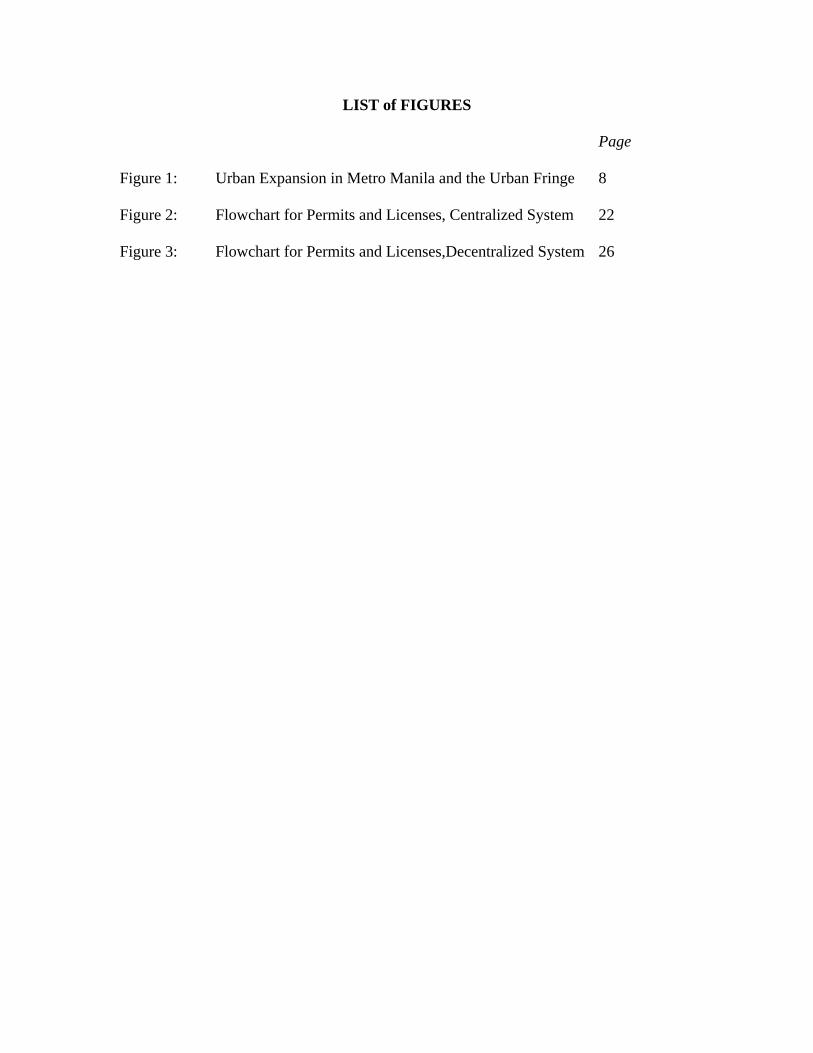
LIST of FIGURES Page Figure 1: Urban Expansion in Metro Manila and the Urban Fringe 8 Figure 2: Flowchart for Permits and Licenses, Centralized System 22 Figure 3: Flowchart for Permits and Licenses,Decentralized System 26

Abstract This paper examines land use planning in Metro Manila and the urban fringe and analyzes its effect on transactions in the urban land and real estate market. The analysis begins with a historical review of land use planning strategies in the metropolitan area and the attendant bureaucratic changes that occurred. The effects of these planning strategies on the urban land and real estate market are then analyzed using the transaction cost framework of the new institutional economics (NIE). It is argued that transaction costs in the land and real estate market in the Philippines has been significant due to the confusion brought about by unclear land use policies of the government. These costs have been noted to increase as government shifted from an interventionist and centralized system to a liberal and decentralized system of land use planning. The system of permits and licensing has become more complicated and inefficient overtime. To economize on transaction costs, real estate development companies engage in a lot of contracting and sub-contracting in the market. Relational contracting in the forms of “grease” money and procedural short-cuts has been common to obtain development approvals. The high transaction costs are reflected in the prices of urban real estate. While Metro Manila has the lowest per unit costs of construction among neighboring cities in Asia, the high transaction costs make housing more expensive in the country than elsewhere in Asia. Contradicting policies on Philippine land use have to be corrected. Moreover, stronger and more direct government presence in the land and real estate market through land use planning and urban management seems necessary.
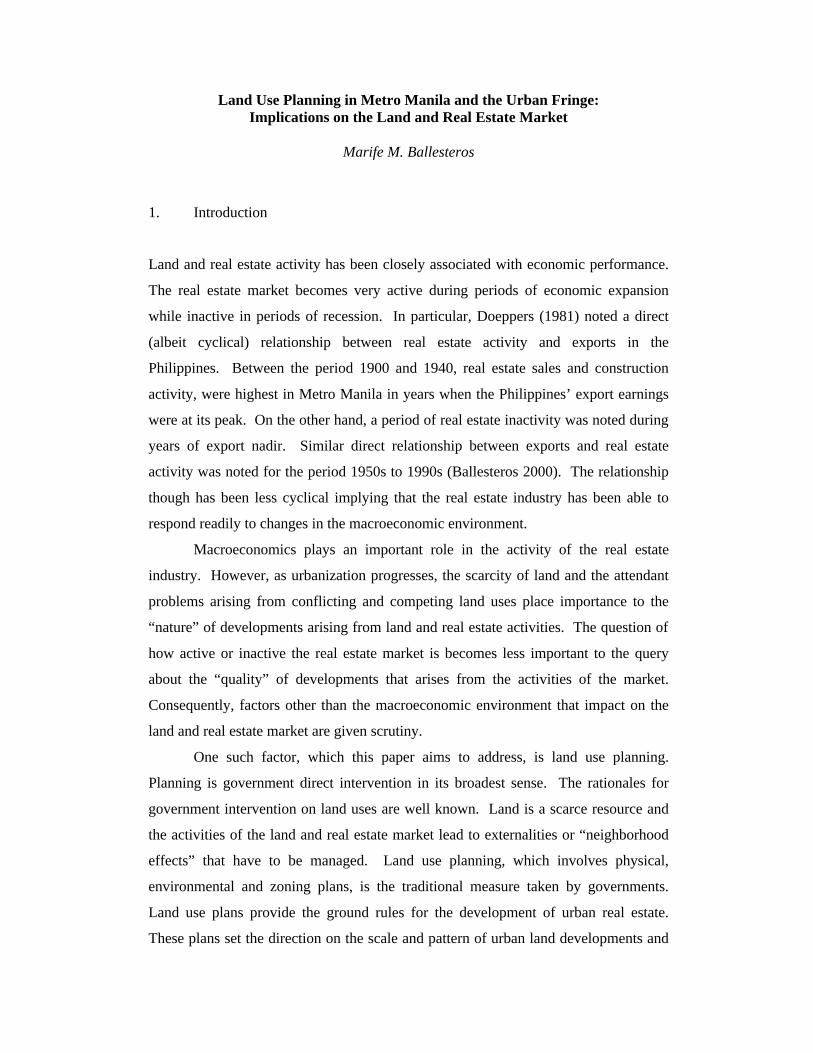
Land Use Planning in Metro Manila and the Urban Fringe: Implications on the Land and Real Estate Market
Marife M. Ballesteros
1. Introduction
Land and real estate activity has been closely associated with economic performance.
The real estate market becomes very active during periods of economic expansion
while inactive in periods of recession. In particular, Doeppers (1981) noted a direct
(albeit cyclical) relationship between real estate activity and exports in the
Philippines. Between the period 1900 and 1940, real estate sales and construction
activity, were highest in Metro Manila in years when the Philippines’ export earnings
were at its peak. On the other hand, a period of real estate inactivity was noted during
years of export nadir. Similar direct relationship between exports and real estate
activity was noted for the period 1950s to 1990s (Ballesteros 2000). The relationship
though has been less cyclical implying that the real estate industry has been able to
respond readily to changes in the macroeconomic environment.
Macroeconomics plays an important role in the activity of the real estate
industry. However, as urbanization progresses, the scarcity of land and the attendant
problems arising from conflicting and competing land uses place importance to the
“nature” of developments arising from land and real estate activities. The question of
how active or inactive the real estate market is becomes less important to the query
about the “quality” of developments that arises from the activities of the market.
Consequently, factors other than the macroeconomic environment that impact on the
land and real estate market are given scrutiny.
One such factor, which this paper aims to address, is land use planning.
Planning is government direct intervention in its broadest sense. The rationales for
government intervention on land uses are well known. Land is a scarce resource and
the activities of the land and real estate market lead to externalities or “neighborhood
effects” that have to be managed. Land use planning, which involves physical,
environmental and zoning plans, is the traditional measure taken by governments.
Land use plans provide the ground rules for the development of urban real estate.
These plans set the direction on the scale and pattern of urban land developments and

2
provide the means to manage problems and opportunities arising from conflicting and
complementary uses of land. The design, implementation and enforcement of these
plans are thus significant in the performance of the urban land and real estate market.
In comparison with other countries in the region, the urban land situation in
the Philippines is critical. We hear about the arbitrariness of zoning decisions, the
indiscriminate conversion of agricultural and agro-forest lands, substandard
developments, high cost of housing, etc. The list goes on, raising the question of
whether these problems result from an “inefficient” urban real estate market.
The objective of this paper is to examine the effect of land use planning in
Metro Manila and its periphery on the urban land and real estate market. The paper
starts with a discussion of the urban landscape of Metro Manila and its fringes. Here,
we define Metro Manila’s peripheries to consist of municipalities in the
CALABARZON region that lies on the southeastern part of the city.1 In the next
section, the land use planning strategies in Metro Manila and the urban fringes are
presented. The third section examines the institutional arrangements that resulted
from these planning activities, the role of transaction costs and the manifestations of
these institutions in the urban land and real estate market. The fourth section provides
some measures of transaction cost and its impact on the urban land and real estate
market. The last section presents the conclusions and policy recommendations of the
study.
2. The Urban Landscape: Metro Manila and its Peripheral Areas
The Physical Environment
Metro Manila resulted from an integration of 17 previously distinct municipalities.
The contiguous location of these municipalities made it a natural consequence for
them to simply grow together as the City of Manila became highly urbanized. The
consolidation into a metropolitan region started in the 1940s with the chartering of the
municipalities of Quezon and Pasay and their inclusion in the urbanized zone.2 In
1 The CALABARZON region consists of the provinces of Cavite, Laguna, Batangas, Rizal and Quezon. The region is not a political subdivision but an identification of the area as an agro-industrial growth zone in the country. 2 The act of chartering a city removes it from the control of the provincial government and places the city under presidential administration.

3
1963, Caloocan also became a chartered city and was included in the metro region.
No further political reconstitution of the metro region took place until 1975 when the
remaining municipalities adjacent to Manila and the three chartered cities were
integrated to form a larger metropolitan region, which is now known as Metro Manila.
Metro Manila has a total area of 63,600 hectares comprising about 0.2 percent
of the total Philippine land area (Table 1). This area includes the reclaimed sites at
Manila Bay, which covers an area of 3,100 hectares. The largest town is Quezon City
with an area of 17,171 hectares while the smallest town, San Juan has an area of 595
hectares.
The northern part of the Metro Manila opens to the province of Bulacan while
the southern part is linked to the provinces of Cavite, Laguna and Batangas. In the
eastern part lies the province of Rizal. These provinces at the southeastern part of
Metro Manila cover an area of about 1,816,00 hectares.
Table 1: Land Area of Metro Manila and CALABARZON Land Area Hectares As % to Total a/ Philippines 30,000,000 100.0 Metro Manila 63,600 0.2 Manila City 2,498 3.9 Caloocan City 5,580 8.8 Pasay City 1,397 2.2 Makati City 1,831 2.9 Mandaluyong City 929 1.5 San Juan 595 1.0 Quezon City 17,171 27.1 Muntinlupa City 3,975 6.3 Parañaque 4,657 7.4 Pasig City 4,846 7.6 Marikina City 2,152 3.4 Taguig 4,521 7.1 Pateros 1,040 1.6 Las Piñas 3,269 5.2 Malabon 3,264 5.2 Navotas 894 1.4 Valenzuela 4,702 7.4 CALABAR b/ 1,815,940 5.4 Cavite 128,760 7.1 Laguna 175,970 9.7 Batangas 316,580 17.4 Rizal 1,194,630 65.8 a/ f Percentages for municipalities comprising Metro Manila and provinces comprising CALABARZON are based on total regional area. b/ The province of Quezon is not included since it lies at the outer part of Metro Manila’s periphery. Source: National Statistics Office (NSO), 1995
About 69 % of Metro Manila rest on high elevation with solid geographical
foundations. This zone extends from the transportation corridor to Laguna and

4
Batangas in the south. The remaining 31% of Metro Manila’s land area is flood
prone. This comprises the towns or cities of Manila, Navotas, Malabon and parts of
Caloocan. In particular, Navotas and Malabon are the coastal towns that get easily
flooded during high tides. On the eastern part, the flood prone towns are Pasig,
Marikina, Pateros and Taguig. These towns rest on low-lying zones with structurally
inferior soils (Cabanilla 1996:4.). Heavy flood damage is experienced in these areas
due to recurrent flooding caused by the overflow of Pasig and Marikina rivers. The
towns of Pateros and parts of Taguig specifically, can remain flooded for months.
Rizal province lies at the periphery of these towns. However, only about 4.0% of its
total area is prone to flooding, the rest lies on high elevation.
Pattern of Urban Settlement
The emergence of Metro Manila as the dominant center of political power, of wealth,
of commerce and of Spanish, American and Chinese influences has been well
documented elsewhere (see Wernstedt and Spencer 1967; Caoili 1988; Corpuz 1997).
It is suffice here to say that this dominance led to a fast pace of urbanization in the
region. By the 1970s, Metro Manila’s level of urbanization was at 100% (Table 2).
The region has increasingly become congested with an average density of 12,400
persons per sq.km as of 1990 census. The City of Manila is the most populated town
with a density of 64,200 persons per sq.km in 1990. The least populated town is
Pateros with a density of 5,300 persons per sq.km, just about the density of the total
Metro Manila region in the 1970s.
On the other hand, the metropolitan periphery has been largely agricultural
until 1980. From 1980 to the 1990s, the increase in the level of urbanization has been
substantial. The periphery though is still much less dense than Metro Manila with
only a density of 342 persons/sq.km in 1995. The metropolitan periphery is mainly
attractive for developments of residential subdivisions, sports and leisure centers,
memorial parks and industrial complexes.

5
Table 2: Level of Urbanization, Metro Manila and the Urban Fringe a/, 1903-1990
Census Year
Level of Urbanization b/
(percent) Urban Population (in thousands)
Annual Growth Rate (percent)
Population Density (persons per sq.km.)
NCR 1903 76.9 257 - 407 1918 87.1 371 2.4 589 1939 90.3 903 4.6 1,433 1948 97.1 1,526 5.5 2,500 1960 98.1 2,426 4.2 3,800 1970 100.0 3,953 4.9 6,200 1980 100.0 5,930 3.0 9,300 1990 100.0 7,930 3.3 12,400 MP c/ 1918 27.6 209 - 42 1939 25.7 270 1.2 58 1948 24.8 298 1.1 66 1960 24.4 417 2.8 94 1970 36.5 896 7.9 135 1980 48.6 1,670 6.4 191 1990 64.7 3,222 6.8 274 1995 d/ 66.5 4,132 5.1 342
a/ In all years, Metro Manila is composed of the 17 local units under the existing political set up. b/ Level of urbanization as defined by Pernia (1977) is the “proportion (percentage) of population living in urban places” (p. 9) c/ Metropolitan periphery consists of the provinces of Cavite, Laguna, Batangas and Rizal (CALABAR). d/ Level of urbanization estimated based on the urban-rural ratio in 1990. Source: Ernesto Pernia (1977). Urbanization, Population Growth and Economic Development in the Philippines. Westport, Connecticut and London: Greenwood Press. Census of Population and Housing, National Statistics Office, 1980 and 1990.
The pattern of settlement in the metropolitan region underwent considerable
change. Not only did density increase in all areas of the region but that an alteration
of the urban configuration has taken place. Manila city, which was once the home to
Spanish and mestizo aristocracies, became a popular destination of poor migrants
from the rural areas. The city became densely populated and large slum and squatter
areas developed. The once aristocratic suburbs in the area became the sites of poor,
lower and middle class residences. On the other hand, the “old rich” families, moved
to either Makati or Quezon City, which were historically the lower-middle class areas
(Caoili 1988). Makati’s rapid growth was primarily the result of planned
development of the 900-hectare Ayala property (more than 50% of Makati’s land
area) into mixed financial, commercial and residential subdivision in the 1950s. The
development of ritzy enclaves in the area made the city one of the most expensive
residential locations. On the other hand, Quezon City became a popular destination
due to the government’s decision to make the city the government center in 1948 and
later as the new capital city. Many national government offices were transferred in
6
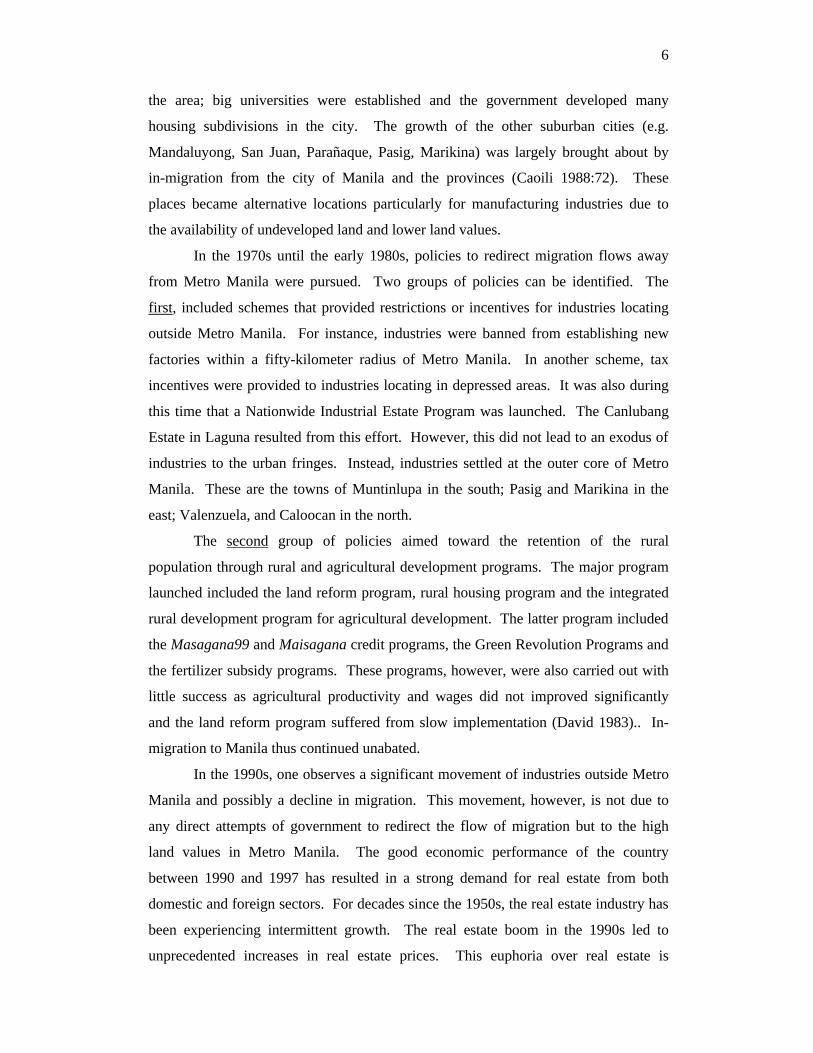
the area; big universities were established and the government developed many
housing subdivisions in the city. The growth of the other suburban cities (e.g.
Mandaluyong, San Juan, Parañaque, Pasig, Marikina) was largely brought about by
in-migration from the city of Manila and the provinces (Caoili 1988:72). These
places became alternative locations particularly for manufacturing industries due to
the availability of undeveloped land and lower land values.
In the 1970s until the early 1980s, policies to redirect migration flows away
from Metro Manila were pursued. Two groups of policies can be identified. The
first, included schemes that provided restrictions or incentives for industries locating
outside Metro Manila. For instance, industries were banned from establishing new
factories within a fifty-kilometer radius of Metro Manila. In another scheme, tax
incentives were provided to industries locating in depressed areas. It was also during
this time that a Nationwide Industrial Estate Program was launched. The Canlubang
Estate in Laguna resulted from this effort. However, this did not lead to an exodus of
industries to the urban fringes. Instead, industries settled at the outer core of Metro
Manila. These are the towns of Muntinlupa in the south; Pasig and Marikina in the
east; Valenzuela, and Caloocan in the north.
The second group of policies aimed toward the retention of the rural
population through rural and agricultural development programs. The major program
launched included the land reform program, rural housing program and the integrated
rural development program for agricultural development. The latter program included
the Masagana99 and Maisagana credit programs, the Green Revolution Programs and
the fertilizer subsidy programs. These programs, however, were also carried out with
little success as agricultural productivity and wages did not improved significantly
and the land reform program suffered from slow implementation (David 1983).. In-
migration to Manila thus continued unabated.
In the 1990s, one observes a significant movement of industries outside Metro
Manila and possibly a decline in migration. This movement, however, is not due to
any direct attempts of government to redirect the flow of migration but to the high
land values in Metro Manila. The good economic performance of the country
between 1990 and 1997 has resulted in a strong demand for real estate from both
domestic and foreign sectors. For decades since the 1950s, the real estate industry has
been experiencing intermittent growth. The real estate boom in the 1990s led to
unprecedented increases in real estate prices. This euphoria over real estate is

7
comparable to that of the 1950s when prices of residential real estate in Metro Manila
exhibited an average yearly increase of about 22% (Ballesteros 2000). Many
industrial firms located in Metro Manila suddenly found themselves sitting on a “gold
mine”. Agricultural or industrial use of lands in Metro Manila has become too
expensive. Industries thus moved toward locations where land is relatively cheaper.
In particular, the CALABARZON region has become the alternative location for
industrialists and real estate developers. CALABARZON’s role as the lead industrial
location has been supported by policies since the 1970s that showed the government’s
lopsided distribution of development and export promotion projects in favor of the
CALABARZON region (Pernia, Paderanga, Hermosa and Associates 1983). This
was also due to the region’s proximity to Metro Manila that provided an easy access
to markets, material, business services and government offices. CALABARZON’s
primacy as an industrial location has become more evident with the improvements in
infrastructure facilities (e.g. roads, transport and telecommunications). In 1992,
President Ramos identified the region as the industrialization showcase of the
Philippines. Within a period of five years, industrial and techno parks, commercial
complexes and residential subdivisions mushroomed in the region. Based on the
population and urbanization trends in Metro Manila and its periphery, the urban
expansion by 2010 is projected to take place in CALABAR and Bulacan province at
the northern part of Metro Manila (Figure 1).
8
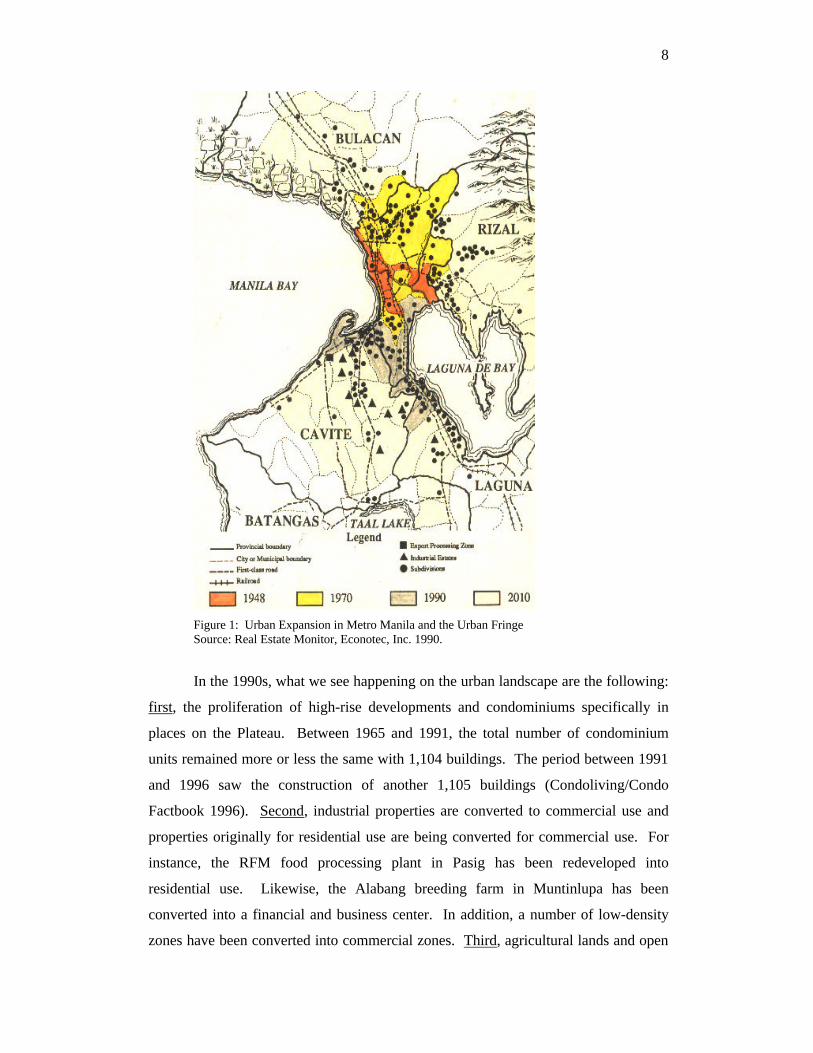
Figure 1: Urban Expansion in Metro Manila and the Urban Fringe Source: Real Estate Monitor, Econotec, Inc. 1990.
In the 1990s, what we see happening on the urban landscape are the following:
first, the proliferation of high-rise developments and condominiums specifically in
places on the Plateau. Between 1965 and 1991, the total number of condominium
units remained more or less the same with 1,104 buildings. The period between 1991
and 1996 saw the construction of another 1,105 buildings (Condoliving/Condo
Factbook 1996). Second, industrial properties are converted to commercial use and
properties originally for residential use are being converted for commercial use. For
instance, the RFM food processing plant in Pasig has been redeveloped into
residential use. Likewise, the Alabang breeding farm in Muntinlupa has been
converted into a financial and business center. In addition, a number of low-density
zones have been converted into commercial zones. Third, agricultural lands and open

9
spaces (e.g. parks) in Metro Manila have been depleted (Table 3). From a
predominantly agricultural and forestlands, Metro Manila has become highly
urbanized in terms of land area. This transformation has been significant between
1980 and 1990 and from 1990 to 1994. Fourth, real estate activity at the urban fringes
has tremendously increased since late 1980s. Between 1988 and 1997, the bulk of
land conversions have taken place in the CALABAR region (Table 4).
Table 3: Metro Manila’s Land Use, 1938-94
Land use As % to Total Land Area 1938 1980 1990 1994 Residential 14.2 a 29.4 65.0 65.0 Commercial - 3.0 3.4 8.0 Industrial - 4.7 4.0 3.0 Institutional - 4.5 5.2 10.6 Utilities - 1.4 4.0 4.0 Agricultural 55.6 b 12.5 b 8.4 4.4 Open Space 5.1 24.3 8.0 4.0 Forest Land/Parks 25.1 20.2 2.0 1.0 c Total 100.0 100.0 100.0 100.0 a Includes commercial and industrial lands b Includes fishery (4.4%) and mining and quarrying (0.2%) C Includes fishpond area Source: Census of Real Estate, 1938 Metro Manila Commission (MMC), 1983 NCR Regional Development Plan (1993-98), MMDA Urban Planning and Development in Metro Manila, MMDA and JICA, May 1996
Table 4: Land Use Conversions in the Philippines, 1988-1997 a/.
Location Area (hectares) Percent Share to Total Philippines 56,168.54 100.0 NCR 83.11 0.2 Region 4 (includes CALABAR) 25,108.56 44.7 Region 3 (Central Luzon) 11,025.71 19.6 Other Regions 19,951.16 35.5 a/ This includes agricultural lands converted by the rezoning act of the local government prior to 1988 (i.e. enactment of the CARP Law) Source: DAR-Presidential Agrarian Reform Council (PARC)
Pattern of Land Ownership
Historically, ownership of private lands in the Philippines has been concentrated in
the hands of the traditional elite and the educated middle class. These families have
the financial resources, political connections and access to information that allowed
them to amassed alienable and disposable public lands through homesteads and/or
sale under both the Spanish and American colonial governments. A real estate census
conducted in 1938 showed that private individuals owned about 92.2% of private

10
lands in the country and associations and religious organizations owned about 3.9%
and 0.6%, respectively. Those individuals who own land comprise only about 18% of
total Philippine population (Table 5). The distribution of private lands is noted to be
more skewed in Metro Manila were only about 4% of the region’s population owned
land in the city. Land ownership though differed by town or municipality. In Makati,
less than 1% of population owned land while in Las Piñas, Taguig and San Juan about
20% of its population are landowners.
Table 5: Ownership of Private Lands by Individuals, Philippines, 1938 Total Area
(000 hectares) Number of Owners a/
Population (1939)
Number of owners to Population (percent)
Philippines 7967.0 2889944 16,000,000 18.1 Metro Manila 28.8 39,661 993,889 4.0 City of Manila 1.6 15,312 623,492 2.4 Caloocan b/ 8.1 2,544 77,833 2.8 Pasay 0.4 2,267 55,161 4.1 Las Piñas 2.8 1,486 6,822 21.8 Navotas 0.6 1,136 20,861 5.4 Makati 1.3 217 33,530 0.6 Pasig 1.9 2,697 27,541 9.8 Malabon 1.2 1,514 33,285 4.5 Parañaque 2.7 2,976 21,125 14.1 Mandaluyong 0.8 854 18,200 4.7 Marikina 2.7 616 15,166 4.1 Muntinlupa 2.0 1,070 9,228 11.6 Pateros 0.2 1,006 7,160 14.0 San Juan 1.2 3,516 18,870 18.6 Taguig 1.3 2,459 12,087 20.3 a/ The area and number of land owning private individuals for the other municipalities of Metro Manila (excluding City of Manila) were estimated based on the percentage of lands owned by private individuals in the province of Rizal. The municipalities of Caloocan to Taguig were then part of Rizal. b/ Quezon City and Valenzuela were then part of Caloocan. Source: Census of Real Estate, 1938 Census of Population, 1939.
After the 1938 census, comprehensive information on ownership of private
lands in the Philippines remains hard to find. However, there are indications that the
situation may have improved in the recent years in Metro Manila and CALABAR
area. Data on survey of housing reveal that as of 1985, about 50% of households in
Metro Manila owned their homelots (Table 6). This proportion is noted to have
improved considerably within the 10-year period. In Region 4, which includes the
CALABAR areas, lot ownership of dwellings is higher with about 60% of households
owning lands. This proportion has also improved considerably in 1994 wherein about
73% of households are lot owners.

11
Similarly, homeownership on “borrowed” lands exhibited a declining trend
over the same period in both Metro Manila and Region 4. This indicates a movement
of households into either land ownership or the rental market.
Table 6: Proportion of Lot and Home Ownership and Home Ownership on Borrowed Lands, Philippines, 1985-94 (percent)
1985 1991 1994 Lot and Homeownership a/ Philippines 58.1 62.8 65.4 Total Urban 50.1 58.2 61.6 Total Rural 63.0 67.7 69.1 Metro Manila 41.2 45.5 49.4 Region 4 (urban) 60.5 66.7 73.4 (rural) 68.6 65.5 71.1 Homeownership on Borrowed Lands b/ Philippines 30.0 25.2 23.8 Total Urban 26.9 22.6 20.8 Total Rural 31.8 27.4 26.8 Metro Manila 20.4 15.6 14.3 Region 4 (urban) 24.4 18.9 14.2 (rural) 25.7 28.2 24.0 a/ refers to own/owner-like possession of house and lot including amortizing owners. b/ refers to homes built on rented land, rent-free land with consent of owner or rent-free land without consent of owner. Source: Family Income and Expenditure Survey (FIES), NSO
3. The Institutional Environment: Urban Management and Land Use Planning in Metro Manila and its Periphery
The Historical Precedents
The urban plan for Metro Manila had been grandiose. When the Spaniards settled in
Manila, they evolved ideas for town planning based on the Italian Renaissance
theorists that emphasized the plaza complex in city development (Hollnsteiner 1969).
The idea of town planning was codified in ordinances promulgated by King Philip II
whereby guidelines for site selection, layout and dimensions of squares and streets
and other land uses were provided. Likewise, the Americans in their own efforts to
guide the growth of Manila and other Philippines cities and towns drew up master
plans done by famous architects in the United States. These early master plans gave
emphasis to clearly articulated road systems, better port facilities, and suburban
zoning of residential and industrial locations. Later, the plans also included
sanitation, housing and social development.
However, despite the grandiose plans of the colonial governments, Metro
Manila developed far from what has been originally envisioned. The reasons are the
12
following: first, planned developments were seldom implemented and second, town
planning was valued mainly for aesthetic reasons rather than for the management of
land and urban growth. Under the Spanish colonial government, only the main public
areas in Manila (e.g. Intramuros) followed the design as indicated in the planning
guidelines of King Philip. The suburban sectors were subjected to different planning
objectives as the local councils and the Spanish friars were given the free hand to be
the “masters in the locality” (Ocampo 1992). These “master” planners have been
more concerned with their own grandeur rather than sanitation, housing and
settlement of locals. Many infrastructure projects specifically for social development
were never implemented. At the end of the Spanish rule of the Philippines, Manila
was not much of a city. Phil D. Carman who was among the first Americans arriving
in Manila described the city as follows:
“I don’t much about Manila’s growth prior to 1898 but it could not have been very rapid for it wasn’t much of a city at the end of 328 years of Spanish building operations when I arrived in December of that year. In 1900, the area between Mabini and San Marcelino was mostly a large paddy field with Pasay and Santa Ana distant villages. Some time later, in a belated morning attempt to witness the American advance from Caloocan, a newspaper correspondent and I dodged bullets for what seemed many miles of speeding on bicycle and horse through unpopulated wooded stretches at the right and beach to the left. All that space between Lerma Park and cementerio del Norte- midway between pleasure and the grave as it were- was then an unimproved and unpopulated area” (P.D Carman. 1922. Remarkable Growth of Manila since the American Occupation. American Chamber of Commerce Journal, 22 August 1922, p.10).
The planning ideals under the American regime have also been poorly
implemented. Between 1905 and 1914, the implementation of the master plan of
Metro Manila had been rapid. Much of the arterial framework had been built, large
moat areas had been converted and land reclaimed had been developed. However,
national and local politics started to interfere in the implementation of city plans. The
close ties between the national and city governments primarily facilitated the
implementation of plans for Manila. The national government controlled the budgets
and accounts while the city government represented by the city board was responsible
for the implementation of projects. In 1916, the city board was made elective. Due to
the expansion of the educated middle class and organized workers also at this time,
the city board became dominated by labor and socialist minority parties, bringing the
country into frequent conflict with national politics, which was dominated by the
traditional elite families (van Naerssen, Lighart and Zapanta 1995). The elite
families, who own large landholdings and controlled real estate, banking,
transportation and communication businesses, would oppose plans that would in
13
anyway affect their businesses. For instance, a zoning ordinance proposed in 1935
failed five times to muster enough votes due to opposition from real estate and other
special interests (Ocampo 1992:321). A proposal to create a metropolitan
organization for Manila and suburbs also foundered essentially for the same reasons.
The national planning unit, which was under the Bureau of Public Works, struggled to
clarify its job. This unit went ahead to prepare metropolitan plans but nothing came
out of these plans (Mandelbaum 1929; Arellano 1919). The results of this power
struggle in the implementation of city or master plans were the following: first, a
slowdown in the implementation of plans, second, departures from plans to suit the
convenience of people in power, and third, the inability of the government to come up
with a coherent plan and policy for Metro Manila.
The Americans granted the Philippines political independence in 1946. The
early efforts of the Philippine Republic on city planning were geared toward
administrative changes that were undertaken with the objective of greater
centralization. Centralization in planning was achieved through the creation of a
National Planning Commission (NPC) that was given authority over local and
regional governments on planning, zoning, subdivision and building regulations. The
NPC, however, was ineffective primarily because it had no political support at the
local level (Santico 1953; Aquino 1969). Another attempt to integrate Manila and
suburbs into one metropolitan region was also made at this time but failed due to
opposition from the municipal politicians and the governor of Rizal Province (Caoili
1988:136).
Toward the 1960s, the government moved to political and administrative
decentralization. The first Local Autonomy Act was passed in 1959. This Act vested
upon the city and municipal governments greater fiscal, planning and regulatory
powers (Republic Act 2264). In particular, it gave the cities and municipalities
powers to undertake urban planning on their own. While the local governments may
have been able to identify programs and projects, their implementation cannot be fully
undertaken because the local governments had no taxing powers and finances were
still controlled at the national level. Thus, from the 1950s to early 1970s, urban
planning was done mainly by piecemeal either through public or private sector
initiatives. There was a lack of comprehensive planning and land developments were
mainly contained in area or subdivision plans.
14
Government Efforts Toward Comprehensive Urban Planning
After World War II, the economic and demographic growth of Manila and its suburb
was substantial. The current piecemeal approach to urban planning has apparently
become inadequate as squatter population and congestion increased in the city. The
World Bank, who then supported major infrastructure projects in the country, sounded
off the need for a comprehensive urban planning system. The first initiative to
comprehensive planning was made under the reign of President Marcos (1965-86). In
particular, Marcos created a national urban planning program, which aimed to
broaden town or city planning to include the entire range of land use management and
development. The program consisted of radical policies such as the an urban and
agrarian land reform program, land use and zoning laws, a development control
system involving permits and licenses, and anti-squatting laws.
The urban land reform program of 1979 (PD 1517) required that land use had
to be in line with government development plans and that real estate transactions had
to be registered and approved by government. This law would have allowed
government a free hand to “rebuild” Metro Manila but this was not to be because the
law was strongly contested by Manila’s landowners, contractors, real estate owners
and other sectors of the business community (van Naerssen, Lighart and Zapanta
1995). Thus, the urban land reform law was confined to “depressed areas” (mainly
marginal, unprofitable land used by squatter families), which covered about 638
hectares or 1.1% of Metro Manila’s land area.3
Government direct intervention on land use has been mainly implemented
through a land development control system. This system requires that changes in land
uses and building of structures on land have to pass through a system of permits and
licensing. In particular, permits and licenses are obtained on the basis of the
following planning regulations:
3 Estimated based on the identified areas for priority development (APDs) in Metro Manila.

15
a. Land Use Control: All cities and municipalities in the country are required to provide comprehensive land use and zoning plans of their specific localities. Land use zones are given identity labels such as “R” for residential districts, “C” for commercial districts and “I” for industrial districts. Zoning restrictions in the country are mainly on land use and building height. There are no minimum area restrictions. In the case of Metro Manila, more detailed zoning patterns have been developed due to mixed-use developments (Box 1). Some municipalities may have more detailed classification. For instance, in the City of Mandaluyong, residential zones range from R1 to R7 representing the lowest density residential areas to squatter districts. The implementation of the land use controls in Metro Manila, however, have not really been restrictive because government allowed the issuance of temporary use permits (TUPs). These permits are given to land uses that do not conform to the existing zoning in an area. Non-conforming uses are allowed to operate in the zone for a period of five years and renewable. The TUPs are essentially government’s response to potential changes in land use. This practice resulted to arbitrary zoning since approvals are mainly administrative decisions.
Box 1 Pattern of Land Use R1--Low Intensity Residential Zone: Characterized mainly by single family, single detached dwellings R2—Medium Intensity Residential Zone: Characterized mainly by medium density housing like low and medium rise, multiple family dwellings on limited scale. R3--High Intensity Residential Zone: Characterized by mixed housing types and high density housing, like high-rise buildings. C1-- Low Intensity Commercial Zone: Permits all uses under R1, R2, and R3. C2—Medium Intensity Commercial Zone: Characterized by commercial development that is a mixture of retail and wholesale trade and may contain the service and entertainment industries (e.g. restaurants, shopping centers). C3--Heavy Intensity Commercial Zone: Characterized by heavy commercial developments usually trade, service, and entertainment on a metropolitan (regional) scale of operations. I1--Light Industrial Zone: Covers those industries that are classified as non-pollutive but may or may not be hazardous. I2—Medium Industrial Zones: Covers those industries classified as pollutive but may or may not be hazardous. I3--Heavy Industrial Zone: Cover those industries classified as highly pollutive and hazardous. Special Districts A1--Agro-industrial District: Area devoted to industrial uses that are agriculturally derived. GC—Government Center: Area devoted to national and regional government office, structures and institutions. AGR—Agricultural District: Area with prime agricultural lands where activities are restricted to agriculture and compatible uses (e.g. milling). C--Cultural District: Area reserved for culture institutions like galleries, museums, and cultural center. PUD—Planned Unit Development: Refers to land development projects that allow planned land uses mixes designed to enhance environment rather than result in deterioration. AZ—Airport Zone: a self-contained unit specifically devoted for airport terminals and related facilities. Source: Human Settlements Regulatory Commission. Metro Manila Zoning Ordinance, Resolution Number 81-01.
b. Subdivision Development Controls: Land developments have to conform not only to the prescribed land use but also to the physical and legal standards of property subdivision and sale. The minimum design standards for land developments are contained in two decrees: one, the Subdivision and

16
Condominium Buyers Protective Decree (PD 957) and two, the Rules and Standards for Economic and Socialized Housing Projects (BP 220). Presidential Decree 957 requires conformity to standards on roads, drainage, sewerage, water systems, etc. including the registration of all developed properties on sale. BP 220, on the other hand, defines the development standards specific to low cost housing developments (i.e. house and lot worth not more thanP375,000).
c. Building Regulations: Building controls have been adopted since the 1950s by
virtue of the National Building Code RA 6541, which was revised in 1978 (PD 1096). The Building Code provides the minimum standards relating to structural, plumbing, sanitary, electrical, mechanical, fire protection of proposed building plans.
d. Environmental Controls: The Philippine Environmental Policy was decreed in
1977 through the creation of the National Environment Protection Council (NEPC). In 1978, the Environmental Impact Statement (EIS) System was established (PD 1586) which required all environmentally critical projects and projects in environmentally critical areas to submit to the EIS. The EIS provided the guidelines to determine quality standards for air, water and land use. It also required monitoring of land development projects of both private and public entities with regard to their effects on the environment
The agrarian reform law provided a means of controlling land use. Aside from
the limits on ownership of agricultural lands, the agrarian reform law imposed
restrictions in the conversion of agricultural land to non-agricultural uses. This law
had no direct impact in Metro Manila as the region has become highly urbanized prior
to the implementation of the land reform. However, the law has strongly affected
developments at the urban fringes, which are mainly agricultural areas.
The government’s view on squatting also affected property developments.
Massive squatting (i.e. defined to be in the magnitude of more than 50,000 squatter
families)(Alba 1997) has delayed business and infrastructures investments in urban
areas. In general, the government has always adopted a populist attitude on squatting.
Squatters’ by their number can influence local and national elections, thus politicians
tolerate their presence. In the 1990s, however, squatter clearance and relocation have
become increasingly costly as land becomes more expensive.
The planning regulations and controls set forth by President Marcos in the
1970s remained the key urban and land use planning strategies to date. The Marcos
government, in particular, can be credited for the following: first, the creation of
Metro Manila region that had not been possible in the previous administration;
second, the institutionalization of a land development control system; and third,
17
infrastructure support for the industrialization of the CALABARZON region. The
first allowed better management of Manila and the adjacent suburbs. The second
provided the government a means to manage externalities arising from land
development. And the third, provided an alternative location for the “overspill” of
Metro Manila’s population.
On the other hand, the Aquino and Ramos administration provided a truly
decentralized system of governance. This was made possible through the enactment
of the 1991 local government code that gave local governments control over the
management of local affairs by providing them financial and administrative
independence. Urban and land use planning thus have become locally administered.
However, the efforts of the government toward urban management and land
use planning have been limited. The Marcos, Aquino and Ramos administrations
failed to adopt a comprehensive land use plan for the country. The absence of
technically sound land use plans created conflicts with regard to decisions on land use
and zoning and in the guidelines in the issuance of permits and licenses.
The Development Control Process: Centralization vs. Decentralization
The development control process subjects land developments into a permit and
licensing system. Permits and licenses are secured depending on the purpose for
which land development projects are undertaken. Land developments undertaken by
the private sector for own use or for lease purposes have only to secure building
permits from the local government. On the other hand, land developments undertaken
by the private sector for sale4 to the public goes through an intensive development
approval process. Permits and licenses other than the building permit have to be
secured. Housing projects of the National Housing Authority are regulated within
NHA itself and do not need to obtain permits from the local governments or the
HLURB.5
4Sale refers to every disposition or attempt to dispose a subdivision lot including the building and other improvements. This may be undertaken under a “contract to sell”, a contract of purchase, an exchange, an attempt to sell, an option of sale or purchase, a solicitation of sale, an offer to sell (PD 957, Sec. 2). 5In the first two years of implementation of PD 957, NHA had the authority to regulate the real estate trade and business in the country (PD 957, 1976). This authority was transferred to the HSRC (now HLURB) upon its creation in 1978. However, NHA was provided the privilege of not seeking development approval from the HLURB. This privilege was only for NHA projects. Not covered are joint venture projects of NHA with the private sector. However, NHA generally provided technical assistance to its joint venture projects to facilitate the issuance of permits and licenses.

18
The five major permits that had to be secured under this process are the following:
a. Development Permit. This refers to permission granted with regard to compliance with subdivision standards and regulations based on the criteria provided under PD957 for subdivision and condominium developments or BP220 for socialized and economic housing developments.
b. Building Permit. This permit refers to compliance with the National Building Code of the country. It gives the applicant the “go-signal” for construction activities to start.
c. Environmental Permit: This comes in two forms: one, environmental clearance (EC) and two, environmental compliance certificate (ECC): An EC a certification that the project is not hazardous or has no adverse effect to the environment. It is required for all types of land development whether high-rise or subdivision developments. On the other hand, an ECC is a requirement for projects undertaken in zones that do not conform to the approved zoning ordinances of LGUs or in areas considered “environmentally critical” by the Department of Environment and Natural Resources (DENR). The issuance of an ECC is based on systematic studies assessing the effects of a project on human health, biophysical/ecological, geophysical and socioeconomic aspects of the community
d. Conversion Clearance: This permit is obtained when agricultural lands are to be used for urban activities. The clearance may be obtained either as an exemption or conversion certificate (AO 6 series of 1994). An exemption clearance is issued for agricultural lands classified or zoned as non-agricultural based on Town Plans approved by the HLURB before 15 June 1988 (i.e., before the CARP Law). All other agricultural lands that are not qualified for exemption have to obtain a conversion certificate, which requires certification not only from the local government but also agencies of the Department of Agriculture, provincial boards, special committees, etc.
e. License (or Permit) to Sell. This permit provides the owner of property the authority to sell any subdivision lot or condominium unit that result from a land development process.6 This license is acquired after the development and building permits have been issued. A license to sell also requires certifications from the utility companies (i.e. MERALCO, LWUA), a performance bond and publication. The performance bond guarantees the full development of the project. Its value depends on the existing improvements made on the land. The more improvements on the land, the lower the bond value. On the other hand, publication is needed to inform the public about the project. Publication has to be posted in leading national newspapers for two weeks. Projects developed under BP220 require only one week of publication.
The development control process in the country has been administered under
two systems of governance. The period from 1978 to 1992 represents the centralized
and interventionist regime. On the other hand, the period from 1992 to 1998
represents a decentralized and market oriented system. These systems resulted not
6The license to sell is not required in case of sale or transfer of a subdivision lot by the original purchaser and other subsequent sale. It is also not needed in case a mortgagor sell property because of bona fide debts. (PD 957, Sec 7).
19
only in a different set of procedures and requirements but also differences on the level
of complexity and time involved in the development control process.
Centralized and Interventionist Period, 1980-1992
President Marcos, under whose reign a national urban planning program has
been institutionalized, believed that planning controls could only be implemented
through a centralized and interventionist form of governance. Thus, before the
program’s launching in 1976, Marcos instituted administrative and political changes
in the country. In 1972, a martial law rule was imposed. This law provided Marcos
the basis to centralized political authority. Unlike previous centralization approaches,
however, Marcos’ idea of centralized governance implied concentration of decision-
making powers on the Presidency. Marcos established a government of dictatorship
and cronyism by abolishing Congress, suspending national and local elections and by
placing his cronies in positions of authority.
The process of centralization of political authority commenced in Metro
Manila. Marcos succeeded in restructuring the local governments of the City of
Manila and 16 other cities or municipalities into one metropolitan region (Presidential
Decree 824 or 1975). A metropolitan commission (Metro Manila Commission) was
created to act as the central government. The Metro Manila Commission (MMC) was
given the powers to administer and coordinate all activities in Metro Manila.
Political centralization made a major impact on urban planning. One of the
powers of the MMC was to undertake land use planning for the entire Metro Manila
region. The MMC provided a Structure Plan entitled Manila: Toward the City of
Man, which defined the basic framework for the growth of Manila. This framework
served as the guideline for detailed local plans. In particular, the Plan aimed to
provide for the creation of “Nueva Manila” through spatial arrangement of functional
areas, land use planning, infrastructure developments (e.g. roads, flood controls, etc),
population distribution. This resulted in the construction of prestigious government
buildings, international hotels, the Manila South and North Expressways, the light rail
transit system. However, private economic interests played a major role in the
implementation of these projects (Manlapat 1991). Infrastructure contracts were
channeled to firms of the cronies and these projects became a source of kickbacks.
Funds for public service were invested in crony companies that later were bankrupt.

20
Thus, a number of important projects had to be put aside. By the end of the Marcos
term, the Philippines has amassed huge foreign and domestic debts.
Marcos also created the Housing Settlement and Regulatory Commission (now the
Housing and Land Use Regulatory Board), which had the exclusive jurisdiction over
planning regulations and controls in the country. The HLURB was provided the
following powers: (1) the promulgation of zoning and other land use control standards
and guidelines to govern land use plans and zoning ordinances of local governments;
and (2) to review, evaluate and approve comprehensive land use plans and zoning
ordinances of local governments. The Board was given control over all land use and
zoning regulations in the country. The exception was Metro Manila where land use
controls were mainly handled by the MMC. In particular, the MMC issued a zoning
ordinance (MMC Zoning Ordinance 81-01), which was the basis for HLURB
approval for projects located in Metro Manila. In cases when projects were non-
conforming to the MMC zoning ordinance, HLURB required the endorsement of the
MMC. For projects on agricultural lands, conversion clearances were approved based
on zoning studies made by the HLURB and the joint memorandum between HLURB,
the Department of Agrarian Reform and the Department of Local Government and
Community Development (DLGCD).7.
The role of the local governments was limited to issuance of building permits.
Endorsements of projects in their locality were mainly ceremonial. Local
governments did not also have regulatory powers over socialized and economic
housing. Under BP220 an integrated approval system was provided, which allowed
the HLURB to issue both building and development permits for socialized and
economic housing.
The process of approval for land development projects under a centralized scheme
is shown in Figure 2. In particular, the HLURB has provided the approval of major
permits while the local governments have minimal participation. It is also noted that
the Philippine Environmental Code of 1981 has not been enforced in the development
control process. Since 1981, Metro Manila and highly urbanized areas have been
declared environmentally critical particularly for projects involving high-rise 7These agencies assumed specific roles with regard to land conversion. DAR had the authority to allow conversions subject to studies on zoning by HLURB (RA 3844, Land Reform of 1963). HLURB was empowered to issue rules and regulations to ensure compliance with policies, plans, standards and guidelines on human settlements including zoning. The local governments under the DLGCD were involved in the conduct of zoning studies and in implementing rules and procedures for converting agricultural lands.

21
structures. However, the local governments and HLURB did not fully implement the
Code in the issuance of building and development permits. The general sentiment of
the local governments then was that environmental problems are mainly linked to
industries. Land development specifically for human settlements have not been
conceived environmentally critical regardless of their location.
Similarly, the conversion clearance was also not a major permit considered. The
conversion clearance was initially designed to discouraged landowners from land
conversion and to protect agricultural tenants and lessees from unlawful ejectment.
Conversion clearance in view of conflicting land uses did not create public uproar in
the early 1980s. The inactive real estate market maybe one reason.

Application Site Development
Plan Vicinity Map
Title Mayor’s Endorsement
Application Structural Geodetics Plumbing Sanitary
Application Site Development
Plan Locational Clearance
Vicinity Map Title
Topographic Plan Complete Engineering
Details
Lot data/traverse comp.
Electrical Mechanical
INP Fire Building Permit
Survey Plan DEV’T PERMIT Lot Description
Technical Description
Building Permit Mother TCT
Sworn Registration Statement
Site Development Plan
LMB Approval Financial Statement
Title Registration Fees Notice of Filing
Articles of Incorporation Copy of Ads, Brochures
Contract Form Meralco
LWUA Certification
Application Form Certificate of Registration
Performance Bond LMB Approved Plan
(Approved Tech. Desc .)
Tax Declaration Title
Tax Clearance Letter of Application
Real Property Tax Individual TCTs
Letter Request Tax Declaration
Real Property Tax
License to Sell
Individual TCTs
Individual Tax Dec.
* parcel of land owned by the company has to be consolidated into one title (mother title).
Figure 2: Flowchart for Permits and Licenses, Centralized System (1980-1991) Based on the Requirements and Procedure for Specific Permits and Licenses and the
Report of the Office of Special Assistant to the EVP, Filinvest ,
1 LGU (Mayor)
1 HLURB
1 HLURB
4 LMB
MERALCO LWUA
SEC
3 HLURB
LGU (Treasurer’s Office LGU (Assessor)
3 HLURB
RD LGU (Assessor)
Decentralized and Market-Oriented Period
The downfall of President Marcos and the assumption of Corazon Aquino to
the presidency of the Philippines marked the restoration of democratic institutions in
the country. This restoration was achieved through the ratification of the Constitution
in 1987 and the enactment of the “new” local government autonomy code in 1991.
These laws specifically institutionalized political decentralization in the country. The
Congress was restored and the regional levels of government starting from the
provincial to the barangays, were recognized as areas of political decentralization.
These changes brought important effects in the management of local affairs
and consequently on urban planning. Under the 1991 local government code, local
governments were given the principal role in urban planning. HLURB’s authority to
issue locational clearance and development permits for projects under PD957 and
BP220 were devolved to local government units (EO 71 series of 1993). Specifically,
the role of the HLURB was confined to the issuance of licenses to sell and locational
clearances for “vital” projects identified by the National Economic and Development
Authority (NEDA). In addition, the local governments were tasked to formulate their
own comprehensive zoning and land use plans and provided powers to reclassify
alienable and disposable lands.8
In Metro Manila, decentralization was put into effect even prior to the “new”
local government code by the streamlining of MMC’s activities. The Commission
was given a “floating” status from 1986 to 1992. In 1992, before the end of Aquino’s
term, the MMC was reorganized into the Metro Manila Development Authority
(MMDA). MMDA’s authority was limited to coordinating the delivery of “metro-
wide” services9 within Metro Manila. The planning, taxing, regulatory and
implementing powers of the previous MMC were transferred to each of the 17 local
government units of the metropolitan region. The local governments function
independently and coordinative planning was confined to common areas.
The Aquino administration also scaled down interventionist policy and moved
to market-oriented policy. Social reform programs aimed to reduce wealth and
8 The area allowable for reclassification is a percentage of the municipality’s total land area. The percentage varies (ranges from 5-15%) depending on the economic status of the municipality. For instance, Class A municipalities can reclassify to the extent of 15% of their alienable and disposable lands. Reclassification in excess of the limits may be allowed subject to the approval of the President upon recommendation of NEDA. 1991 Local Government Code. Rules and Regulations. 9These are services considered “metropolitan” in character such as traffic management, waste management, flood control and metropolitan planning.
24
income disparities among households specifically supported this market policy. A
major program that had important impact on urban planning was the comprehensive
agrarian reform program (CARP). The CARP was implemented in 1988 subjecting
all agricultural lands (i.e. not limited to rice and corn) to the agrarian reform law.10
The rationale of the program was not only to abolish tenancy and limit ownership size
of agricultural lands but more importantly to create a deeper commitment for the
preservation and conservation of agricultural land. Urban planning and land use
management thus became linked to the broader objective of national food security.
Another social reform policy that had direct impact on urban planning is
Republic Act 7279 or the Urban Development and Housing Act (UDHA). This law
institutionalized private sector participation in socialized housing by mandating
developers of non-socialized subdivision projects to provide socialized housing
developments equivalent to at least 20% of total subdivision area or project cost.
Compliance with this provision became a prerequisite for the issuance of development
permits and/or licenses to sell.
The administrative and legal changes that resulted from the 1991 local
government code, the CARP and the UDHA have not only reorganized the
government offices that issued permits and licenses but also increased the number of
permits and offices or authorities involved in the approval process specifically for
developments requiring conversion clearances (Figure 3). Under the local
government system, permits had to be obtained from the barangay level up to the
mayor’s office and the sanggunian bayan (i.e. the local legislative body). Moreover,
barangay, municipal, provincial and regional representatives of national agencies
(e.g. DAR, DA. DENR etc.) were also involved in the permitting and licensing
system.
The CARP and UDHA laws have also imposed additional requirements on
permits and licenses. For instance, compliance to the 20% socialized housing proviso
under UDHA is a prerequisite to the issuance of a development permit.11 On the other
10Excluded under this law are agricultural lands devoted to fisheries and aquaculture as well as poultry and livestocks. 11 Compliance to UDHA was not restrictive. Developers can comply through the following schemes. first, developers can register previous socialized housing projects that have not been registered in the past. second, development projects with a density of at least 100 units per hectare are considered to have complied with the UDHA. For instance, a project with an area of 1200 square meter and a proposed number of saleable lots of 15 units has a density of 125 units per hectare (i.e. No. of units/Area). Subdivision projects with four units or less are excluded from coverage.

25
hand, under CARP the conversion of agricultural lands goes through a conversion
approval process that involves local and national agencies and representatives.
Certifications and endorsements have to be obtained from offices or organization such
as the Sugar Regulatory Administration, the Philippine Coconut Authority, the Bureau
of Soils, the National Irrigation Administration, organizations of agrarian reform
beneficiaries, agrarian reform committees including non-government organizations.
Obtaining exemptions from the land conversion process has been less tedious than
obtaining a conversion certificate but comparatively more complex than the process
under the centralized system wherein the HLURB can itself decide on land
conversions.
Additional requirements also came from the stricter enforcement of environmental
laws. The real estate boom of the 1990s resulted in an increased demand for non-
agricultural lands that awakened the national concern for environmental protection.
In the past, the issuance of an environmental permit was limited to environmentally
critical projects (e.g. heavy industries, resource extractive industries, infrastructure)
and projects (regardless of type) in environmentally critical areas (e.g. national parks,
watersheds, tourist spots, land with critical slopes, prime agricultural lands, areas
frequently visited by natural calamities; etc.). This practice apparently changed in the
early 1990s when incidents of soil erosion from residential developments (e.g. Mount
Makiling in Calamba, Laguna), public complaints over the impact of condo
developments on water availability, garbage management, drainage, etc. prompted
the government to require environmental permits on all types of land developments.

Application Mother TCT
Mother Tax Declaration Lot Plan/Vicinity Map
Inspection Application Mother TCT
Mother Tax Declaration Lot Plan/Vicinity Map
Inspection Site Development Plan
Application
Certif . From DA Regional Tech. Director Certif . CENRO/PENRO
site characterization report Drainage Plan
Septic Tank Detail Topographic Plan
Permit to Cut Trees Photographic of Site
Site Inspection Payment of Fees
Deliberation
Application Mother TCT
Mother Tax Declaration Lot Plan/Vicinity Map
Special Power of Attorney from previous owner
PCA Clearance SRA Clearance
Bureau of Soils Clearance Inspection
Application Mother TCT
Lot Plan/Vicinity Map
Application Mother TCT
Mother Tax Declaration Lot Plan/Vicinity Map Locational Clearance
Certificate of Locational Viability from HLURB
Special Power of Attorney from previous owner
NIA Clearance Dept. of Agri . Certificate Articles of Incorporation
DENR, EC Sanggunian Resolution
of Land Use Conversion Financial Statement
Affidavit of non-tenancy Proof of Payment of
Disturbance Compensation Sinumpaang Salaysay
Brgy . Agrarian Reform Council Certification
MARO PARO RARO
Joint MARO-PARO-RARO Inspection Report
BALA Endorsement to Usec -LAO (if>50 has.)
DAR Clearance Mother TCT
Real Property Tax Clearance Deed of Sale
Transfer Tax Payment Docs stamps
Capital Gains Tax Receipt Certificate of Buyer’s
Land Holdings Affidavit of Non-
Improvements (Seller) Certificate of Non-
Improvement (Assessor)
Figure 3: Flowchart for Permits and Licenses, Decentralized System (1992-1998) Source: see Figure 2
Application Mother TCT
Mother Tax Declaration Lot Plan/Vicinity Map Locational Clearance
Certificate of Locational Viability from HLURB
EIS IEE
Program of Dev’t . Corp. Secretary’s Cert
Barangay Clearance Public Hearing
Scoping
2 Assessor
RD 7
LGU ( Sangguniang Bayan ) LGU (Mayor), LGU ( Barangay ) HLURB, DA ( Reg . Tech. Dir .)
CENRO, PENRO
3 PCA, SRA
Bureau of Soils 11
NIA, DA, DENR LGU ( Sangguniang Bayan )
LGU ( Barangay ) SEC, BARC, MARO, PARO, RARO, BALA
Mother TCT
ECC (Project Docs)
4 DAR (Central Office)
LGU (Treasurer’s Office) BIR
ASSESSOR

27
Real Property Tax Clearance
Real Property Tax Receipts
Mother Tax Declaration
Application Mother Tax Dec SDP, complete eng’g . details
Locational Clearance NIA Clearance
Mother TCT Sanggunian hearing
Sanggunian Resolution
Barangay Clearance Site Inspection
Processing Fees Affidavit of Commitment to RA 7279 requirements
1 RD
2 LGU ( Sangguniang Bayan )
DENR 2
SEC LWUA
Mother TCT LGU-approved SDP
Survey Plan Lot Description
Technical Description Lot data/traverse comp.
DAR Clearance
Application LGU-approved SDP
Location Plan Vicinity Map
Drainage/sewage plan Road cross-section plan
Location of water pump with voltage rating/requirement
Application Form BUILDING PERMIT
LGU-approved SDP LMB APPROVAL Performance Bond
Affidavit of Commitment to RA 7279 requirements Undertaking for billboard
Billboard with information
Waiver to change name
ECC DEV’T PERMIT
NWRB Permit Local Water District Code
Electric Facility Permit Application for
telephone Application for
Advertising format Advertising Approval Notice of Publication
Affidavit of Publication Copies of newspaper
where publication appeared
Affidavit to submit list of TCT’s
Bldg . Permit forms Building Plans
Location Plans ( blk /lot) Locational Clearance
Bill of Materials Plumbing Permit
form duly accomplished DOH Approval
Electrical Permit form duly accomplished
Electric Plans Barangay Clearance
Application Mother TCT
Plumbing Plans
Well Drilling Data Site Development
Vicinity Map/ Location Plans
LWUA Certification SEC Cert . of Registration
LICENSE TO SELL/ Cert . of Registration
LMB Approval • Approval Survey Plan • Approved Tech. Desc . Latest Real Property
Tax Receipts Real Property Tax Clearance Mother TCT
Letter of Application
Deed if Lot Allocation for Joint Venture
Mother Tax Dec Latest Real Property
Tax Receipts Photocopies of individual
TCTs
Letter Request
INDIVIDUAL TCT’S
INDIVIDUAL TAX DEC’S
2 SEC
LWUA 2
LGU ( Sangguniang Bayan ) LGU (Mayor)
5 LMB
LGU (City Engineer’s Office MERALCO, NWR, PLDT
2 HLURB
LGU (Municipal Treasurer) 2
RD Assessor
Mother TCT
ECC
DEVELOPMENT PERMIT
Figure 3: continued

The increased complexity in permits and licensing for a residential subdivision
development requiring conversion approval can be seen in the number of
requirements and on the time spent to obtain the necessary permits and licenses
(Table 7). Between the period 1980-92 and 1992-98, the number of approving
personnel increased from about 27 persons to 155 persons. The number of permits
and licenses that have to be obtained also increased from 16 to 41 during the periods
in review. Moreover, while it took about five months in the 1980s to complete the
development process, it now takes 18 months to complete the same process.
Table 7: Residential Subdivision Development: Permits and Licensing
Year 1990 1998 No. of Agencies 9 31 Approx. No. of Approving Personnel 27 155 Total No. of Requirements 45 160 Time Frame (in months) a/ 4.5 18 No. of Permits/Clearance 16 41 No. of Repeating Requirements 6 16 a/Time frame under normal circumstances. There are cases when time is longer due to certain circumstances such as the following: (1) overlapping approved subdivision plans (LMB); (2) disagreements with farmers, tenants or illegal claimants; (3) disagreement among LGU personnel or between the LGU and national government agencies; (4) social pressure. Source: Report of the Office of Special Assistant to the Executive Vice President, Filinvest, 1998
4. Institutional Arrangements: Procedural Short-cuts and Relational Contracting
Sources of Transaction Costs in the Urban Real Estate Market
Institutional arrangements refer to the agreements among economic units in a
specified domain that govern the way in which these units can cooperate to allow
economic exchanges (Williamson 1991:287). It is hypothesized that these institutions
arise because of the presence of transaction costs in economic transactions.
Institutions provide the ways to reduce or economize on these costs.
Transaction costs in the land and real estate market are mainly due to the high
level of uncertainties to which transactions are subjected. These uncertainties arise
from the inherent character of land and the institutional constraints in land
development. Land and real estate are goods of experience quality. The quality of
these goods cannot be established in brief ocular inspection but only during their use.
Moreover, “third parties” such as behavior of neighbors, proximity of property to
squatter colonies, changes in zoning ordinances of local authorities can influence the

29
values of real estate. Information about land and real estate transactions is limited.
The land and property market is generally “thin”. Each land or property is unique
thus similar transactions are rare and information about the market is scanty.
Moreover, land and real estate goods have high degrees of asset specificity.12
Land by its nature is a site-specific asset. The location of land determines the
suitability, profitability and costs of a particular development project. Land becomes
even more site-specific for certain purposes such as the expansion of a previous
subdivision project, when a contiguous large area is required or when a parcel of land
is needed for a “right-of-way”. Likewise, property rights, permits and licenses are
also asset specific. They refer to a particular person or legal entity; to a particular
parcel of land; and to a specific project or development. In particular, permits once
issued stipulate specific terms and time periods.
By its inherent character, the land and real estate goods put considerable
transaction costs in the market. In the case of the Philippines, these transaction costs
are exacerbated by institutional problems in land use planning. A major institutional
problem is the lack of technically updated comprehensive town plans for many
municipalities including those in Metro Manila. Town plans are supposedly the basis
for the approval of most permits and licenses. However, many town plans have been
inadequate in guiding land use management and urban planning. Some municipalities
in the country are either without town plans or with town plans that have not been
updated. Of the total municipalities in the country, 25.2% are still without town plans
as of 1998 (Table 8). Most municipalities have approved town plans but many have
not been updated since the 1980s. Under the 1991 local government code although
local governments are provided the authority to formulate their respective land use
and zoning plans, these plans have to be ratified by the HLURB for highly urbanized
cities13 or the sanggunian panlalawigan (provincial legislative body) for other
cities/municipalities (EO 72 1993). Without being ratified the revised town plans
should not be used as legal basis for land use approvals.
12 Asset specificity refers to the degree to which an asset can be redeployed to alternative uses without sacrifice of productive value (Williamson 1991:281). 13 Aside from Metro Manila, highly urbanized cities includes Baguio, Olongapo, Angeles, Lucena, Bacolod, Iloilo, Cebu, Mandaue, General Santos, Davao, Iligan, Cagayan de Oro and Butuan.

30
Table 8: Town Plan Review (as of June 1998) Region Total Cities and Approved Without
Municipalities Town Plans a/ Town Plans
CAR (Cordillera Autonomous Region) 78 32 46 Region I (Ilocos) 125 94 31 Region II (Cagayan Valley) 103 93 10 Region III (Central Luzon) 122 104 18 Region IV (Southern Tagalog) 223 172 51 NCR (Metro Manila) 17 17 0 Region V (Bicol) 115 80 35 Region VI (Western Visayas) 133 123 10 Region VII (Central Visayas) 132 105 27 Region VIII (Eastern Visayas) 143 91 52 Region IX (Western Mindanao) 78 62 16 Region X (Northern Mindanao) 80 63 17 Region XI (Southern Mindanao) 68 66 2 Region XII (Central Mindanao) 53 33 20 CARAGA b/ 73 63 10 ARMM (Autonomous Region in Muslim Mindanao)
87 37 50
Total 1630 1235 395 % to Total 100.0 75.8 24.2 a/ these are plans ratified by the HLURB or the sanggunian panlalawigan (provincial legislative body)
b/ consist of the provinces of Agusan, Surigao and Butuan City Source: Field Operations Support Group, HLURB
However, in many cases, the local governments without the approval of the
sanggunian bayan/ panlalawigan or the HLURB already implement their proposed
CLUPs. For instance, in Metro Manila, MMC Ordinance 81-01 is still the legally
recognized land use and zoning ordinance plan. Although most cities/municipalities
of Metro Manila have updated their comprehensive land use plans (CLUPs) these
“new” CLUPs have yet to be approved by their respective sanggunian bayan and/or
ratified by the HLURB. On the other hand, since these plans have not been approved
and in many cases not presented for public hearing, spot zoning or “piecemeal”
rezoning tends to dominate land use decisions. Most projects are also non-
conforming thus, clearance or approvals have to be obtained from the local councils
rather than from the municipal or city zoning officer. Obtaining approvals from the
local councils implies bureaucratic hassles. It may also happen that approved permits
are withdrawn (or retracted) due to public clamor. This system subjects the approval
process to political maneuverings. These problems are evident in the following cases:
a. The construction of a 10-story building along R-2 medium density residential zone in Quezon City. Under the R-2 zone the maximum building height should only be up to four floors. A nearby housing association complained to the HLURB against the developer. However, HLURB simply told the residents to wait because they still have to investigate and study the matter although construction has already reached the 6th floor. The residents filed a

31
case with the Ombudsman14 but the necessary clearances and permits from the LGU were found to be in order after many hearing postponements. The developer was not reprimanded because according to the court the developer “acted in good faith”. (Philippine Daily Inquirer, 24 November 1995)
b. The approval of a subdivision development permit of a 20-storey
condominium project in a medium density residential area in Quezon City. The sanggunian bayan reclassified the site into a special development zone to accommodate the development. However, there had been strong opposition by the residents and other institutions in the area. The opposition also got support from a sanggunian bayan board member. In one of the meetings of the sanggunian bayan, a cease and desist order was issued to the developer. (Interview with Administrative Officer, Quezon City Municipal Office, 16 July 1998)
c. The construction of a 17-storey condominium in an R-2 zone in Mandaluyong.
This was contested by nearby Homeowners Association who brought the matter to court. The ruling of the lower court favored the Homeowners. The court found the project a violation of the R-2 zone and the provisions for waste disposal and water system were found insufficient. The developer is preparing to appeal on the decision of the lower court to the Court of Appeals. (Philippine Daily Inquirer, 01 November 1998)
d. The summary approval of “controversial” updated zoning plans by the
sanggunian bayan of Parañaque without conducting the required formal hearings. In particular, residents of various subdivisions in Parañaque opposed the updated revised zoning plans prepared by the Office of the Mayor because this would convert areas along subdivision main roads into commercial zones and some parts into industrial zones. According to the Confederation of Homeowners Association, these land uses would aggravate the problem of water shortage, poor garbage collection and traffic congestion, which the local government could hardly provide. (Philippine Daily Inquirer, 01 June 1997)
At the metropolitan periphery, the problem is the technically unsound town plans
(Silva 1993). The Town Plans are not land use plans but physical plans prepared for
the built up areas. The focus of these Plans has been on the Poblacion (Town
Centers) while areas outside the built up areas have not received adequate attention.
These Plans also “have not been based on well conceived and valid land allocation
criteria nor followed an effective and systematic planning procedure” (Silva
1993:62). For instance, although guidelines have been provided for land use
classification, the extent to be allocated for non-agricultural uses has often been in
14This is a special court created during the Aquino’s administration, which had the powers to investigate and prosecute deplorable activities of government officials and employees.

32
excess of what was needed. In many municipalities, thus part of the land zoned for
non-agricultural purposes is presently either used for agriculture or is idle (Table 9).
Table 9: Unutilized Lands in Areas Zoned for Non-Agricultural Uses
Zoned Non-Agri Area % Built-up Area Province of Cavite Unutilized (hectares) (as of 1989)
Imus 282.0 16 General Trias 389.2 21 Dasmariñas 733.7 34 Naic 37.0 3
Source: Municipal Agrarian Reform Offices. W.P.T. Silva (1993) Land Use Conversion: Present Problems and Possible Solutions. Consultancy Report, FAO, p.69.
The result is conflicting decisions with regard to land conversion. For
instance, various cases of land conversion approvals have contradicted agrarian and
land reform laws. Some of these cases are shown in Table 10.
Table 10: Corporate Subdivisions, 1985-97 Name of Subdivision Location Area
(has.) Developer Land Use before
Conversion Sunshine Village Residential Subdivision
Gen. Trias, Cavite 12 State Land Investment Corp.
tenant-cultivated upland
Tierra Grande Residential Subdivision
Gen. Trias, Cavite 36 State Land Investment Corp
tenant-cultivated upland
Green Breeze Village 6 Gen. Trias, Cavite 80 Cityland Devt. Corp. tenant-cultivated upland Kingsland farm Gen. Trias, Cavite 50 AMA Devt. Corp. tenant-cultivated; rain-fed
and upland Arcontica Village Dasmariñas, Cavite 5.9 Arcontica Investment
Corp. tenant-cultivated, irrigated and upland
Don Gregorio Heights II Dasmariñas, Cavite 4.4 F & C Realty Corp. tenant-cultivated, irrigated and upland
Vine Village Dasmariñas, Cavite 20 Vine Devt. Corp tenant-cultivated upland Saint Anthony Village Dasmariñas, Cavite 19.9 Hone Devt. Inc. tenant-cultivated irrigated,
rain-fed and upland Green Breeze 4 Dasmariñas, Cavite 14 Cityland Devt. Corp. tenant-cultivated rain-fed
and upland Dasmariñas Industrial Residential Subdivision
Dasmariñas, Cavite 150 Dasmariñas Estates & Devt. Corp.
tenant-cultivated upland
NDC-Marubeni Industrial Dasmariñas, Cavite 230 Construction & Development Corp.
tenant-cultivated, irrigated, prime agri land
Meridien Homes Dasmariñas, Cavite 52 Meridien Properties Devt. Corp.
tenant-cultivated, irrigated and upland
Tierra Linda Subdivision Dasmariñas, Cavite 6 E.B. Verzosa Enterprise tenant-cultivated, irrigated St. Agnes Village Dasmariñas, Cavite St. Agnes Realty and
Devt. Corp. tenant-cultivated, irrigated rice land
BF Homes landbank prop. Dasmariñas, Cavite 500 B.F. Homes, Inc. tenant-cultivated upland DARA Subdivision Dasmariñas, Cavite 2.7 DARA Realty Corp. tenant-cultivated, irrigated Laguna International Industrial Park (LIIP)
Biñan, Laguna 114 LIIP, Inc. tenant -cultivated irrigated CARP beneficiaries
Capitol Golf and Country Club landbank
Rodriguez, Rizal 53.11 Capitol Golf and Country Club, Inc.
tenant-cultivated rain-fed
Republic Asahi Glass Industrial Plant
Bauan, Batangas 34.4 Republic asahi Glass Corp.
tenant-cultivated, rain-fed communal irrigation
Source: J.P. McAndrew Urban Usurpation , 1994, Tables 8 and 14 Case Brief of Land Conversion Reversals of the Office of the President. Office of Secretary Aguirre, 1997.

33
These factors have made the issuance of permits and licenses vague. The
results are the following: (1) delays in the land development process; (2)
uncertainties/confusion on whether the proper documents (i.e. permits, licenses,
clearances, etc) will be obtained at all; and (3) spot zoning and haphazard land
developments.
In particular, the delays and uncertainties due to the development control
process are the major sources of transaction costs in the urban land and real estate
market. Government officials can delay the issuance of permits given an environment
where zoning and land use laws are unclear, inconsistent and open to different
interpretations. Transaction with the state thus, is not a simple “yes” and “no” but a
bargaining process with all kinds of intermediary outcomes that can be subsequently
manipulated. This manner of providing approvals builds “mistrust” in the market.
On the side of the buyers there is a perception that quality standards (i.e. permits and
licences) can be bought. In the case of the suppliers (i.e. developers), the process of
permitting involves time-consuming procedures and uncertainties that result in direct
money costs.
It is observed that real estate development firms engage in a lot of contracting
and sub-contracting to economize on transaction costs. The schemes commonly used
in the market are the following: (1) grease/speed money; (2) procedural short-cuts; (3)
“Grease”/Speed Money 15
Informal contracting that involves “grease” or speed money has been a common
scheme applied in the bureaucratic maze of the development control process. The
confused state of government regulations pertaining to permits and licenses has
created a need to engage in relational contracting to obtain the permits and save on
time.
The practice of speed money seems evident on the following cases.
15 The term corruption is not used because it connotes moralistic meaning, immediately conveying a negative judgement.

34
a. A lawyer-developer had been pushing since 1994 the conversion of a 45-hectare
agricultural property in Dasmarinas, Cavite. He never gave in to grease money. Practically agricultural lands in the surrounding areas had been converted to other uses but only his lot remained unconverted. Had he given in to some people’s wishes, the conversion could have been pushed through. The developer appealed his case with the Supreme Court. (Interview with an Officer of CREBA, 19 January 1996)
b. A real estate developer stated that he had no complaints about the land conversion
process. It took him about a year to obtain conversion clearance. The company boasted of having the “technology” to facilitate conversions. “They know the proper channels, the papers to submit and the persons to approach”. The company did not deny that grease money was given but the cost was a very small percentage or component of development costs. The company also did not ask for “too big favors” thus grease money was also minimal. (Interview with an officer of a development firm, 15 April 1996)
c. A developer applied for a development permit for a 2.9-hectare land in Taytay, Rizal
in 1995. This lot was adjacent to a previous project developed in the same location. The development permit being applied for was basically Phase II of the same subdivision. It took the developer one year to obtain approval from the local government. The local government reasoned that the developer lacked some requirements. The developer thought otherwise since his proposed development was just the same as the previous project in an adjacent property. The developer had to pay the local government 100,000 pesos to facilitate the release of the permit. In the developer’s previous project that was approved by the HLURB, he also paid money but only for 10,000 pesos. (Interview with a developer, 10 May 1997)
d. A company developed a 60-hectare socialized housing project in Batangas. In 1995,
the company applied for a development permit from the local government. The mayor already asked for grease money from the start. The company was issued a development permit. A few months later, however, the mayor issued a cease and desist order (CDO) on the project. The company was restrained from continuing with the development. To lift the CDO, the mayor required the company to build a barangay road that had no direct effect on the project since access roads for the subdivision had been provided. However, the company gave in to the demands of the mayor. The company talked to the landowners of the land where the barangay road was supposed to be built. These landowners were selling their property at 3,000 pesos per square meter. The company did not buy the property because the cost was not recoverable. The company presented the problem to the mayor. The mayor looked for an alternative barangay road. The CDO was lifted after the company agreed to build the alternative road and provided some more money. The company bought the land in 1995 and was able to start development of the property in 1998. (Interview with a developer, 29 July 1998)
e. In Metro Manila, the “racket” among “grafters” in hierarchy was reported to start
from the barangay officials all the way up to the municipal or city mayors. The trick was to “delay” the issuance of permits. A barangay captain in one city made a million pesos by signing a “clearance” for a shopping mall under construction in his barangay. The captain also asked for two stalls in the projected shopping center. In a similar case, a mayor in one city demanded for a unit in a condominium that was to be constructed. He also requested that the contract for excavation and “filling” of foundations for the buildings being erected be awarded to a firm owned by him and his pals. (Philippine Star, 28 Oct. 1996, p.9)

35
f. A real estate corporation applied for the conversion of 44 parcels of agricultural land for residential, commercial and recreational uses. The Department of Agriculture initially certified the property to be “marginally to not economically suitable for agricultural purposes due to shallow soils, low fertility and absence of irrigation water”. The same report also indicated that the remaining coconut trees planted in the area were already senescent and economically unproductive due to old age. A soil investigation report submitted on a later date indicated that most properties were classified as “moderately to marginally suitable to agriculture”. Also the certification from the Philippine Coconut Authority (PCA) showed that the coconut trees were not senescent and were still economically productive. With regard to land use, the certifications issued by the Office of the Deputized Zoning Administrator (ODZA), Office of the City Planning and Development Coordinator, and the HLURB was inconsistent. The ODZA initially issued a preliminary approval and location clearance for the property applied for conversion, yet the same ODZA certified that the zoning classification is within the agricultural zone. A separate certification issued by the City Planning Office stated that 57.94-hectare of the 187-hectare property was certified as an industrial land in accordance with the city Land use and Zoning Plan approved by HLURB under Resolution No.35, series of 1981. Later another certification was issued by HLURB stating that the property has been reclassified as residential, commercial and recreational per Ordinance No. 04-95.
An ocular inspection by the PARC and the regional CLUPPI also found that while the application was in process, 70 percent of the entire area had been developed into a golf course. Although the PARC Land Use Technical Committee recommended the disapproval of the land use conversion application, the DAR Secretary eventually approved the application. The reasons for its eventual approval were as follows: (1) there was no opposition to the application; (2) there was no displacement of potential farmer-beneficiaries; (3) the area was very close to the city proper; (4) the area was part of the retention area 16 of the different small landowners. (P.Gordoncillo, C. Aragon, T.
Llorito. A Study on the Impact of Land Use Conversion on CARP p.35-36)
g. The Office of a municipal mayor granted approval of development permits to applicants who requested for reclassification of agricultural lands without securing DAR clearance. Similar cases were reported in a study in Cavite. Of the 401 cases of irregularities reported in the approval of land conversion, 97 percent were due to the failure to secure clearance from DAR. Instead, the Municipal Assessor’s Office and the HLURB approved the applications. (D. Cardenas. 1996. An Assessment of the Socio-economic
Impact of Agricultural Land Conversion on Cavite’s Rural Communities. PhD Dissertation. University of the
Philippines at Los Baños, College of Economics and Management)
What seems apparent in these cases is that grease or speed money is being used
to facilitate approval, to reduce transaction time and to be more or less assured of the
outcome of transactions. The foremost view is that speed money is corruption and
morally bad and should be prohibited. The United Nations and the World Bank also
shares this view. Both institutions are in fact campaigning against corruption. On the
other hand, the view among some socio-economists is that corruption is related to
personalism in economic life. It is a form of relational contracting and that there are
16 Under the comprehensive agrarian reform law, landowners and their heirs are allowed to retain a portion of their property. The legal retention is 5 hectares per landowner plus an additional 3 hectares per heir.
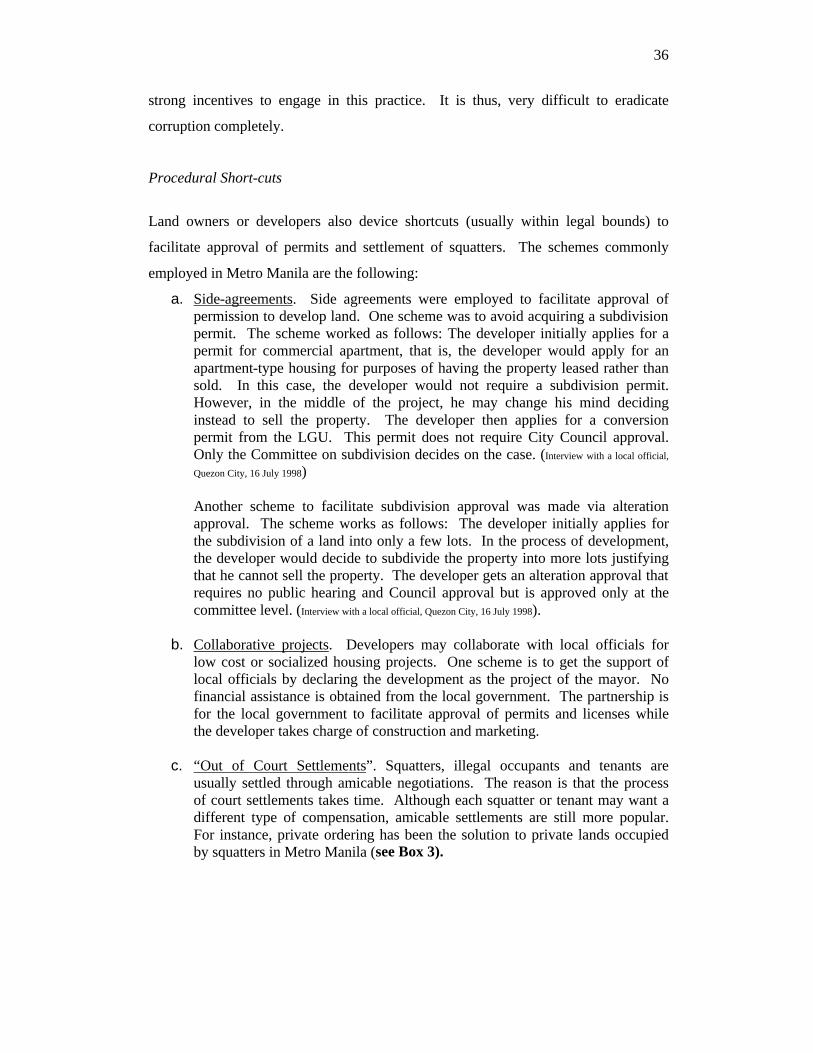
36
strong incentives to engage in this practice. It is thus, very difficult to eradicate
corruption completely.
Procedural Short-cuts
Land owners or developers also device shortcuts (usually within legal bounds) to
facilitate approval of permits and settlement of squatters. The schemes commonly
employed in Metro Manila are the following:
a. Side-agreements. Side agreements were employed to facilitate approval of permission to develop land. One scheme was to avoid acquiring a subdivision permit. The scheme worked as follows: The developer initially applies for a permit for commercial apartment, that is, the developer would apply for an apartment-type housing for purposes of having the property leased rather than sold. In this case, the developer would not require a subdivision permit. However, in the middle of the project, he may change his mind deciding instead to sell the property. The developer then applies for a conversion permit from the LGU. This permit does not require City Council approval. Only the Committee on subdivision decides on the case. (Interview with a local official,
Quezon City, 16 July 1998) Another scheme to facilitate subdivision approval was made via alteration approval. The scheme works as follows: The developer initially applies for the subdivision of a land into only a few lots. In the process of development, the developer would decide to subdivide the property into more lots justifying that he cannot sell the property. The developer gets an alteration approval that requires no public hearing and Council approval but is approved only at the committee level. (Interview with a local official, Quezon City, 16 July 1998).
b. Collaborative projects. Developers may collaborate with local officials for low cost or socialized housing projects. One scheme is to get the support of local officials by declaring the development as the project of the mayor. No financial assistance is obtained from the local government. The partnership is for the local government to facilitate approval of permits and licenses while the developer takes charge of construction and marketing.
c. “Out of Court Settlements”. Squatters, illegal occupants and tenants are
usually settled through amicable negotiations. The reason is that the process of court settlements takes time. Although each squatter or tenant may want a different type of compensation, amicable settlements are still more popular. For instance, private ordering has been the solution to private lands occupied by squatters in Metro Manila (see Box 3).

37
Box 3 Cases of “Out of Court” Settlement of Squatters 1. FVR Project17
The FVR project located in Guirayan St, Quezon City is a low cost 5-storey walk-up condominium built in 1995. The project was conceived by New San Jose Builders (NSJB), Inc., which named the project after President Ramos. The land where the project stands was previously a squatter area owned by a family. Squatters who have been residents of the area for more than 20 years occupied the land. In 1994, NSJB saw potential on the land and submitted a proposal to the landowner for the development of the area. The proposal was to subdivide the land into four parcels. One parcel was to be developed into medium rise housing for the existing squatters (FVR Project). Each unit had an area of 15 square meters with complete sanitation and basic facilities (water, electricity and access roads). The units built were more than enough to accommodate the existing squatters thus, some units were sold to squatters who were not from the area. The company as payment for the development of the land plus profits obtained another parcel. Two land parcels remained with the landowner.
After the landowner agreed to the proposal, NSJB sought the help of Quezon City Congressman
Belmonte to sponsor the project such that the development and financing from the HDMF can be facilitated. Most units in the medium rise condo were financed through HDMF. For other units, the company’s in-house financing provided the housing loan. The landowner was paid the cost of the land from the loans obtained from HDMF. 2. Filinvest Batasan
Filinvest saw potential in a privately owned land around the Batasan area of Quezon City. Upon the
survey of the land, Filinvest found that squatters have settled in the property. In 1973, Filinvest offered to buy the property from the landowner. The landowner agreed to sell the property at a price of P30 per square meter on condition that clearing the land from squatters will be the responsibility of the company. Filinvest negotiated with the squatters and the agreement was that part of the property would be developed for the squatters' housing. In 1978, Filinvest started developing the property into high-end residential subdivision. The company developed a portion of the property for the affected squatters. Titles to the land were provided to each squatter household. Likewise, the company assisted the squatters in obtaining financing for house improvement from the NHA.
3. SMILE CITIHOMES I18
The project is a five-storey medium rise housing located in Novaliches, Quezon City. It was developed by the PHINMA company in collaboration with the city government of Quezon City. Squatters previously occupied the land. Part of the condition of the sale was for the company to identify the project as a housing project mainly for employees of the city government. In turn the city government will take care of relocating the existing squatters and facilitate funding release under the NHA’s housing program for local government units.
In agrarian communities, farmer-beneficiaries engage themselves in pre-arranged compensation. In this case when the landowner/developer files the application for conversion, DAR need not deal with tenants or farmers (Table 11). The landowners and farmers arrive at different agreements. Compensation may range from cash to homelots or farmlots including employment. In some cases negotiated land transfers are employed. Negotiated land transfer involves an agreement between the landowner, DAR and farmer-beneficiaries to exempt a certain portion of the entire landholding in exchange for the smooth and uncontested transfer of the remaining lands to
17Interview with an officer of NSJB, 31 July 1997. 18Interview with an officer of PHINMA Properties, 16 June1997.
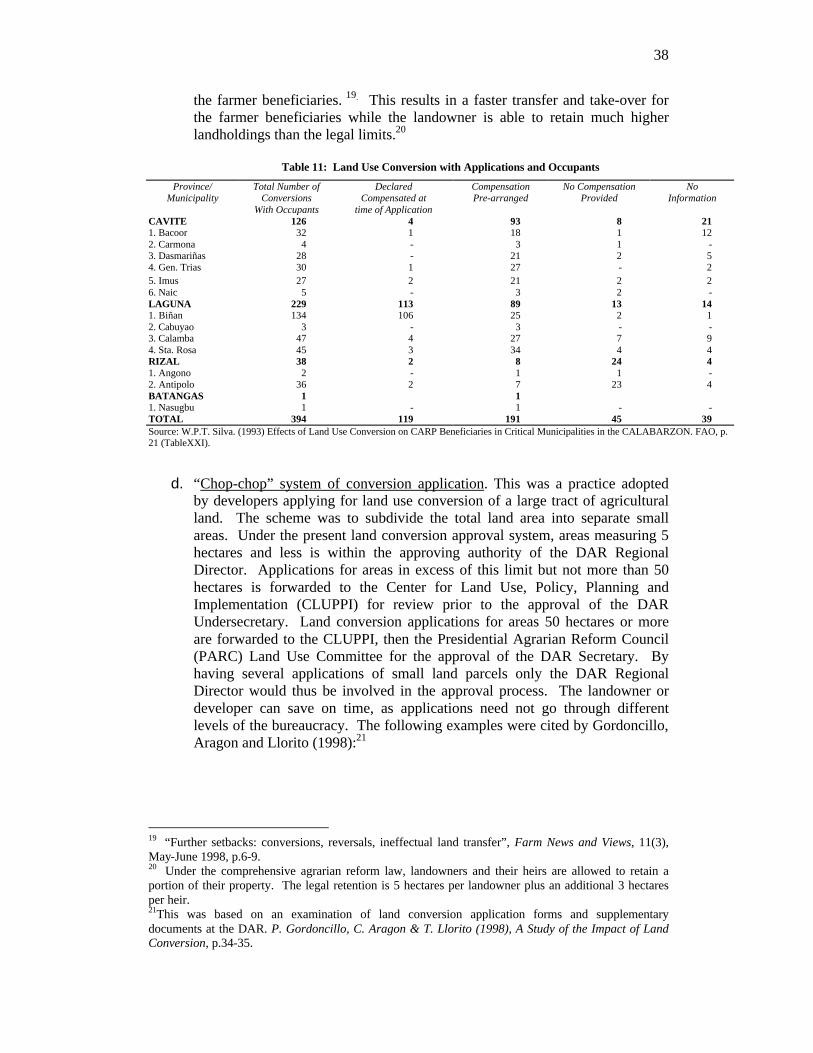
38
the farmer beneficiaries. 19. This results in a faster transfer and take-over for the farmer beneficiaries while the landowner is able to retain much higher landholdings than the legal limits.20
Table 11: Land Use Conversion with Applications and Occupants
Province/ Total Number of Declared Compensation No Compensation No Municipality Conversions Compensated at Pre-arranged Provided Information
With Occupants time of Application CAVITE 126 4 93 8 21 1. Bacoor 32 1 18 1 12 2. Carmona 4 - 3 1 - 3. Dasmariñas 28 - 21 2 5 4. Gen. Trias 30 1 27 - 2 5. Imus 27 2 21 2 2 6. Naic 5 - 3 2 - LAGUNA 229 113 89 13 14 1. Biñan 134 106 25 2 1 2. Cabuyao 3 - 3 - - 3. Calamba 47 4 27 7 9 4. Sta. Rosa 45 3 34 4 4 RIZAL 38 2 8 24 4 1. Angono 2 - 1 1 - 2. Antipolo 36 2 7 23 4 BATANGAS 1 1 1. Nasugbu 1 - 1 - - TOTAL 394 119 191 45 39 Source: W.P.T. Silva. (1993) Effects of Land Use Conversion on CARP Beneficiaries in Critical Municipalities in the CALABARZON. FAO, p. 21 (TableXXI).
d. “Chop-chop” system of conversion application. This was a practice adopted by developers applying for land use conversion of a large tract of agricultural land. The scheme was to subdivide the total land area into separate small areas. Under the present land conversion approval system, areas measuring 5 hectares and less is within the approving authority of the DAR Regional Director. Applications for areas in excess of this limit but not more than 50 hectares is forwarded to the Center for Land Use, Policy, Planning and Implementation (CLUPPI) for review prior to the approval of the DAR Undersecretary. Land conversion applications for areas 50 hectares or more are forwarded to the CLUPPI, then the Presidential Agrarian Reform Council (PARC) Land Use Committee for the approval of the DAR Secretary. By having several applications of small land parcels only the DAR Regional Director would thus be involved in the approval process. The landowner or developer can save on time, as applications need not go through different levels of the bureaucracy. The following examples were cited by Gordoncillo, Aragon and Llorito (1998):21
19 “Further setbacks: conversions, reversals, ineffectual land transfer”, Farm News and Views, 11(3), May-June 1998, p.6-9. 20 Under the comprehensive agrarian reform law, landowners and their heirs are allowed to retain a portion of their property. The legal retention is 5 hectares per landowner plus an additional 3 hectares per heir. 21This was based on an examination of land conversion application forms and supplementary documents at the DAR. P. Gordoncillo, C. Aragon & T. Llorito (1998), A Study of the Impact of Land Conversion, p.34-35.

39
(a) A real estate developer owning a 400-hectare agricultural land in Lipa City,
Batangas submitted 100 folders or land use conversion applications to the DAR regional office. Each folder contains land titles having an area of 5 or less hectares;
(b) A glass manufacturing company applied for conversion for the industrial use of a 34-hectare communal irrigated rice lands in Bauan, Batangas. The company submitted eight application folders with each application folder containing land titles having an aggregate of less than five hectares.
5. Transaction Costs and Urban Real Estate Prices
Transaction-economizing strategies have been undertaken by developers primarily to
speed up the process of accomplishing the regulatory requirements of land
development. One possible indicator of transaction costs thus is the time spent to
obtain permits and licenses. Table 12 shows that the whole process of land
development takes an average of about 2 years and 5 months. Obtaining permits and
licenses uses the most time. This activity accounts for 43.6% of the total time spent in
the land development process. In particular, the approval of the DAR conversion
clearance and the environmental compliance certificate uses the most time.
However, the time spent for specific permits is variable. Data on land use
conversion show no clear pattern on time spent. The time spent in obtaining approval
of conversion for residential purposes has been very variable ranging from 2 months
to as long as 5 years (Table 13). In general, most conversion applications for
residential development have been approved within a year, specifically within 4 to 6
months. The number of applications approved after a year up to two years has also
been substantial. On the other hand, there are also applications approved only after 3
to 5 years specifically in the CALABARZON region.
The reason for the discrepancies in time spent cannot be attributed to either
land size or locality (barangay) as correlation analysis shows a weak correlation
between time spent and land size or locality. It is thus possible that other factors may
have hindered or facilitated land conversions. And transaction-cost economizing
strategies of developers could have made a difference in the time spent on land
conversion approvals.
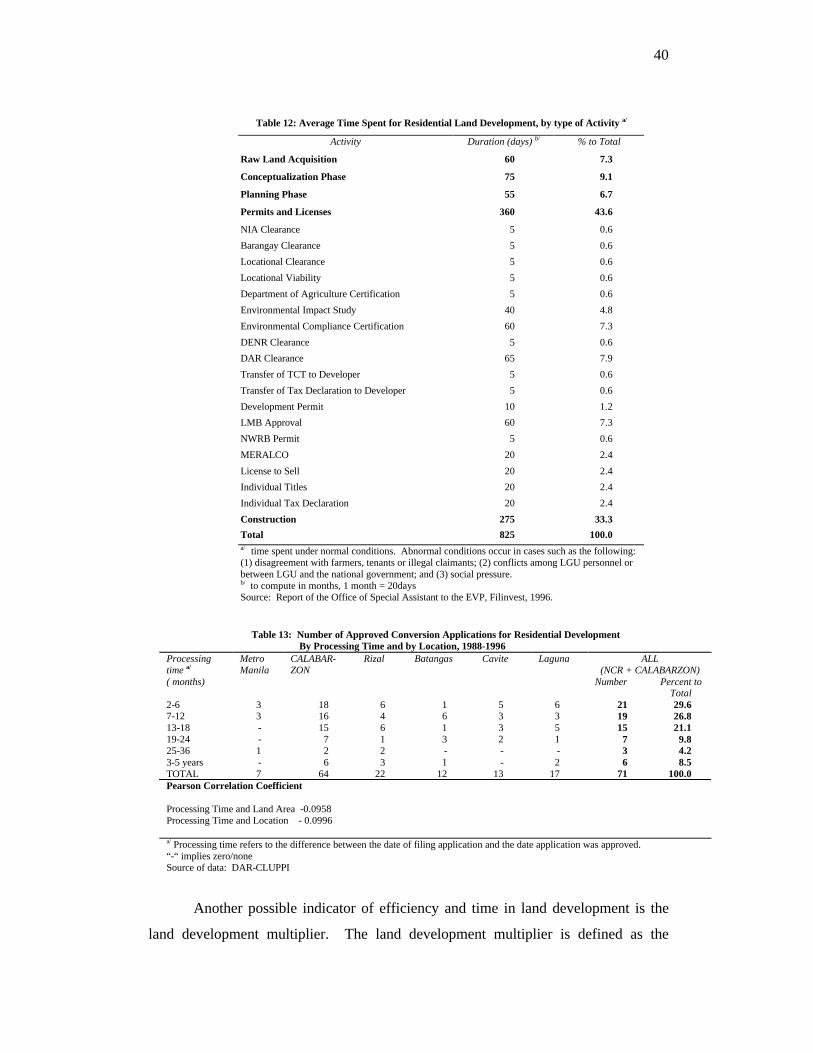
40
Table 12: Average Time Spent for Residential Land Development, by type of Activity a/
Activity Duration (days) b/ % to Total
Raw Land Acquisition 60 7.3
Conceptualization Phase 75 9.1
Planning Phase 55 6.7
Permits and Licenses 360 43.6
NIA Clearance 5 0.6
Barangay Clearance 5 0.6
Locational Clearance 5 0.6
Locational Viability 5 0.6
Department of Agriculture Certification 5 0.6
Environmental Impact Study 40 4.8
Environmental Compliance Certification 60 7.3
DENR Clearance 5 0.6
DAR Clearance 65 7.9
Transfer of TCT to Developer 5 0.6
Transfer of Tax Declaration to Developer 5 0.6
Development Permit 10 1.2
LMB Approval 60 7.3
NWRB Permit 5 0.6
MERALCO 20 2.4
License to Sell 20 2.4
Individual Titles 20 2.4
Individual Tax Declaration 20 2.4
Construction 275 33.3
Total 825 100.0 a/ time spent under normal conditions. Abnormal conditions occur in cases such as the following: (1) disagreement with farmers, tenants or illegal claimants; (2) conflicts among LGU personnel or between LGU and the national government; and (3) social pressure. b/ to compute in months, 1 month = 20days Source: Report of the Office of Special Assistant to the EVP, Filinvest, 1996.
Table 13: Number of Approved Conversion Applications for Residential Development By Processing Time and by Location, 1988-1996 Processing time a/
Metro Manila
CALABAR- ZON
Rizal Batangas Cavite Laguna ALL (NCR + CALABARZON)
( months) Number Percent to Total
2-6 3 18 6 1 5 6 21 29.6 7-12 3 16 4 6 3 3 19 26.8 13-18 - 15 6 1 3 5 15 21.1 19-24 - 7 1 3 2 1 7 9.8 25-36 1 2 2 - - - 3 4.2 3-5 years - 6 3 1 - 2 6 8.5 TOTAL 7 64 22 12 13 17 71 100.0 Pearson Correlation Coefficient Processing Time and Land Area -0.0958 Processing Time and Location - 0.0996 a/ Processing time refers to the difference between the date of filing application and the date application was approved. “-“ implies zero/none Source of data: DAR-CLUPPI
Another possible indicator of efficiency and time in land development is the
land development multiplier. The land development multiplier is defined as the

41
average ratio between the median land price of a developed plot at the urban fringe in
a middle-income subdivision and the median price of raw, undeveloped land in an
area currently being developed (World Bank 1993). In 1990, the World Bank
conducted an extensive survey of housing from which land development multipliers
from different countries were obtained. The result of this survey showed that the land
development multiplier for residential development in the country was the highest
among neighboring countries in Southeast Asia and East Asia (Table 14). The
Philippines land development multiplier was posted at 6.7 while the other countries
had a multiplier of less than or equal to 2 (with the exception of Malaysia which had a
development multiplier of 4.3). The high multiplier also coincided with longer
permits delay (with the exception of Indonesia).
Data on real estate prices in the Philippines support this finding. The
development multiplier is noted to be even higher in the CALABAR areas compared
to Metro Manila.
Apparently in the Philippines, housing consumers pay a large margin over the
price of raw land. The question is whether this large margin arises from high
transaction costs, high construction costs or “abnormal” (monopoly) profits of
developers. Data on construction costs from the same World Bank survey in 1990
show that construction costs are lowest in the country compared to other Asian
countries. On the other hand, Japan, Singapore and Hong Kong with very low land
development multipliers have very high construction costs. The high multiplier in the
Philippines thus, does not result from production costs but from either transaction
costs or “monopoly” profits.
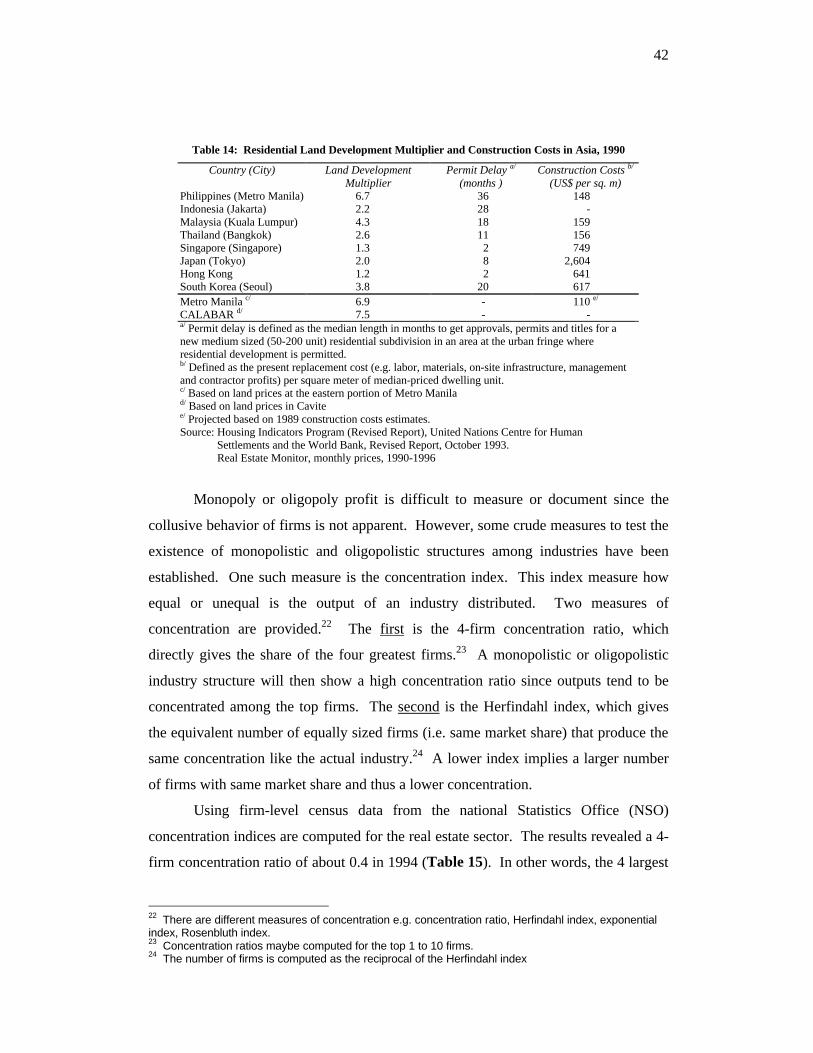
42
Table 14: Residential Land Development Multiplier and Construction Costs in Asia, 1990
Country (City) Land Development Permit Delay a/ Construction Costs b/ Multiplier (months ) (US$ per sq. m)
Philippines (Metro Manila) 6.7 36 148 Indonesia (Jakarta) 2.2 28 - Malaysia (Kuala Lumpur) 4.3 18 159 Thailand (Bangkok) 2.6 11 156 Singapore (Singapore) 1.3 2 749 Japan (Tokyo) 2.0 8 2,604 Hong Kong 1.2 2 641 South Korea (Seoul) 3.8 20 617 Metro Manila c/ 6.9 - 110 e/ CALABAR d/ 7.5 - - a/ Permit delay is defined as the median length in months to get approvals, permits and titles for a new medium sized (50-200 unit) residential subdivision in an area at the urban fringe where residential development is permitted. b/ Defined as the present replacement cost (e.g. labor, materials, on-site infrastructure, management and contractor profits) per square meter of median-priced dwelling unit. c/ Based on land prices at the eastern portion of Metro Manila d/ Based on land prices in Cavite e/ Projected based on 1989 construction costs estimates. Source: Housing Indicators Program (Revised Report), United Nations Centre for Human Settlements and the World Bank, Revised Report, October 1993. Real Estate Monitor, monthly prices, 1990-1996
Monopoly or oligopoly profit is difficult to measure or document since the
collusive behavior of firms is not apparent. However, some crude measures to test the
existence of monopolistic and oligopolistic structures among industries have been
established. One such measure is the concentration index. This index measure how
equal or unequal is the output of an industry distributed. Two measures of
concentration are provided.22 The first is the 4-firm concentration ratio, which
directly gives the share of the four greatest firms.23 A monopolistic or oligopolistic
industry structure will then show a high concentration ratio since outputs tend to be
concentrated among the top firms. The second is the Herfindahl index, which gives
the equivalent number of equally sized firms (i.e. same market share) that produce the
same concentration like the actual industry.24 A lower index implies a larger number
of firms with same market share and thus a lower concentration.
Using firm-level census data from the national Statistics Office (NSO)
concentration indices are computed for the real estate sector. The results revealed a 4-
firm concentration ratio of about 0.4 in 1994 (Table 15). In other words, the 4 largest
22 There are different measures of concentration e.g. concentration ratio, Herfindahl index, exponential index, Rosenbluth index. 23 Concentration ratios maybe computed for the top 1 to 10 firms. 24 The number of firms is computed as the reciprocal of the Herfindahl index
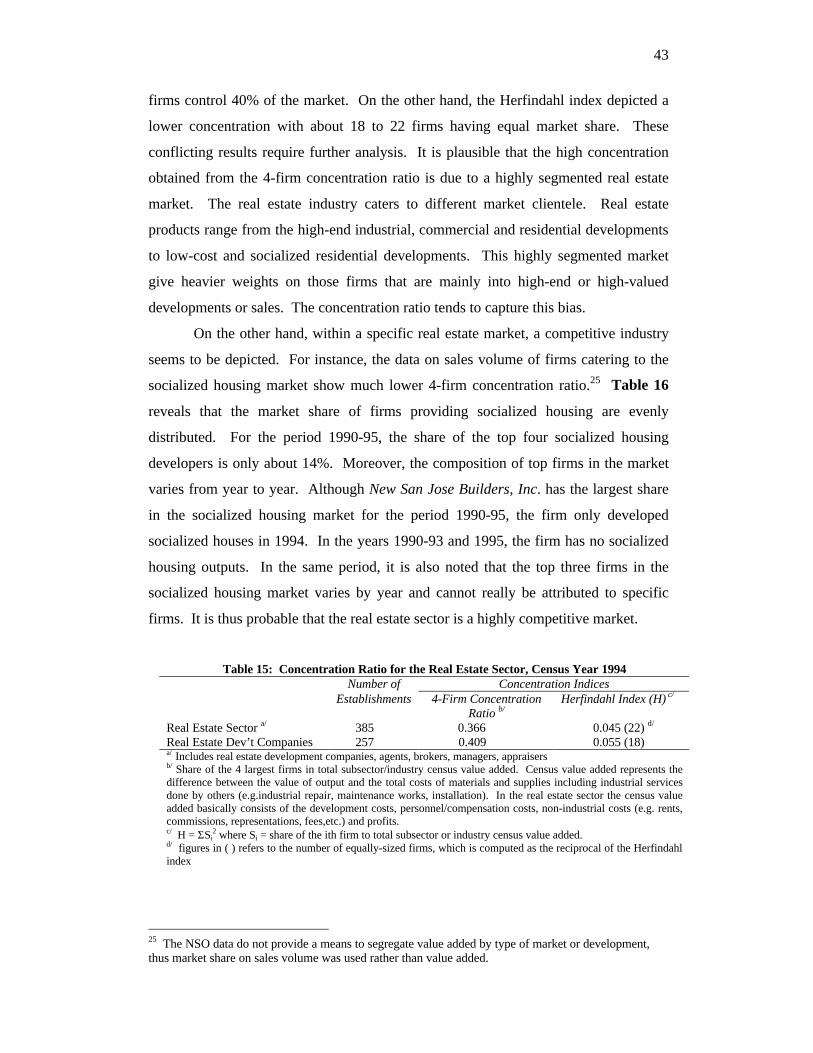
43
firms control 40% of the market. On the other hand, the Herfindahl index depicted a
lower concentration with about 18 to 22 firms having equal market share. These
conflicting results require further analysis. It is plausible that the high concentration
obtained from the 4-firm concentration ratio is due to a highly segmented real estate
market. The real estate industry caters to different market clientele. Real estate
products range from the high-end industrial, commercial and residential developments
to low-cost and socialized residential developments. This highly segmented market
give heavier weights on those firms that are mainly into high-end or high-valued
developments or sales. The concentration ratio tends to capture this bias.
On the other hand, within a specific real estate market, a competitive industry
seems to be depicted. For instance, the data on sales volume of firms catering to the
socialized housing market show much lower 4-firm concentration ratio.25 Table 16
reveals that the market share of firms providing socialized housing are evenly
distributed. For the period 1990-95, the share of the top four socialized housing
developers is only about 14%. Moreover, the composition of top firms in the market
varies from year to year. Although New San Jose Builders, Inc. has the largest share
in the socialized housing market for the period 1990-95, the firm only developed
socialized houses in 1994. In the years 1990-93 and 1995, the firm has no socialized
housing outputs. In the same period, it is also noted that the top three firms in the
socialized housing market varies by year and cannot really be attributed to specific
firms. It is thus probable that the real estate sector is a highly competitive market.
Table 15: Concentration Ratio for the Real Estate Sector, Census Year 1994 Number of Concentration Indices Establishments 4-Firm Concentration
Ratio b/ Herfindahl Index (H) c/
Real Estate Sector a/ 385 0.366 0.045 (22) d/ Real Estate Dev’t Companies 257 0.409 0.055 (18) a/ Includes real estate development companies, agents, brokers, managers, appraisers
b/ Share of the 4 largest firms in total subsector/industry census value added. Census value added represents the difference between the value of output and the total costs of materials and supplies including industrial services done by others (e.g.industrial repair, maintenance works, installation). In the real estate sector the census value added basically consists of the development costs, personnel/compensation costs, non-industrial costs (e.g. rents, commissions, representations, fees,etc.) and profits. c/ H = ΣSi
2 where Si = share of the ith firm to total subsector or industry census value added. d/ figures in ( ) refers to the number of equally-sized firms, which is computed as the reciprocal of the Herfindahl index
25 The NSO data do not provide a means to segregate value added by type of market or development, thus market share on sales volume was used rather than value added.

44
Table 16: Top 20 Socialized Subdivision Developers (BP-220), Expanded NCR (ENCR)a, 1990-1995 (number of units )
Rank Developers 1990 1991 1992 1993 1994 1995 1990-95
Total % Share
1 New San Jose Builders, Inc. - - - - 5,481 - 5,481 4.3
2 Household Development Corp. - 209 2,163 1,382 33 318 4,105 3.2
3 Palao Construction and Dev. Corp. 2,012 - 1,987 - - - 3,999 3.2
4 Palmera Homes, Inc. - 1,553 645 1,310 180 3,688 2.9
5 Inter Venture Realty Corp. - - - 2,621 - 2,621 2.1
6 Stateland Investment Corp. - 1,211 - 1,360 - - 2,571 2.0
7 Legacy Homes, Inc. - - - 901 1,288 - 2,189 1.7
8 Futuristic Properties - - - 580 1,575 - 2,155 1.7
9 La Paz Housing and Dev. Corp. 1,397 - - - - 708 2,105 1.7
10 Durawood Construction Corp. - 93 517 770 - 494 1,874 1.5
11 Molino Homes, Inc. - 679 - - 1,185 - 1,864 1.5
12 National Housing Authority (NHA) 1,360 - - - - 482 1,842 1.5
13 Freedom to Build - 609 1,163 - - - 1,772 1.4
14 Timberland Properties, Icn. - - 727 591 - - 1,318 1.0
15 Carville Homes Construction Mgnt. - - 1,306 - - - 1,306 1.0
16 Landhaus Properties Dev. Corp. - - - - 1,293 - 1,293 1.0
17 AFP Retirement and Separation 948 214 - - - - 1,162 0.9
18 Trihead Development Corp. 178 148 368 421 - - 1,115 0.9
19 Filinvest Development Corp. - - - 874 213 - 1,087 0.9
20 Golden Bay Realty and Dev. Corp. 620 - - 426 - - 1,046 0.8
Sub-Total Top 20 Developers 6,515 4,716 8,876 8,615 13,689 2,182 44,593 35.2
Total ENCR Housing Production 16,497 17,749 13,954 10,295 26,108 41,931 126,534 100 a/ Expanded NCR include production in the NCR region, Bulacan and in Region 4 (Palawaan, Laguna, Batangas, Cavite, Rizal) Source: HLURB approved “license to sell” projects
6. Conclusions and Policy Recommendations
Economic actors are not passive participants in the market. They will
economize on transaction costs through different institutional arrangements. The
argument is that in a high transaction cost environment, firms may choose to “make”
things themselves, that is, to bring production under a hierarchical arrangement
(expansion) rather than rely on the market. Firms may also engage in “hybrid”
arrangements (e.g. long-term contracts, reciprocal sales, franchising, etc.). However,
“hybrid” arrangements work only among private entities. In the case of private sector
and government transactions this type of arrangement may not always be applicable.
The reason is that planning permissions cannot be made arbitrary or be governed by
elastic contracting mechanism (i.e. bargaining). This being so, firms will find other
ways to internalize the high transaction costs of dealing with government. Informal
contracting is one way. In particular, procedural short-cuts and grease or speed
45
money have been the popular forms of informal contracts in the land and real estate
market.
Procedural “short-cuts” are adopted to avoid litigation procedures that are
tedious and costly or to minimize bureaucratic hassles. One scheme is the pre-
settlement or “out of court” settlements of squatters, tenants or farmers. Developers
prefer amicable negotiations to litigation. In agrarian lands, pre-settlement of tenants
is common such that tenants will not create problems and pressure government to
withhold issuance of permits.
Collaborating with local governments for specific projects is also another way
to reduce bureaucratic hassles. Under the 1991 local government code, issuance of
most permits and clearances has been devolved to the local government units. By
making the local government part of the development project even without the
infusion of capital, the approval of permits and licenses can be facilitated.
Another procedural short cut is the use of side agreements. The idea is to
avoid the tedious requirements of the land development permit by initially applying
for a construction permit and later converting this permit into a development permit.
In obtaining land conversion clearance, a common practice among landowners
or developers is the “chop-chop” system. In this scheme, landowners or developers
who seek conversion clearance for a big tract of agricultural land subdivide the total
area into small parcels (i.e. 5 hectares or less). Through this scheme, the developer
avoids going through the bureaucratic processes at the DAR Central office, where
permits for larger land parcels (i.e. more than 5 hectares) would have to be processed.
It is more manageable to obtain land conversion approval for five hectares or less
since this can be done at the regional level.
Another form of relational contracting is the use of “speed” money. The
unclear and inconsistent laws on land use and zoning create a chance for government
employees or officials to use the situation for personal gains. Since one is unsure
whether the permit will be granted or when the permit will be granted, transactions
with government have become a bargaining process. “Grease” or “speed” money is a
possible and logical choice as this allows things to get done. It can facilitate approval.
The experience of developers show that monies speeded up the issuance of permits
and brought about approvals for development projects that could not have been given
planning permission under certain laws.

46
The high transaction costs in the market has been reflected in the higher price
of developed real estate properties. The Philippines has the highest land development
multiplier vis-à-vis other Asian countries. The land development multiplier of 6.7 for
medium scale residential development implies that the price of raw land is about
seven times the price of developed land. This is high compared to a multiplier of
about 2 in neighboring Asian countries.
High transaction costs in the urban land and real estate market arise primarily
from confusing regulations in obtaining permits and licenses. Although these costs
have been internalized through different forms of market organization, these forms do
not imply an alternative to regulation. The reason is that institutions that arise are not
necessarily morally acceptable. For instance, the use of speed or grease money
creates the impression of “opportunistic” government officials and developers. This
practice also defeats the purpose of instituting development controls in the country
and creates more uncertainties in the market. Moreover, “speed” money do not
permanently reduce or eliminate transactions costs, and does not necessarily work in
all cases.
Although it is difficult to totally eradicate “speed” money in the real world,
this practice can be minimize through clearer guidelines and better monitoring system.
“Speed” money takes place within a principal-agent-client interaction with the central
government as the principal, the local government as the agent, and the developer as
the client. Monitoring and control between the principal and the agent becomes more
difficult when there are no institutional mechanisms that would provide the check and
balance specifically with regard to local development planning. Moreover,
contradicting policies have to be corrected. In particular, there is an apparent
contradiction in Philippine land use policies. On the one hand, the government wants
industry to expand and housing to improve. But on the other hand, there are strong
barriers to expanding the industrial and residential areas because of agrarian zoning
and DAR regulations. This contradiction is probably widely spread in the world but it
creates a real problem in countries where government sends confusing signals on its
land use policy.
The land and real estate market works well in an environment with strong
government presence. While the recent view is that “perfect markets” work better
with minimal government intervention, this condition apparently does not work in the
case of commodity land. Where government has been aloof in land planning, the

47
result is misuse, land speculation, and high transaction costs. Strong and more direct
government presence seems necessary in the land and real estate market. The reason
is that land unlike other commodities is non-reproducible and produces significant
externalities. This does not imply that all lands should be publicly owned. Instead,
government should directly intervene in land use allocation and play a prominent role
in the land market through land use planning and urban management.

48
REFERENCES
Alba, M.S. 1997. The Local Government Administration in the Light of the Decentralization Thrust. Paper presented in the Symposium in Honor of Dr. Gerardo Sicat and Dr. Jose Encarnacion, Jr. Philippine Institute for Development Studies. Philippine Trade Training Center, September 23-25, 1997 Aquino, S.G. 1969. Urban Planning: The Case of Metropolitan Manila. Local Government Bulletin 4:1-15. Arellano, J.M. 1919. The Bureau of Public Works Bulletin 7(4) Ballesteros, M. 2000. The Urban Land and Real Estate Market. PhD. Dissertation in Social Science. University of Nijmegen, the Netherlands. Cabanilla, A.Q. 1996. Sustainable Development in Urban Management: The Metro Manila Experience. Paper Presented at the lecture-forum on Urban Environmental Management for Sustainable Development. Pasig: Development Academy of the Philippines. March 7, 1996. Caoili, A.M. 1988. The Origins of Metropolitan Manila: A Political and Social Analysis. Quezon City: New Day Publishers. Corpuz, O.D. 1997. An Economic History of the Philippines. Quezon City: University of the Philippines Press. Doeppers, D. 1981. Construction Cycles in Prewar Manila. Philippine Studies 31:189-215. Feliciano & Co. 1996. Condoliving/Condo Factbook. Manila. Gordoncillo,P. C. Aragon and T. Llorito. 1998. A Study on the Impact of Land Use Conversion on CARP. Consultancy Report. UNDP/SARDIC Programme. Hollnsteiner, M.R. 1969. The Urbanization of Metro Manila. Paper Presented in the Foundations of Filipino Society. Manila: Research Foundation in Philippine Anthropology and Archaeology. Manapat, R. 1991. Some Are Smarter than Others. The History of Marcos Crony Capitalism. New York: Aletheia Publications. Mandelbaum, C. 1929. The Bureau of Public Works Bulletin 17 (1). McAndrew, J.P. 1994. Urban Usurpation: From Friar Estates to Industrial Estates in a Philippine Hinterland. Quezon City: Ateneo University Press. Metro Manila Commission. 1981. Towards the City of Man, The Metro Manila Approach to Urban Management. Quezon City.

49
____________________. Metro Manila Zoning Ordinance, 81-01. Naerssen van T, M. Lighart and F. Zapanta. 1995. Managing Metropolitan Manila. The Dynamics of Metro Management in Southeast Asia. Edited by J. Ruland. Singapore: Institute of South East Asian Studies. Ocampo, R.B. 1992. Planning and Development in Prewar Manila: Historical Glimpses of Philippine City Planning. Philippine Journal of Public Administration 36:305-327. Pernia, E. 1977. Urbanization, Population Growth and Economic Development in the Philippines. Westport, Connecticut and London: Greenwood Press. Pernia, E, C. Paderanga and V. Hermoso. 1983. The Spatial and Urban Dimensions of Development in the Philippines. Manila: Philippine Institute for Development Studies. Santico, F.C. 1953. The Planning Function in the Philippines. Michigan: Institute of Public Administration. Silva, W.P.T. 1993. Land Use Conversion: Present Problems and Possible Solutions. Consultancy Report. FAO. Technical Support to Agrarian Reform and Rural Development Project. Stich, A. 1995. Insurance and Concentration: The Change of Concentration in the Swedish and Finnish Insurance Market 1989-1993. Discussion Papers in Statistics and Econometrics. No. 10. Paper presented in a Seminar of Economic and Social Statistics, University of Cologne. Wernstedt, F.L. and J.E. Spencer. 1967. The Philippine Island World: A Physical, Cultural and Regional Geography. California: University of California Press. Williamson, O. 1991. Comparative Economic organization:The Analysis of Discrete Structural Alternatives. Administrative Science Quarterly 36:269-296. World Bank. 1993. The Housing Indicators Program: Extensive Survey, vol.2, Indicators Tables. United Nations Centre for Human Settlements and the World Bank.