
LAND USE ELEMENT - Washington County, Wisconsin v1 -TRENTON CP TBL VI-1 NMAlRLRfCDP 04/13/07 Table...
25
#138684 vI - TRENTON CP CH 6 NMAlCDP 01/08/09; 8/15/08 SEWRPC Community Assistance Planning Report No. 296 A COMPREHENSIVE PLAN FOR THE TOWN OF TRENTON: 2035 Chapter VI LAND USE ELEMENT (Changes made to this chapter following Town Plan Commission review on October 14, 2008, are noted with an underline for additions and a stiliiefJutfor deletions. Maps are attached at the end of the Chapter). INTRODUCTION The land use element is one of the nine elements of a comprehensive plan required by Section 66.1001 of the Wisconsin Statutes. Section 66.1001 (2) (eQ) of the Statutes requires this element to compile goals, objectives, policies, programs, and maps to guide future development and redevelopment of public and private property. The Statutes also require this element to include: • Information regarding the amount, type, and intensity or density of existing land uses • Land use trends • Potential land use conflicts • Projected land use needs in five year increments to the plan design year (2035) • Maps showing existing and future land uses; productive agricultural soils; natural limitations to building site development; floodplains, wetlands, and other environmentally sensitive lands; and boundaries of areas to which public utility and community services will be provided by the plan design year In addition, the 14 State of Wisconsin comprehensive planning goals, which are related to each of the nine comprehensive plan elements, set forth in Section 16.965 of the Statutes must be addressed as part of the Town comprehensive planning process.! The Land Use Element relates to each of the other comprehensive plan elements, and therefore relates to all 14 State comprehensive planning goals. Goals that are most directly related to the Land Use Element include: • Promotion of the redevelopment of land with existing infrastructure and public services and the maintenance and rehabilitation of existing residential, commercial, and industrial structures. • Protection of natural areas, including wetlands, wildlife habitats, lakes, woodlands, open spaces, and groundwater resources. • Protection of economically productive areas, including farmland and forests. • Encouragement of land uses, densities and regulations that promote efficient development patterns and relatively low municipal, State government, and utility costs. • Providing adequate infrastructure and public services and an adequate supply of developable land to meet existing and future market demand for residential, commercial, and industrial uses. • Balancing property rights with community interests and goals. 1 Chapter I lists all 14 comprehensive planning goals included in Section 16.965 of the Statutes. All14 goels mh'st be addressed in COl;{l'lty end local plam; that received ftfnding though a Department of Administration cfJmprehensi're pl'£lnlling f::,''rtlnt, such as the Town ('!f Trenton ffH€1 W+1shingt<'J11 County. REVISED DRAFT VI-1
Transcript of LAND USE ELEMENT - Washington County, Wisconsin v1 -TRENTON CP TBL VI-1 NMAlRLRfCDP 04/13/07 Table...

#138684 vI - TRENTON CP CH 6 NMAlCDP 01/08/09; 8/15/08
SEWRPC Community Assistance Planning Report No. 296 A COMPREHENSIVE PLAN FOR THE TOWN OF TRENTON: 2035
Chapter VI
LAND USE ELEMENT
(Changes made to this chapter following Town Plan Commission review on October 14, 2008, are noted with an underline for additions and a stiliiefJutfor deletions. Maps are attached at the end of the Chapter).
INTRODUCTION
The land use element is one of the nine elements of a comprehensive plan required by Section 66.1001 of the Wisconsin Statutes. Section 66.1001 (2) (eQ) of the Statutes requires this element to compile goals, objectives, policies, programs, and maps to guide future development and redevelopment of public and private property. The Statutes also require this element to include: • Information regarding the amount, type, and intensity or density of existing land uses • Land use trends • Potential land use conflicts • Projected land use needs in five year increments to the plan design year (2035) • Maps showing existing and future land uses; productive agricultural soils; natural limitations to building site
development; floodplains, wetlands, and other environmentally sensitive lands; and boundaries of areas to which public utility and community services will be provided by the plan design year
In addition, the 14 State of Wisconsin comprehensive planning goals, which are related to each of the nine comprehensive plan elements, set forth in Section 16.965 of the Statutes must be addressed as part of the Town comprehensive planning process.! The Land Use Element relates to each of the other comprehensive plan elements, and therefore relates to all 14 State comprehensive planning goals. Goals that are most directly related to the Land Use Element include: • Promotion of the redevelopment of land with existing infrastructure and public services and the maintenance
and rehabilitation of existing residential, commercial, and industrial structures. • Protection of natural areas, including wetlands, wildlife habitats, lakes, woodlands, open spaces, and
groundwater resources. • Protection of economically productive areas, including farmland and forests. • Encouragement of land uses, densities and regulations that promote efficient development patterns and
relatively low municipal, State government, and utility costs. • Providing adequate infrastructure and public services and an adequate supply of developable land to meet
existing and future market demand for residential, commercial, and industrial uses. • Balancing property rights with community interests and goals.
1 Chapter I lists all 14 comprehensive planning goals included in Section 16.965 of the Statutes. All14 goels mh'st be addressed in COl;{l'lty end local plam; that received ftfnding though a Department of Administration cfJmprehensi're pl'£lnlling f::,''rtlnt, such as the Town ('!f Trenton ffH€1 W+1shingt<'J11 County.
REVISED DRAFT
VI-1

• Planning and development of land uses that create or preserve varied and unique urban and rural communities.
Section 16.965 also requires the identification of "Smart Growth Areas" in County and local plans. A "Smart Growth Area" is defined by the Statutes as "an area that will enable the development and redevelopment of lands with existing infrastructure and municipal, State, and utility services, where practicable, or that will encourage efficient development patterns that are both contiguous to existing development and at densities which have relatively low municipal, state governmental, and utility costs."
All of the information required by the comprehensive planning law is provided in this chapter.
PART 1: EXISTING LAND USE CONDITIONS AND TRENDS
Land Use Trends
SEWRPC periodically conducts a detailed land use inventory of the seven-county Region to inventory and monitor urban growth and development occurring over time. The land use inventory places all land and water areas into one of 66 land use categories. The most current detailed land use inventory was conducted in 2000. Based on that inventory, urban land uses, including residential, commercial, industrial, governmental and institutional, recreational, and transportation, communication, and utility uses, encompassed 2,372 acres, or about 11 percent of the Town. Nonurban land uses, consisting of agricultural lands; natural resource areas, including surface waters, wetlands, and woodlands; extractive sites; and open land, encompassed 18,621 acres, or about 89 percent of the Town. Agriculture was the single largest land use, encompassing 11,384 acres, or about 54 percent of the Town in 2000.
The number of acres in various land use categories in the Town of Trenton in 1980, 1990, and 2000 is shown on Table VI-I. Table VI-l also includes the acreage and percentage changes in each land use category between 1980 and 2000, and for intervening time periods.
Between 1980 and 2000, the amount of land used for urban uses, including residential, commercial, industrial, and transportation uses, increased by about 659 acres, from about 1,713 acres to about 2,372 acres, or about 39 percent. The amount of land used for residential, commercial, and industrial purposes increased by about 50 percent during this time period. Most of the increase was due to single-family residential development, which increased by 454 acres, or by about 48 percent, between 1980 and 2000.
The percentage ofland classified as "nonurban" decreased by about 3 percent between 1980 and 2000. Much of the land developed for urban uses between 1980 and 2000 was converted from agricultural to urban use. The amount of land used for agriculture decreased by about 2,003 acres, or by about 15 percent. The number of acres in the "open lands" category, that is, lands that are vacant and apparently unused, increased by about 967 acres during the 1980 to 2000 period. Much of the increase in the "open lands" category is likely due to land being taken out of agriculture. The acreage of woodlands, wetlands, and surface waters increased by about 7 percent between 1980 and 2000, due primarily to an increase in wooded areas in the Town. The area within extractive sites decreased by about 60 percent, from 20 acres in 1980 to eight acres in 2000.
Land Price
Equalized value trends by real estate class in the Town in 2003 and 2007 are set forth in Table VI-2. All real estate classes except undeveloped land and forest land experienced an increase in equalized value. Commercial properties experienced the greatest increase in equalized value, with an increase of over 78 percent; and the equalized value of residential properties increased by over 41 percent. The Town experienced an overall increase in equalized value of about 40 percent between 2003 and 2007, which is identical to the percentage increase in Washington County during the same period.
REVISED DRAFT
VI-2

#124176 v1 - TRENTON CP TBL VI-1 NMAlRLRfCDP 04/13/07
Table VI-1
LAND USE TRENDS IN THE TOWN OF TRENTON: 1980-2000
Area (Acres) Change in Area
1980-1990 1990-2000
Percent Percent Land Use Category 1980 1990 2000a Acres Change Acres Change
Urban Residential Single-Family ....... ........... 947 1,099 1,401 152 16.1 302 27.5 Two-Family ...................... 1 7 4 6 600.0 -3 -42.9 Multi-Family ..................... - - -- - - - - -- -- - -Mobile Homes ................. 1 1 1 - - -- -- - -
Subtotal 949 1,107 1,406 158 16.6 299 27.0 Commercial ....................... 13 14 19 1 7.7 5 35.7 Industrial ............................ - - 6 15 6 -- 9 150.0 Transportation, Communications, and Utilities Arterial Street Rights-of-Way ........................... 209 209 200 - - -- -9 -4.3 Nonarterial Street Rights-of-Way ................ 413 422 532 9 2.2 110 26.1 Railroad Rights-of-Way .. -- - - - - - - -- - - - -Communications and Utilities ........................... 3 3 3 - - - - -- --Subtotal 625 634 735 9 1.4 101 15.9
Governmental and Institutional .......... .......... 10 10 11 -- - - 1 10.0
Recreational .......... ........... 116 114 186 -2 -1.7 72 63.2 Urban Subtotal 1,713 1,885 2,372 172 10.0 487 25.8
Nonurban Natural Resource Areas Woodlands ...................... 1,633 1,707 1,716 74 4.5 9 0.5 Wetlands ......................... 3,466 3,685 3,744 219 6.3 59 1.6 Surface Water ................. 244 265 272 21 8.6 7 2.6
Subtotal 5,343 5,657 5,732 314 5.9 75 1.3 Agricultural ........................ 13,387 12,108 11,384 -1,279 -9.6 -724 -6.0 Landfills .... ........................ -- - - - - - - -- - - --Extractive Sites .................. 20 13 8 -7 -35.0 -5 -38.5 Open Lands .................... 530 1,330 1,497 800 150.9 167 12.6
Nonurban Subtotal 19,280 19,108 18,621 -172 -0.9 -487 -2.5
Total 20,993 20,993 20,993 - - -- -- - -
1980-2000
Percent Acres Change
454 47.9 3 300.0
- - - -- - - -
457 48.2 6 46.2
15 - -
-9 -4.3
119 28.8 - - - -
-- --110 17.6
1 10.0 70 60.3
659 38.5
83 5.1 278 8.0
28 11.5 389 7.3
-2,003 -15.0 -- --
-12 -60.0 967 182.5
-659 -3.4
- - - -
Note: The data above is based on the land that was in the Town in 2000. The actual acreage in the Town was 22,085 acres in 1980,21,903 acres in 1990, and 21,025 acres in 2007.
aAs part of the regional land use inventory for the year 2000, the delineation of existing land use was referenced to real property boundary information not available for prior inventories. This change increases the precision of the land use inventory and makes it more usable to public agencies and private interests throughout the Region. As a result of the change, however, year 2000 land use inventory data are not strictly comparable with data from the prior inventories. The most significant effect of the change is to increase the transportation, communication, and utilities category due to the use of actual street and highway rights-of-way as part of the 2000 land use inventory, as opposed to the use of narrower estimated rights-of-way in prior inventories. This treatment of streets and highways generally diminishes the area of adjacent land uses traversed by those streets and highways in the 2000 land use inventory relative to prior inventories.
Source: SEWRPC.

; \
#138244 v1 - TRENTON CP TBL VI-2 NMAlCDP 07/10/08
Table VI-2
EQUALIZED VALUE BY REAL ESTATE CLASS IN THE TOWN OF TRENTON: 2003 and 2007
Statement of Equalized Values 2003a Statement of Equalized Values 2007b
Real Estate Class Acres Land Improvements Total Acres Land Improvements Total Residential .............. 4,294 $91,935,300 $232,418,500 $324,353,800 4,567 $121,755,800 $336,954,800 458,710,600 Commercial ............. 258 1,658,200 4,031,900 5,690,100 252 2,592,400 7,566,700 10,159,100 Manufacturing .......... 1 28,800 372,100 400,900 1 40,000 569,800 609,800 Agricultural .............. 9,450 1,785,500 N/A 1,785,500 8,965 1,940,800 N/A 1,940,800 Undeveloped ........... 2,329 6,235,200 N/A 6,235,200 2,553 4,671,600 N/A 4,671,600 Ag Farest... .............. 0 N/A N/A N/A 1,777 7,930,500 N/A 7,930,500 Swamp and Waste .. N/A N/A N/A N/A N/A N/A N/A N/A Forest ...................... 2,247 7,849,100 N/A 7,849,100 335 3,927,000 N/A 3,927,000
Otherc ..................... 122 1,942,100 5,760,500 7,702,600 80 2,354,000 6,253,800 8,607,800 Total 18,701 $111,434,200 $242,583,000 $354,017,200 18,530 $145,212,100 $351,345,100 $496,557,200
a Equalized values for 2003 were as of March 15, 2004.
bEqualized values for 2007 were as of November 15, 2007.
cThis category includes agricultural buildings and improvements and the land necessary for their location.
Source: Wisconsin Department of Revenue and SEWRPC.
Change in Equalized Value 2003 and 2007
Number Percent $134,356,800 41.4
4,469,000 78.5 208,900 52.1 155,300 8.7
-1,563,600 -25.1 N/A N/A N/A N/A
-3,922,100 -50.0
905,200 11.8 $142,540,000 40.3

Existing Land Uses in 2008
The Town of Trenton, through its comprehensive plan, must look ahead at least twenty years to ensure adequate supplies of land for urban and nonurban land uses. To ensure that future planning reflects land use development that has occurred to date, the 2000 land use inventory was updated to 2008, based on the 2005 aerial photographs produced by SEWRPC, the record of subdivision and condominium plats maintained by Washington County, field checks, and consultation with Town officials.
Major development in the Town between 2000 and 2008 included: • Oakridge Estates single-family residential subdivision located southeast of the intersection of Trenton
Road and Mapledale Road. • Trentonview Estates single-family residential subdivision located west of Shady Lane Road. • Hardegen Meadows single-family residential subdivision located off Mapledale Road. • Aquaview Terrance Condominiums located off Oak Road between Mapledale Road. • Jamestown Estate Condominiums located west of Trenton Road near Mapledale Road. • Lockhorn Estate Condominiums located east of River Road. • Maple Dale Condominiums located east of Trenton Road on Wallace Lake Road. • Trenton Business Center Condominiums located on STH 33 north of West Bend Lakes Golf Course. • A new business park located in the southwest comer ofthe Town.
Map VI-1 shows generalized land use in the Town in mid-2008. Acres within each land use category are shown on Table VI-3. The generalized land use map differs from the more precise 2000 land use inventory map (Map V -2) in that the generalized map includes farmhouses in the "agricultural" category rather than the "residential" category, except for farmhouses that were located on their own separate parcel. Undeveloped portions of lots less than five acres were designated with the primary use of the lot, except where a portion of a lot was used for residential or another urban use and the remaining portion was used for agriculture. In such cases, both the urban use and the agricultural use were mapped. The number of acres in the single-family residential category was significantly higher in 2008 than in 2000, due in part to the entire lot area of lots less than five acres with a home, and no portion of the lot used for agriculture, being included in residential land use category. Previously, portions of such lots that were not developed with a home, driveway, or accessory buildings (such as sheds) or used for agriculture were included in the "open lands" category. Some of the increase in the area devoted to commercial and industrial uses between 2000 and 2008 is also attributable to areas on commercial and industrial lots that were categorized as "open lands" in the 2000 and earlier land use inventories being identified as commercial or industrial lands in the 2008 land use update.
Urban Land Uses Urban land uses include residential, commercial, industrial, governmental and institutional, recreational, and transportation, communication, and utility uses. Urban uses encompassed 3,981 acres, or about 19 percent of the Town in 2008.
Residential Residential land comprised the largest urban land use category in the Town in 2008. Residential uses encompassed ~2, 784 acres, or about 70 percent of all urban land and about 13 percent of the Town. Almost all residential land use consisted of single-family homes, occupying ~2. 762 acres. There were about 15 acres in scattered locations developed with duplexes and seven acres developed for multi-family residential uses. Multi-family residential areas included a condominium development in Section 9 on Vivian Court just west ofN. Oak Road.
REVISED DRAFT
VI-3
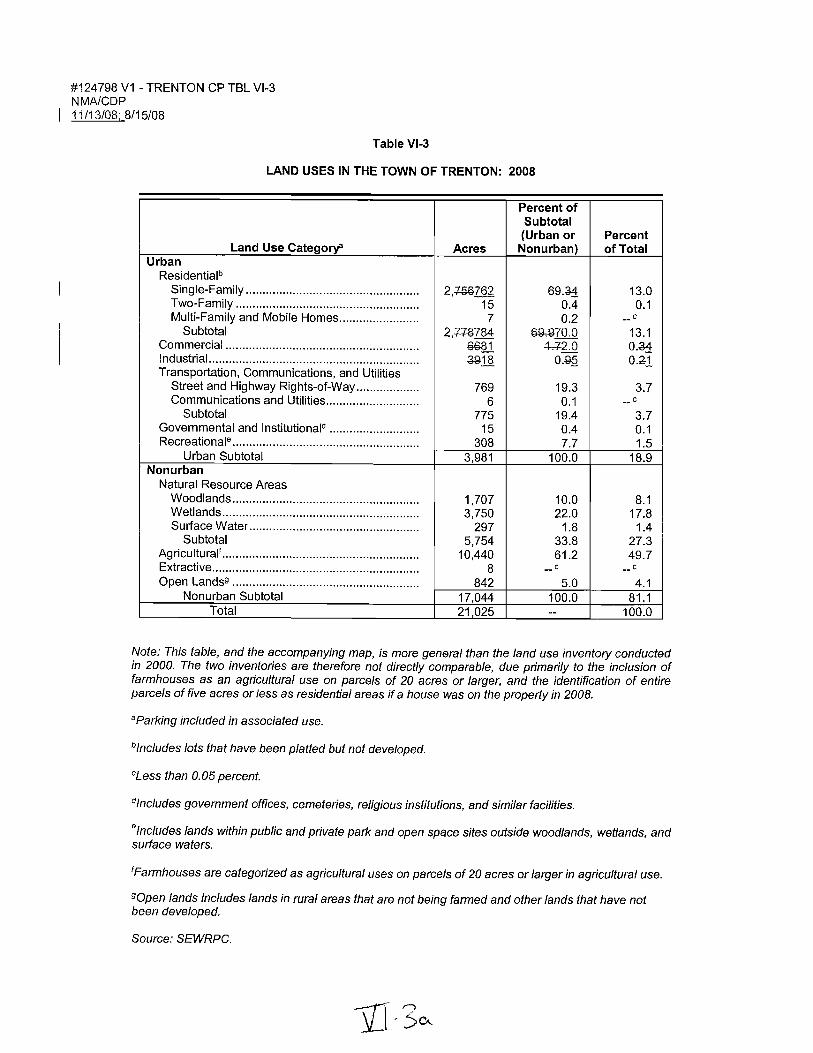
#124798 V1 - TRENTON CP TBL VI-3 NMAlCDP 11/13/08; 8/15/08
Table VI-3
LAND USES IN THE TOWN OF TRENTON: 2008
Percent of Subtotal (Urban or
Land Use CategorY' Acres Nonurban) Urban
Residentialb
Single-Family .................................................... 2,+56762 69·31 Two-Family ....................................................... 15 0.4 Multi-Family and Mobile Homes ........................ 7 0.2
Subtotal 2,++8-784 G9J.f70.0 Commercial .......................................................... €le81 4-,.72.0 Industrial ............................................................... 3918 0.99. Transportation, Communications, and Utilities
Street and Highway Rights-of-Way ................... 769 19.3 Communications and Utilities ............................ 6 0.1
Subtotal 775 19.4 Governmental and Institutionald ........................... 15 0.4 Recreationale ........................................................ 308 7.7
Urban Subtotal 3,981 100.0 Nonurban
Natural Resource Areas Woodlands ........................................................ 1,707 10.0 Wetlands ........................................................... 3,750 22.0 Surface Water ................................................... 297 1.8
Subtotal 5,754 33.8 Agricultural! ........................................................... 10,440 61.2 Extractive .............................................................. 8 -- C
Open Lands9 ........................................................ 842 5.0 Nonurban Subtotal 17,044 100.0
Total 21,025 --
Percent of Total
13.0 0.1
C --13.1 0·31 0.21
3.7 -- C
3.7 0.1 1.5
18.9
8.1 17.8
1.4 27.3 49.7
-- C
4.1 81.1
100.0
Note: This table, and the accompanying map, is more general than the land use inventory conducted in 2000. The two inventories are therefore not directly comparable, due primarily to the inclusion of farmhouses as an agricultural use on parcels of 20 acres or larger, and the identification of entire parcels of five acres or less as residential areas if a house was on the property in 2008.
aparking included in associated use.
blnc/udes lots that have been platted but not developed.
CLess than 0.05 percent.
dlncludes government offices, cemeteries, religious institutions, and similar facilities.
elncludes lands within public and private park and open space sites outside woodlands, wetlands, and surface waters.
'Farmhouses are categorized as agricultural uses on parcels of 20 acres or larger in agricultural use.
90pen lands includes lands in rural areas that are not being farmed and other lands that have not been developed.
Source: SEWRPC.

Commercial In 2008, commercial uses encompassed ~~acres, or about 2 percent of urban land and less than 1 percent of the Town. Commercial development was primarily concentrated along STH 33 and CTH NN, and scattered at various locations along other arterial streets and highways. Commercial uses included retail stores, restaurant/taverns, self-storage lockers, a used auto dealer, an equipment rental business, landscaping supply retailers, a commercial nursery, an indoor go-kart track, and a riding stable.
Industrial In 2008, industrial land encompassed ;+9-~acres, or ~Iess than 1 percent of urban land and less than 1 percent of the Town. Industrial uses included outdoor storage faGilities, auto repair shops, landsGaping services, Q)lGavHting Gontracton;, masonry' contractors, a roofing coiltraetol", andfacilities and a die and mold business.
Transportation, Communication, and Utilities Transportation, communication, and utility land uses, which include arterial streets and highways, collector and minor (land access) streets, railways, and communication and utility facilities, comprised the second largest urban land use category. These uses encompassed 775 acres, or about 19 percent of all urban land and about 4 percent of the Town. Arterial highways serving the Town include STH 33, CTH G, CTH I, CTH M, CTH MY, CTH NN, and CTH Y. Arterial street rights-of-way encompassed 209 acres, or about 27 percent of the area within street rights-of-way, and nonarterial street rights-of-way encompassed 560 acres. A description of highway and street classifications is provided in the Transportation Element (Chapter VIII).
Communication-related land uses included a radio tower and two cell tower sites (see Table IX-l in Chapter IX). Land used for utilities included electrical substations and natural gas pipeline substations. Communication facilities and utilities encompassed six acres, or less than 1 percent of the Town.
Governmental and Institutional In 2008, land used for government and institutional uses encompassed about 15 acres, or less than 1 percent of all urban land and less than 1 percent of the Town. Governmental and institutional lands in the Town include the Town Hall and Park, St. Augustine Catholic Church and Cemetery, and the Trenton Township Cemetery. Information about these community facilities is presented in Chapter IX.
Recreational In 2008, recreational land encompassed about 308 acres, or about 8 percent of all urban land and about 2 percent of the Town. Land in this category includes those portions of public and private park and recreational sites located outside woodlands, wetlands, and surface waters. There were six sites in the Town in 2008. Public sites included the Town park adjacent to Town Hall and a Town-owned boat access site on Wallace Lake (the boat access site is located on a public street right-of-way), and two County-owned parks, Sandy Knoll and Goeden Parks. Privately owned sites include the West Bend Lakes Golf and Recreation site and the YMCA Triangle Y Ranch. Stockhausen Park, which was developed by the Town in 2008, is shown as "open lands" on the 2008 land use map, but is designated as recreational on the land use plan map (Map VI-4).
Open space sites in the Town, which are designated as agricultural, wetland, or woodland on Map VI-I, included a Wisconsin Department of Transportation (WisDOT) wetland mitigation site on the northeast comer of CTH NN and S. Church Road, and two sites owned by the Ozaukee Washington Land Trust along the Milwaukee River (Fellenz Woods and Riverbend Conservancy). A complete inventory of park and open space sites in the Town is included in Chapter V.
Nonurban Land Uses Nonurban land uses consist of agricultural lands; natural resource areas, including surface waters, wetlands, and woodlands; extractive sites; and unused land. As indicated in Table VI-3 and on Map VI-I, nonurban land uses encompassed about 17,044 acres, or about 81 percent of the Town, in 2008. Significant portions of the Town
REVISED DRAFT
VI-4

were used for agricultural purposes (about 50 percent) or encompassed within woodlands and wetlands (an additiona126 percent).
Agricultural Lands Agricultura11ands encompassed 10,440 acres, or about 50 percent of the Town in 2008, and was the largest single land use category. Agricultural lands include all croplands, pasture lands, and farm buildings. A more detailed inventory of agricultura11and in the Town is included in Chapter V.
Natural Resource Areas Natural resource areas consisting of surface water, wetlands, and woodlands combined to encompass 5,754 acres, or about 27 percent of the Town, in 2008. Natural resource areas included lakes, rivers, streams, 1,707 acres of woodlands, and 3,750 acres of wetlands. Major natural resource lands include Wallace Lake, Radtke Lake, and the Milwaukee River. A complete inventory of natural resource areas is included in Chapter V.
Extractive In 2008, there was one inactive extractive area encompassing about eight acres, or less than 1 percent of nonurban land uses and less than 1 percent of the Town. There were no operational nonmetallic mining sites in the Town in 2008.
Open Lands Open lands encompassed 842 acres, or about 4 percent of the Town. Open lands include lands in rural areas that are not being farmed and undeveloped portions of residential, commercial, and industrial lots larger than five acres.
Former Landfills and Contaminated Sites
Former Landfills There are no active landfills in the Town. The Wisconsin Department of Natural Resources (DNR) has identified four former landfills, as shown on Table VI -4, in its registry of waste disposal sites. The former landfill sites are shown on Map VI-3, Natural Limitations for Building Site Development. The DNR registry of waste disposal sites includes active, inactive, and abandoned sites where solid or hazardous wastes were known or likely to have been disposed. The inclusion of a site does not mean that environmental contamination has occurred, is occurring, or will occur in the future, but is intended to serve as a general informational source for the public and Town officials regarding the location of waste disposal sites. None of the four former landfill sites has been identified as a contaminated site by the DNR. The following paragraph provides information about contaminated sites.
Contaminated Sites The DNR Bureau for Remediation and Redevelopment identifies and monitors contaminated sites. Contaminated sites include leaking underground storage tank (LUST) sites and environmental repair (ERP) sites. A LUST site has soil and/or groundwater contaminated with petroleum, which includes toxic and cancer causing substances. However, given time, petroleum contamination naturally breaks down in the environment (biodegradation). Some LUST sites may emit potentially explosive vapors. As shown on Table VI-3, the DNR has identified one LUST in the Town.
An ERP site is a site, other than a LUST, that has contaminated soil and/or groundwater. Examples include industrial spills (or dumping) that require long-term investigation, buried containers of hazardous substances, or closed landfills that have caused contamination. ERP sites also include areas with petroleum contamination from above-ground (but not from underground) storage tanks. There are no active ERP sites in the Town.
REVISED DRAFT
VI-5
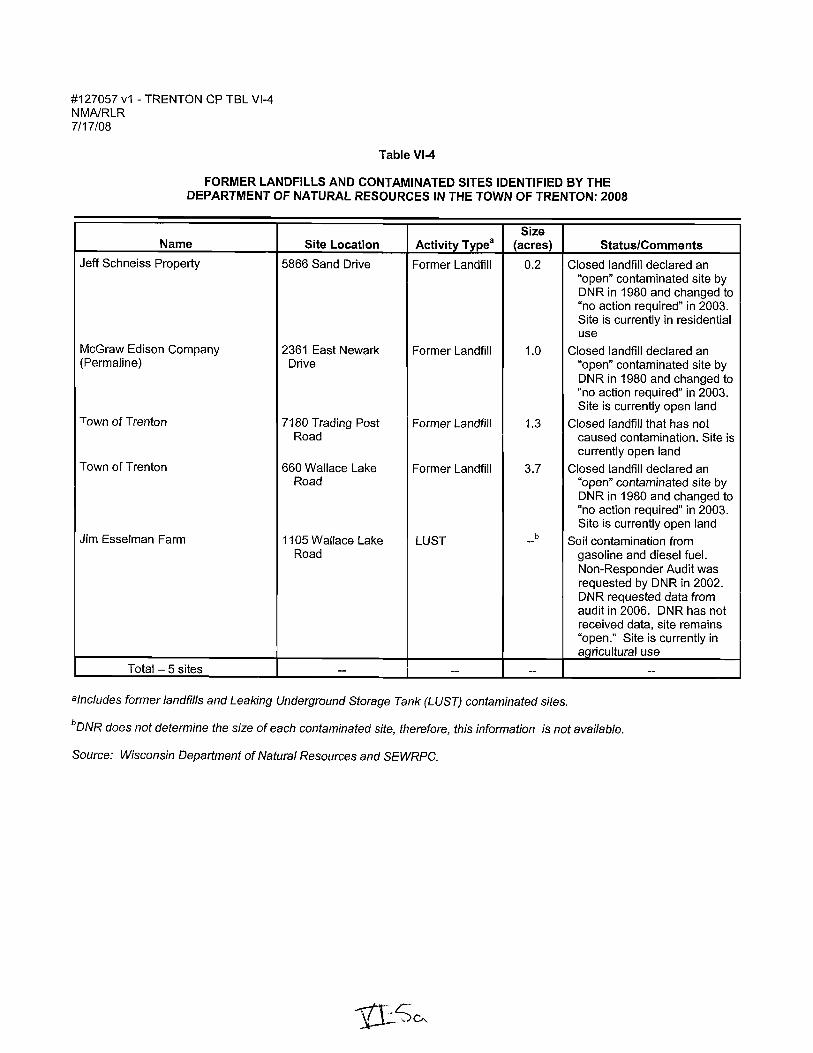
#127057 vi - TRENTON CP TBL VI-4 NMAlRLR 7117108
Table VI-4
FORMER LANDFILLS AND CONTAMINATED SITES IDENTIFIED BY THE DEPARTMENT OF NATURAL RESOURCES IN THE TOWN OF TRENTON: 2008
Size Name Site Location Activity Typea (acres) Status/Comments
Jeff Schneiss Property 5866 Sand Drive Former Landfill 0.2 Closed landfill declared an "open" contaminated site by DNR in 1980 and changed to "no action required" in 2003. Site is currently in residential use
McGraw Edison Company 2361 East Newark Former Landfill 1.0 Closed landfill declared an (Permaline) Drive "open" contaminated site by
DI\IR in 1980 and changed to "no action required" in 2003. Site is currently open land
Town of Trenton 7180 Trading Post Former Landfill 1.3 Closed landfill that has not Road caused contamination. Site is
currently open land
Town of Trenton 660 Wallace Lake Former Landfill 3.7 Closed landfill declared an Road "open" contaminated site by
DNR in 1980 and changed to "no action required" in 2003. Site is currently open land
Jim Esselman Farm 1105 Wallace Lake LUST b Soil contamination from --Road gasoline and diesel fuel.
Non-Responder Audit was requested by DNR in 2002. DNR requested data from audit in 2006. DNR has not received data, site remains "open." Site is currently in agricultural use
Total - 5 sites -- -- -- --
alncludes former landfills and Leaking Underground Storage Tank (LUST) contaminated sites.
bDNR does not determine the size of each contaminated site, therefore, this information is not available.
Source: Wisconsin Department of Natural Resources and SEWRPC.

Background Maps Chapters II through V provide background data and maps used to help design the Town land use plan. In addition to the detailed inventories included in these chapters, the following maps have been compiled to assist with the development of the land use plan. The comprehensive planning law requires that the following maps be included in the land use element:
• Productive Agricultural Soils A land evaluation and site assessment (LESA) analysis was conducted as part of the multi-jurisdictional comprehensive planning process to meet this requirement and to develop goals and objectives for farmland preservation as part of the Agricultural, Natural, and Cultural Resources Element of the County and Town plans. Map V-I in Chapter V shows the results of this analysis. The LESA Analysis will be used to help update the Washington County Farmland Preservation Plan following adoption of the County comprehensive plan by the Washington County Board of Supervisors.
Prime agricultural lands recommended to remain in agricultural production through 2035 are shown on Map VIA.
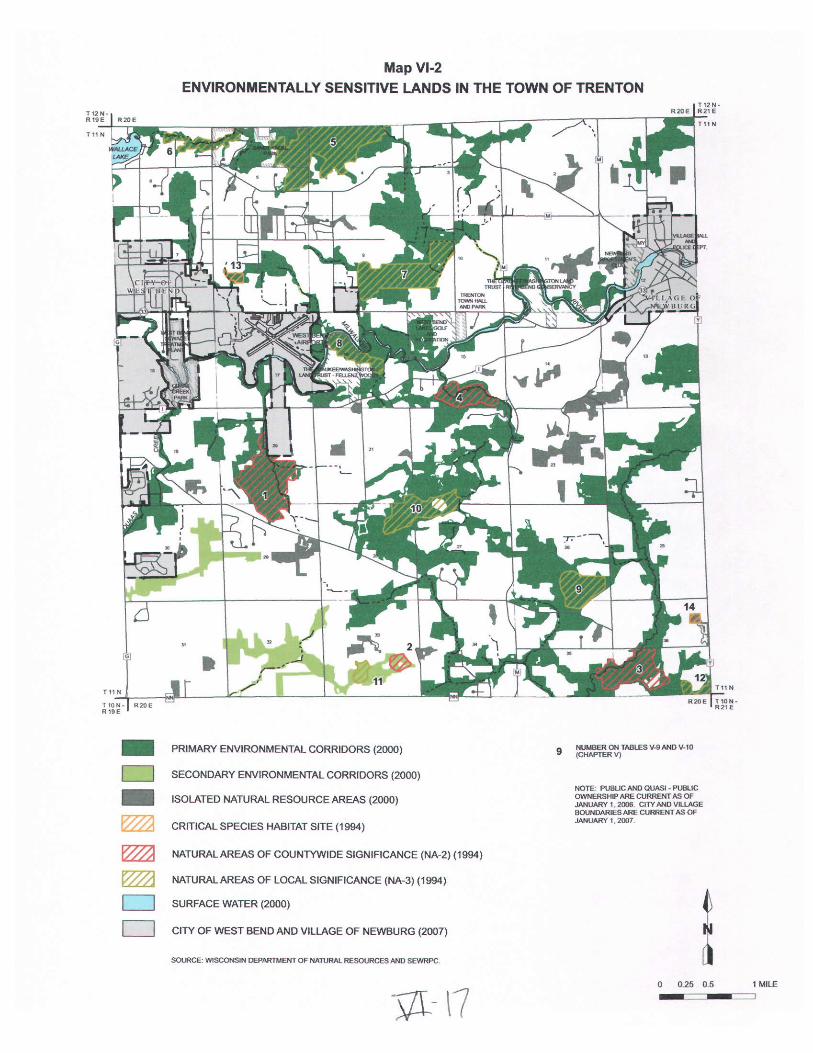
• Environmentally Sensitive Lands Environmentally sensitive lands are shown on Map VI-2, and include primary environmental corridors, secondary environmental corridors, isolated natural resource areas, and surface waters. Natural areas and critical species habitat sites are also shown on the map. Recommendations for the protection and management of these resources are included in the Agricultural, Natural, and Cultural Resources Element (Chapter V) and in Part 4 of this Chapter.
• Natural Limitations to Building Site Development Several natural resource features that may limit development were identified by the Town Board and Town Plan Commission, and are shown on Map VI-3. The Town identified floodplains, wetlands, surface waters, slopes ranging from 12 to 20 percent, slopes of 20 percent or more, cemeteries, and former landfills and contaminated sites as potential limitations to development. Recommendations for the protection and management of these resources are included in the Agricultural, Natural, and Cultural Resources Element (Chapter V) and in Part 4 ofthis Chapter.
• Utilities and Community Services The comprehensive planning law requires the land use element to include maps showing boundaries of areas to which public utility and community services will be provided by the plan design year. Chapter IX includes such maps for the Town.
Opportunities for Redevelopment and Smart Growth Areas The greatest opportunities for redevelopment in Washington County exist where there is available land served by existing infrastructure, typically in the older and underutilized commercial buildings and parcels located in and adjacent to the traditional downtowns, and older shopping centers located in cities and villages. The following areas were identified as potential "Smart Growth Areas" in the Multi-Jurisdictional Comprehensive Plan for Washington County:
• Environmentally contaminated sites identified by local governments as suitable for redevelopment • Underutilized parcels in and adjacent to traditional downtowns, including older shopping centers • Undeveloped land within planned sewer service areas that is adjacent to existing development and does
not encompass lands with significant environmental features or potential for long-term agricultural use2
2Lands with significant environmental features are identified on Map VI-2 (Environmentally Sensitive Lands) and VI-3 (Natural Limitations to Building Site Development). Lands recommended for long-term agricultural use are shown on Map VI-4.
REVISED DRAFT
VI-6

• Hamlets identified for urban development in local land use plans.
One environmentally contaminated site has been identified in the Town, and is listed in Table VI-4. The site is currently in agricultural use, and is recommended to remain in agricultural use on the land use plan map.
The Town of Trenton land use plan identifies urban growth areas for the Town of Trenton and seeks to direct urban development to these areas. New urban development is intended to be concentrated mostly in the West Bend and Newburg sewer service areas lying within the Town. The boundaries of the planned sewer service areas are shown on Map VI-4. It is anticipated that development within the urban growth areas will be served by public utilities extended from the West Bend and Newburg utility systems, which would require boundary or intergovernmental agreements between the Town and the City of West Bend, and between the Town and the Village of Newburg. Urban growth designated on the Town land use plan map within the West Bend and Newburg sewer service areas will serve as the Town's "Smart Growth Areas."
Existing and Potential Land Use Conflicts Section 62.23 of the Statutes allows cities and villages to include areas outside their corporate limits in their comprehensive plans, including any unincorporated land outside city or village boundaries that, in the plan commission's judgment, relates to the development of the city or village. City and village planning areas are typically associated with city and village extraterritorial areas.3 Potential land use conflicts can arise in these areas because they may be planned for in both the town comprehensive plan and the city or village comprehensive plan, with different or conflicting land uses recommended by each plan. The Town of Trenton is within the extraterritorial areas of the City of West Bend and the Village of Newburg. Both the City and the Village have included portions of the Town of Trenton in the planning areas used to prepare the City and Village comprehensive plans.
The City of West Bend land use plan map4 includes portions of the Town of Trenton, including areas of the Town within the City's planned sewer service area and a limited amount outside the planned sewer service area. Future land uses recommended by the City land use plan are similar to those shown on the Town's land use plan map (Map VI-4); however, an important difference is the residential densities recommended by the City plan for single-family residential development in the sewer service area, which range from 7,200 to 20,000 square feet per dwelling unit. Much of the land within the City's planned sewer service area is designated for suburban-density residential development on the Town land use plan map, which would be developed at a density of 40,000 square feet per dwelling. It is difficult to economically provide sanitary sewers to lots larger than 20,000 square feet. If the Town is successful in developing a boundary agreement with the City to extend sewer service to these areas, the Town should consider amending the land use plan to require smaller lots sizes within the sewer service area.
Other major differences between future land uses shown on the City and Town land use plan maps include a smaller business park shown on the City plan near the intersection of CTH NN and CTH G, with residential in much of the area designated for industrial use on the Town plan map; industrial uses designated on the City land use plan map south of the airport, which are designated for residential use by the Town land use plan map; and commercial uses designated on the City land use plan map north of the airport, which are designated for residential use on the Town land use plan map. M[~jor differences bepi'leen the City and Town land use plan designations are summarized on Map Xl _ in Chapter XI.
3 The Wisconsin Statutes grant cities and villages the authority to approve or deny subdivision plats within 1.5 miles of villages and cities of the fourth class, and within three miles of cities of the first, second, or third class. The City of West Bend is a city of the third class. Cities and villages may also enact extraterritorial zoning regulations for their extraterritorial areas, but must work with the affected town to develop and approve such regulations. Appendix C provides additional information on city and village extraterritorial authorities.
4 See Map 7-3 in the report titled 2020 Comprehensive Plan for the City of West Bend, April 12, 2004.
REVISED DRAFT
VI-7

The Village of Newburg was working on its comprehensive plan as of mid-200S. The draft land use plan map prepared as part of the Village comprehensive plan designates areas within the Village's planned sewer service area currently within the Town as "Village Residential," which would accommodate residential development at densities equating to one home on lot sizes ranging from S,700 to 20,000 square feet. The draft Village land use plan map also designates commercial uses on the north side of STH 33 within the planned sewer service area, including areas that are currently in the Town. The draft Village land use plan map also designates environmental corridors and other open space areas throughout the Village planning area, which is consistent with the Town plan.
Areas within the Village's planning area outside the sewer service area are designated for "rural residential" or "agricultural" uses, based on uses existing in 2007. There are a number of differences between the Village land use plan for its extraterritorial area and uses shown on the Town land use plan map. These include areas designated as rural-density residential on the Town land use map in Sections 1, 2, and 3 that are designated for agricultural use on the Village map; parcels in Sections 10 and 15 that are designated for agricultural use on the Town map but designated as rural residential on the Village map; and parcels in Sections 23 and 24 that are designated for country estate residential on the Town map and for agricultural use on the Village map. ~ differenees are also summarized on j!o,~ap XI ___ in Chapter XI.
A boundary agreement between a town and an adjacent city or village is one way to avoid or minimize land use conflicts between towns and adjacent cities and villages. Boundary agreements are described in the Intergovernmental Cooperation Element (Chapter XI). Chapter XI also describes the dispute resolution process developed as part of the Washington County Multi-Jurisdictional Comprehensive Plan, which may also be used to help resolve disagreements, on a voluntary basis, arising from the implementation of adopted comprehensive plans.
PART 3: TOWN OF TRENTON LAND USE PLAN
The land use plan for the Town of Trenton is shown in graphic form on Map VI-4. Table VI-5 lists the number of acres and the percentage ofland allocated to each land use category on the 2035 land use plan map and compares the information to the 200S land use pattern in the same geographic area. Map VI-1 (existing land uses in 200S) was adjusted to include primary and secondary environmental corridors and isolated natural resource areas in order to make a truer comparison between 200S existing and 2035 planned land uses.
The Town of Trenton land use plan described in this chapter is an update of the 2010 land use plan adopted by the Town Board in 1997.5 The conceptual framework for the land use plan is the same as that used to design the 2010 plan. Both the 2010 and 2035 plans seek to accommodate new urban development in primarily the West Bend and Newburg planned sewer service areas and in only those areas that are not subject to such environmental hazards as flooding and steep topography; discourages intensive and incompatible urban development from occurring in primary environmental corridors and other environmentally significant lands and, to the extent practicable, preserves the remaining prime agricultural lands in the Town. It is anticipated that development within the sewer service areas will be served by public utilities extended from the West Bend and Newburg utility systems. Such service will require boundary or intergovernmental agreements between the Town and the City and Village if the land remains in the Town but is provided with City or Village services. The City of West Bend already provides sewer services to two sanitary districts in the Town, the Sand Drive Sanitary District and the eastern portion of the Wallace Lake Sanitary District. Additional information about the sanitary districts is provided in the Utilities and Community Facilities Element (Chapter IX).
The Town of Trenton 2035 land use plan is designed for that area of U. S. Public Land Survey Township 11 North, Range 20 East, which encompassed the Town of Trenton as the boundaries of the civil Town existed on
5 Documented in SEWRPC Community Assistance Planning Report No. 238, A Land Use Plan for the Town of Trenton: 2010, December 1997.
REVISED DRAFT
VI-8
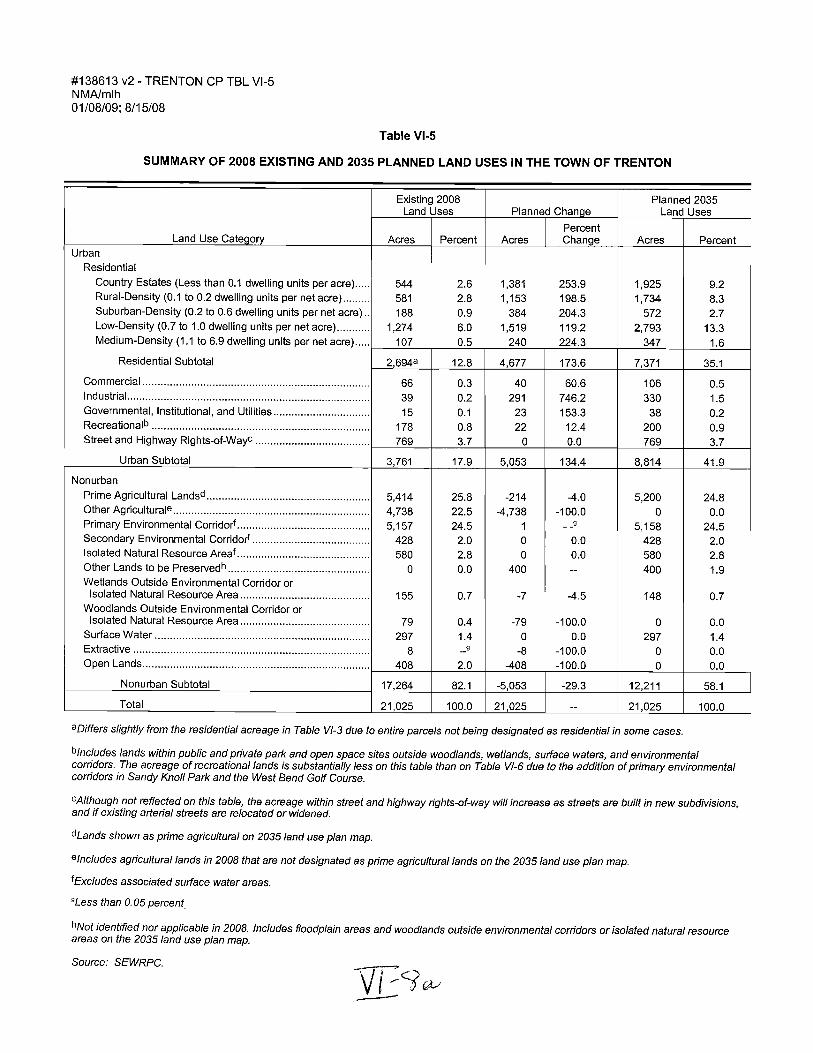
#138613 v2 - TRENTON CP TBL VI-5 NMAlmlh 01/08/09; 8/15/08
Table VI-5
SUMMARY OF 2008 EXISTING AND 2035 PLANNED LAND USES IN THE TOWN OF TRENTON
Existing 2008 Planned 2035 Land Uses Planned Change Land Uses
Percent Land Use Category Acres Percent Acres Change Acres Percent
Urban Residential
Country Estates (Less than 0.1 dwelling units per acre) ..... 544 2.6 1,381 253.9 1,925 9.2 Rural-Density (0.1 to 0.2 dwelling units per net acre) ......... 581 2.8 1,153 198.5 1,734 8.3 Suburban-Density (0.2 to 0.6 dwelling units per net acre) .. 188 0.9 384 204.3 572 2.7 Low-Density (0.7 to 1.0 dwelling units per net acre) ........... 1,274 6.0 1,519 119.2 2,793 13.3 Medium-Density (1.1 to 6.9 dwelling units per net acre) ..... 107 0.5 240 224.3 347 1.6
Residential Subtotal 2,694a 12.8 4,677 173.6 7,371 35.1
Commercial ........................................................................... 66 0.3 40 60.6 106 0.5 I nd ustrial ................................................................................ 39 0.2 291 746.2 330 1.5 Governmental, Institutional, and Utilities ................................ 15 0.1 23 153.3 38 0.2 Recreationalb ........................................................................ 178 0.8 22 12.4 200 0.9 Street and Highway Rights-of-WayC ...................................... 769 3.7 0 0.0 769 3.7
Urban Subtotal 3,761 17.9 5,053 134.4 8,814 41.9
Nonurban
Prime Agricultural Landsd ...................................................... 5,414 25.8 -214 -4.0 5,200 24.8 Other AgriculturaI 8 ................................................................. 4,738 22.5 -4,738 -100.0 0 0.0 Primary Environmental Corridorf ............................................ 5,157 24.5 1 - -9 5,158 24.5 Secondary Environmental Corridorf ....................................... 428 2.0 0 0.0 428 2.0 Isolated Natural Resource Areaf ............................................ 580 2.8 0 0.0 580 2.8 Other Lands to be Preservedh ............................................... 0 0.0 400 -- 400 1.9 Wetlands Outside Environmental Corridor or
Isolated Natural Resource Area ........................................... 155 0.7 -7 -4.5 148 0.7 Woodlands Outside Environmental Corridor or
Isolated Natural Resource Area ........................................... 79 0.4 -79 -100.0 0 0.0 Surface Water ....................................................................... 297 1.4 0 0.0 297 1.4 Extractive .............................................................................. 8 --9 -8 -100.0 0 0.0 Open Lands ........................................................................... 408 2.0 -408 -100.0 0 0.0
Nonurban Subtotal 17,264 82.1 -5,053 -29.3 12,211 58.1
Total 21,025 100.0 21,025 -- 21,025 100.0
aOiffers slightly from the residential acreage in Table VI-3 due to entire parcels not being designated as residential in some cases.
blncludes lands within public and private park and open space sites outside woodlands, wetlands, surface waters, and environmental corridors. The acreage of recreational lands is substantially less on this table than on Table VI-6 due to the addition ot primary environmental corridors in Sandy Knoll Park and the West Bend Golf Course.
CAlthough not reflected on this table, the acreage within street and highway rights-ot-way will increase as streets are built in new subdivisions, and it existing arterial streets are relocated or widened.
dLands shown as prime agricultural on 2035 land use plan map.
81ncludes agricultural lands in 2008 that are not designated as prime agricultural lands on the 2035 land use plan map.
fExcludes associated surface water areas.
gLess than 0.05 percent.
hNot identified nor applicable in 2008. Includes floodplain areas and woodlands outside environmental corridors or isolated natural resource areas on the 2035 land use plan map.
Source: SEWRPC.
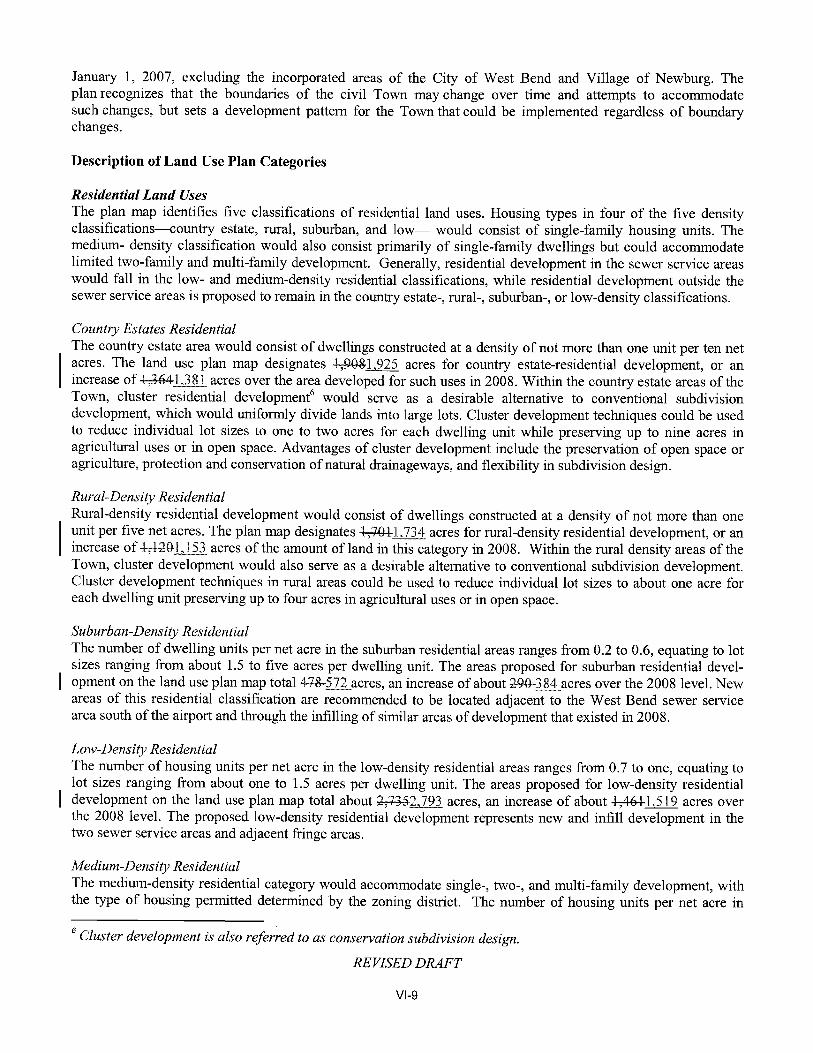
January 1, 2007, excluding the incorporated areas of the City of West Bend and Village of Newburg. The plan recognizes that the boundaries of the civil Town may change over time and attempts to accommodate such changes, but sets a development pattern for the Town that could be implemented regardless of boundary changes.
Description of Land Use Plan Categories
Residential Land Uses The plan map identifies five classifications of residential land uses. Housing types in four of the five density classifications-country estate, rural, suburban, and low- would consist of single-family housing units. The medium- density classification would also consist primarily of single-family dwellings but could accommodate limited two-family and multi-family development. Generally, residential development in the sewer service areas would fall in the low- and medium-density residential classifications, while residential development outside the sewer service areas is proposed to remain in the country estate-, rural-, suburban-, or low-density classifications.
Country Estates Residential The country estate area would consist of dwellings constructed at a density of not more than one unit per ten net acres. The land use plan map designates .J-.,9O&1.925 acres for country estate-residential development, or an increase of ~L381 acres over the area developed for such uses in 2008. Within the country estate areas of the Town, cluster residential development6 would serve as a desirable alternative to conventional subdivision development, which would uniformly divide lands into large lots. Cluster development techniques could be used to reduce individual lot sizes to one to two acres for each dwelling unit while preserving up to nine acres in agricultural uses or in open space. Advantages of cluster development include the preservation of open space or agriculture, protection and conservation of natural drainageways, and flexibility in subdivision design.
Rural-Density Residential Rural-density residential development would consist of dwellings constructed at a density of not more than one unit per five net acres. The plan map designates -l-;-+(#J ,734 acres for rural-density residential development, or an increase of ~L153 acres of the amount ofland in this category in 2008. Within the rural density areas of the Town, cluster development would also serve as a desirable alternative to conventional subdivision development. Cluster development techniques in rural areas could be used to reduce individual lot sizes to about one acre for each dwelling unit preserving up to four acres in agricultural uses or in open space.
Suburban-Density Residential The number of dwelling units per net acre in the suburban residential areas ranges from 0.2 to 0.6, equating to lot sizes ranging from about 1.5 to five acres per dwelling unit. The areas proposed for suburban residential development on the land use plan map total 4+8-572 acres, an increase of about ~384 acres over the 2008 level. New areas of this residential classification are recommended to be located adjacent to the West Bend sewer service area south of the airport and through the infilling of similar areas of development that existed in 2008.
Low-Density Residential The number of housing units per net acre in the low-density residential areas ranges from 0.7 to one, equating to lot sizes ranging from about one to 1.5 acres per dwelling unit. The areas proposed for low-density residential development on the land use plan map total about ~2, 793 acres, an increase of about -l-;4€H-l.519 acres over the 2008 level. The proposed low-density residential development represents new and infill development in the two sewer service areas and adjacent fringe areas.
Medium-Density Residential The medium-density residential category would accommodate single-, two-, and multi-family development, with the type of housing permitted determined by the zoning district. The number of housing units per net acre in
6 Cluster development is also referred to as conservation subdivision design.
REVISED DRAFT
VI-9

medium-density residential areas ranges from 1.1 to 6.9, equating to lot sizes ranging from about 6,500 square feet to one acre per dwelling unit. The areas proposed for medium-density residential development on the land use plan map total 347 acres, an increase of about 240 acres over the 2008 level. The area for medium-density development is located in the northwestern comer of the Town in the West Bend sewer service area.
Commercial Land Uses Commercial areas encompass ~ 106 acres, a decrease of about eight-4~acres from the 2008 level of 66 acres. The deGrease in acreage is due to a ree1am;ification of existing GOR'lR'lsrcial I:lsesin 2008 to an industrial land use category on the 2035 plan; h01f'o'eYer, e1€isting eomR'lercial I:Ises R'lay continl:le as long as they are permitted or legal nonconforming uses under the Town 2'oning ordinance. Although not designated on the land use plan map, the Town Plan Commission and Town Board will also consider proposed commercial uses along STH 33 on a caseby-case basis, and may amend the land use plan map and zoning map to accommodate commercial uses along the highway.
Industrial Land Uses Industrial areas on the plan map encompass JM.-330 acres, an increase of ~291 acres over the 2008 level of 39 acres. The plan recommends an industrial park of approximately 330 acres in the southwestern comer of the Town, which constitutes most of the planned increase in industrial uses. Other industrial development would be located in the planned sewer service area near the West Bend Municipal Airport and south of Sandy Knoll Park.
Governmental, Institutional, and Utility Land Uses Development for governmental, institutional, and utility land uses would encompass 38 acres, an increase of 23 acres over the 2008 level of 15 acres. The increase in this category is attributable to an area located at the northwest comer of the intersection of Paradise Drive and S. Church Road for governmental and institutional uses. The Trenton Town Hall, St. Augustine Catholic Church and Cemetery, and the Trenton Township Cemetery are also in this category.
Recreational Land Uses The recreational land use category includes the Town Park adjacent to the Town Hall, Stockhausen Park, Sandy Knoll and Goeden County Parks, and the West Bend Lakes Golf and Recreation area. The Triangle Y Ranch, owned by the YMCA and included in the recreational land use category on Map VI-I, is designated for residential use on the land use plan map. Recreational uses may continue on the Triangle Y property may continue, regardless of whether the land is owned by the YMCA or another organization; however, if the land is eventually sold for non-recreational uses it should be returned to agricultural use or developed for residential uses.
As noted in Chapter V, a neighborhood park should be provided within one mile of residents in areas developed at an urban density, which would include areas designated for low- and medium-density residential use on Map VI-4. The Town has developed a neighborhood park (Stockhausen Park) to serve urban residential areas in the northwestern portion of the Town. A neighborhood park should also be provided to serve planned urban residential areas in the southwestern portion of the Town. The Town should consider preparing a park and open space plan to identify suitable locations and facilities at neighborhood parks. Adoption of a Town park and open space plan by the Town Board would make the Town eligible to apply for State and Federal grants for the acquisition and development of parks and recreational facilities. As an alternative, the Town may consider entering into agreements with the City of West Bend for the joint development and use of neighborhood parks.
Street and Highway Rights-of-Way All existing street and highway rights-of-way (as of January 1, 2007) are shown on Map VI-4 as a separate category. Chapter VIII provides additional information regarding planned transportation facilities in the Town. There are 769 acres, or about 4 percent of the Town, within existing street and highway rights-of-way. This may be expected to increase over the life of the plan as streets are constructed to serve new development, and if arterial streets are relocated or widened.
REVISED DRAFT
VI-10

Airport Acquisition Area The West Bend Municipal Airport, which is owned and operated by the City of West Bend, is located south of STH 33 adjacent to the Town on the west. In accordance with the regional airport system plan,7 the City of West Bend has been working with WisDOT and the Federal Aviation Administration (FAA) to extend the airport runway so the airport can better accommodate business and corporate air travel. Because the airport does not currently meet FAA safety design standards, the City is planning to extend the 3,900-foot runway by 1,600 feet to the northeast to reach 5,500 feet in length, widen the runway to 100 feet, and develop 1,000-foot run over areas on both ends of the expanded runway within the next five years. Expansion of the runway will require a realignment of STH 33 on the north side of the airport. Other recommendations include development of a parallel taxiway, an aircraft hangar area and parking apron, a new precision instrument approach system, an access road, and other support facilities. Airport expansion is contingent on the recommendations of an Environmental Impact Statement (EIS), which is being conducted by the FAA. Phase II of the EIS was initiated in October 2007.
The boundary of the area currently under study for the runway expansion and STH 33 relocation is shown on Map VIA, and encompasses 276 acres. The final plan approved by the FAA may require an amendment to the land use plan map to reflect the airport expansion and STH 33 realignment, and may also require restrictions on residential and other development within flight paths. In addition, much of the Town is subject to height limitations on buildings and structures imposed by the City of West Bend Airport Zoning Code.
Prime Agricultural Lands Prime agricultural lands consist of parcels 35 acres or larger that are covered by soils well suited for the production of food and fiber and which occur in aggregate blocks of farmland or conservancy lands 100 acres or more in extent. Prime agricultural lands encompass ¥-l-45,200 acres, or about ut-25 percent of the Town, on the land use plan map.
Environmental Corridors and Isolated Natural Resource Areas In order to effectively guide land use development within the Town of Trenton into a pattern that is efficient, stable, safe, healthful, and attractive, it is necessary to carefully consider the location of the various land uses as they relate to natural resources in the Town. Avoiding the intrusion of urban development into the primary environmental corridors and other environmentally significant areas will serve to maintain a high level of environmental quality in the Town, and will also avoid the creation of costly developmental problems such as flood damage, wet basements, and failing pavements.
Environmental corridors, more fully described in Chapter V, are linear areas in the landscape that contain concentrations of high-value natural resources, including woodlands, wetlands, natural areas, and critical species habitat sites; as well as floodplains and steeply sloped areas where intensive development would be ill-advised. The primary environmental corridors shown on the plan map encompass 5,l58~ acres, or about 25 percent of the Town. The boundaries of the year 2000 primary environmental corridors were adjusted for the land use plan map to reflect development that occurred between 2000 and 2005, and to reflect wetland stakings in Sections 20 and 28 that were approved by the DNR in 2008.
Where possible, this comprehensive plan recommends that urban development be located entirely outside of primary environmental corridors. While calling for preservation of primary environmental corridors, the plan recognizes that in some cases it may be necessary to allow very low density residential development on the upland portion of such lands (that is, outside surface water, wetlands, and floodplains) and outside areas of steep slopes (slopes of 12 percent or greater). In addition to limited residential development, land uses such as transportation and utility facilities and certain recreational uses may also be accommodated within primary environmental corridors without jeopardizing their overall integrity. Guidelines for the types of development that may be accommodated within various component natural resource features of primary environmental corridors
7 Documented in SEWRPC Planning Report No. 38, A Regional Airport System Plan for Southeastern Wisconsin: 2010, May 1987.
REVISED DRAFT
VI-11
are set forth in Table V-14 in Chapter V. Even though these guidelines are not exhaustive, with good judgment they may be extended to, and be used for the evaluation of, proposals for similar types of development not specifically listed.
Secondary environmental corridors are generally located along intermittent streams or serve as links between segments of primary environmental corridors. Secondary corridors occupy 428 acres, or about 2 percent of the Town, on the plan map. The secondary environmental corridors should be carefully integrated into urban and rural development with the goal of preserving corridor resources. Such areas may also lend themselves to use for public purposes such as parks, drainageways, or stormwater detention or retention areas.
Isolated natural resource areas consist of small areas with important natural resource values, which are separated geographically from primary and secondary environmental corridors. Most of the isolated natural resource areas in the Town of Trenton consist of wetlands or woodlands at least 200 feet wide and five acres in area. Isolated natural resource areas occupy 580 acres, or about 3 percent of the Town, on the plan map. The plan does not recommend the unqualified preservation of isolated natural resource areas; however, it is recommended that the Town give careful consideration to the potential preservation of such areas. Isolated natural resource areas may be well-suited for use for such public purposes as parks, stormwater detention, or retention areas.
The boundaries of environmental corridors and isolated natural resource areas are dependent on the location of wetlands and floodplains. The DNR approved a new wetland inventory for Washington County in 2008. The Federal Emergency Management Agency (FEMA) was working on an update to floodplain delineations in 2008. The boundaries of environmental corridors and isolated natural resource areas within the Town will be updated by SEWRPC following approval of new floodplain maps by FEMA and the DNR and following completion of the 2010 orthphotographs for the County. The Town should amend the land use plan map to include the updated wetland, floodplain, and corridor boundaries once these updates are available.
Other Lands to be Preserved and Wetlands Outside of Environmental Corridors and Isolated Natural Resource Areas In addition to the delineated environmental corridors and isolated natural resource areas, 4(g400 acres, or about 2 percent of the Town, are identified as other lands to be preserved. These areas consist of mostly floodplains within areas planned for urban development adjacent to existing environmental corridors and lands other than woodlands and wetlands owned by the Ozaukee Washington Land Trust. Consideration should be given to preserving such areas in essentially natural, open space use whenever practicable. Some of these open lands may eventually be converted to and reclassified as environmental corridors as natural vegetation develops on these areas during the life of the plan. Floodplain areas are regulated under the Washington County Shoreland, Wetland, and Floodplain Zoning Ordinance, but limited development may be permitted in the floodfringe portion of the floodplain under the terms of the County ordinance. The Town could choose to zone flood fringe areas to prohibit residential and other buildings in all floodplain areas.
Most wetlands five acres or larger are located within primary environmental corridors or isolated natural resource areas. Those that are outside these areas are designated in a separate category on the land use plan map, and encompass 148 acres, or about 1 percent of the Town. Wetlands are regulated under State and Federal laws and County ordinances. Development of wetlands (usually requiring them to be filled) is limited. Permits to allow development in wetlands generally require "mitigation," which requires new wetlands to be created or existing degraded wetlands to be restored. Mitigation may be required on the same development site or in a different location.
Surface Water The Surface Water land use category includes lakes, ponds, rivers, creeks, and streams. Surface water and adjacent shoreland areas should be protected to maintain water quality. Surface waters encompass 297 acres, or about 1 percent of the Town.
REVISED DRAFT
VI-12

Residential Development Standards Land use standards were developed as part of the 2010 Town land use plan to determine the number of acres needed to accommodate housing at the five density classifications identified by the Town. These standards are set forth on Table VI -6. The following policy was also developed as part of the planning process for the 2010 plan for allocating the percentage of new housing units to be provided in each density classification:
• Approximately 14 percent of all housing units in the Town of Trenton should consist of single-family housing units located on lots with an area of at least five acres or an equivalent overall density of no more than one dwelling unit per five acres in areas designated as Country Estates or Rural Density Residential on Map VI-4. It was assumed that 7 percent of new housing units would be provided at the Country Estates Density and 7 percent at the Rural Density.
• Approximately 5 percent of all housing units should consist of suburban-density, single-family housing units on about one and one-half to five-acre lots, or 0.2 to 0.6 dwelling units per net acre, in areas designated as Suburban Density on Map VI-4.
• Approximately 50 percent of all housing units should consist of low-density, single-family housing units on about one to one and one-half acre lots, or 0.7 to one dwelling units per net acre, in areas designated as Low Density on Map VI-4.
• Approximately 30 percent of all housing units should consist of medium-density, single-family housing units on about 6,500 square feet to one-acre lots, or 1.1 to 6.9 dwelling units per net acre, in areas designated as Medium Density on Map VI-4. These lots should be developed and infilled in existing developments or within the planned sanitary sewer service areas of either the City of West Bend or the Village of Newburg.
• Approximately 1 percent of all housing units should consist of two-family and multi-family housing units at densities ranging from seven to 17.9 dwelling units per net acre, in areas designated as Medium Density on Map VI-4. These lots should be developed and infilled in existing developments or within the planned sanitary sewer service areas of either the City of West Bend or the Village of Newburg.
The number of additional housing units needed in the 2035 plan design year is projected by first selecting a population projection. The Town selected a 2035 population projection of 5,980 persons (see Chapter III). The number of residents expected to reside in "group quarters," where applicable, (36 persons in the Town) is then subtracted from the projected total population, and the result is divided by the projected household size (2.50 persons per household in 2035). This number is then multiplied by the HlJD desired vacancy rate of 3 percent to determine the total number of housing units needed in the Town in 2035. The resulting number of housing units is 2,449.
The number of additional housing units needed between 2008 and 2035 to provide an adequate supply is determined by subtracting the number of housing units in 2008 (1,836 units) from the projected number of housing units needed in 2035. The resulting projected demand is an additional 613 housing units between 2008 and 2035.
Based on the allocation percentages above and the standards on Table VI-6, the number of additional acres needed in each residential density category between 2008 and 2035 is: • A total of 506 acres for 43 additional housing units in the Country Estates Residential category. • A total of 253 acres for 43 additional housing units in the Rural-Density Residential category. • A total of 63 acres for 31 additional housing units in the Suburban-Density Residential category. • A total of 352 acres for 306 additional housing units in the Low-Density Residential category. • A total of 61 acres for 190 additional housing units in the Medium-Density Residential category. Of the 190
housing units in this category, 184 would be single-family units and the remaining six would be two- or multi-family units.
A comparison of the acreage needed to accommodate the number of new housing units projected to be needed by 2035 and the increase in acreage in each residential category between 2008 and 2035 on Table VI-5 indicates that the land use plan map includes land for residential development beyond that needed in the year 2035.
REVISED DRAFT
VI-13

#138648 v1 - TRENTON CP TBL VI-6 NMA 8/12/08
Table VI-6
LAND USE STANDARDS FOR RESIDENTIAL DEVELOPMENT IN THE TOWN OF TRENTON
Development Standard Land Use Plan Category (gross area)a
Residential Country Estate-Density (less than 0.1 dwelling units per net acre)D ........... 1,176 acres per 100 dwelling units Rural-Density (0.1 to 0.2 dwelling units per net acre t ............................... 588 acres per 100 dwelling units Suburban-Density (0.2 to 0.6 dwelling units per net acret ........................ 204 acres per 100 dwelling units Low-Density (0.7 to 1.0 dwelling units per net acre)b .................................. 115 acres per 100 dwelling units Medium-Density (1.1 to 6.9 dwellinQ units per net acre)b ........................... 32 acres per 100 dwelling units
a Gross area includes associated street rights-of way and off-street parking for each category. These standards are based on existing land use studies of the Southeastern Wisconsin Region since 1963 and are reasonably responsive to expected future as well as to present conditions.
b Net residential density includes only those areas occupied by dwelling units and associated buildings plus required yards and open spaces. It does not include associated street or utility areas.
Source: SEWRPC.
~l- t~c,

Land Use Projections The comprehensive planning law requires the land use element to include projections, in five-year increments, of future residential, agricultural, commercial, and industrial land uses. Due to the uncertainty in predicting the rate of future development, it was assumed for the purpose of fulfilling this requirement that the same amount of growth would occur in each of the five five-year periods between 2008 and 2035. The amount of growth in each category is estimated as: • Residential: Based on the information above, a total of 1,235 acres will be needed between 2008 and 2035 to
accommodate the 613 additional housing units in the Town. This averages to about 46 acres per year, or about 230 acres in each five-year period between 2010 and 2035, plus an additional 92 acres between 2008 and 2010.
I. Commercial and Industrial: The Town land use plan designates an additional J+7.-331 acres for commercial and industrial uses in 2035 compared to such uses in 2008. This averages to about 60 acres of additional commercial and industrial development during each five-year period between 2010 and 2035, plus an additional +7-lLacres between 2008 and 2010.
• Agricultural: The number of acres in agricultural use will likely decline during the planning period, as land is converted from farming to residential, commercial, or industrial uses. The amount of agricultural land in the Town is anticipated to decrease by between ].5521,566 and 4,738 acres, depending on the rate of residential and other urban development.
PART 4 - LAND USE GOALS, OBJECTIVES, POLICIES, AND PROGRAMS
Goals: ~ A balanced allocation of space to the various land use categories in order to meet the social, physical, and
economic needs of Town residents. ~ A spatial distribution of various yet compatible land uses which are properly related to supporting
transportation, utility, and public facility systems. ~ Encourage residential development outside the West Bend and Newburg sewer service areas only at densities
and in locations compatible with the basically rural character of the Town and thus avoid the need to provide costly urban facilities and services to such development.
~ Encourage the protection, preservation, and wise use of the natural resources in the Town of Trenton. ~ Preserve high-quality open space lands to protect the underlying natural resource base and enhance the social
and economic well-being and environmental quality of the area. ~ Preserve prime agricultural lands in order to provide an agricultural reserve for future generations, to protect
the agricultural resource base of the Town, and to preserve the rural character of the Town. ~ Preserve the remaining primary environmental corridors in the Town and, to the extent practicable, to
preserve the remaining secondary environmental corridors and isolated natural resource areas in order to maintain the overall quality of the environment. Environmental corridors and isolated natural resource areas are shown on Map VI-2.
Objectives: • The planned supply of land set aside for any given use should approximate the known and anticipated
demand for that use. • Properly allocate land uses to maintain an ecological balance between human activities and the natural
environment. • Urban development should maximize the use of existing transportation and utility systems. • Properly allocate urban land uses to avoid or minimize hazards and dangers to health, safety, and welfare
and maximize amenity and convenience. • Encourage new intensive urban development-residential development on small lots, commercial
development, and industrial development-to occur in planned sewer service areas where essential urban services, including municipal sanitary sewer and public water systems, already are available or are planned to be provided within the future.
REVISED DRAFT
VI-14
Policies: o All lands developed or proposed to be developed for urban residential use should be located in areas
that can be served by an existing public sanitary sewerage system. o All land developed or proposed to be developed for urban residential use, should be located in areas
that can be served by an existing or planned public water supply system. o Adequate stormwater management facilities should be provided for all urban development. o Future commercial development along STH 33 will be considered and may be approved by the Town
Plan Commission and Town Board on a case-by-case basis. o Land developed for new retail and service commercial uses should be developed as planned shopping
centers. Development of new commercial strip areas - that is, contiguous individual parcels of shallow depth with direct street access - should be avoided. Commercial development on each comer of an intersection should also be avoided. Avoidance of strip and four-comer commercial development will help prevent traffic hazards, such as conflicts with tuming movements and conflicts between pedestrian and vehicular traffic.
o New industrial development should be located in planned industrial centers. o Prime agricultural lands located outside planned urban service areas that are included in parcels at
least 35 acres in size and in aggregates of 100 acres or more should be preserved for agricultural use. o All remaining undeveloped lands in designated primary environmental corridors in the Town of
Trenton should be preserved in essentially natural, open uses. o All remaining undeveloped lands in designated secondary environmental corridors and isolated
natural resource areas in the Town of Trenton should be considered for preservation as urban development proceeds or used as drainageways, flood water detention areas, or parks.
Programs: •
•
• •
Agricultural uses should be preserved through the application of zoning and land division regulations that allow only agricultural or agriculturally-related uses to occur in areas designated as "Prime Agricultural" on the Land Use Plan Map (Map VI-4), and require a minimum parcel size of at least 35 acres. Protect primary environmental corridors in accordance with the guidelines set forth in Table V -14 in Chapter V. Consider applying the same guidelines when reviewing development proposals in secondary environmental corridors and isolated natural resource areas. Retain Town zoning as the primary means of regulating land uses in the Town. Amend the Town zoning ordinance as needed so zoning district and other regulations are consistent with the land use plan map and other recommendations of this comprehensive plan.
* * * * *
REVISED DRAFT
VI-15
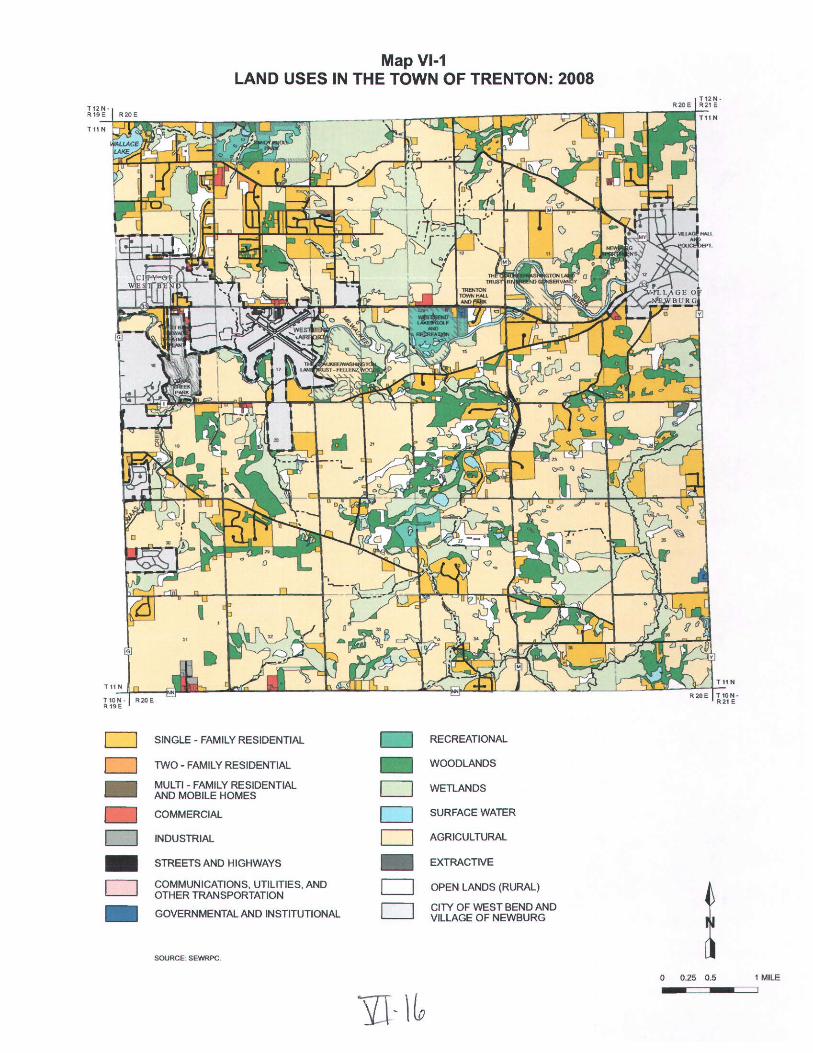
Map VI-1 LAND USES IN THE TOWN OF TRENTON: 2008
D SINGLE - FAMILY RESIDENTIAL D RECREATIDNAL
D TWD - FAMILY RESIDENTIAL - WDDDLANDS - MULTI- FAMILY RESIDENTIAL D WETLANDS AND MDBILE HDMES
CDMMERCIAL D SURFACE WATER
D INDUSTRIAL D AGRICULTURAL - STREETS AND HIGHWAYS - EXTRACTIVE
D CDMMUNICATlDNS, UTILITIES, AND D DPEN LANDS (RURAL)
1 DTHER TRANSPDRTATlDN - GDVERNMENTAL AND INSTITUTIDNAL D CITY DF WEST BEND AND
VILLAGE DF NEWBURG
SOURCE. SEWRPC.
0 0.25 0.5 1 MILE
'lJ- \~
, "
1IO N _ R 20E R lIl E
-o -~ ~ ~ o o
MapVI-2 ENVIRONMENTALLY SENSITIVE LANDS IN THE TOWN OF TRENTON
PRIMARY ENVIRONMENTAL CORRIOORS (2000)
SECONDARY ENVIRONMENTAL CORRIDORS (2000)
ISOLATED NATURAL RESOURCE AREAS (2000)
CRITICAL SPECIES HABITAT SITE (1994)
NATURAL AREAS OF COUNTYWIDE SIGNIFICANCE (NA-2) (1994)
NATURAL AREAS OF LOCAL SIGNIFICANCE (NA-3) (1994)
SURFACE WATER (2000)
CITY OF WEST BEND AND VILLAGE OF NEWBURG (2007)
SOURCE: WISCONSIN DEPARTMENT OF NATURAl... RESOURCES I>JIIO SEWRPC.
)/1- \7
9 NUMBER ON TABlES IJ...9,ANDV· tO (CHAPTER V)
NOTE: PU6UC AND QUASI - PlIBUC OWNERSIiI' ARE CURRENT AS OF JANUARY 1. 2006. CITY AND VIllAGE SOUNDARIES ARE CURRENT AS OF JANUARY t . 2001.
~ 0 0.25 0.5 1 MILE
,

Map VI·3
NATURAL LIMITATIONS FOR BUILDING SITE DEVELOPMENT IN THE TOWN OF TRENTON
~ 100 - YEAR RECURRENCE INTERVAL FLOOOPLAINS (1981)
o WETLANOS (2()()())
o SLOPES RANGING FROM 12 TO 20 PERCENT (2006)
o SLOPES FROM 20 PERCENT OR GREATER (2006)
o SURFACE WATER (2000)
• • o
FORMER LANDFILL (HAS NOT CAUSED CONTAMINATION) (2008)
CONTAMINATED SITES IDENTIFIED BY THE WISCONSIN DEPARTMENT OF NATURAL RESOURCES (2008)
CEMETERY (2006)
CITY OF WEST BEND AND VILLAGE OF NEWBURG (2007)
SOURCE: USDA· NATURAL RESOURCES CONSERVATION SERVICE. WISCONSIN D€PARTIENT OF NATURAl RESOURCES. WASHINGTON COUNTY. AND SEWFtPC.
NOTE PUBLIC AND QUASI · PUBLIC OWNERSHIP ARE CURRENT AS OF JANUARY 1, 2006. CITY AND VILlAGE BOUNDARIES ARE CURRENT AS OF JANUI\RY 1. 2007.
1 0 0.25 O.S 1 MILE
=

0 0 ~ 0 ~ --
Map VI-4 DRAFT LAND USE PLAN FOR THE TOWN OF TRENTON: 2035
COUNTRY ESTATES 0 RECREATIONAL
RURAL DENSITY RESIDENTIAL - STREET AND HIGHWAY RIGHTS-OF-WAY
SUBURBAN DENSITY RESIDENTIAL 0 PRIME AGRICULTURAL
LOW DENSITY RESIDENTIAL - PRIMARY ENVIRONMENTAL CORRIDOR
MEDIUM DENSITY RESIDENTIAL - SECONDARY ENVIRONMENTAL CORRIDOR
COMMERCIAL ISOLATED NATURAL RESOURCE AREA
INDUSTRIAL ~ OTHER LANDS TO BE PRESERVED
GOVERNMENTAL, INSTITUTIONAL, 0 WETLAND OUTSIDE OF AND UTILITIES ENVIRONMENTAL CORRIDOR IINRA
0 SURFACE WATER
PLANNED SEWER SERVICE AREA BOUNDARIES (JUNE 2007)
PROPOSED AIRPORT ACQUISITION AREA
TOWN I CITY I VILLAGE BOUNDARY (.J Q-ttv.CL-r'1 J-t7O -:r ) SOURCE: TOWN OF TRENTON, WASHINGTON COUNTY, AND SEWRPC.
YJ- 19 a 0.25 0.5 1 MILE
-==--==


![Tls_pdi[1] Trenton Equipment](https://static.fdocuments.us/doc/165x107/552084ce4979598e2f8b4b16/tlspdi1-trenton-equipment.jpg)