Predicting land use changes in the Lake Balaton catchment (Hungary)
\ \LAND USE CHANGES IN THE LAKE NAKURU
CATCHMENT ^Implications on Environmental Planning
and Management.
By
John Karanja Kihagi
A Thesis Submitted in Partial Fulfilment of the Requirements for the Degree of Master ofArts in Planning
DEPARTMENT OF URBAN AND REGIONAL PLANNING
UNIVERSITY OF NAIROBI
AUGUST 2000
UkiRfyf.- *RQBI
DECLARATION
This thesis is my original work and has not been presented for a degree in any other University.
John Karanja Kihagi
This thesis has been submitted for examination with my approval as the principal University
supervisor.

11
DEDICATION
To Onesmus, Margaret, Sammy, Naomi, M ary and David. I owe you this
and much more.

Ill
ABSTRACT
Lake Nakuru Catchment covers an area estimated at over 1837 square kilometers. It has a fragile
ecological system which has increasingly had permanent human settlements locating there over
the last one hundred years. Within this period, land use conditions have dramatically changed,
causing major concerns on environmental sustainability o f the entire catchment.
This study undertook to investigate the actual land use changes that have taken place in the
catchment in the past twenty-six years. It also analyses the biological and physical characteristics
of the catchment in order to reveal the environmental implications of changes in land use and
recommend appropriate planning interventions
The Study reveals major changes in land use over the study period. This includes changes in the
proportions of land area covered by forests from 42 percent of the entire catchment area to 22
percent. Small-scale farmlands accounted for 39 percent o f the total catchment land are in 1999
as compared to 9 percent in 1973. Other changes include a reduction in the proportion of land
areas covered by large-scale farmland from 29 percent to 14 percent. In contrast, reduction in the
number of large-scale farms has taken place in tandem with an increase in urban land from 1
percent to 14 percent.
Institutional mandates, strengths and weaknesses together with the legal framework under which
they operate are analysed with a view to coming up with an effective framework under which
land use planning within the catchment should be undertaken in the future. The study especially
notes the lack o f application of modem technology in land use change information acquisition
IV
and analysis namely Satellite Remote Sensing and Geographic information Systems (GIS) within
the Catchment.
The study arrives at the conclusion that land use change in the catchment is evolving in such a
way that continued growth in the number of small-scale farmlands should draw special attention
of urban and rural planners and conservationists in the catchment. The study takes particular note
that transition of land use into the small-scale land units is a transitory step and that this
transformation process points towards a land conversion process from rural/agricultural land use
to urban use.
Some areas in which the study makes recommendations include remedial measures that focus on
farmer conservation training and community involvement in conservation efforts. It also
recommends intensified urban and regional planning and institutional collaboration in land use
change monitoring, planning and control as a means towards sustainable land use within the
catchment. In particular, the study identifies the need for establishment of a Lake Nakuru
Catchment Authority to be responsible for environmental management within the area and to
serve as a coordinator of all the other institutions currently having specific environmental
mandates. As a means of achieving its objectives, the authority should establish a land use and
environmental information system utilizing Geographic Information System (GIS) and Remote
Sensing Techniques.

V
ACKNOWLEDGEMENTS
The successful completion of this work was only possible through the assistance of various
institutions and individuals. I am greatly indebted to the University of Nairobi's Board of
Postgraduate studies and the Faculty o f Architecture Design and Development’s (ADD), Dean's
Committee for offering me a scholarship. Special thanks go to my supervisor Dr. Isaac K.
Mwangi for the guidance, criticism and help that saw me undertake this work from start to
completion. I am also grateful to the principal of Kenya Institute of Surveying and Mapping
(KISM) for allowing me to use the institute’s Remote Sensing and Geographic Information
Systems (GIS) and other computer facilities. I also acknowledge the assistance of the project
manager Food and Agricultural Organistaion, FAO/Africover and the Director of the Regional
Center for Mappimg of Resources for Development (RCMRD), for providing the satellite data
used in the study, and their various staff who assisted me in several occasions. I am especially
indebted to Mr. Douglas Musiega , Mr. John Njaibu (both of KISM) and Mr. M. Sichalwe and
Mr. S. Kibugi of RCMRD and FAO/Africover respectively all who took my problems as their
own problems.
I am grateful to Mr. Ali Nasir of Werugia and Associates, Mr. Muriu of Egerton University, Ms
J. Nyambura of Kenya Agriculture Research Institute (KARI), (Njoro) and my long time friend
Mr. Maurice Muriithi for assisting in field logistics. To Jane I am grateful for the encouragement
that made me go on even when I thought I was beaten. I cannot also forget to thank many other
individuals who assisted in one way all the other. To you all I say thank you and God Bless.

VI
TABLE OF CONTENTS
Title PageDeclaration............................................................................................................. iDedication.............................................................................................................. iiAbstract....................................................................................................................... iii.Acknowledgements................................................................................................ ivTable of Contents......................................................................................................... vList o f Figures......................................................................................................... viiList o f Plates........................................................................................................... viiiList o f Appendices................................................................................................. ixList of Abbreviations............................................................................................. x
CHAPTER ONE: INTRODUCTION..................................................................... 1
1.0 BACKGROUND TO THE STUDY..................................................................... 11.1 AGENDA 21 AND ENVIRONMENTAL PLANNING.................................... 31.2 LAND AND ENVIRONMENTAL PLANNING IN KENYA......................... 41.2.1 Land Pressure and Conflicts................................................................................. 41.2.2 Environmental Policy in K enya............................................................................. 61.3 PROBLEM STATEMENT................................................................................... 71.4 OBJECTIVES OF THE STUDY.......................................................................... 121.5 RESEARCH ASSUMPTIONS AND QUESTIONS.......................................... 141.6 SCOPE OF THE STUDY...................................................................................... 161.7 SIGNIFICANCE OF THE STUDY..................................................................... 181.8 ORGANISATION OF THE REPORT................................................................. 18
CHAPTER TWO: LITERATURE R E V IE W ................................................ 19
2.0 INTRODUCTION.................................................................................................. 192.1 THE NATURE OF RESOURCES........................................................................ 192.2 RESOURCE MANAGEMENT........................................................................... 192.3 LAND AS A RESOURCE................................................................................... 202.3.1 The Concept of the Land U s e ............................................................................... 212.3.2 LAND RIGHTS AND LAND U SE ..................................................................... 232.4 FACTORS IN LAND USE CHANGE................................................................ 242.4.1 Land Use Plans and Policies................................................................................. 242.4.2 Technology in Land U se ....................................................................................... 242.4.3 Physical Nature of the L and .................................................................................. 252.4.4 Personal Choice..................................................................................................... 262.5 LAND USE CHANGE AND ENVIRONMENTAL CONSERVATION......... 272.5.1 Land Use Change and Watershed Conservation.................................................. 28
Um vrpa d d u R A h
A i
28303233353536
3739404242434344
48
4848485152525353
55
55555556596264686870717273
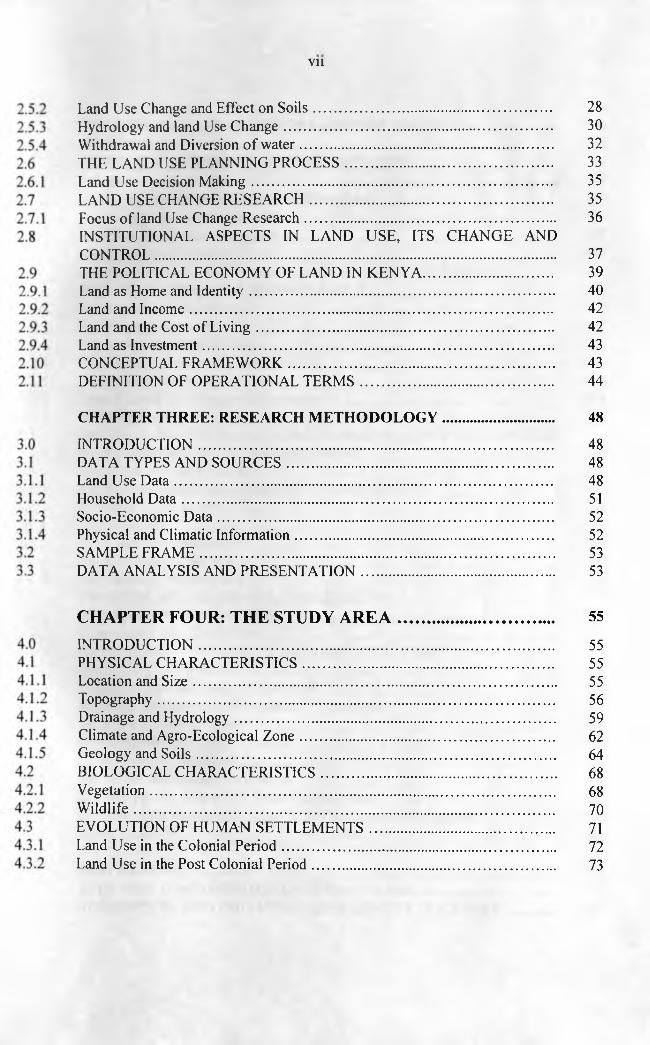
Vll
Land Use Change and Effect on Soils.................................................................Hydrology and land Use Change.........................................................................Withdrawal and Diversion of w ater.....................................................................THE LAND USE PLANNING PROCESS........................................................Land Use Decision Making..................................................................................LAND USE CHANGE RESEARCH..................................................................Focus of land Use Change Research....................................................................INSTITUTIONAL ASPECTS IN LAND USE, ITS CHANGE ANDCONTROL.............................................................................................................THE POLITICAL ECONOMY OF LAND IN KENYA...................................Land as Home and Identity...................................................................................Land and Income...................................................................................................Land and the Cost of L iving.................................................................................Land as Investment................................................................................................CONCEPTUAL FRAMEWORK........................................................................DEFINITION OF OPERATIONAL TERM S....................................................
CHAPTER THREE: RESEARCH M ETHODOLOGY..............................
INTRODUCTION.................................................................................................DATA TYPES AND SOURCES........................................................................Land Use D ata.......................................................................................................Household D ata.....................................................................................................Socio-Economic D ata ...........................................................................................Physical and Climatic Information......................................................................SAMPLE FRAM E.................................................................................................DATA ANALYSIS AND PRESENTATION....................................................
CHAPTER FOUR: THE STUDY A R EA ....................................INTRODUCTION.................................................................................................PHYSICAL CHARACTERISTICS....................................................................Location and S ize...................................................................................................Topography ............................................................................................................Drainage and Hydrology.......................................................................................Climate and Agro-Ecological Z one.....................................................................Geology and Soils..................................................................................................BIOLOGICAL CHARACTERISTICS................................................................Vegetation..............................................................................................................W ildlife...................................................................................................................EVOLUTION OF HUMAN SETTLEMENTS..................................................Land Use in the Colonial Period ..........................................................................Land Use in the Post Colonial Period..................................................................

76767676889197
107
112112113116117118119120
121121123124124126127128
131131
134134135136137138139140142144
147151157
viii
CHAPTER FIVE: ANALYSIS OF LAND USE CH AN G E........................INTRODUCTION................................................................................................GENERAL CHANGES IN LAND USE PATTERNS.......................................Trends in Forest Land...........................................................................................Ecological Setting and Dynamics of Rangelands..............................................Trends in Large-scale Farmlands.........................................................................Trends in Small-scale Farmlands......................................................................Trends in Urban Growth.......................................................................................INSTITUTIONAL RESPONSIBILITIES IN LAND USE CONTROLAND ENVIRONMENTAL MANAGEMENT..................................................The Household Institution....................................................................................The Local Authorities............................................................................................The Kenya Wildlife Services................................................................................The Physical Planning Department......................................................................Department of Lands............................................................................................Other Central Government Departments............................................................NGOs and CBOs...................................................................................................THE PREVAILING LEGAL FRAMEWORK FOR LAND USE CONTROLAND ENVIRONMENTAL MANAGEMENT..................................................Forest Act and the Forest B il l ..............................................................................The Environmental Management and Co-ordination B ill.................................The Land Control A c t...........................................................................................The Water A c t........................................................................................................The Local Government A c t ..................................................................................The Registered Land A ct......................................................................................The Physical Planning A c t....................................................................................CHAPTER SIX: SUMMARY, CONCLUSIONAND RECOMMENDATIONS ......................................................................SUMMARY OF FINDINGS...............................................................................TOWARDS SUSTAINABLE LAND USE IN THE LAKENAKURU CATCHMENT....................................................................................Change in Predominance o f Land U ses...............................................................Provision for Alternative Economic Opportunities...........................................Land Use Control M easures.................................................................................Conservation Training...........................................................................................Urban planning Measures.....................................................................................Lake Nakuru Catchment Authority......................................................................Community Involvement in Forest Management...............................................Environmental Information System for Lake Nakuru Catchment....................CONCLUSION......................................................................................................
REFERENCES........................................................................................APPENDIX I: HOUSEHOLD QUESTIONNAIRE........................APPENDIX II: INSTITUTIONAL ASSESSMENT SCHEDULE

941455457586061636566697580818283838487879699
100109
IX
LIST OF FIGURES AND CHARTS
The main Features of Lake Nakuru Catchm ent.......................The Functions of Land...............................................................Conceptual Framework...............................................................Household Questionnaire Sample A reas.................................Location of Study area in Kenya..............................................Location of Study area in Nakuru District................................Cross-Sections Across the Lake Nakuru Catchment..............Terrain Zones in Lake Nakuru Catchment...............................River Catchments in Lake Nakuru Catchm ent.......................Rainfall Zones in Lake Nakuru Catchment..............................Agro-ecological Zones in Lake Nakuru Catchment...............Soil Texture and Erodability In Lake Nakuru Catchment......The High Population Growth Rate of Nakuru Town...............Land use Pattern in 1973 ...........................................................Land use Pattern in 1987 ............................................................Land use Pattern in 1999............................................................Figure 5.4 (a) Land Use Proportions in 1973 .........................Figure 5.4 (b) Land Use Proportions in 1987..........................Figure 5.4 (c ) Land Use Proportions in 1999..........................Downward trend in forestland..................................................Rural Household energy sources...............................................The gradual decline in large-scale farm s.................................High rate of growth in small-scale farm s..................................Sources of Water for Rural households....................................The gradual increase in urban land use ....................................
597778798889909193949697101102105110112
51677298
132
151157
x
LIST OF PLATES
A Panoramic View of Lake Nakuru Catchment In ......1973 Landsat MSS im agery...........................................1987 Landsat TM imagery.............................................1999 Landsat TM imagery.............................................Recent deforestation At Sururu a rea .............................Saw Milling in the Southern part of the Catchment.....Rangelands in Lake Nakuru catchment........................Ranching in Lake Nakuru catchment.............................Large-scale dairy Farming in Lake Nakuru catchmentSubdivision of Large -Scale Farm s.............................Grass-strips in a large-scale farm ..................................Large scale farms as a buffer..........................................Cultivation on Steep slopes...........................................Open Grazing fields........................................................Soil Conservation in Small-scale farm s.......................The Rapidly Growing Nakuru Industrial a re a .............Kianjoya: An upcoming urban Center..........................
LIST OF TABLES
Land Use Classification Scheme for Lake Nakuru CatchmentAgro-ecological Zone of Lake Nakuru Catchment.................Settler farms in Njoro Division (1960/61).................................Years of land acquisition and Settlement..................................Summary of findings in Land Use Changes..............................
LIST OF APPENDICIES
Household Questionnaire.............................................Institutional Assessment Schedule...............................
XI
CBS
DRSRS
DURP
FAO
GIS
KISM
KWS
LA21
LNC
LNCDP
LNNP
MCN
NRC
RCSMRS
RS
SOK
UNCHS
UNEP
UON
WWF
LIST OF ABREVIATIONS
Central Bureau of Statistics
Department of Resource Surveys and Remote Sensing
Department of Urban and Regional Planning
Food and Agriculture Organization
Geographic Information System(s)
Kenya Institute of Surveying and Mapping
Kenya Wildlife Services
Localizing Agenda 21
Lake Nakuru Catchment
Lake Nakuru Catchment Development Programme
Lake Nakuru National Park
Municipal Council of Nakuru
Non-Residential Cultivation
Regional Center for Services in Mapping and Remote Sensing
Remote Sensing
Survey of Kenya
United Nations Center for Human Settlement (Habitat)
United Nations Environmental Programme
University of Nairobi
World Wide Fund for Nature

CHAPTER ONE
INTRODUCTION
1.0 Background to the Study
Land is normally defined as a physical entity in terms of its topography and spatial
distribution. A broader and more comprehensive view o f land also includes natural resources
such as soils, minerals, water, animals and plants that a particular land area contains. These
components organise in systems o f biological and physical relationships called ecological
systems or ecosystems. Ecosystems work and exists such that they provide for the
maintenance of life support systems and the productive capacity of the environment
(UNCHS, 1992).
As alluded above, an eco-system consists of the physico-chemical environment (abiotic
components), and plants animals and microbes (or the biotic components), which interact in
geographic space. The dynamic interaction of all parts of the environment, especially the
transfer of material and energy is a major concern in the study of ecological systems. Matter
and energy moves from the biotic to the abiotic components of an ecosystem in food webs
and bio-geo-chemical cycles. The biotic components then exert a demand on the ecosystem
in terms of food and shelter requirements. Man is especially significant in exerting such
demand. In pursuit of food, shelter, energy and recreation activities, man has more than any
other specie on earth exerted profound demands on land and its resources.
While land and its resources are finite, the size of human population relying on it for survival
has continued to increase. This has led to an ever-increasing pressure on land resources,
creating competition and conflicts. There is a strong competition between urban
1

development, agriculture and conservation of the natural environment (Langdalen, 1985). In
the urban areas, there are conflicting demands of land for industry, housing, commerce,
agriculture and open spaces for recreation. In the rural areas, unsustainable practices include
exploitation of marginal lands and the encroachment on ecologically fragile areas by the
ever-growing landless rural populations.
The pressure for land results in unsustainable use o f land and its resources including
deforestation, overgrazing, cultivation and habitation o f land ordinarily unsuitable for human
settlement. Forests that act as water catchment areas and also contain essential biodiversity
species have been encroached on either by commercial interests or by rural peasant farmers.
High loss of forestland has led to loss of biological diversity; soil erosion and siltation,
drying up and pollution of water and other land based resources, and the emergence of
erroneous hydrological regimes among other forms of environmental degradation.
Man has for a long time admitted that Land as a basic resource belongs to a wider family
consisting of the dead, the living and countless numbers of unborn (Farvacque and
McAuslan 1992). Many communities have then for a long time viewed land as a form of
inheritance to be passed on to succeeding generations. This realisation has however not
prevented man from plundering the resources that nature provides without due respect to the
sustainability of such use. At the global level, there is now awareness that if future
generations are to enjoy the benefits of land resources, better and more careful management
of these resources is needed. Sustainable development must be achieved by implementation
of ecologically sound, economically viable and socially acceptable policies. This recognition
led to the 1992 United Nations Conference on Environment and Development (UNCED, Rio
de Janeiro Summit) and its plan of action, the Agenda 21
2
Agenda 21 is a programme of action for sustainable development world-wide. Its origin is
the declaration on Environment and Development and the statement of principles for
sustainable management of the environment adopted by more than 178 governments at the
United Nations Conference on Environment and Development, the Earth Summit1. Its
prelude was the calling in 1989 by the United Nations General Assembly for a global
meeting to devise integrated strategies that would halt and reverse the negative impacts of
human behaviour on the physical environment and promote sustainable development in all
these nations.
Agenda 21 then stands for a comprehensive blueprint for action to be undertaken globally in the 21st Century in every area in which human activity is impacting on the environment. It tries to address pressing problems created in the 20,h Century and to prepare the World for the challenges of the 21st Century. (UNDPI, 1997)2
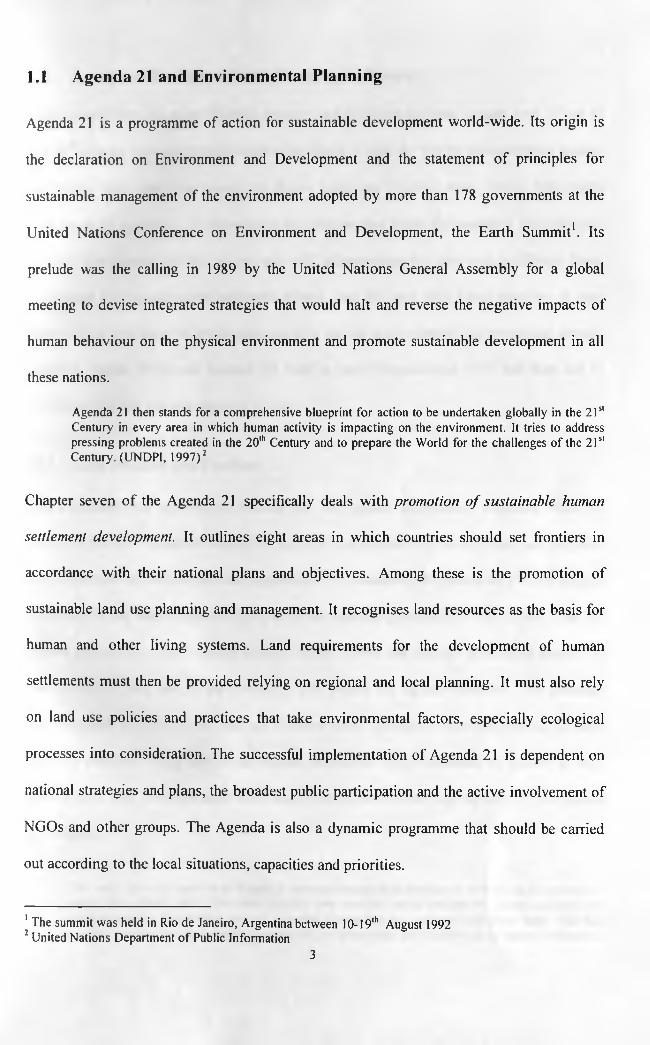
Chapter seven of the Agenda 21 specifically deals with promotion o f sustainable human
settlement development. It outlines eight areas in which countries should set frontiers in
accordance with their national plans and objectives. Among these is the promotion of
sustainable land use planning and management. It recognises land resources as the basis for
human and other living systems. Land requirements for the development of human
settlements must then be provided relying on regional and local planning. It must also rely
on land use policies and practices that take environmental factors, especially ecological
processes into consideration. The successful implementation of Agenda 21 is dependent on
national strategies and plans, the broadest public participation and the active involvement of
NGOs and other groups. The Agenda is also a dynamic programme that should be carried
out according to the local situations, capacities and priorities.
1 The summit was held in Rio de Janeiro, Argentina between 10-19th August 19922 United Nations Department of Public Information
1.1 Agenda 21 and Environmental Planning
3

Land is considered the most valuable resource and therefore the most sought asset. When in
mid 20th century Kenyan Africans went to the forest to start the war for independence against
the British, their army was named the Kenya Land and freedom Army. Native land rights
were the main agenda in the subsequent negotiations that led to the country’s independence
in 1963. The demand for land did not end with independence but only took a different form.
Individuals and organizations continued to seek land for their own. Land was then in high
demand both as a factor o f production and as a way o f accumulating and preserving already
acquired wealth. Sustained demand for land in post-independence years has then led to
conflicts in the use and management of land.
1.2.1 Land Pressure and Conflicts
Kenya extends over a terrestrial area of 582, 646 square kilometres. However about 80
percent or 466,117 square kilometres of this land area is either arid or semi-arid and supports
only 20 percent of the total national population. The remaining 20 percent or 116,529 Square
kilometres of the land supports 80 percent of the national population (GOK, 1994). With the
current population of 28.5 million people, (GOK, 2000), the average population density on
this productive land area is approximately 200 people per square kilometre. The demands
that the population puts on the land are therefore many and often create tremendous pressure
and user conflicts. Rural and urban human settlements have continued to expand at high
rates in such high potential areas with major effects on the carrying capacity of the natural
environment.
The main land use conflict in Kenya is between the physical expansion of towns and retention of arable agricultural land. The other conflict area involves encroachment by human activities on environmentally fragile land such as mountain forests that act as water catchment areas. This has resulted to erroneous hydrological patterns and the subsequent low water levels in national reservoirs.
4
1.2 Land and Environmental Planning in Kenya
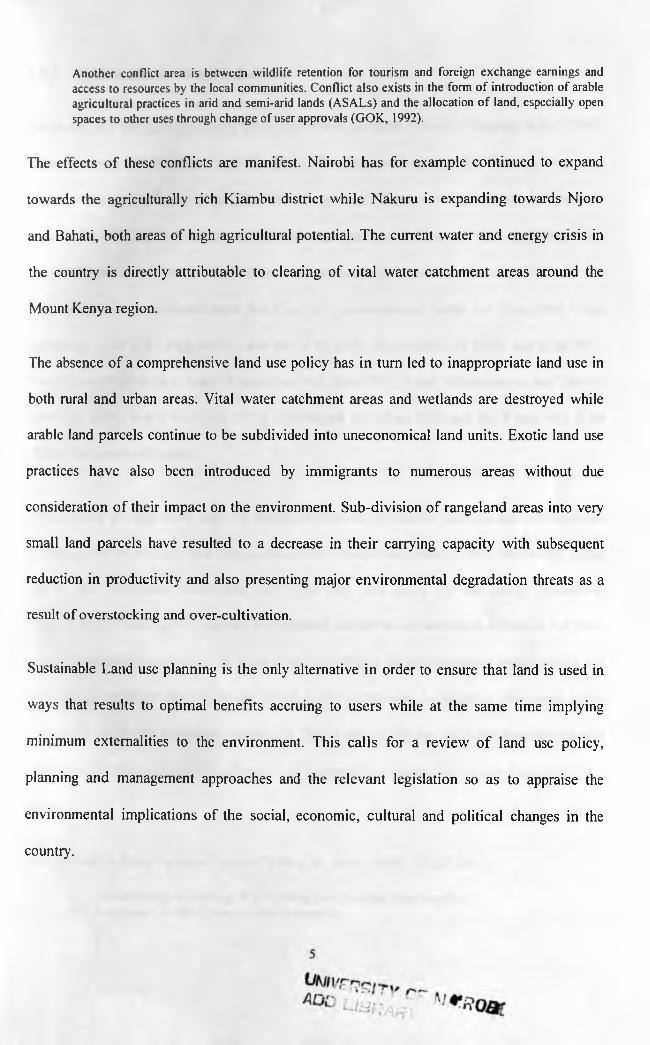
Another conflict area is between wildlife retention for tourism and foreign exchange earnings and access to resources by the local communities. Conflict also exists in the form of introduction of arable agricultural practices in arid and semi-arid lands (ASALs) and the allocation of land, especially open spaces to other uses through change of user approvals (GOK, 1992).
The effects of these conflicts are manifest. Nairobi has for example continued to expand
towards the agriculturally rich Kiambu district while Nakuru is expanding towards Njoro
and Bahati, both areas of high agricultural potential. The current water and energy crisis in
the country is directly attributable to clearing of vital water catchment areas around the
Mount Kenya region.
The absence of a comprehensive land use policy has in turn led to inappropriate land use in
both rural and urban areas. Vital water catchment areas and wetlands are destroyed while
arable land parcels continue to be subdivided into uneconomical land units. Exotic land use
practices have also been introduced by immigrants to numerous areas without due
consideration of their impact on the environment. Sub-division of rangeland areas into very
small land parcels have resulted to a decrease in their carrying capacity with subsequent
reduction in productivity and also presenting major environmental degradation threats as a
result of overstocking and over-cultivation.
Sustainable Land use planning is the only alternative in order to ensure that land is used in
ways that results to optimal benefits accruing to users while at the same time implying
minimum externalities to the environment. This calls for a review o f land use policy,
planning and management approaches and the relevant legislation so as to appraise the
environmental implications of the social, economic, cultural and political changes in the
country.
1.2.2 Environmental Policy in Kenya
The main law that governs spatial planning in Kenya is the Physical Planning Act of 1996.
Prior to enactment of this act, both the Town Planning Act and the Land Planning Act were
used for controlling land use and development on land. These two legislation have been the
main guides in land use and environmental management in Kenya. Other legislation that
have influenced land use and environmental management includes the Land Control Act
(Cap 302), the Local Government Act (Cap 265), Government Lands Act (Cap 280), Trust
Lands Act (Cap 288), Registered Land Act (Cap 300), Registration of Titles Act (Cap 281),
Land Consolidation Act, Land Acquisition Act (Cap 295), Land Adjudication Act, Survey
Act (Cap 299), Water Act (Cap 372), Agriculture Act (Cap 318) and the Forest Act (Cap
385) of the Laws of Kenya.
These pieces of legislation cater for certain aspects of sustainable land use and conservation
of land resources but they lack integration of both policy and practice. This has mostly arisen
due to the numerous institutions and roles they are given by the many legislation.
Consequently enduring institutional conflicts and lack o f co-ordination of effort has led to no
clear roles and hence conflict. In Kenya, the importance of environmental conservation has
attracted government attention in the 1990s, partly in response to trends in other parts of the
world and partly due to internal initiatives. The result o f this has been the formulation of a
national environmental policy in form of the National Environmental Action Plan (NEAP) in
1994.
The objectives Kenya’s environmental policy as, stated in the NEAP are;
a) To facilitating optimal use of the national land base and water resources,b) To promote sustainable use of natural resources,
6

c) To treat environmental conservation and economic development as integral parts in the process of creating sustainable development, and
d) To generate income and meet national and international obligations by conserving biodiversity, reversing desertification, mitigating effects of disasters, and maintaining the ecological balance of the earth. (GOK, 1994)
The main strategies aimed to help achieve these objectives include the retention of protected
areas and creation of others based on existing biological diversity in order to generate and
earn income through tourism. It also includes the formulation of a comprehensive land use
and settlement policy to guide human conduct in carrying out economic activities with a
view to minimising potential negative impacts on the environment and to improve land use
decision making. Effective environmental education and efficient information systems that
are accessible by all users are identified as being crucial in order to achieve the NEAP
objectives. The 1994-96 National Development Plan also detailed the government’s
commitment to integrate environmental consideration in development programmes .
Various other advances have been made towards better land and environmental management.
These include the consolidation of the Town Planning Act and the Land Planning Act into
the Physical Planning Act of 1996. The integration and enactment of this act is expected to
promote better use and development of land through local and regional planning. A review
of both the Water Act and the Forest Act is also being undertaken to making them more
relevant to the current development and environmental conservation challenges. There has
also been enacted an environmental management and co-ordination Act.
1.3 Problem Statement
Lake Nakuru Catchment provides an excellent example of an area with a wide range of land
use and environmental conflicts. The conflicts emanate from the need to conserve wildlife
and its natural habitat, the existence of large and smallholder farming activities and rapid
7

urban development of Nakuru Municipality, all in an area of 1837 square kilometres. Lake
Nakuru Catchment is considered here to be all that area o f land draining into Lake Nakuru.
The catchment contains Lake Nakuru National Park, Nakuru town, Menengai crater, the
fertile agricultural areas of Bahati, Njoro and Mau-Narok and the low potential rangeland
areas around Elementaita. The close proximity of these features is elaborated by figure 1.1
below. The catchment has a unique ecological system with three main features. These are a
high urbanisation rate, geological instability and environmental fragility.
Urbanisation of the Lake Nakuru Catchment is closely tied to the development and
expansion of Nakuru Town. The town was founded in 1904 as a railway outpost, 160-Km
Northwest of Nairobi. At present, the town is the fourth largest town in Kenya after
Nairobi, Mombasa and Kisumu. The Town is the headquarters of Rift Valley Province. From
a mere 17,000 people in 1948, Nakuru’s population has grown to an estimated 360,000. The
population growth rate is currently estimated at 5.68% per annum. The town has also
experienced a high rate of industrial development. There are currently about a hundred
registered industries operating within the town. Some of these industries emit toxic effluents
thus raising important environmental concerns. (MCN, 1996).
Within the catchment is Njoro town, another urban centre whose rise was also inspired by
the railway construction. Although the town has not grown to the size of Nakuru, it has had
significant expansion both in size and function. In 1979, its population stood at 9,026 people,
this rising to 22,023 in 1989. It is currently estimated at 44,000 people. Apart from the high
concentration o f population, Njoro also contains some industrial establishments that raise
environmental concerns. Within the catchment are numerous other upcoming urban centres
8

Figure 1.1: General Features of Lake Nakuru Catchment
Source; Adopted From Survey of Kenya 1;50,000 Map Series
9

mostly acting as satellites of the main towns. The urban centres generally present land use
and environmental concerns of varying magnitudes within their areas and also in remote
coners of the catchment.
Environmental fragility o f the catchment arises out o f the close proximity of the national
park, the urban centres, Menengai crater, the rich agricultural areas and the low potential
range-lands. This presents a mix o f competing land uses that are potentially conflicting.
Lake Nakuru National Park, is world famous for its unique birdlife. It is a declared sanctuary
for the endangered black rhinoceros and home to flamingos among other animal species. In
1989 it was declared a Ramsar site thus attaining the status of a wetland of international
significance. The National Park was the most visited in Kenya in 1990 with 174,994 visitors
(Thampy, 1995). The park therefore plays a significant role in both the national and local
economy as an earner of foreign exchange, a contributor to government revenue and a
valuable source of employment and commercial opportunities to the local community.
Unsustainable land use activities within the Lake Nakuru catchment have then put the future
of the Lake, the National Park and the fragile ecological balance within it at risk. Increased
human population is bound to increase demand of land for urban and agricultural use to
higher levels. Within the Lake Nakuru Catchment, it is expected that such demands have
caused land use changes that could have serious environmental impacts.
To develop and support implementation of improved land use planning and management that
deals comprehensively with the ever competing land requirements for urban development,
agriculture and conservation among others, it is necessary to understand the land use
process, the relationship between the various causatory factors and the recent trends in land10

use. As a way of understanding the land use change process and anticipating the impact of
projected changes, there is need for an inventory of land use and a framework for monitoring
land use change. For a fragile ecology like the Lake Nakuru Catchment, such monitoring
will aid in both detailed and general land use planning and in the preparation of
environmental impact Assessment reports.
thFor the Lake Nakuru catchment, such an analysis should ideally start from the late 19
Century AD when European settlement started. But although it is true that European
settlement in the area brought the first major changes in land use, the most significant land
use changes, from the environmental conservation perspective occurred from the late 1960s
when the independent government started settlement scheme programmes to settle land less
Africans. This started in Bahati in 1967 and then Njoro and Mau-Narok in 1968 (Karanja et
al., 1985). Over the ensuing three decades, more settlement has occurred accompanied by
extensive changes in the demand for land. There is then need for the rationalisation of land
use activities within the area. This should start with an inventory o f current land use and the
regular monitoring of its change with a view to assessing the likely environmental effects.
Land use survey, monitoring and analysis are an important step in land use and
environmental planning;
In a dynamic scenario, the conservation and management policies and practices that have influenced changes in land use are also of importance. In order to detect and measure changes in land use, a periodic monitoring process and a method by which time series may be analysed are required. The execution of such a task requires a tool for mapping landscape and analysis of change. Remote Sensing backed by fieldwork that is predicated on a sound methodology to help gathering of land use data and Geographic Information Systems (GIS) technology to help organise, store and retrieve information when it is required provides such a tool. (Peccol et. al. 1996).
11

Burrough (1996) notes that quick access to large volumes of data, ability to link different
data sets and analyse their inter-relationships is an essential spatial analysis tool in land
resource assessment and environmental planning.
This study is concerned with investigation and analysis of the land use changes that have
occurred within the catchment of Lake Nakuru in the last twenty-six years. The focus is on
the changes as they affect environmental sustainability of the catchment, with the lake’s
ecosystem acting as the centre of focus, and with a view to highlighting the areas facing high
risk of degradation. For this, the study analyses the land use changes in relation to the
biophysical characteristics (hydrology, soil, topography and conservation areas), thus
identifying the possible environmental impacts and the necessary planning interventions.
The main land use classes analysed are urban, agricultural, forestland and conservation
areas.
1.4 Objectives of the Study
The overall goal of the study is to investigate, quantify, analyse and demonstrate the
fundamental changes in land use that have taken place in Lake Nakuru Catchment from 1973
to 1999. Although major land use changes started occurring within the catchment from the
time of colonial settlement and then accelerated with the attainment of independence, there
was previously a problem of documentation of such changes. Land use change information
was however made easy beginning the early 1970s by the emergence o f satellite based
sensor systems that could capture and store information on land cover and land use in
expansive areas at a certain instance. The earliest such imagery for the Lake Nakuru area is
dated 1973. The study is therefore based on the use of multi-temporal Satellite Remote
Sensing imageries to perform land use survey, and Geographic Information System (GIS)12

analysis to assess land use change over the past twenty-six years mainly as a consequence of
population growth, urban expansion and settlement policies. The specific objectives are;
1) To carry out a land use survey within the Lake Nakuru Catchment using both Remote Sensing and
ground survey methods in order to quantify and demonstrate the current pattern of land use.
2) To prepare land use maps for 1973 and 1987 for the catchment using satellite Remote Sensing data
and hence quantify and demonstrate historic land use in the catchment for the respective years. These
are the years when historic satellite data is available for the area of study. They also roughly coincide
with periods when settlement policies that changed land use scenarios were implemented in the
catchment.
3) To relate absolute and relative land use change with the prevailing biophysical characteristics of the
catchment. This will help in identification of the potential environmental threats in specific areas of
the catchment as a result of changes in land use.
4) To recommend land use planning approaches and management measures as interventions in the
existing land use trends. This will be with a view to making adjustments to the existing legislative,
institutional and methodological framework in land use planning and environmental management.
1.5 Research Assumptions and Questions
As a framework for this study, the main assumption is that land use change is bound to cause
environmental degradation. This assumption arises out of the fact that human interference on
the natural environment always causes instability and unsustainable conditions. The less the
natural environment is interfered with, the more stable and sustainable it is assumed to be On
the contrary, the more artificial or disturbed a natural environment is, the more unstable it is
assumed to be. From these two perspectives, urban land is taken to be less preferred to
farmland, which is less preferred to forest and recreational areas. In the same context, natural
forest is preferred to plantation forest. The study also assumes that unless intervention
measures are taken, the trend taken by the land use pattern over the past twenty-six years is
bound to continue. This follows the common extrapolation concept where past and present
land use patterns are assumed to be the guide to the future land use pattern.
13

Based on these assumptions and the objectives, the following questions were formulated to
guide the study;
i. What is the current land use pattern in Lake Nakuru catchment?ii. How has this pattern changed from 1973 to the present?iii. How does this change in land use relate to the biophysical characteristics of the catchment and
what environmental implications does this trend imply in the foreseeable future?iv. What land use planning and management intervention measures are necessary to influence land
use change in the catchment so as to ensure the minimum environmental degradation?
1.6 Scope of the Study
The study deals with land use change within Lake Nakuru catchment as a natural region. The
catchment is one ecosystem, and therefore the environmental problems in a localised area in
the catchment, especially the higher parts are a reflected elsewhere in the catchment. Land
use change is then analysed for the entire catchment, covering an area of 1837 square
kilometres. Biophysical data are also acquired and analysed for the entire catchment. Sample
areas were however chosen for detailed study and analysis of especially socio-economic
factors relevant to land use and environmental conservation.
The focus of the study is land use change and its implication on environmental sustainability
and the possible planning approaches and management measures for intervention. The
effects of this change on soil erosion, water pollution and forest depletion are investigated.
Although most of these effects are experienced in the urban and rural-urban fringe areas,
land subdivision, agricultural intensification and forest depletion are taking place in areas of
the catchment outside pockets of population concentration. These remote areas are often
neglected in analysis, yet they are the areas of profound effect, especially due to their role as
water catchment areas. The study then gives a bias to these areas as the ones most likely to
14
have experienced rapid land use change in the recent past and ones that will continue to
experience the negative effects o f population increase and urban development. Land use
change in these areas is analysed in relationship to physical environmental factors
(topography, hydrology, geology and rainfall), and generally, as it affects soil erosion, water
pollution and forestry depletion.
The study recognises the fact that the effects and relationships between bio-physical
characteristics and environmental degradation like soil erosion and water pollution are
specialised disciplines in their own right. It is however important to relate these processes to
human activity on land so as to explore the extent to which these have aided natural
phenomena in environmental degradation. While not attempting to make deep scientific
analysis of these factors, the study borrows from these knowledge areas holding the physical
environment as a constant and land use as the variable. The output of the various land use
patterns is then the status of the environment.
The study also seeks to provide a general policy, institutional and methodological framework
for land use change monitoring, evaluation and planning in the Lake Nakuru catchment. The
use of Remote Sensing and GIS technology in land use change monitoring and analysis is
emphasised out of the belief that efficient acquisition, management processing and
dissemination of land use information leads to better environmental management. It is
however expected that future change in technology, economic, social and political situations
will necessitate continuous review of such a framework
15

1.7 Significance of the Study
Within the Lake Nakuru catchment, settlement policies, population growth and the
urbanisation phenomenon have caused most of the environmental problems. As the urban
centres keep on expanding, more pressure is placed on agricultural land, which in turn
encroach on forest land and conservation areas. In an area of fragile ecological balance like
Nakuru, these land use dynamics ought to be closely monitored. Data on such changes are
necessary in order to show the magnitude of change and the likely environmental effects. A
time series analysis of such changes will also help in predicting the future direction of
change and hence the necessary intervention measures.
While many environmental studies have been carried out in the catchment, most of them are
by natural scientists who failed to give the necessary regard to human activity3. Most of the
studies also concentrated within the National Park, Nakuru town and the areas adjacent to
the park.4 Recent change in resource management paradigms has however shifted the
emphasis from preservation to conservation. In this paradigm, the co-existence of man and
his natural environment is of prime important.
faking this shift in paradigm, the Kenya Wildlife Services (KWS) and the World Wide Fund
for Nature (WWF), initiated the Lake Nakuru Conservation and Development Project
(LNCDP) in 1988. The Project took a watershed approach in promoting adoption of sound
conservation practices in the development of the Lake Nakuru catchment. This Programme
recognises the effect of land use in remote parts of the catchment to the ecological balance of
the park. Since then, LNCDP has sponsored studies and community development
' Includes Karanja et al. (1985) and Kimani et al. (1992)16
programmes related to environmental management and conservation in the area. In its
second phase, the project proposes the following core programmes;
i) Environmental education programmeii) Environmental conservation programmeiii) Environmental monitoring and assessment programmeiv) Environmental planning programme (Thampy 1995).
In the environmental monitoring and assessment programme, the objective of gathering
information on the state of terrestrial and aquatic environments within Lake Nakuru
Catchment is emphasised. This includes monitoring o f changes especially urban growth,
land use, land ownership and land tenure. The project would, in liaison with government
departments and NGOs involved in development and environmental issues, analyse land use
trends and make recommendations to the District Development Committee and the
Municipal Council of Nakuru. In doing this, the project proposes the Use of Geographic
Information Systems (GIS) for data management and analysis.
Although this study is not part of the LNCDP, it is fashioned to act as a preliminary step to
the programme’s environmental assessment programme. Since environmental assessment
should start with an investigation o f current land use and the previous land use dynamics, it
is felt that a time series analysis o f land use change would be the most crucial starting point
in the programme. In this way, the study gives a picture of the land use changes and also
helps to understand the likely environmental effects of such change.
The study also aims at initiating appreciation of the value of Remote Sensing and
Geographic Information Systems in the study of land use change in habitats where nature
and human environmental subsystems relate in a fragile way. It then also provides broad
guidelines o f the institutional and methodological framework in undertaking detailed land
use studies in the catchment. The framework will also aid in establishing a land use and
17

environmental management information system within the catchment. The study’s adoption
of a watershed approach is out of the conviction that since land use is intricately tied to the
underlying biophysical factors and capabilities, a watershed is then an appropriate landscape
unit for planning, management and research.
1.8 Organisation of the Thesis
Chapter one has served as an introduction to the study. In it the background to the study,
research problem and objectives, assumptions, questions, scope and justification have been
given. In chapter two, literature relevant to the study is reviewed. Chapter three gives the
research methodology while chapter four gives details of the study area. Chapter five gives
an analysis of the data and research findings. Planning and policy recommendations and
conclusions are finally given in chapter six.
18

CHAPTER TWO
LITERATURE REVIEW
2.0 Introduction
This chapter gives an overview o f literature related to the topic of study. It starts by looking
at the concept of resources and resource management. Land as a basic natural resource and
the foundation of all human activity is then looked at, leading to the concept of land use. The
relationship between land rights and land use is then reviewed. Here, the factors that lead to
land use change are also looked at. This leads to the concept of land use change and
environmental conservation. Specific focus is directed at the relationship between land use
change and watershed conservation, its effect on soils, hydrology (water quantity and
quality), withdrawal and diversion of water. The study goes on to look at land use planning
and its role in resource management, land use change research especially its scope and
concern, before looking at the institutional aspects in land use and the unique political
economy of land in Kenya. The study concludes by establishing a conceptual and defining
the operational terms.
2.1 The Nature of Resources
The development of any region is dependent on the amount of resources available. This
resource endowment will also determine the level of welfare of the people resident in such a
region. Man therefore thrives on exploiting the resources that his environment avails for his
use. Zimmerman (1933) observes that neither the environment nor parts o f it are resources
until they are, or are considered capable of satisfying human needs. The implication of this is
that resources are an expression o f environmental appraisal and represent a relative and
a g o • ~ .T Y n r - •V’Qfir
19

subjective concept. A substance within the environment is then not a resource without
people whose wants and capabilities give it its utility.
In 1951, Zimmerman elaborated his earlier statement. He pointed out that natural resources
are dynamic, becoming available to man through a combination of increased knowledge and
expanding technology as well as changing individual and societal objectives.
Attributes of nature are therefore no more than neutral stuff until man is able to perceive their presence, recognise their capacity to satisfy his wants and then devise means to utilise them (Mitchell, 1989, Zimmerman, 1951).
Consequently resources could be said to evolve from a three-way interaction of natural,
human and cultural assets. Natural resources will be defined by human perceptions and
attitudes, technological skills, legal, financial and institutional management as well as by
political customs. Perception of the relative importance of substances thus their ranking as
resources will then vary from culture to culture. It is from this perspective that resources are
perceived as being finite and yet only limited by human ability to recognise utility and
develop technology to improve this utility. The limitations in these then compels man to use
his resources wisely, leading to the concept of resource management and conservation.
2.2 Resource Management
Mitchell (1989), defines resource management as:
“A process of decision making whereby resources are allocated over space and time according to the needs, aspirations and desires of man within the framework of his technological inventions, his political and social institutions and his legal and administrative arrangements”.
Resource management should then be viewed as a conscious process involving judgement,
preference and commitment. It also involves the seeking of certain desired outputs from
certain resource combinations through choice among various managerial technological and
environmental alternatives.
20
2.3 Land as a Resource
Land is a basic natural resource and is the foundation for all human activity. Over the span
of human history, man has drawn most of his subsistence in terms of food shelter and
clothing from land. Davidson (1980), defines land as the interface between the earth’s solid
surface and the atmosphere, consisting of all the characteristics of the biological and physical
(biophysical) environment that have influence on land use. The elements of land include
soils, landforms, geology, hydrology, climate, vegetation, wildlife and effects of current and
past human activities (FAO, 1976).
Part of man’s interest in land and its use lies in its diversity. Land is diverse in the sense that
it may range from well-watered highlands and lowlands to arid and semi-arid regions. The
uses to which land may be put are equally diverse; ranging from agriculture, industry,
residential, transportation, forestry to a myriad of other uses. It is because o f these many uses
that land is better regarded as a resource base rather than a resource in itself (Mather, 1986).
The inclusive term land resource is then often used as encompassing the soil, ground and
surface water, fauna and flora and generally everything that constitutes part of natural
resource endowment of a place.
2.3.1 The Concept of Land Use
The term Land Use is taken to be simple and self-explanatory. But this apparent simplicity is
deceptive (Robin, 1981). Clawson (1965) defines land use as man's activities on land. Stamp
(1961) defines land use as literally the use that is made by man of the surface of the land.
Huque (1987) takes land use to signify the use of land, territorial water bodies as well as the
buildings and improvements thereon. He then points out that land use refers to how land and
its improvements are used and distributed over the locality.21
Land use is then a relative term with the meaning dependent on what one takes land to be.
When land is taken as a source of raw material endowed with valuable elements or deposits,
then, land use is synonymous with resource use, often measured in terms of its economic
productivity. Land use could also be defined in terms of area and places that provide
opportunities to locate various functions such as agriculture, urban residential, industrial,
recreational and conservation.
The above multiplicity of definitions range between two distinct concepts; the functional use
of land for man's purposes (agriculture, residential, recreational) to simply the form of
ground cover (crop, trees, houses). Heiling gives a general definition of land use as;
The accommodation in terms of space, of all man's activities on land and the way in which the land surface is adapted, or could be adapted to serve human needs. Heiling (1995)
Meyer and Turner, (1994) notes that five major uses are usually identified, in land use
studies, largely because it is for these categories that statistics are readily available;
agriculture, forest and woodland; urban land and other miscellaneous land. These broad
categories of land use generally comprise the whole o f the earth’s surface. For detailed land
use studies they could be desegregated into finer subcategories. Agricultural land could for
example take subcategories depending on the scale of operation or type of crops grown. The
miscellaneous use could also take many forms depending on the local situation.
Due to increasing human population and changing human needs and aspirations, there is an
ever-increasing competition between land uses. This is further compounded by the fact that
land resources are finite and the intensity of their use is increasing with population growth
leading to conflicts between the uses (Bernstein, 1993). There is then need to include
22
adequate information in development planning to minimise conflicts, most of which lead to
land degradation and environmental problems.
While recognising the validity o f the multiple definitions of the term land use, this study
prefers to take the term to imply the accommodation in spatial terms of m an's activities and
the resultant adoption and modification of the land surface. It is such modifications that
result to environmental un-sustainability. Remote Sensing methods are capable of capturing
and recording such changes either in digital or analogue form.
2.3.2 Land Rights and Land Use
There are two enduring concepts o f land that influence the views of land users.
On the one hand, land is considered simply as a form of property that may be traded at will. On the other hand, land is seen as more than private property and its possession and use as not just a matter for market forces to determine. In this concept, a sense of stewardship attaches, where land is perceived as a common property, either in the sense of succeeding generations or by extension in the wider sense that the community has an interest in it (Andrews, 1979, Clarke, 1982, Mather, 1986).
It is this aspect of responsibility to the community that is the tenet of land use planning and
consideration of sustainability in the use of land resources.
Caldwell (1974) cites several reasons for the necessity o f change in outlook towards land; a
new view in which privilege to use replaces ownership rights. He suggests that since no man
made land, no man may possess it as his own. The presumption in this view is that the right
of ownership derives from a creative input. There is also the fundamental divergence
between the transience of man and the relative permanence o f land. This distinction,
Caldwell points out, logically leads to viewing the use of land as a privilege, which carries
with it a responsibility to pass it along to successive generations in essentially the same
conditions in which it was received. He then suggests the redefinition of right to mean the
23
right to use or occupy land in accordance with criteria established in the public interest, with
the right of use or occupancy tied to defined economic and ecological capabilities.
2.4 Factors in Land Use Change
Land use change is a complex phenomenon differing greatly from place to place. The causes
of change include personal choice, legislation, governmental policies and plans, decisions of
developers or entrepreneurs, the nature of land itself or the availability of technology to
develop the land (Hill, 1989, Edmunds and Kyle, 1994). A land use category set up at one
point in time can undergo considerable change when one type of subcategory grows or
another is reduced, rendering comparison overtime more complex than simple observation of
maps (Hill, 1989).
2.4.1 Land Use Plans and Policies
Erickson (1995) identifies a two-way interaction between land use change and land use
policy. While Land use change is affected by policies and plans, plans are simultaneously
formulated in reaction to existing physical conditions, perceived changes and threats. This
cyclical iterative process is inherent in the planning process where plans have the dual
functions of reacting to and guiding change. An attempt should then be made to understand
not only the regulations impinging on land use change but also the extent to which land use
plans respond to and document the variety of land use and its dynamics.
2.4.2 Technology in Land Use
In the evolution of the human specie, huge areas of natural land have been converted into
agricultural areas. Large areas of forest cover have been cut down for cultivation and cattle
ranching. Forest and woodlands have also been cleared for wood and other forest products.
24

Urban expansion has also slowly eaten up agricultural land in what can be described as a
land use succession. This process was first driven by the agrarian revolution and its
consequent population growth, (Poleman and Freebaim, 1973).
During the industrial revolution, land use change became a quite different process. At this
time, competition between agriculture and non-agricultural land use emerged. With
improving technology land gradually became a less important resource for food production
and became increasingly used for other purposes like housing, manufacturing, recreation and
infrastructure. The global area under crops has for instance remained unchanged in size since
the 1950s. This is despite a doubling of the world population and a more than double
increase in world food production. The role of technological advancement has therefore a
direct effect on how land use change will take place, (Tolba, 1992).
2.4.3 Physical Nature of the Land
Any change in land use is a potential source o f disruption and the task of the planner
is to supervise their arrangements so that the disharmony they cause is reduced to a
minimum.
This is derived from two basic concepts, one that every land use has its own site requirements in relation to the natural features of the landscape and the second that land uses brought into proximity to one another are likely to show different degrees of compatibility (Edington, 1977).
Erickson (1995) remarks that well-drained areas with fertile soils are best reserved for
agriculture as opposed to urban development. Steep slopes with thin soil layers are best left
under forest cover as a way of protection. Geological formations with poor load bearing
capacity are unsuitable for housing heavy industrial installations while flood plains are
unsuitable for major housing schemes. While to the planner these factor are often considered
25
together and often in a scientific manner, to the land user few or just one factor may be all
that is considered in making a land use change decision. The physical nature of land then
remains a major factor in land use change. The more suitable areas will be exploited first
before the less suitable ones. With increasing population and demand for land resources, the
less-suitable areas will also come to be used This then is the root cause of environmental
degradation.
2.4.4 Personal Choice
The concept of personal choice in land use decision making is hinged on the distribution of
property rights among land owners and land users (Lier et al., 1994). In many countries,
property rights in land have been strongly upheld. Szakal (1994) observes that many private
land use decisions will result in external effects as the individual tries to maximise his
welfare often at the expense of that of the larger society. Brubaker (1977) notes that another
component of such property rights is land speculation. Many writers have discussed the
problem of property rights and land use decision making. Most argue that the problems of
pollution can be solved by extension and optimal distribution of property rights. The other
extreme argues for maximum state intervention and even elimination o f private property
rights.
Hodge (1990) presents a concept of alternative property rights where landowners would
have to pay for the right to modify certain land use practices. Elkins (1989) proposes to
establish a co-operative land hank, which combines individual rights to use land with
community ownership of the land itself. While most authors tend to advocate more state
control, there are also many who point out that not only market failure exists but also
government failure. Anderson (1982) states that the comparison is between imperfect market
26

solutions and imperfect bureaucratic solutions. The main reason for government failure is
that state intervention always depend on political pressure of different groups and not
necessarily on the interests of all members of the society.
The other main reason is that of getting adequate information and the costs and logistics of
enforcing regulations. Willis (1987) proposes that governments measure the product or
service involved and identify the parties concerned and their preferences. If the tasks are
very costly or can not be performed accurately, he warns that government intervention can
leave the community worse off. The conclusion from these analyses is obvious; there is need
for a system of property rights and land use decision making that would ensure sustainable
land use planning by ensuring the elimination of both market and government failure.
2.5 Land Use Change and Environmental Conservation
Land use change is a multi-sectoral process whose trends are influenced by change in
technology, population growth and urbanisation and changes in lifestyles or consumption
patterns. These drives other mechanisms such as increased transportation and personal
mobility, leisure activities, demand for food and other agricultural products and increased
demand for energy and natural resources such as oil, coal and wood. These forces are linked
to certain alterations of the physical land surface and its biotic factors. Alterations will be in
deforestation, drainage of wetlands, regulation of river water systems.
In the end, land cover modification can change the regional hydrology, reduce bio-diversity and influence bio-geo-chemical cycles or even the climate. They can also trigger soil erosion and increase sediment transport (Ryszkowski et al. 1991).
Land use change will then vary in size, intensity, duration and impact. While changes in
agricultural and forestland use often affect large areas, their duration, intensity and even
impact may be short. A forest may be able to generate itself after some years. Urban land use
27
change on the other hand may cause a relatively permanent land cover change. The effect on
forest change may then be more spatially expansive but less intensive than that for urban
expansion. The impacts of such changes will then vary. The effects may also reach further
than to the directly affected ecosystems and trigger multiple ecological damage and land use
change far beyond.
2.5.1 Land Use Change and Watershed Conservation
White (1992) observes that water flows downhill and does so irrespective of the political
boundaries. This is the central tenet of watershed management. Ideally, watershed planning
and management should include agriculture, soil conservation forestry among other
disciplines. Watershed planning is therefore essentially concerned with land use, its change
and impact on other watershed interests such as stream quality and biological units in which
studies on land use change should be undertaken.
2.5.2 Land Use Change and Effect on Soils
Soils occupy a unique position in the lithosphere and atmosphere. They are a transition that
is linked to both the biotic and the abiotic environments. Since many processes are linked
within the soil zone, they can reveal more about an area than any other natural factor
(Steiner, 1991). Land use and land cover changes have notable impacts on the soil, among
them soil erosion and deposition. The two are however segments of the same process of
redistribution of mineral materials across the earth’s surface. In the process, particles eroded
from one site or kind of soil are deposited on another soil at a lower elevation (Ruhe, 1969).
Erosion and deposition are natural processes that have shaped the land surface through the
history of the earth. Human action however dramatically influence their rate and spatial
28
distribution. This is through manipulation of land cover and vegetation and the mechanical
loosening o f the surface of the soil through cultivation (Meyer and Turner, 1994).
Within the conceptual representation of soil formation as a function of climate, biological
organisms, relief or slope, parent rock material and time, mankind has been observed to have
predictable influence on soil. Man manipulates natural soil cover for specific reasons. Boul
(1994) lists five of the reasons for man’s interference with soil cover.
1. Man harvests plants and consumes them at locations distant from where they grew2. Man is selective in the type of vegetation he requires for food. He therefore alters the natural
vegetation cover to favour the growth of those species that satisfy his needs and desires. In doing so he seeks to eliminate crop competition by destroying other plants and animal forms of competition thus leaving the soil surface exposed for various periods of time.
3. Man is impatient. He seeks to grow his desired crops as rapidly as possible to reduce the time between harvests and also to reduce the time in which to protect the crops from competitive species.
4. Man has the ability to alter soil moisture conditions through irrigation and drainage, alter slope by terracing and to augment the soil nutrients by use of fertilisers.
5. In extreme cases, man can completely remove and replace soil by forming new soil as in the restoration of mine spoils or in extreme cases of urban landscaping.
Larson et al., (1984) notes that not all soils in a landscape hold the same potential for
erosion. The same amount of accelerated erosion may severely damage some soil and limit
the future production, but have little effect on some other kinds of soil. Soil erosion hazard
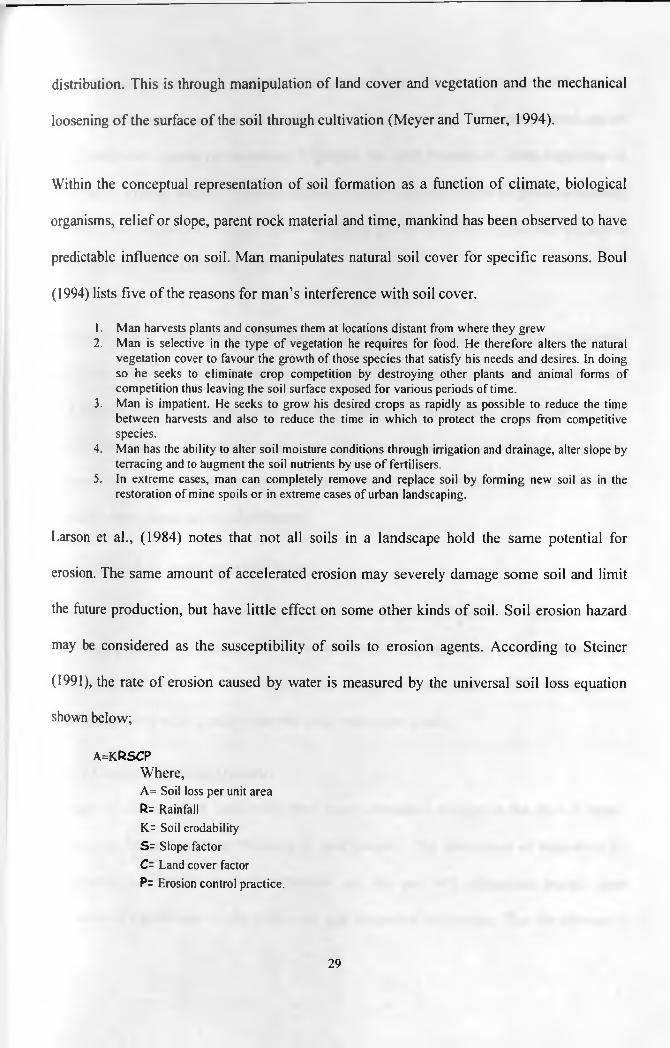
may be considered as the susceptibility of soils to erosion agents. According to Steiner
(1991), the rate of erosion caused by water is measured by the universal soil loss equation
shown below;
A=KRSCPWhere,A= Soil loss per unit area R= Rainfall K= Soil erodability S= Slope factor C- Land cover factor P= Erosion control practice.
29

When the soil surface is not protected by vegetation cover, the rate of erosion is increased.
In most of the accelerated erosion scenarios associated with crop land use, erosion occurs
when fields are cleared of vegetation to prepare for crop farming or when vegetation is
removed by grazing animals. Physical erosion is also made more severe by previous farming
methods that reduce soil fertility, slow vegetative growth and expose the soil surface to
direct raindrop impact (Steiner, 1991).
Oldeman et. Al., (1990) observe that although globally soil erosion due to water is extensive,
only about 10 percent of the adopted mapping units are affected and majority of these only
to a light or moderate degree. They however conclude that although such areas are still
suitable for use in local human settlement, changes in the land use methods to include
conservation practices are necessary to ensure that erosion does not deteriorate and that
gradually, these areas can be rehabilitated.
2.5.3 Hydrology and Land Use Change
Newson (1997) identifies four major and direct impacts of land use change on the
hydrological cycle and water quality in a watershed. They can cause floods, drought, and
change in river and ground water regimes and changes in water quality. While the first three
impacts deal with water quantity, the last deals with water quality.
2.5.3.1 Changes in Water Quantity
Changes in Land use and land cover often cause substantial changes in the flow of water.
Clearing of forests can cause flooding in local streams. The destruction o f vegetation by
overgrazing can lead to reduced infiltration into the soil with subsequent impact upon
renewal and replacement of the vegetation and increasing desiccation. The disturbance of
30
land cover can also make less water available for ground water recharge leading to a new
regime for the ground water resource. The base flow of perennial rivers can be seriously
affected by such a reduction of ground water returns to the rivers with more of the flow
being concentrated in flood or peak periods and less during the dry periods (Newson, 1997).
2.5.3.2 Changes in Water Quality
Human use o f land may introduce many pollutants into the aquatic ecosystems. Cutting of
trees can lead to increments of sediments reaching the streams and such sediments can
seriously disrupt the natural aquatic ecosystems. A change in turbidity may disrupt the
feeding and breeding of many surface feeders and also inhibit the action of sunlight in
stimulating algae growth. Widespread use of fertilisers in agricultural fields introduce large
amounts of plant nutrients which accelerate eutrophication, a process which promotes plant
growth, depletes dissolved oxygen and which may kill aquatic life, change ecosystems and
make water unfit for drinking. Bacterial pathogens, viruses and parasites from untreated
sewage can cause diarrhoea and other diseases. Heavy metals and toxic chemicals
contaminate sediments and bio-accumulate in fish in plants, exposing organisms throughout
the food chain to toxins, which may cause diseases and birth defects (Van Lier et al., 1994).
The sources of the pollutants may be categorised into point and non-point sources. While
agriculture and forestry are the main non-point sources (NPS), of pollution, urban storm
runoff and combined sewer overflows are the major point sources of aquatic pollution.
Traditionally point sources of pollution have been given more attention, being the most
observable causes of pollution. It has of late come to be realised that the NPS contribute
more to aquatic pollution than the point sources. Rodgers (1994) observes that in America,
NPS contributed more pollution to aquatic environmental pollution in 1984 than the point

sources. The implication of this observation to water quality management is that time has
now come to shift emphasis of regulatory programmes away from an end-of-the-pipe point
source control to control of NPS (Meyer and Turner, 1994). There is consensus among
experts that the technological means for controlling NPS runoff exists and that development
of technology is no longer the paramount objective. The diffusion and adoption of that
technology then takes precedence. This is best achieved by land use control and management
practices that take recognition of the need to protect fragile ecological system from Non-
Point Pollution involving community awareness and involvement (Rodgers, 1994).
2.5.4 Withdrawal and Diversion of Water
Changes in land use often result to changes in the status of both surface and groundwater
resources. The impact o f surface activities on subsurface hydrology is especially often
neglected. Ground water is important for several reasons; it forms the major water supply
source in most parts of the world especially the rural areas. Where not the major source, the
inherent values of ground water (purity, constancy and extent), make it an important
resource to moderate and modulate the surface water regime and surface ecosystems.
Generally, ground water systems react slowly to surface impacts but more profoundly. The
costs are also greater in rectification of ground water condition once damage is done
(Newson, 1977).
While underground hydrology at the global level has been extensively studied with
geophysical techniques to a point where it can be modelled, a major problem of lack of
knowledge of subsurface processes exists at the local scale. It is however true that few parts
of the earth’s land surface are truly impermeable and that subsurface water exists almost
everywhere in either deep or shallow aquifers. Surface rivers often interchange water with
32
the aquifer with important benefits for abstraction by both human and plant communities. In
the humid tropics where surface water is bound to be associated with water borne diseases,
ground water becomes o f paramount importance (Newson, 1997).
Surface water abstraction for irrigation often lead to significant reduction in river flows
There are also problems associated with abstraction of ground water at a rate higher than that
of the aquifer recharge leading to an overdraft. This depletes the volume of water thus
destroying habitat for plants and animals. It also leads to high levels of salination by making
it difficult for water bodies to assimilate pollution loads (Rodgers, 1994).
2.6 The Land Use Planning Process
Land use planning is a prerequisite to sustainable development (Habitat, 1994). It has been
described as the centre-piece of Urban and Regional Planning, as it is concerned with the
best use of land in view of accepted objectives, environmental and social opportunities and
constraints (Roberts, 1988). Lovejoy, (1973) describes it as the planning for the most
appropriate use of land while Chapin, (1979), views it as being concerned with the location,
intensity and amount of land for various space using activities. Dent (1988), describes land
use planning as a systematic process for guiding land use decisions such that land resources
are put to the most beneficial use while conserving resources for future use.
While the specific objectives of Land use planning will depend on the local situation, the
overall concern should be the formulation and implementation of plans, projects,
programmes and policies to reach sound use of land. This should include efficiency in the
use of land resources, equity between the competing uses and a balance between short-term
benefits and long-term conservation of the resources (FAO, 1994). It then becomes evident
33

that Land use planning may be undertaken at any level of government, private individuals
and corporate bodies. Samson (1975) describes Land use planning as the governmental
process that directly regulates or influences the use of land not directly owned or directly
controlled by the planning agency. This view of Land use planning differentiates it from land
management planning and land development project planning.
Chapin and Kaisser (1979), identify six distinct elements in the rational Land use planning
process. These are problem identification, definition of goals and objectives, determination
of alternative solutions, formulation of plans, selection and implementation of the preferred
plan and finally monitoring and evaluation of progress. Land use planning is therefore a
cyclic process involving continuos scanning of the environment, analysis o f the findings and
formulation of strategies to help achieve development goals of the community.
The concept of scanning of the environment is of particular importance to planning.
Scanning is important in the initial formulation of plan goals and objectives. It also becomes
important in monitoring the plan impacts and achievements. For land use planning, scanning
involves a survey of the initial land use and then monitoring of the changes in land use over
certain epochs of time. Such a monitoring not only helps in knowing the outcomes of certain
land use policies but also aids in assessing the likely environmental impacts of changing land
use. The aspect of scanning or monitoring is especially important in that it aids in the
compilation of a knowledge base for land use planning. It also provides a continuos source
of information that could be used to judge the outcomes of plan policies and show where
adjustments are necessary (Addink, 1999).
34
2.6.1 Land Use Decision Making
Decision making in land use is an extremely complex process and its investigation is fraught
with difficulties. Few researchers have the necessary breadth and skills in relevant fields
such as agriculture, economics, sociology and psychology among other sciences to properly
investigate the issue. The problem then requires a multi-disciplinary attention. Mather, 1986
identifies seven factors that influence land use decision making. These are type of land
ownership, environmental perception, information available, age, education, personality and
socio-personal factors and cultural factors. He also identifies three layers or levels of
decision making about use of resources in general and land in particular. To be selected a
type of use must be perceived as physically possible, acceptable within the cultural milieu
and have a perceived utility (Hill, 1989, Edmunds and Kyle (1991). Firey (1960) sums up
these requirements as possible, adaptable and gainful.
2.7 Land Use Change Research
Throughout the world, planners and policy makers have to make strategic decisions on
environmental protection, infrastructure development, land development and land
administration. In many developing countries, they rarely have access to up-to-date base
maps and systematic information on the extent o f settlement, land use patterns,
environmental problems and infrastructure (Paulsson, 1992). A reliable information base is
essential for strategic decision-making. Lack of information contributes to problems, among
them the disregard of environmental impact of changes in land use.
In the definition and analysis of the problem, inventories of the natural environment and the
existing land use in an area are required. While traditionally such an inventory was used to
determine environmental constraints to development, there is currently a growing emphasis
35
on environmental conservation for sustainable development. New methodologies for
inventorying and analysis of natural environmental factors in Land use planning have then
been advanced. Changes and trends in land use are of particular concern.
2.7.1 Focus of Land Use Change Research
Although much research has been done in the field of land use change, there is yet to emerge
a consensus as to what ought to be the focus of such studies. The question of the focus in
land use change research has also been debated with no one answer being agreed upon. The
International Geosphere-Biosphere Programme (IGBP, 1993) in its study on Relating land
Use and Global land Cover Change concludes that;
The main focus of research on land use change should be in detailed investigation of changes in rural land use change. This view is based on the observation that rural land use comprising of agriculture and forestry occupies most of the land surface on earth. It is estimated that the area covered by built up areas covers less than one percent of the earth’s total area. In contrast, areas used for agriculture and pasture cover close to 40 percent of the global area (IGBP, 1993, Meyer and Turner, 1994).
While admitting the spatial dominance of rural land use, Heilig (1995) argues that rural land
is just but one of the processes that shape global land use and land cover. He observes that
there are other probably more important land use changes which are caused by urbanisation,
infrastructure expansion, industrial expansion or changes in consumption patterns and
lifestyles. He laments that the effect of such a conception is that;
Books and papers on land use change are somewhat monotonous, tending to address just the two subjects, (trends in deforestation and agriculture). Such studies treat areas of settlement and infrastructure as being so small in size that they are irrelevant (Heilig, 1995).
Heilig's main concern is in that while changes in the built-up land might affect only
relatively small areas as compared to the extensive areas o f forests and agricultural land,
they are however more persistent and intrusive. Economic modernisation and urbanisation
also cause changes in rural land use. Changes in rural land use are then often caused by
36

use change usually view the world as a rural place, portraying areas of infrastructure and
settlement as so small in size as to be insignificant. Heilig goes on to conclude that by
observing today’s rapidly expanding urban areas at the expense of arable and forestland;
It is absurd from a demographic and economic point of view to focus land use change research on rural and forest areas alone. Urbanisation has become the basic driving force to land use change. Agricultural and forest sectors are no longer driven exclusively by food and resource demands. They also have to provide for the numerous needs and rapidly changing urban lifestyles. Consumption patterns in these areas can trigger fundamental land use changes in the rural areas. Rural land although still large in size is then slowly becoming the hinterland of urban areas, which are more and more determining how land will be used. (Heilig, 1995)
Land use has then to be studied as a multi-dimensional process which links activities in
various sectors to changes in land cover. Both rural and urban land uses have to be seen as
constituting one phenomenon. The rural land use is important as the dominant contributor to
the spatial land cover. Urban land use is also significant because of the intensity and relative
permanence of its impacts and its influence on rural land use change. An attempt should then
be made to have land use change research address both urban and rural land use.
2.8 Institutional Aspects in Land Use, its Change and Control
Institutions are rules of society or o f organisations that facilitate co-ordination among people
by helping them to form expectations, which each person can hold in dealing with others
(Rutatan and Hayami, 1990). Institutions can also be defined as humanly devised constrains
that shape human interactions, whether political, social or economic. They consist of
informal constraints and formal rules and their enforcement characteristics. Institutions are
then a way of doing things, usually reflecting formal and informal rules and norms
influencing the boundaries and interactions between individualism and social co-operation
(Mwangi, 1998).
driving forces, which emanate from the urban centres. He wonders why researchers on land
37
Institutions are usually developed by users of shared resources, as a way o f agreeing on a set
of rules to govern the use of these resources. Institutional frameworks can have widespread
effects upon incentives and disincentive structures that can operate for environmental
management. Institutions are central in social bonding, in social functioning and in
influencing the relationship among organisations (Pugh, 1996). They have possibilities to
express comparative advantage and therefore major impact on social, economic and
environmental development.
Various institutions including households, firms, government agencies, Community Based
Organisations (CBOs) and Non-Governmental Organisations (NGOs), each has
characteristic comparative advantage. Firms have comparative advantage in
entrepreneurship, government agencies in policy making, setting property rights and in
institutional reform, NGOs and CBOs in mobilising household efforts and households have
advantages in some aspects of personal and social development.(Coarse, 1996). Institutions
in the context of this study can then be taken to mean arrangements for conducting specific
affairs regarding land use planning and environmental management.
Valenzuela, (1989) notes that for effective planning and environmental management, timely,
accurate and cost effective information on land use and its dynamics is vital. In the current
era of information technology, this calls for the use of modern information technology in the
gathering, processing management and analysis of land use change information. Land use
information management technology can only be successfully applied after institutional,
procedural and information quality issues have been addressed.
38
Burrough (1986) suggests that in developing a land use change monitoring framework, there
must be a management policy dealing with institutional mandates and linkages, strategies,
human skill development and financial management. The first step should then include
identifying the potential collaborating agencies, defining the information needs, setting
priorities and then comparing these with the existing information and capabilities of data
producers and users. In improving information management, the major costs are data
acquisition, institutional improvement, education and training. Equipment on the other hand
will represent less than 20% of the costs in developing and managing such a system. One
successful institutional model is to set up a network of information sharing agencies.
Different agencies retain responsibility for their own information and agree to share parts
that are of interest to others. A separate regional or municipal agency can handle inquiries
for data and act as a co-ordinator and a catalyst in the network (Burrough 1986)
Burrough however warns that a high level of technology does not necessarily produce better
results. It takes little effort to create the institutional structure or reach the basic level of
technology needed to start applying a land use information system. Education and training at
all the levels should be an integral part of the strategy. Amount and type of information
needed depends in part on the level of technology needed. Training of hands-on users should
however be accompanied by education of managers about concepts so they can make wise
decisions on its use.
2.9 The Political Economy of Land in Kenya
The value of land to the Kenyan social economic and political life is best described by In his
book Back to Land, he argues that;
Our greatest asset lies in our land. In land lies our salvation and survival. It is in this knowledge thatwe fought for the freedom of our country. Whatever our plans for the future, they must spring from a
39
resolve to put maximum production of our land however small the acreage we may possess (Kenyatta, 1964).
Mbithi (1980) observes that land has been a matter of crucial importance in Kenya not only
fo r economic considerations but also - and more so, in regard to culture, existence and
ontology. Kenyatta (1978) says this had been so in the pre-colonial era, when land ownership
was the foundation rock of the tribal economies. During the colonial era, there was
establishment of scheduled areas and African reserves. This led to increase in land problems
and the importance of land in the eyes of the African was increased even more. The post
colonial period was then characterised by a scramble for land which was seen as a dwindling
resource. Land is then currently the most sought asset, be it in the rural or urban areas of
Kenya (Mbithi 1980).
Kohler (1987) identifies four functions that land fulfils to the African. These are as a home,
contributor to income, reduction in the cost of living and as a form of investment. Figure 2.1
below demonstrates these relationships. The crucial point, he notes is that through the
acquisition o f land, not only the material needs like food or shelter are met but also social
and moral needs which in contrast to the material ones do not respond to physiological
deficiency but to the desire for self-actualisation.
2.9.1 Land as Home and Identity
Muriuki, (1984 ), notes that to the Kenyan, the term home has several meanings. To many, it
is a place that provides identity. Land also acts as a representation of the people, where
representation here goes beyond the living to include the dead and the unborn. This attitude
is deeply entrenched even in the most sophisticated strata of the Kenyan community. To
many, to be buried in a cemetery is unpropitious. They have to be buried on their land so that
they can always be remembered. Many people then buy land as a place to die and rest.
40
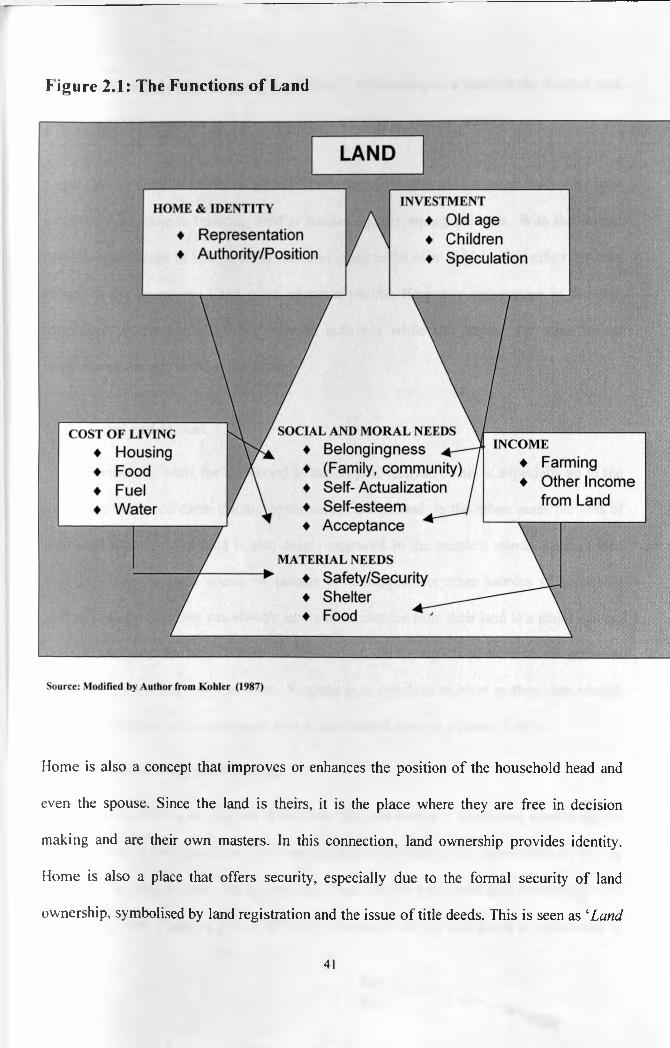
F igure 2.1: The Functions of Land
Home is also a concept that improves or enhances the position of the household head and
even the spouse. Since the land is theirs, it is the place where they are free in decision
making and are their own masters. In this connection, land ownership provides identity.
Home is also a place that offers security, especially due to the formal security of land
ownership, symbolised by land registration and the issue o f title deeds. This is seen as 4Land
41

that no one can take away from the legal owner’. This concept is a result o f the colonial land
policy and the feeling that land as a resource is dwindling. (Kohler, 1987).
Dutto (1975), describes home as a place where the aged retire and are taken care-of by their
children. According to tradition, land is divided equally among the sons. With the current
economic hardships in Kenya, home has also come to be seen as place that offers the only
refuge to the unemployed and often educated youths. Here they can engage in farming,
small-scale businesses and other informal activities while still hoping for some formal
employment, mostly in the urban areas.
2.9.2 Land and Income
Land provides the basis for livelihood to majority of Kenyans. This is especially so in the
rural areas where off-farm income opportunities are limited. In the urban areas the idea of
individual ownership of land is also deeply engraved in the people’s minds. Land is then
used as either the main source o f income or to supplement other sources of household
income. The fact that one can always secure some income from their land is a major driving
force in the quest for land. Where unemployment and laying off of workers are common
phenomena, the initial goals of many Kenyans is to buy land as soon as they save enough
from either business or employment or even agricultural sources (Kohler, 1987).
2.9.3 Land and the Cost of Living
To most Kenyans both in rural and urban areas, land ownership is a sure way of reducing the
cost of living. In the urban areas, one would significantly reduce their expenditure by buying
a plot and building a home than by renting a house. In the rural areas land ownership is not
only a cheap way of getting a home but is also far much cheaper than living in rented land. A

common practice is where men buy land in the rural areas and leave their spouses and
children to live and work there while they engage in wage employment in the urban areas.
According to the World Bank (1982) the difference between the cost of living in the urban
and rural areas differed by almost 70%. Many people therefore prefer to own land and stay
in the rural areas as a way of reducing the cost of living.
2.9.4 Land as Investment
With an economy that is prone to high inflation rates, land is considered by far the best form
of investment. In the former scheduled areas like Nakuru, land prices generally increased at a
higher rate than inflation in the first two decades of independence. This influenced people’s
conception o f land as a way of safeguarding wealth against inflation and as a means of
speculation. In many parts of the country, the rich buy large tracts of land then wait and
subdivide for sale several years later, thereby making good returns on the initial investment
(Kohler, 1987, Dutto, 1975,).
2.10 Conceptual Framework
Based on the above review, the conceptual framework of the study is given below. This
starts by recognising land as the basis of all human activity. As the natural resource base, it
includes soils, mineral, water, plant and animal species to which man assigns some utility in
order to meet his needs. The interaction between man and his environment is governed by
the prevailing social, economic and political conditions. Urbanisation and demographic
factors are especially important in determining people’s interaction with the land resources.
The interaction lead to land use change, which cause negative environmental effects. Among
these are soil degradation, deforestation, loss in biological diversity, pollution of terrestrial
and aquatic environments and loss in landscape beauty.
43
These effects on environment are then the essence of land use survey, including monitoring
and analysis of the changes in land use. In undertaking such surveys, various methodologies
are used to acquire the necessary categories of information. Aerial photographs and satellite
Remote Sensing provides information on land cover from which land use can be inferred.
This is supplemented with field methods like questionnaires, Rapid Rural Appraisal and
Participatory Rural Appraisal. After data has been gathered, GIS provides the data
management and analysis facility. By monitoring land use change, trends in land use and the
consequent environmental effects would be revealed and therefore take mitigating measures.
The analysis should then lead to land use planning and policy guidelines, as an intervention
to ensure a more sustainable use of land resources. This is effected by agencies of the society
including households, Local authorities, Central Government agencies, NGOs and CBOs.
These relationships are illustrated by figure, 2.2 below.
2.11 Definition of Operational Terms
LandThe study adopts a broad definition of land to include the earth’s soils surface and the
biophysical environmental. In this way land is taken to be synonymous to land resources.
Land Use
This study takes Heilig's definition o f land use as the accommodation in spatial terms, of all
man’s activities on land and the way in which the land surface is adapted, or could be
adapted to serve human needs. In this context the decision to leave the natural environment
undisturbed will also constitute land use as conservation areas.
44
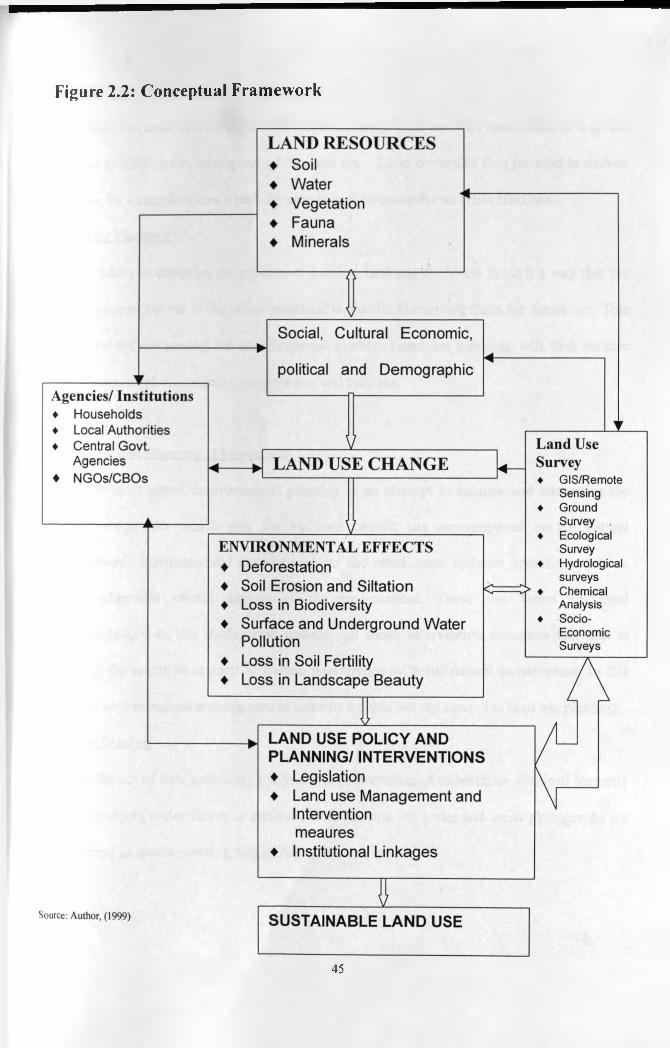
Figure 2.2: Conceptual Framework
45
Lund Cover
Although the term land cover is often used to imply land use, this study defines it as the
form of ground cover, arising out of the land use. Land cover can then be used to deduce
land use for example where a built-up area is seen to comprise an urban land use.
Land Use Planning
This is taken to comprise the process of guiding land use decisions in such a way that the
land resources are put to the most beneficial use while conserving them for future use. This
also involves conserving the environmental quality. Land use planning will then include
formulation of plans, projects, programmes and policies.
Environmental Planning / Management
In its broadest sense, environmental planning is an attempt to balance and harmonise the
various enterprises which man for his own benefit has superimposed on the natural
environment. Environmental management on the other hand includes specific activities,
which addresses certain aspects of the environment. These two terms are used
interchangeably in this study. This includes all those intervention measures that aim at
reducing the negative impacts of human interference with the natural environment. In this
context, environmental management is taken to include but not limited to land use planning.
Remote Sensing
This is the act of data gathering, analysis and presentation of information obtained remotely
from the object under survey or analysis. Both satellite imageries and aerial photographs are
considered as remote sensing data in this study.
46
Geographic Information System (GIS)
This is taken to be a system for collecting, inputting, processing, integrating, analysing,
modelling and reporting information related to the earth surface. Although this could be a
manual information system, the study puts more emphasis on computer based systems.
Ground Truthing
This is a process of validating the accuracy of image interpretation by visiting sites of the
study area and checking whether the interpretation coincides with the ground condition.
Data/Information
Data is taken to imply a set of facts or figures, which have been collected in a systematic
manner and from which conclusions may be drawn. Information on the other hand comprises
data that have been processed in order to have meaning. In this context, what constitutes
information for a certain purpose may be merely data for another type of operation.
Biophysical Environment
This includes all the biological and physical characteristics of an area.
Catchment. Basin and Watershed.
Essentially, drainage basins and watersheds are the same thing, (catchment areas), In this
study the terms are used interchangeably as implying the same thing.
47

CHAPTER THREE
RESEARCH METHODOLOGY
3.0 Introduction
This study aims at analysing land use changes within Lake Nakuru catchment in three
epochs. Land use surveys are then undertaken for the years 1973, 1987 and 1999. Land use
change within the study area is perceived as a consequence of demand for land for urban
development, agricultural and recreational purposes. The study seeks to establish trends in
land use and identifying what changes are occurring and where they do occur. The study also
seeks to relate the changes to physical, biological and human settlement factors in order to
increase understanding on the land use change process and its implication to environmental
conservation. By classifying land use activities, the study provides a framework for future
land use change monitoring, forecasting and analysis using Remote Sensing and Geographic
Information Systems (GIS) techniques. The methodology adopted to achieve the study
objectives is discussed in this chapter.
3.1 Data Types and Sources
Various data types were required for the study. Some o f these were already available from
various sources and were accessed as secondary data. Others data types were not readily
available and had to be got from the field as primary data. The various data types and their
sources are given below.
3.1.1 Land Use Data
This study is based on the use of Satellite Remote Sensing data in a multi-temporal land use
study. Remote Sensing and ground truthing were then incorporated in a land use survey
48

exercise. A base map of the catchment was prepared by selecting parts o f five Survey of
Kenya 1:50,000 Topographic Map sheets, areas that are incorporated within the Lake
Nakuru Catchment. For ease of handling as one map sheet, the scale of the five map sheets
was reduced to 1:100,000 using a Large Format Frame Camera. Transparent positive prints
were then made of the various sheets and these were joined to make one base map.
In order to map land use, it is necessary to first classify the various categories of use within
the area of interest. Land use classification is a hierarchical process where a certain class can
be desegregated to classes of a higher order. Although the classification scheme used in this
study obeys this general rule, only the first level of classification was used in the analysis.
Land use categories used are then general, but with capability of being desegregated to more
specific categories. Built up areas were for example jointly classified under urban land use,
but this could be broken up to industrial, commercial, residential, etc, and yet each of these
uses can be further broken down. Large-scale farms can also be categorised as to whether
they are crop or dairy farms and the crop farms could be further classified as to the specific
type of crop. Each of this land use would have significantly different environmental impacts.
Different crop types for instance protect the soil against erosion to different degrees. The
breaking down o f these land uses can aid in detailed environmental impact analysis of the
land use. Due to the general land use classification used in this study, the environmental
impacts are also dealt with in a general manner.
For current land use, a Landsat Thematic Mapper (TM ) Satellite imagery of 1995 was
interpreted visually for land use class types. This was supplemented by 1993 aerial
photographs at a scale of 1:12,500 which were available for some parts of the catchment.
The exercise started with design of a land use classification system. This was facilitated by
49

personal knowledge of the study area and a prior field visit to appreciate the existing land
use class types. The classification scheme was then used in interpretation of the satellite
imagery. Seven broad categories of land use were identified in the area as shown in table 3.1
below.
As a way of confirming the interpretation various sites representing all the identified land
use categories were visited in the field. A total of 100 sites were randomly picked from the
map by overlaying it with a grid and taking each grid square as a point. The chosen points
were then visited to compare the actual land use to the interpretation. This field survey also
helped in identifying areas where land use had changed since 1995 and therefore served as a
way o f updating the 1995 imagery to the current ground situation. In the field, the prevailing
land use conditions were observed and captured using photography. Reference was also
made to published maps, previous study reports and other secondary data types in the
preparation of the land use map.
Historical land use maps were prepared for the years 1973 and 1987. For 1973, a Landsat
Multi-Spectral Scanner (MSS) imagery was used. For 1987, a Landsat Thematic Mapper
(TM) imagery was used. The imageries were initially in the form of transparent positives.
These were scanned using a high-resolution drum scanner and then printed at a scale equal to
that o f the base map. Land use categories were then delineated by visual interpretation on the
imagery to give the respective year’s land use pattern map. Just as in the current land use
survey, reference was also made to published maps, previous study reports and other
secondary data types. Each of the imageries with delineated land use pattern was overlaid on
the transparent base map and using common features, as good an overlay as was possible
50
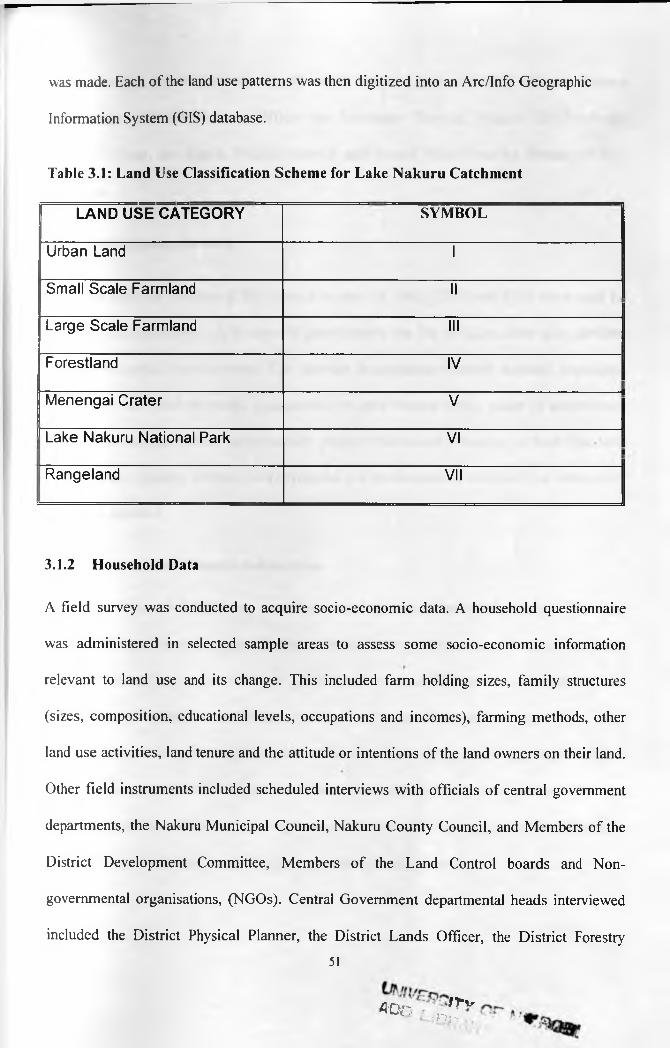
was made. Each of the land use patterns was then digitized into an Arc/Info Geographic
Information System (GIS) database.
Table 3.1: Land Use Classification Scheme for Lake Nakuru Catchment
LAND USE CATEGORY SYM BO L
Urban Land 1
Small Scale Farmland II
Large Scale Farmland III
Forestland IV
Menengai Crater V I
Lake Nakuru National Park VI
Rangeland VII
3.1.2 Household Data
A field survey was conducted to acquire socio-economic data. A household questionnaire
was administered in selected sample areas to assess some socio-economic information
relevant to land use and its change. This included farm holding sizes, family structures
(sizes, composition, educational levels, occupations and incomes), farming methods, other
land use activities, land tenure and the attitude or intentions of the land owners on their land.
Other field instruments included scheduled interviews with officials of central government
departments, the Nakuru Municipal Council, Nakuru County Council, and Members of the
District Development Committee, Members of the Land Control boards and Non
governmental organisations, (NGOs). Central Government departmental heads interviewed
included the District Physical Planner, the District Lands Officer, the District Forestry
51
AOc /7 -v• r ? ; ••
officer, and the District Agricultural officer. Discussions were also held with the Nakuru
Municipality Physical Planning Officer the Provincial Physical Planner, the Provincial
Forestry Officer, the Kenya Wildlife service and World Wide Fund for Nature (WWF)
personnel.
3.1.3 Socio-Economic Data
Central Bureau of Statistics (CBS) census reports for 1969, 1979 and 1989 were used for
demographic information. A household questionnaire for the sampled areas also provided
some demographic characteristics. The relevant demographic features included population
size, family sizes and structures, occupation types and income levels, places o f employment
and land ownership patterns and generally, people’s views and intentions on land. The farm
holding sizes, farming methods employed and the environmental awareness of landowners
were also assessed.
3.1.4 Physical and Climatic Information
Survey of Kenya 1:50,000 map series provided the topographic information. This also
provided the base map on which all other information was superimposed for spatial analysis.
The exploratory soil map of Kenya (Sombroek et. al, 1982) provided the general soil
information including characteristics, landforms, slope/gradient and geology of the area.
This was supported by the numerous past studies conducted in the area on geology and soils.
The study also borrowed from the numerous hydrological studies undertaken within the
study area and its surrounding. The Agricultural Handbook of Kenya (Jaetzold and Schmidt,
1983), provided information on climate and agro-ecological zones.
52
3.2 Sample Frame
Land use was mapped for the entire catchment for the three epochs (1973, 1987 and 1999).
To ascertain the accuracy of land use mapping, field checking was undertaken. One hundred
sample points were chosen randomly by placing a one centimetre grid on the area map and
numbering the various squares. Taking the centre of the square as the sample point, the
points were visited on the ground and the existing land use compared with the classification
on the map. This also helped to resolve doubtful and unclassified areas.
Household questionnaires were undertaken in selected sample areas. There are a total of
seventeen sub-locations that fall within the Lake Nakuru Catchment. Six of these were
chosen randomly as representatives and household questionnaires administered in each. The
sample sub-locations are shown in figure 3.1 below. In total forty-two questionnaires were
administered giving an average o f six questionnaires per sub-location. In choosing
respondent institutions and organisation the most relevant and all encompassing
organisations were chosen as the ones that would provide the maximum amount of data
3.3 Data Analysis and Presentation
This study relied on the use o f Remote Sensing techniques for the acquisition of land use
information. Field survey was used in the acquisition of socio-economic information. The Pc
Arc/Info software was used to integrate and analyze land use changes. While Remote
Sensing served as a data capture method, GIS provided the analysis tool. The two techniques
then offered a synergy that is quite useful in environmental assessment applications. Various
analyses were then undertaken to display the trends in land use over the study period. This
included calculation of absolute changes in the area under various land use categories,
representation of these as percentages and time series analysis. The results of the analysis are
represented as maps charts and tables.53

Figure 3.1: Sample Areas For Household Questionnaire
Bahati
'iwanda -c
Mbaruk
Nessuit
SururuNaishi
Kiambogo
Eburu
Source: Adopted From Survey of Kenya Administrative Areas Map
30 Kms
Sample Area
54

CHAPTER FOUR
THE STUDY AREA
4.0 Introduction
This chapter gives an analysis of the study area. It starts by looking at the physical
characteristics of Lake Nakuru catchment. The physical aspects covered include location and
size, topography, geology and soils, climate and agro-ecological zones, and drainage and
hydrology. The chapter also looks at biological characteristics of the catchment including
vegetation and wildlife characteristics. The chapter closes by looking at the evolution of
human settlements in the catchment where pre-colonial, colonial and post-colonial land uses
are reviewed.
4.1 Physical Characteristics
Lake Nakuru Catchment exhibits a unique mix of physical characteristics. It is the interplay
of these numerous physical environmental characteristics with biological and human
settlement componentsb that make the catchment an ecological unit of major concern.
4.1.1 Location and Size
Lake Nakuru Catchment is an expansive area covering approximately 1800 square
kilometres. It lies between longitudes 35° 54’ and 36° 11’ East and latitudes 0° 12’ and 0° 36’
South. It is bound by Menengai crater to the North, Bahati highlands to the North East, the
Mau- Escarpment to the to the West, Eburru crater to the South and a gentle ridge between
Lake Elementaita and Lake Nakuru to the East. Within the Catchment is Nakuru town, the
fourth largest town in Kenya, 180 Km to the North West of Nairobi, Lake Nakuru National
Park and Menengai crater. The Lake is situated sixty Kilometres to the South o f the Equator.
55
It lies two miles south of the centre o f Nakuru town with the Southern suburbs of the town
coming to the park’s boundary and to within one mile of the lake’s shores. Railway and road
links from Mombasa to Uganda, Southern Sudan, North Eastern Zaire and Rwanda pass
through Nakuru town. Figure 4.1 below shows the location of the catchment in the national
context, while Figure 4.2 shows its location within Nakuru District.
4.1.2 Topography
Menengai Crater at an altitude of 2240 meters forms the Northern rim of the catchment. To
the West and Southwest of the Lake, rolling hills run up to the Mau Escarpment reaching an
altitude of 30348 meters to give the highest point within the catchment. The Plains to the
East and South rise slowly to the ridge above Lake Nakuru which is the lowest point within
the catchment at an altitude of 1758 meters. The plains to the East and south rise slowly to
the ridge above Lake Elementaita and to the Eburru mountains, a spur of the Mau
Escarpment at an altitude of 2750 meters. Plate 4.1. below captures a panoramic view of the
Catchment, taken from the Southern end.
The terrain of the catchment could be classified as hilly, rolling, undulating, gently
undulating and flat terrain zones. The hilly zone with a slope of between 16 and 30 percent is
the steepest and includes the areas around Eburu Crater. This is followed by the Rolling
terrain zone having a slope of between 10 and 66 percent and mostly in the Ndundori forest,
Mau Ranges, Menengai forest and the Lion Hill, A large section of the catchment falls under
the undulating zone extending right from the Mau Ranges to Njoro. This zone has a slope of
between 5 and 10 percent and merges with the gently undulating terrain zone with a slope of
between 2 and 5 percent. The last zone is the flat land with a slope of less than 2 percent and
56
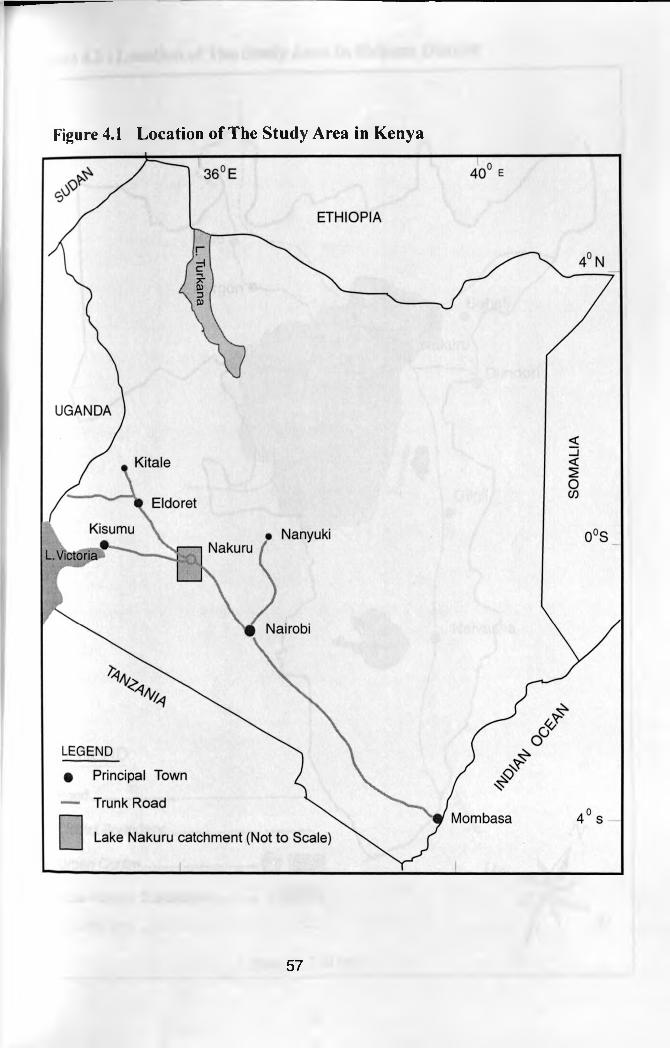
Figure 4.1 Location of The Study Area in Kenya
57

Figure 4 J : Location of The Study Area In Naknru District
lID
58

covering the Bahati plains and extending all the way to Kiwi plains to the South of the
catchment. Figure 4.3 shows North-South and East-West longitudinal sections of the
catchment while figure 4.4 shows the terrain zones.
Plate 4.1: A Panoramic View of Lake Nakuru Catchment
In the rear background are Menengai crater, Bahati Plains and Ndundori hills. In the Mid background is Lake
4.1.3 Drainage and Hydrology
Lake Nakuru Catchment is drained by six main rivers, Njoro, Makalia, Enderit, Naishi
Lamudiac and Ngosur. The first five o f these rivers originate from the Mau Escarpment.
River Ngosur originates from the Bahati highland to the North Eastern end of the Catchment.
Like both rivers Ngosur and Naishi, it disappears into the ground before draining into the
lake, probably emerging as springs near the shore. Figure 4.5 shows the river catchments.
59

Alti
tude
(m
) A
ltitu
de (
m)
(a) North-South Transect
(b) East-West Transect
Source: Survey of Kenya 1:50,000 Map Series
Distance (Km)

gure 4.4 Slope Zones In Lake Nakuru Catchment
30 K m s.
LEGEND
Hilly (16-30% )
Rolling (10-16%)
Undulating (5-10%)
Gently Undulating (2-5%)
Flat (< 2%)
61
The water level of the lake has been monitored since 1930, where marked fluctuations have
been observed. The current mean depth is 2.3 metres. From a level of 1.3 metres, in 1973, it
rose to 4.0 metres in 1980. Since 1930, the lake has dried out three times in 1945, 1961 and
1987. There are numerous boreholes in the area, extracting unmonitored volumes of water.
Underground water occurrence is variable and somewhat localised, although the pattern is
superimposed on a regional flow pattern controlled by the extreme topography of the Rift
Valley. There are two separate water-bearing formations. The shallow aquifers generally
represents perched water conditions whereas the deeper ones are typically confined aquifers.
Boreholes dug to this shallow aquifer are less productive with yields ranging from 0.5 to
0.833 nr per second. This occurs at depths of between 106 and 198 metres. Both aquifers
seem to be hydraulically connected and often act as a single water bearing formation. The
average borehole in the catchment is 130 metres deep.
Ground water recharge is achieved through deep percolation of precipitation and infiltration
of stream runoff through faults. Around the lake, surface streams become influent
disappearing along the fault lines as recharge to deep aquifers. There are about 80 registered
boreholes in the catchment. Most of the borehole owners do not maintain the required water
abstraction records making it difficult to estimate the amount of ground water abstraction.
4.1.4 Climate and Agro-Ecological Zones
Much o f Nakuru area is considered as marginal for arable agriculture. Mean annual
precipitation within the vicinity of the lake is 876 mm with the pattern being erratic and
unreliable. Rainfall figures however increase with intensity and reliability in the higher
altitude zones reaching a maximum o f 1300 mm around the Mau Escarpment and Bahati
62

F ig u re 4.5: R i v e r Catchments Within Lake Nakuru Basin
LEGEND
m
Enderit
Lake NakuruLamudiak
Makalia
Naishi
NgosurNjoro
7.5 15 30 Kms.
N
Source Kimani et al. (1992)
63

highlands. Figure 4.6 below shows the main rainfall zones within the catchment. The main
rainy season is from March to August with the peak at April and May. Shorter periods of
rainfall occur in October and November.
There are eleven agro-ecological zones as shown by Figure 4.7 below. Table 4.1 shows the
various agro-ecological zones together with their total areas. It is noted that the catchment
has a wide spectrum of ecological zones ranging from the high agricultural potential
highland zones to the semi-arid rangelands. The Lower Highland Zones 2 and 3 (LH2 and
LH3), are the dominant zones with 202 and 375 square kilometres respectively
4.1.5 Geology and Soils
In general, the geology of Lake Nakuru Catchment is made up of volcanic rocks of a
Tertiary-quartemary age, which have been affected by a series of faulting. The geology of
the area has been as a result of the activities associated with the formation of the Rift Valley,
namely volcanic eruptions and faulting. The structural geology is then dominated by
faulting, fissures and joints. The faults are well defined in such areas as cliffs and deforming
rocks such as the Lion Hill ridge, Ronda and Western Cliff.
The Fissures also show this general trend and this controls the direction of flow of
underground water. Although the faults are not visible in some parts of the catchment,
geophysical surveys have revealed their existence especially in the Western side of the
Catchment. Land subsidence is then a common phenomenon in the affected areas especially
in Ronda and Baruti areas. The subsidence has been shown to occur along the fissures and
faults and actually have a North-South trend (Murei, 1995).
64

Figure 4.6: Rainfall Zones in Lake Nakuru Catchment
65

Figure 4.7: Agro-Ecological Zones Within Lake Nakuru Catchment
Source: Jaetzold and Schiniidt (1983)
66

Table 4.1: Agro-ecological Zones of the Lake Nakuru Catchment
ZONE TOTAL AREA (KM2)
Lower Highland zone 2 (LH2) 202
Lower Highland Zone 3 (LH3) 375
Lower highland zone 4 (LH4) 137
Lower Highland Zone 5 (LH5) 112
Lower Highland Zone 6 (LH6) 17
Upper Highland Zone 0 (UHO) 79
Upper Highland Zone 1 (UH1) 136
Upper highland Zone 2 UH2) 323
Tropical Alpine Zone 1 (TA1) 6
Menengai Crater 82
Lake Nakuru 33
TOTAL 1837
The soil types in the catchment owe their origin to the existing rock units and recent volcanic
eruptions. They are highly porous and with unconsolidated texture which is susceptible to
erosion. In some areas, the soil cover portrays a thick strata and then thins out to bare rock in
some areas. Due to its porosity, permeability and loose structure, the soil is highly
susceptible to erosion. This also causes land subsidence and fractures during or after heavy
rains. The nature of the soil, especially its high susceptibility to erosion contributes a great
deal to siltation o f the lake, whose bed is currently covered by thick sediments. Figure 4.8
shows the classification of soil according to texture and susceptibility to water erosion.
67

4.2 Biological Characteristics of Lake Nakuru Catchment
Lake Nakuru catchment has some unique mix of biological characteristics that makes it a
conservation unit of international significance. The catchment is endowed with both natural
animal and plant resources. However there has been human interference with this natural
environment making the current biological environment more complex than the original one.
4.2.1 Vegetation
Prior to European settlement, the natural vegetation of the highland zone o f Lake Nakuru
Basin was Montane forest dominated by three main species; Juniper (Juniperus procera),
Podo (Podocarpus latifolius) and African Olive (Olea africcma). European settlement
however opened up these hitherto virgin forests for timber exploitation and by 1990, the
Montane forests only remained in the uppermost reaches of the catchment where they are
still protected to a certain limit within the forest reserves.
At the lower altitudes, the Montane forest merged into a woodland dominated by Olive and
acacia species, interspersed with patches of open grassland. Outside the National Park, this
woodland has been entirely replaced by farmland. Surrounding the shore o f the lake, the
woodland is dominated by fever trees (.Acacia xanthophloea). The hills running down the
Eastern side of the lake are covered by a forest of Euphobia.
The Parts to the East and South of the Park are still covered by grassland and scattered trees.
The area to the North of the lake was formerly a grassy plain. Most of this area is now
covered by Nakuru town although part of it is conserved in the Northern sector of the park.
Open grassland occurs in the southern sector of the park (Rono, 1996).
68
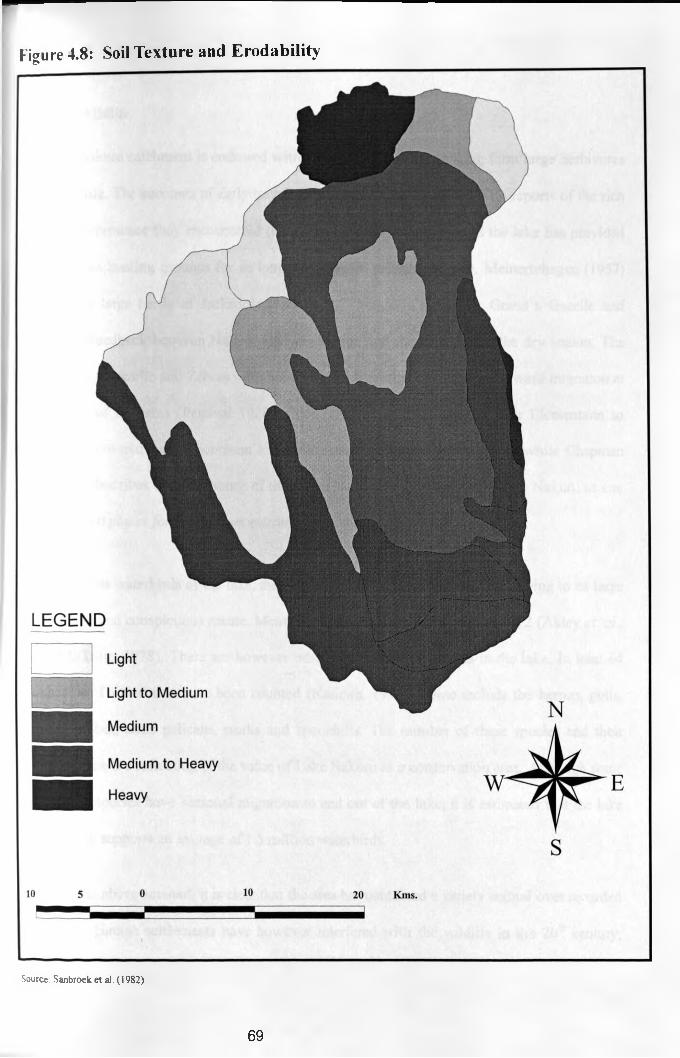
Figure 4.8: Soil Texture and Erodability
Source: Sanbroek et al. (1982)
69

4.2.2 Wildlife
Lake Nakuru catchment is endowed with a wealth of wildlife ranging form large herbivores
to birdlife. The accounts of early travellers through the area is filled with reports of the rich
wildlife presence they encountered (Mwangi, 1993). The area around the lake has provided
important hunting grounds for as long as available records indicate. Meinertzhagen (1957)
reported large herds of Jackson's Hartebeest, Thompson’s gazelle, Grand’s Gazelle and
Bohor Reedbuck between Nakuru Railway station and the lake during the dry season. The
Thompson gazelle and Zebras were becoming most numerous during southward migration at
the end of the rains (Percival 1928). Eliot (1)904, found the country near Elementaita so
literally covered with Thompson’s Gazelle that it appeared sandy yellow while Chapman
(1908), describes the confluence of the rivers Nderit and Makalia with Lake Nakuru as one
o f the best places fo r seeing concentration o f game.
Among the waterbirds of the lake, the Lesser flamingo is the most known owing to its large
numbers and conspicuous nature. Mention of the flamingo dates back to 1912 (Akley et. al.,
1912, Tuite, 1978). There are however other numerous bird species in the lake. In total 64
species o f waterbirds have been counted (Nasirwa, 1995). These include the herons, gulls,
Ibis, grebes, terns pelicans, storks and spoonbills. The number of these species and their
abundance is a reflection of the value o f Lake Nakuru as a conservation area. Although some
of these species have seasonal migration to and out of the lake, it is estimated that the lake
regularly supports an average of 1.5 million waterbirds.
From the above account, it is clear that the area has contained a variety animal over recorded
history. Human settlements have however interfered with the wildlife in the 20th century,
70

greatly altering the wildlife situation. From 1992, very low water levels have been recorded
in the lake and this has had negative impacts on the birdlife. Migration patterns to other
wetlands have been seen to deviate from those previously recorded. This has raised major
concerns among conservationists about the sustainability o f the ecosystem and especially the
effect of the lake’s pollution to the birdlife.
Among the large herbivores, the African elephant is reported among the species that
frequented the area but is altogether absent today. The black rhinoceros had become
exceedingly rare, with its population only starting to rise because of translation from other
areas. Although much of the wildlife is naturally resident in the park, there has of late been
introduced some exotic animal species. Among them are the Rothschild giraffe and the
White rhino. The introduction of these rare and endangered species has then necessitated the
fencing of the park with a perimeter electric fence. Although this fences has dramatically
reduced human-wildlife conflicts in the areas adjacent to the park, it has also isolated the
animals and this will definitely affect their breeding and evolution.
4.3 Evolution of Human Settlements in Lake Nakuru Catchment
Human occupation in the Lake Nakuru catchment goes a long way into the past.
Archaeological exploitations have shown evidence of occupation dating back 10,000 to
30,000 years ago by a hunter-gatherer community called the Eburran. At about 1000 years
ago, a Kalenjin group settled in the area, some of who practised agriculture. More recently,
the Maasai lived in the area, grazing their herds over the open bush land and grassland
between the forested areas. Their occupation of the area continued until early 20th century
when it was interrupted by the European settlement (Ramesh, 1995).
A O o*L f-? I
^ Y r f ? O S i
71

4.3.1 Land Use in the Colonial Period
The first European to reach Lake Nakuru was Joseph Thompson in 1883. Subsequently,
more explorers stopped in the Lake at Baharini springs to replenish their water supply. The
arrival of the Kenya-Ugandan railway in 1889 opened the catchment to European settlement.
Nakuru was established as a junction on the railway line and it quickly grew into a small
town. Increased access led to rapid settlement by European farmers who set up ranches and
large mixed farms around the Lake, Njoro, Rongai, Eburru, Dundori and Bahati highlands.
Nakuru then became the District capital and the agricultural capital of the White Highlands
(Raini, 1987).
During the colonial period, forest reserves were established in the area covering the
highlands, Mau- Escarpment, Bahati and Menengai. The Lake Nakuru forest on the South-
Western boundary of the present day Lake Nakuru National Park was also gazetted. The
colonial period land use was then one dominated by large scale mixed farms, ranches and
forested areas. At the same time, the urbanisation process began in the catchment with the
growing importance of Nakuru town as an agricultural town
Table 4.2: Settler Farms in Njoro Division (1960/61)
FARM SIZE (ACRES) NUMBER OF FARMS PERCENTAGE
| <200 12 17.9|201-500 13 19.4I 501-800 8 11.9
801-1100 15 22.41101-1400 4 6.0
1401-2100 5 7.5|| Over 2100 10 14.9| Total 67 100Source: Mac Arthur?/. Al. (1961)
72
i
4.3.2 Land Use in the Post Colonial period
The question of African land rights was one of the main reasons for discontent and the social
and political unrest among Africans in the colonial time resulted from land ownership
problems. Reclamation of alienated land, the most prominent of which were the scheduled
areas or while highlands, was therefore a key issue and one of the most important claims of
the African political activity. The realisation of this claim came with independence in 1963,
when the government initiated a series o f settlement Scheme programmes.
The first and most widely known of these programmes was the “One Million Acre Scheme”,
in the course of which about one million acres of land from the White Highlands was to be
bought and subdivided into small scale farms for the Africans. Nationally, the total area
purchased accounted for approximately 20 percent of the former scheduled areas. The
programme which had actually started shortly before independence in 1961 came to a close
by the end of the 1970s (Ogendo, 1981). This programme brought to the catchment the first
wave of small-scale farmers, starting with Bahati in 1967 and the highlands in 1968.
As the Settlement schemes were being established, it became evident that the government
programmes alone would not be large enough to accommodate all those in need of land.
Although the One Million Acre Scheme settled about 35,000 families, it still needed to be
stepped up by other programmes. By the mid-1960s, it was already accepted that the
government programmes were too expensive as a solution to the problem of landlessness and
land hunger. There was also a growing reluctance by the main creditors of the programmes
to support further programmes financially (Leys, 1975, Kohler, 1987).
73
The political leadership then responded by calling on people to resort to the self-help. The
concept of self-help or Harambee as it came to be known, embraced such ideas as mutual
assistance, responsibility and community self-reliance (Mbithi and Rasmussen, 1977). As far
as land purchasing was concerned, self-help worked through groups, which were formed by
those in need of land in order to pool enough money to buy it. Land buying companies and
co-operatives were formed to buy the large Settler farms and then subdividing among
individual members. Nationally, it was estimated that by 1970, land buying companies and
co-operatives had acquired about 20 percent of the former White Highlands or as much as
the government settlement programmes had managed. There were also numerous squatter
settlements encroaching into forest reserves. The settlement thrust continued for about two
decades until early 1980s when land scarcity and lack o f government funds for settlement
halted it. The 1983 KANlT manifesto stated that in respect of land purchase, the re
settlement programme in the former White highlands was virtually completed (Leys, 1975).
While agricultural settlement was occurring, urban expansion was also taking place. Nakuru
was declared a township in 1904 with an area of 26 Km2 and elevated to Municipality status
in 1929. In 1934, the municipal boundary was extended to 32 Km . Further extension
occurred in 1969 to 76 Km2 and in 1986 to 95 Km2. Currently it covers some 290 Km2,
which includes the Lake Nakuru National Park. The urban population of Nakuru Township
in 1926 was 896 people. In 1948 when the first national census was conducted, the
population of the Municipality was 17,000 people. By 1962, the population had reached
38,200. This further increased to 47,151 people in 1969, 92, 851 in 1979 and 163,900 people
in 1989. Currently it is estimated to be about 360,000 people (MCN, 1999). Figure 4.9
reveals that the population growth rate has continued to rise with time. This has been as a
Kenya African National Union (KANU), has been the ruling party in Kenya since independence
74
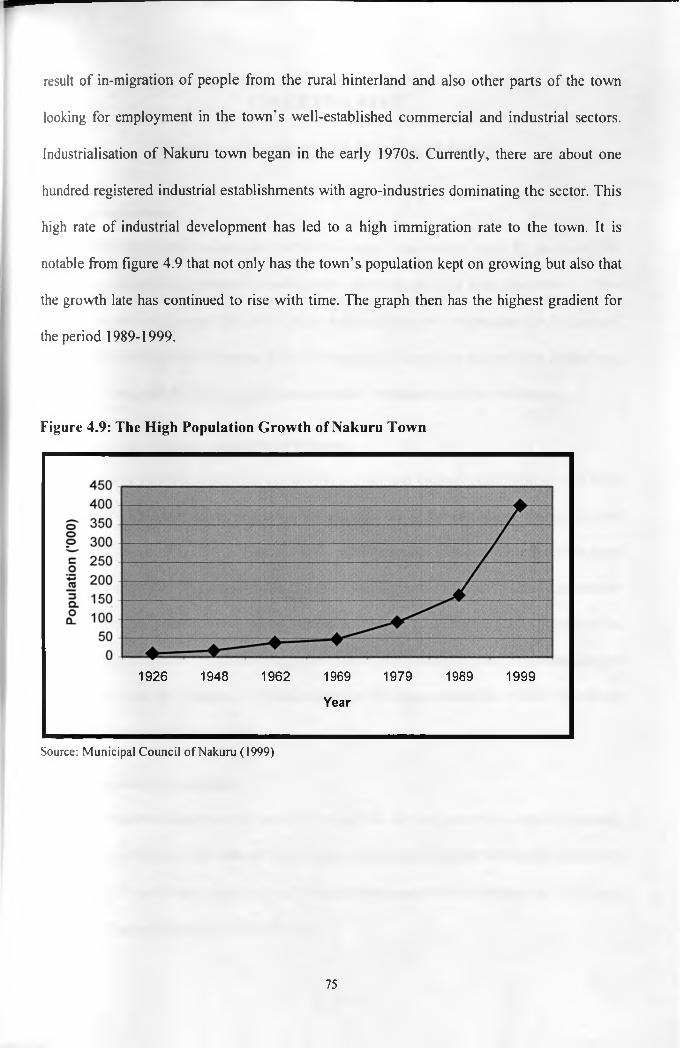
result of in-migration of people from the rural hinterland and also other parts of the town
looking for employment in the town's well-established commercial and industrial sectors.
Industrialisation of Nakuru town began in the early 1970s. Currently, there are about one
hundred registered industrial establishments with agro-industries dominating the sector. This
high rate of industrial development has led to a high immigration rate to the town. It is
notable from figure 4.9 that not only has the town’s population kept on growing but also that
the growth late has continued to rise with time. The graph then has the highest gradient for
the period 1989-1999.
Figure 4.9: The High Population Growth of Nakuru Town
1926 1948 1962 1969 1979 1989 1999
Year
Source: Municipal Council of Nakuru (1999)
75

CHAPTER FIVE
ANALYSIS OF LAND USE CHANGE
5.0 Introduction
This chapter represents the analysis part of the study. The chapter starts by analysing the
changes in land use as revealed by both Remote Sensing data and field observation. These
changes are then compared and related to the other information regarding the biophysical
environment and the socio-econmic data. The chapter then analyses the existing institutional
and legal framework for land use and environmental management in the catchment.
5.1 General Changes in Land Use Patterns
The impacts of settlement policies, population growth and cultural perception of land have
come to have their full effects on land cover and land use in the catchment towards the end
of the 20th Century. Plate 5.1, 5.2 and 5.3 show satellite scenes of the catchment for the years
1973, 1987 and 1999. These have been classified and interpreted to derive Land use patterns
for the respective years represented by Figures 5.1, 5.2 and 5.3. Figure 5.2(a)-(c) shows the
proportions of the various land use categories in the various analysis years The revelations of
these patterns and the biophysical characteristics of the area revealed in chapter four forms
the main analysis part of this study.
5.1.1 Trends in Forest Land
Before European occupation, the land use picture in the catchment was one of virtually
untouched wilderness of forests and grasslands. Although European settlement resulted in
the clearing of significant proportions o f natural forests, the settlers also gazetted significant
portions of the catchment as forest reserves.
76

Platr 5.1: 1973 U n d sa l MSS Inmgtry
Lfr'fUr-,
AOc/,l .• *i • .'i/^ c
77

Plate 5.2: 1987 Landsai TM Scene
78
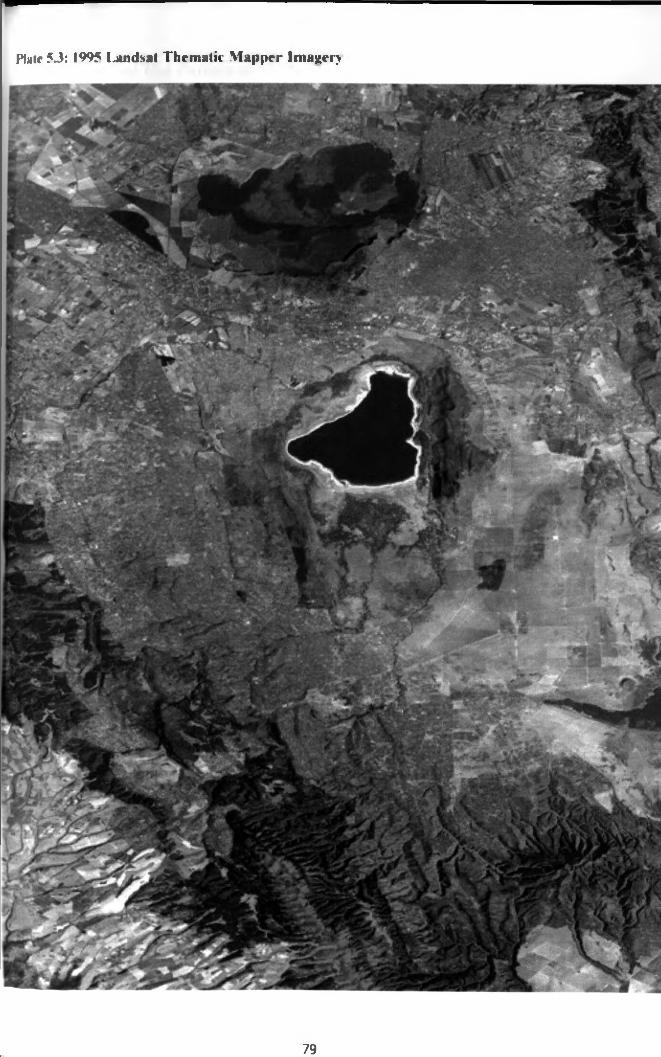
Plate 5J: 1995 Landsat Thematic M apper Imagery
79

Figure 5.1: Land Use Pattern in 1973
L E G E N D
■—
□
Crater
Forestland Large-Scale Farms
National Park Rangeland Small-scale Farms
Urban Land
15 7.5 0 15 30 Kms.
80

■
Figure 5.2: Land Use Pattern Land Use in 1987
L E G E N D
i i l l l j Forestland H I Large-scale farmland
Menengai Crater National park
i RangelandSmall-scale Farmland Urban Land
15 7.5 0 15 30 Kms.
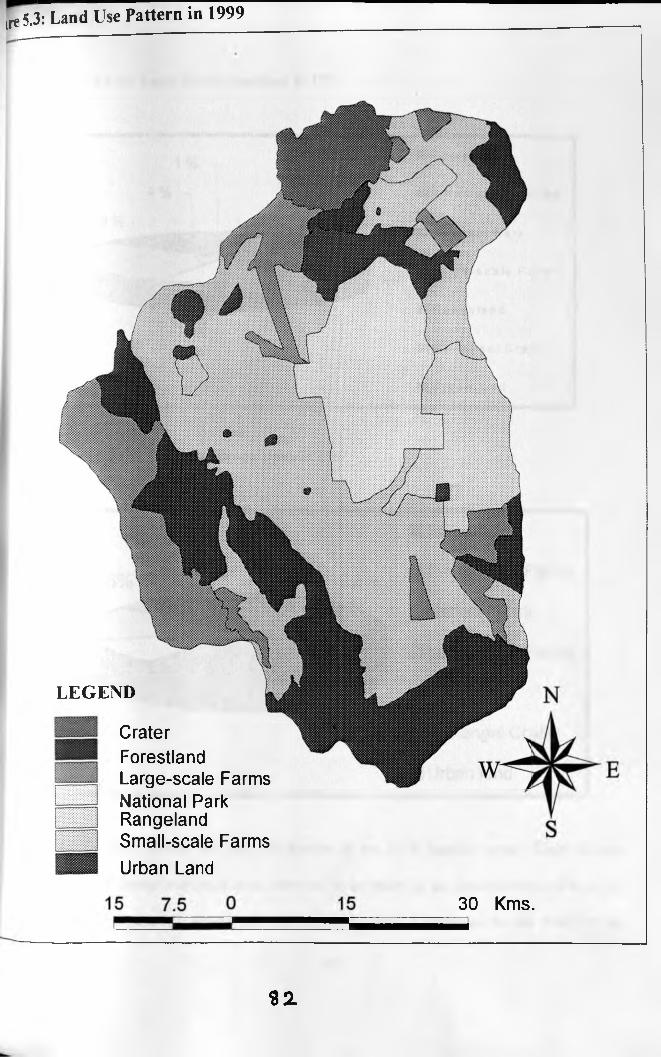
ire 5.3 : Land Use Pattern in 1999
30 Kms.
Urban Land
LEGEND
Crater Forestland Large-scale FarmsNational Park Rangeland Small-scale Farms
92L

Figure 5.4 (a): Land Use Proportions in 1973
Figure 5.4 (b): Land Use Proportions in 1987
Some o f these forests are quite observable in the 1973 Satellite scene. These include
indigenous forests and woodlands observed to be intact in the South-western side of the
catchment. Plantation forests also existed in the Mau Escarpment to the south of the
83
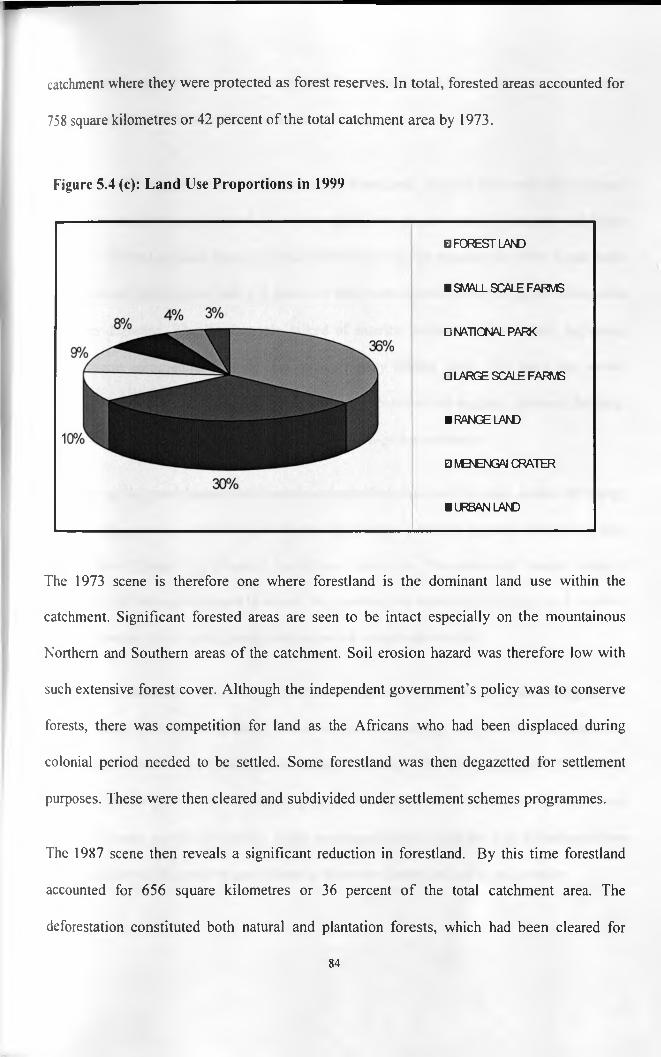
catchment where they were protected as forest reserves. In total, forested areas accounted for
758 square kilometres or 42 percent of the total catchment area by 1973.
Figure 5.4 (c): Land Use Proportions in 1999
□ FORESTLAND
■ SMALL SCALE FARMS
□ NATIONAL PARK
□ LARGE SCAUE FARMS
■ RANGELAND
□ IVENENGAI CRATER
■ URBAN LAND
The 1973 scene is therefore one where forestland is the dominant land use within the
catchment. Significant forested areas are seen to be intact especially on the mountainous
Northern and Southern areas of the catchment. Soil erosion hazard was therefore low with
such extensive forest cover. Although the independent government’s policy was to conserve
forests, there was competition for land as the Africans who had been displaced during
colonial period needed to be settled. Some forestland was then degazetted for settlement
purposes. These were then cleared and subdivided under settlement schemes programmes.
The 1987 scene then reveals a significant reduction in forestland. By this time forestland
accounted for 656 square kilometres or 36 percent o f the total catchment area. The
deforestation constituted both natural and plantation forests, which had been cleared for
84
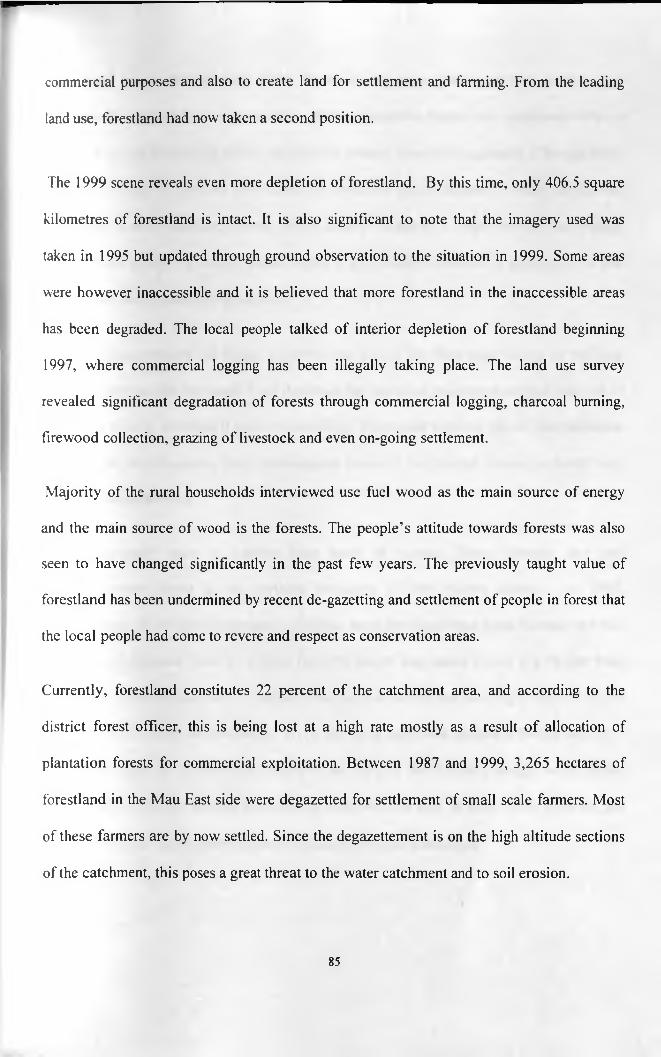
commercial purposes and also to create land for settlement and farming. From the leading
land use, forestland had now taken a second position.
The 1999 scene reveals even more depletion of forestland. By this time, only 406.5 square
kilometres of forestland is intact. It is also significant to note that the imagery used was
taken in 1995 but updated through ground observation to the situation in 1999. Some areas
were however inaccessible and it is believed that more forestland in the inaccessible areas
has been degraded. The local people talked of interior depletion o f forestland beginning
1997, where commercial logging has been illegally taking place. The land use survey
revealed significant degradation of forests through commercial logging, charcoal burning,
firewood collection, grazing of livestock and even on-going settlement.
Majority of the rural households interviewed use fuel wood as the main source of energy
and the main source of wood is the forests. The people’s attitude towards forests was also
seen to have changed significantly in the past few years. The previously taught value of
forestland has been undermined by recent de-gazetting and settlement of people in forest that
the local people had come to revere and respect as conservation areas.
Currently, forestland constitutes 22 percent of the catchment area, and according to the
district forest officer, this is being lost at a high rate mostly as a result o f allocation of
plantation forests for commercial exploitation. Between 1987 and 1999, 3,265 hectares of
forestland in the Mau East side were degazetted for settlement of small scale farmers. Most
of these farmers are by now settled. Since the degazettement is on the high altitude sections
of the catchment, this poses a great threat to the water catchment and to soil erosion.
85

The natural forests are especially under threat of extinction. Indigenous tree species grow
quite slowly compared to exotic species. While plantation forests can regenerate within a
matter of several decades, it takes centuries for natural forests to regenerate. The capability
of natural forests to conserve environmental resources and biological diversity is however
higher than that of plantation forests, which usually consist of a single tree species. Foliage
cover is also thicker in natural forest which is particularly effective in prevention of soil
erosion and water catchment protection.
Natural forest products are highly preferred and valued for their high quality in building,
curving, charcoal and firewood. Their depletion has therefore been more marked than that of
plantation forests. Although it was not possible to distinguish between natural and plantation
forests from the imageries, field investigation revealed that natural forests currently only
exist only around Eburu.
Forests currently exist in Eastern Mau areas of Sururu, Teret, Nessuit, and and
Bahati/Ndunduri forest to the northern boundary of the Nakuru district. In 1995,
approximately 69 million cubic metres o f timber were harvested from these forests. In 1996,
Nakuru district earned Kshs. 21 million from the sale of logs and a further 4.4 Million from
the sale o f miscellaneous forest products such as fuel wood and seedlings, most of which
was from forest within the catchment. Wood fuel is an important product of forests as over
90% of the rural households were found to be using it for domestic energy needs. Other
forest products include fencing and building poles and saw dust. In many areas however, not
much use is made of the saw dust and it is actually seen as a nuisance.
86

Figure 5.5: The Downward Trend in Forestland
The rate o f forestland depletion is seen to be higher for the 1987-99 period as compared to the 1973-87 period
Figure 5.6: The Dominance of Fuehvood in Rural Household Energy sources
5% 1 °/c3%
91%
□ Fuel W ood
■ pe tro leum P ro d uc ts
□ E lec tric ity
□ O the rs
5.1.1.2 Environmental Implications of Trends in Forest Land
It evident that areas with high erosion hazard has been cleared of forest cover. This poses
high risk of increased soil erosion in such area. The deforestation is mostly on the higher
87

parts of the catchment where most o f the rivers originate. The most obvious effect of
deforestation is then increased soil erosion, which in turn leads to high sediment levels in
river waters. This leads to high loss of the fertile topsoil and reduced productivity of
farmlands. There has also been increased lake water evaporation due to unchecked wind.
Plate 5.4: Recent Encroachment to and Degradation of Forestland
5.1.2 Ecological Setting and Dynamics of Rangelands
Rangelands are located in the agro-ecological Zones LH5 and UM5 towards the southeastern
side of the Catchment. Ecological zone LH5 or Lower Highland Ranching Zone covers an
area o f 112 square kilometers within the catchment. This zone is not suited for rainfed
agriculture. The land carrying capacity is about 3 and 2 hectares per livestock unit on natural88

and artificial pasture respectively and about 1.2 hectares per livestock unit with
supplementary irrigation. Agro-ecological zone UM5 or Upper Midlands Ranching Zone
covers an area of 163 square kilometers. Rainfed agriculture is uneconomical in this zone,
Plate 5.5: Saw Milling;
Illegal and unchecked commercial logging has caused much deforestation in the Southern
Part of the Catchment.
but has good potential for vegetable farming under irrigation. The land carrying capacity is
about 3.5 hectares per livestock unit on natural pasture. Ranching as a land use currently
covers an area of 118 square kilometers as compared to 168 square kilometers in 1973 and
138 square kilometers in 1987. These acreages constitute 6, 9 and 8 percent o f the catchment
area respectively. These areas constitute cattle ranches owned entirely by Delamere Estate.
89

5.1.2.1 Implications of Trends in Rangelands to the Environment
From a conservation point of view, the rangelands with their low carrying capacity are best
left to their current use and management. Currently, the ranches are fenced and rotational
grazing is practiced. The cattle density is also deliberately kept low to avoid overstocking.
Erosion hazard in the rangelands is therefore currently low although soil wash is common
along the numerous tracks that criss-cross the ranches. There is little effort to introduce tree
planting in the ranches. Virtually no forested area can be found within this zone.
Plate 5.6: Rangeland in Lake Nakuru Catchment
The ranches are a major user of acaricides for control of tick borne diseases. Although there
are no rivers flowing from this zone to the lake it is possible that acaricide contamination of
90
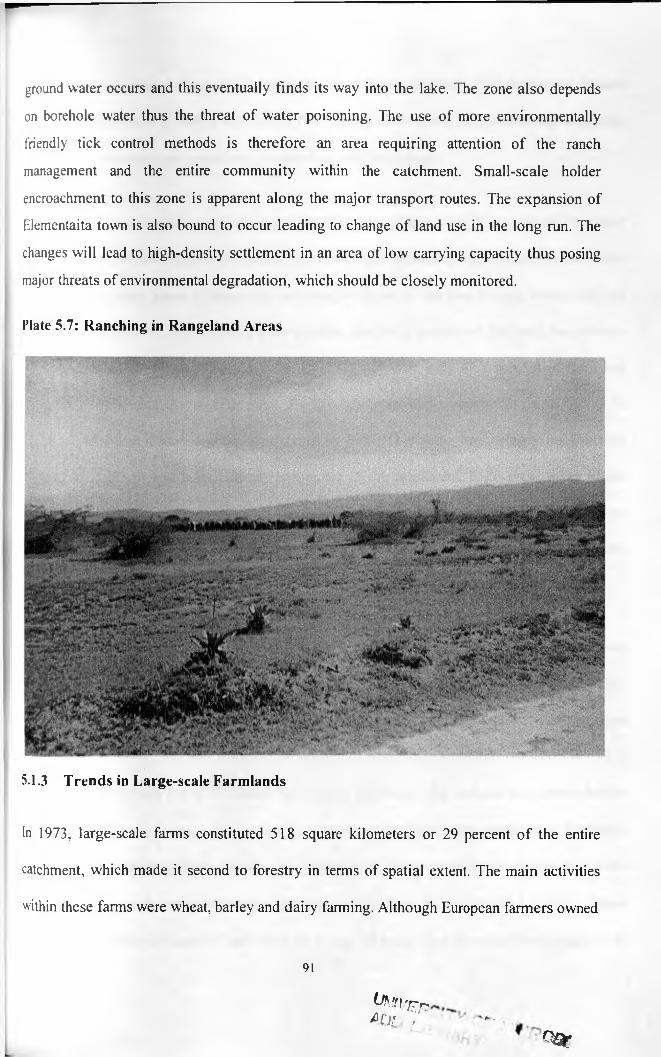
ground water occurs and this eventually finds its way into the lake. The zone also depends
on borehole water thus the threat of water poisoning. The use of more environmentally
friendly tick control methods is therefore an area requiring attention o f the ranch
management and the entire community within the catchment. Small-scale holder
encroachment to this zone is apparent along the major transport routes. The expansion of
Elementaita town is also bound to occur leading to change of land use in the long run. The
changes will lead to high-density settlement in an area of low carrying capacity thus posing
major threats of environmental degradation, which should be closely monitored.
Plate 5.7: Ranching in Rangeland Areas
5.1.3 Trends in Large-scale Farmlands
In 1973, large-scale farms constituted 518 square kilometers or 29 percent o f the entire
catchment, which made it second to forestry in terms of spatial extent. The main activities
within these farms were wheat, barley and dairy farming. Although European farmers owned
Q S t
91
lAni'rrr4 0 / V -

most of these farms, the pace of acquisition by Africans was high. The settlement scheme
programmes were started in the area in 1967. Large-scale farms were also being bought by
co-operative societies, companies, partnerships and individuals.
By 1987, the proportion of large-scale farmland had reduced to 19 percent of the entire
catchment, or 349 square kilometers. The settlement scheme program had by then been
completed while most of those who had bought shares in the land buying companies had
settled in the area. Field investigation revealed that 54.2 percent of the rural land owners
acquired land between 1974 and 1979. By 1979 however, only 47.2 percent of them had
settled in the area. By a presidential directive company and co-operative farms had to be
subdivided and members given their shares by 1987. This policy was quickly implemented
and by 1987, it had been virtually completed in the catchment. Even then, many of the
shareholders in company and co-operative lands had many shares and even after subdivision,
still remained with substantially big portions of land. Although smaller than the settler farms,
these farms were still large by modern day sizes in the area.
It is apparent that subdivision of large-scale farms has continued beyond the settlement
schemes and company and co-operative farms. While 7.6 percent o f the rural landowners
acquired land between 1989 and 1999, 19.5 percent settled in the catchment within the same
period. Between 1987 and 1999, the proportion of large-scale farmlands reduced from 19 to
14 percent or from 349 to 263 square kilometers. The hunger for land and the general decline
in productivity o f large-scale farming are the reason leading to the subdivision. Currently,
people own large-scale farmlands have other sources of income and who do not stay in the
area. To these absentee landowners, farming is perceived as a commercial activity. Others
are speculators holding the land either as a way of preserving or saving their wealth or to92
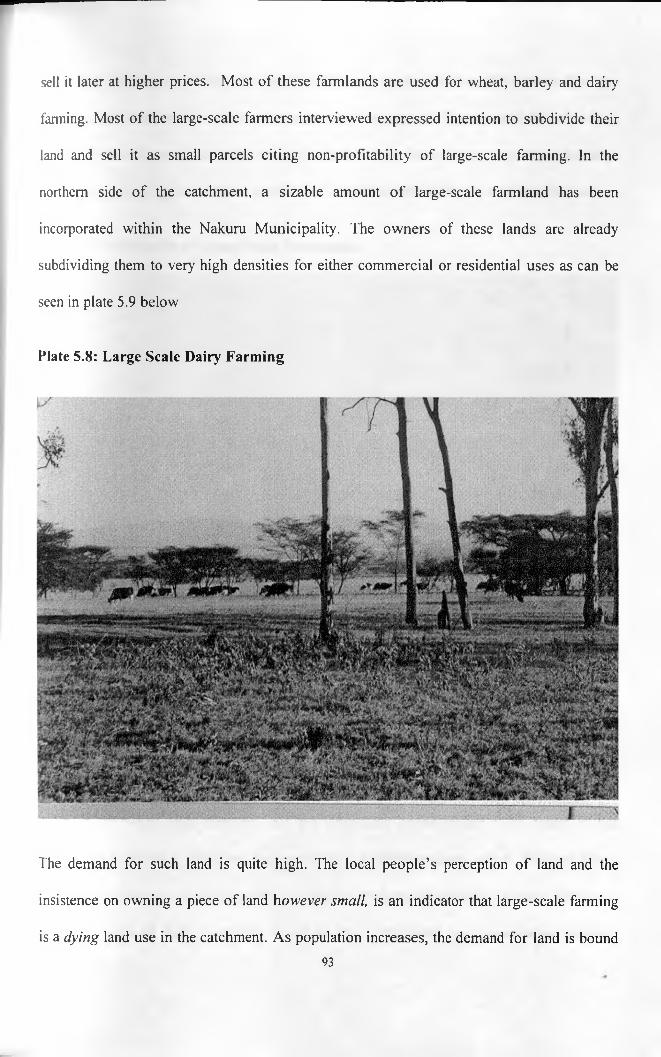
sell it later at higher prices. Most of these farmlands are used for wheat, barley and dairy
farming. Most of the large-scale farmers interviewed expressed intention to subdivide their
land and sell it as small parcels citing non-profitability of large-scale farming. In the
northern side of the catchment, a sizable amount o f large-scale farmland has been
incorporated within the Nakuru Municipality. The owners of these lands are already
subdividing them to very high densities for either commercial or residential uses as can be
seen in plate 5.9 below
Plate 5.8: Large Scale Dairy Farming
The demand for such land is quite high. The local people’s perception o f land and the
insistence on owning a piece of land however small, is an indicator that large-scale farming
is a dying land use in the catchment. As population increases, the demand for land is bound
93

to rise and with low incomes, the people will demand smaller and smaller parcels. The fate
of large-scale farms in the catchment has already been sealed. The demand for urban land
and small-scale farms for subsistence, residential or even speculative purposes is bound to
have virtually all large scale farms subdivided within the area in the not so distant future.
Plate 5.9: Subdivision of Large Scale Farmlands
5.1.3.1 Conservation Implications of Trends in Large-scale Farms
The farming practices of large-scale farmers in the catchment are markedly different from
those of the small-scale farmlers. All the large-scale farms visited were found to use
herbicides, fungicides, fertilizers and pesticides on different crops and at different times.
Large-scale farms are therefore major contributors to chemical pollution of water resources.
However, most o f them were also found to have established soil conservation methods
94
ranging from planting of trees along farm boundaries and planting of woodlots and
plantations. Contour bands, contour grass strips and contour ploughing are also common in
the large-scale farmlands. Agro-forestry is however not common among the large scale
farmers.
All the large-scale farms are common users o f farm mechanization like tractors for
ploughing and heavy vehicles for transportation. The long-term damage to the structure of
the soil and increase in soil erosion due to such practices are high. Large-scale farmlands
also contribute to reduction in biological diversity. All these farms were found to be
practicing monocropping which when combined with wide use of pesticides and herbicides
which kill living organisms indiscriminately, leads to depletion of plant and animal species.
Pollution to both underground and surface water and ultimately the lake due to use of agro
chemicals is also eminent. Due to mono-cropping, there are periods when the soil is left bare
causing higher soil erosion hazard and river and lake siltation.
Large-scale farming has been found to act as a buffer between forest and other conservation
areas and densely used lands such as urban centers or small-scale farms. Because of the
nature o f practice, large-scale farming is compatible to forestry. The low-density operation
implies less demand for forestry products. Consequently, areas with higher proportions of
large-scale farms were found to have experienced less deforestation. In the southwestern side
of the catchment, it was found that forest edges neighbouring large-scale farms were less
encroached than those neighbouring small-scale farmlands. Plates 5.10 and 5.11 show the
buffer effect of large-scale farms to forests. The demise of large-scale farmlands should
95
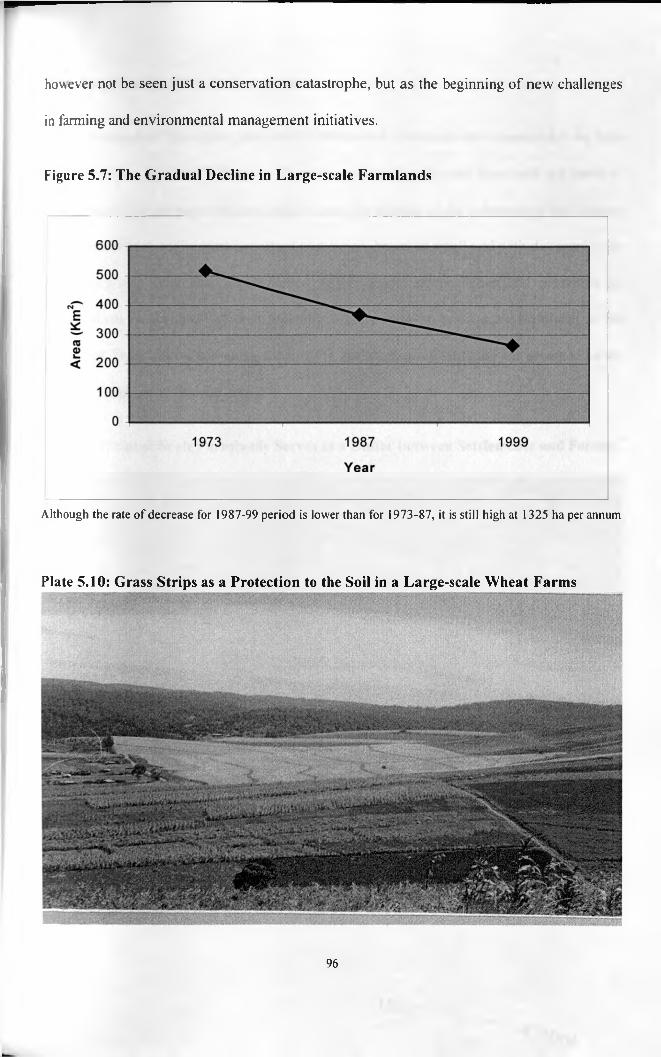
however not be seen just a conservation catastrophe, but as the beginning of new challenges
in fanning and environmental management initiatives.
Figure 5.7: The Gradual Decline in Large-scale Farmlands
Although the rate of decrease for 1987-99 period is lower than for 1973-87, it is still high at 1325 ha per annum
Plate 5.10: Grass Strips as a Protection to the Soil in a Large-scale Wheat Farms
96

5.1.4. Trends in Small-Scale Farmlands
For the purposes of this study, small-scale farmlands in this study are considered to be farm
holdings of size less than 8 Hectares. The emergence of small-scale farmlands is a result of
independent Government settlement policies and the attitude of the independent day Kenyan
where land is seen as the most important possession, however small and with disregard to its
economic productivity. Small-scale farming is then a post-independence land use within the
Lake Nakuru catchment. Before Independence there were no small-scale farmlands in the
catchment. From almost non-existence in 1973, the small-scale farmland has grown to be the
dominant land use within the area.
Plate 5.11: Large Scale Farmlands Serves as a Buffer between Settlements and Forests
The Left Hand Side of the forest neighboring a large scale wheat farm is seen to be less degraded than the Right hand side neighboring small scale farms
97
UfJn'fr,AOL
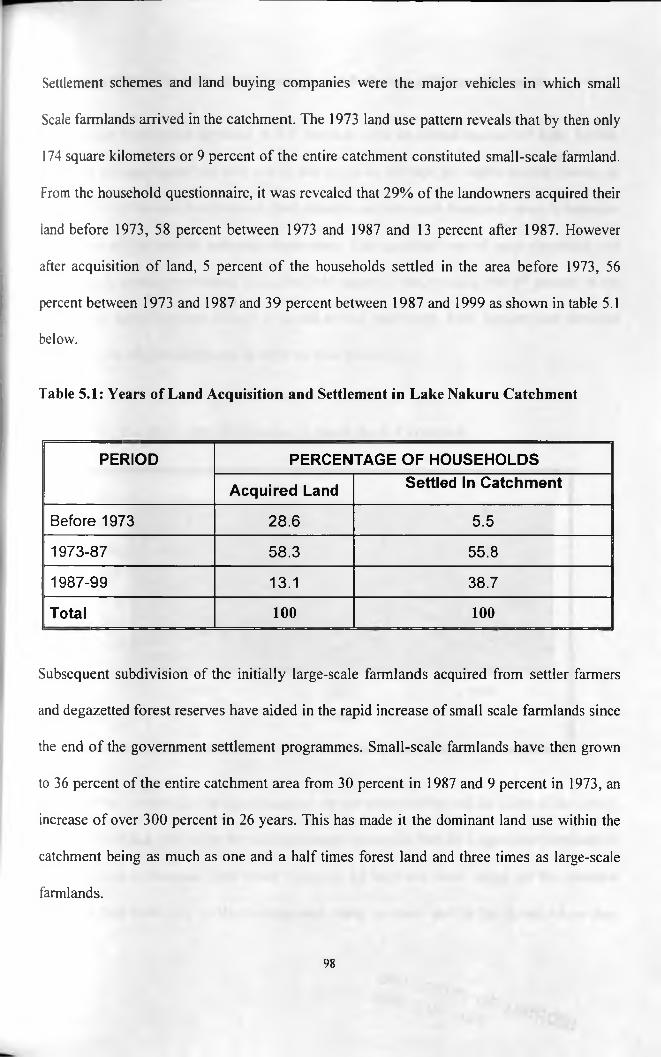
Settlement schemes and land buying companies were the major vehicles in which small
Scale farmlands arrived in the catchment. The 1973 land use pattern reveals that by then only
174 square kilometers or 9 percent of the entire catchment constituted small-scale farmland.
From the household questionnaire, it was revealed that 29% of the landowners acquired their
land before 1973, 58 percent between 1973 and 1987 and 13 percent after 1987. However
after acquisition of land, 5 percent o f the households settled in the area before 1973, 56
percent between 1973 and 1987 and 39 percent between 1987 and 1999 as shown in table 5.1
below.
Table 5.1: Years of Land Acquisition and Settlement in Lake Nakuru Catchment
PERIOD PERCENTAGE OF HOUSEHOLDS
Acquired Land Settled In Catchm ent
Before 1973 28.6 5.5
1973-87 58.3 55.8
1987-99 13.1 38.7
Total 100 100
Subsequent subdivision of the initially large-scale farmlands acquired from settler farmers
and degazetted forest reserves have aided in the rapid increase of small scale farmlands since
the end of the government settlement programmes. Small-scale farmlands have then grown
to 36 percent of the entire catchment area from 30 percent in 1987 and 9 percent in 1973, an
increase o f over 300 percent in 26 years. This has made it the dominant land use within the
catchment being as much as one and a half times forest land and three times as large-scale
farmlands.
98

The average small-scale farmland is 2.4 hectares with an annual income o f Ksh. 12,000.
Since the average household size is 4.6, this gives an average per capita annual income of
Ksh. 2609. For the families to derive their subsistence from such farmlands there is intensive
cultivation of the rapidly reducing farm sizes. This involves use of agro-chemicals and
hybrid seeds in crop production. From the field survey it was revealed that 97 percent of the
farmers use agro-chemicals in both crop and animal husbandry. Such farmers also favoured
rise in the use of agro-chemicals in order to raise productivity
5.1.4.1 Small-Scale Farmlands, Hydrology and Pollution of Water Resources
Figure. 5.8: The High Rate of Increase in Small-Scale Farmlands
1973 1987 1999
Year
Although the investigation of agro-chemical use per area was beyond the scope of this study,
it was evident that it is higher for the small-scale farmlands than for large-scale farmlands. It
is also bound to increase with future reduction of farmland sizes. Much o f the chemical
residuals find their way to the underground water reserves and in the rivers where they
AnA/-
99

ultimately flow into the lake. More than 50 percent of the rural people in the catchment rely
on either borehole or river water as shown in figure 5.10 below. The water pollution threat is
then very real in such situations especially considering that high stream densities exists in
most of the areas currently under small-scale farming.
5.1.4.2 Small-scale Farmslands, Soils Erosion and Siltation
The small-scale farmlands pose a major threat of soil erosion and siltation. Increased demand
of cultivation land has led to clearing of forests and bushes thus exposing soil to erosion
hazard. Due to the high population growth rate and pressure for land, intensive farming has
also come to be practised in areas of very steep gradients such as that shown in plate 5.12,
below. Encroachment on riversides is also evident on both the high and the lower zones of
the catchment. Besides crop farming, small-scale farmers also keep livestock such as cattle
sheep and goats. In the Njoro and Mau Narok areas, donkeys are kept for transportation.
Livestock is usually grazed communally on wasteland. This increases the soil erosion.
Figure 5.9: Sources of Water for Rural Households
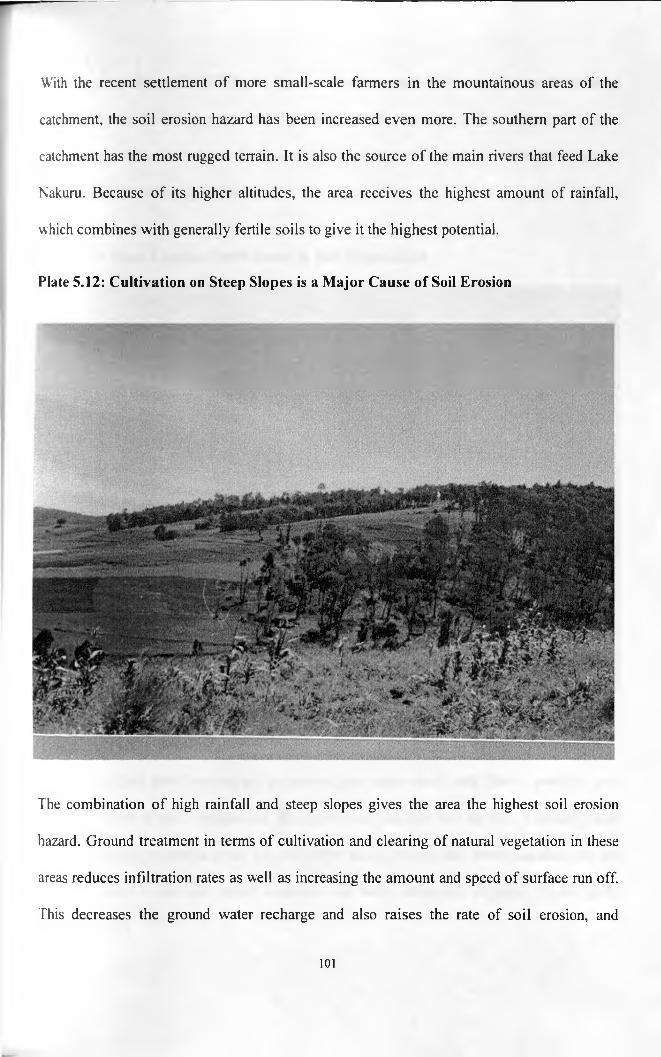
With the recent settlement o f more small-scale farmers in the mountainous areas of the
catchment, the soil erosion hazard has been increased even more. The southern part of the
catchment has the most rugged terrain. It is also the source of the main rivers that feed Lake
Nakuru. Because of its higher altitudes, the area receives the highest amount of rainfall,
which combines with generally fertile soils to give it the highest potential.
Plate 5.12: Cultivation on Steep Slopes is a Major Cause of Soil Erosion
The combination o f high rainfall and steep slopes gives the area the highest soil erosion
hazard. Ground treatment in terms of cultivation and clearing of natural vegetation in these
areas reduces infiltration rates as well as increasing the amount and speed of surface run off.
This decreases the ground water recharge and also raises the rate of soil erosion, and
101
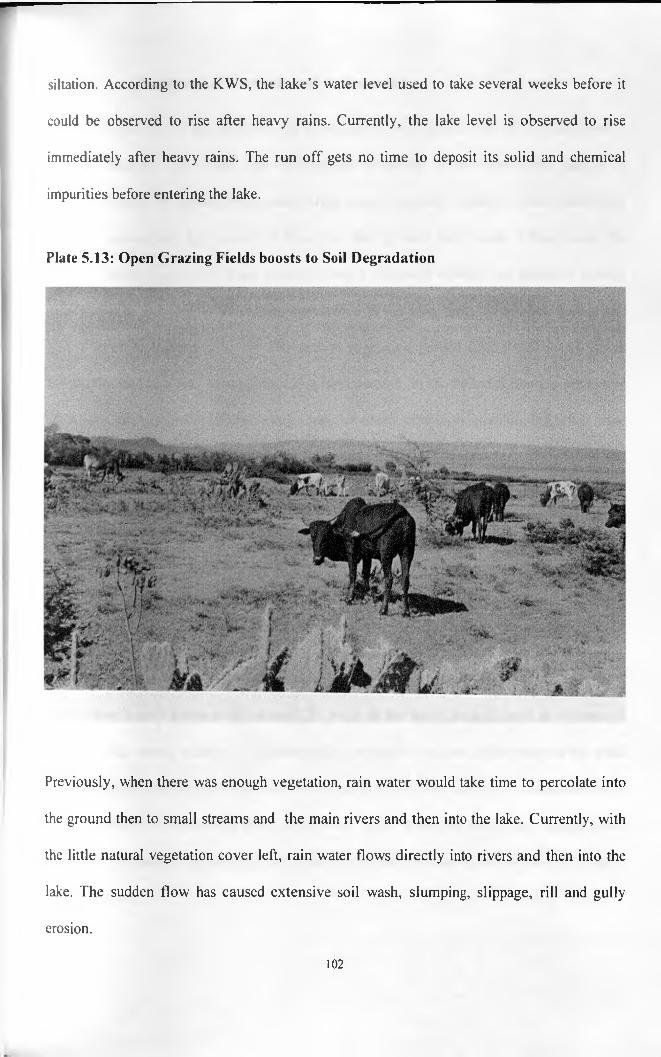
siltation. According to the KWS, the lake’s water level used to take several weeks before it
could be observed to rise after heavy rains. Currently, the lake level is observed to rise
immediately after heavy rains. The run off gets no time to deposit its solid and chemical
impurities before entering the lake.
Plate 5.13: Open Grazing Fields boosts to Soil Degradation
Previously, when there was enough vegetation, rain water would take time to percolate into
the ground then to small streams and the main rivers and then into the lake. Currently, with
the little natural vegetation cover left, rain water flows directly into rivers and then into the
lake. The sudden flow has caused extensive soil wash, slumping, slippage, rill and gully
erosion.
102
5.1.4.3 Small-scale Farmlands and Deforestation
A common practice of the small holders especially in the southern side of the catchment is
charcoal burning. The young and unemployed members of the community engage in
charcoal burning to supplement incomes from farms. Charcoal burning is then extensively
practiced around the forest areas of Kianjoya, Mahiga and Mau Narok. Often, wood for
charcoal burning is sourced from gazetted forests. Charcoal burning has almost a historic
significance to the people. When they first settled in the area, they had to clear bushes and
natural forest to build or cultivate. The natural vegetation proved good for charcoal, which
the people used as a way of supplementing farm income. In the Period following settlement
in the area, the catchment became a large supplier of charcoal to the surrounding urban areas
of Nakuru, Naivasha and even Nairobi. When they exhausted bushes from their farms, the
people started burning charcoal in the forest reserves. Currently, although charcoal burning
is outlawed in the country, it is still common to find lorries full of charcoal coming out of the
remaining natural forests in the area.
5.1.4.4 Environmental Conservation Practices in Small-scale Farmlands
The peasant economy of the small holders is such that farming is not seen as a business
venture but merely a means of survival. To most of the small holders, land is a source of
security and a home, whether it is commercially productive or not. Subdivision of the small
holder farms into even smaller parcels is therefore common. By tradition, sons, and currently
even daughters are entitled to a share o f the family land. Where the family land constitutes of
such small farmlands, the result of such a tradition is sub-economic parcellation of the small-
scale farmlands.
103
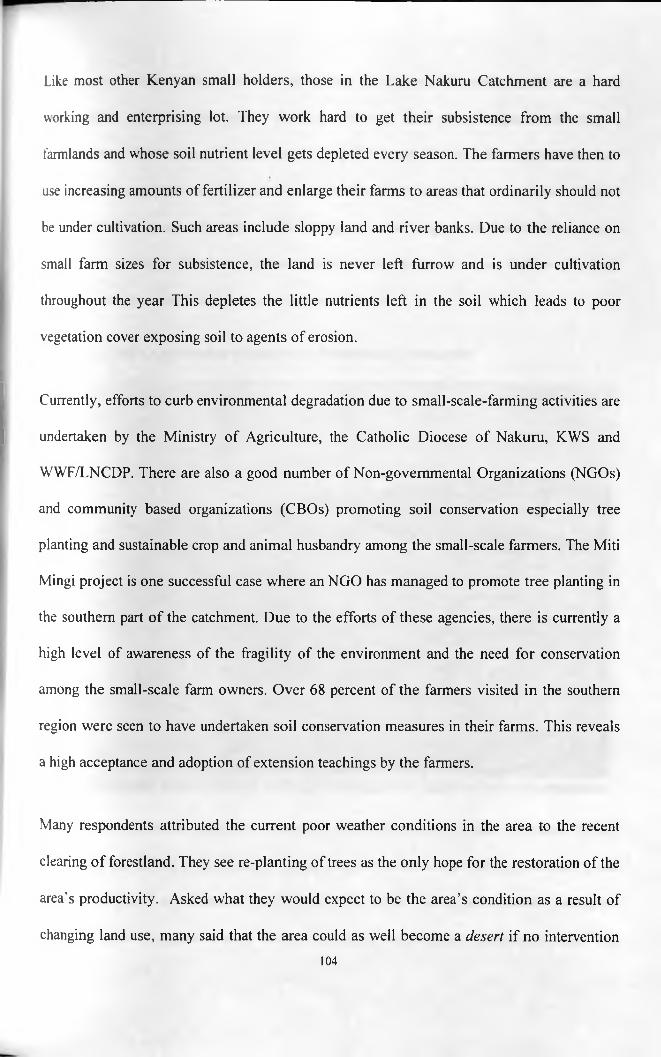
Like most other Kenyan small holders, those in the Lake Nakuru Catchment are a hard
working and enterprising lot. They work hard to get their subsistence from the small
farmlands and whose soil nutrient level gets depleted every season. The farmers have then to
use increasing amounts of fertilizer and enlarge their farms to areas that ordinarily should not
be under cultivation. Such areas include sloppy land and river banks. Due to the reliance on
small farm sizes for subsistence, the land is never left furrow and is under cultivation
throughout the year This depletes the little nutrients left in the soil which leads to poor
vegetation cover exposing soil to agents of erosion.
Currently, efforts to curb environmental degradation due to small-scale-farming activities are
undertaken by the Ministry of Agriculture, the Catholic Diocese of Nakuru, KWS and
WWF/LNCDP. There are also a good number of Non-governmental Organizations (NGOs)
and community based organizations (CBOs) promoting soil conservation especially tree
planting and sustainable crop and animal husbandry among the small-scale farmers. The Miti
Mingi project is one successful case where an NGO has managed to promote tree planting in
the southern part of the catchment. Due to the efforts of these agencies, there is currently a
high level of awareness of the fragility of the environment and the need for conservation
among the small-scale farm owners. Over 68 percent of the farmers visited in the southern
region were seen to have undertaken soil conservation measures in their farms. This reveals
a high acceptance and adoption of extension teachings by the farmers.
Many respondents attributed the current poor weather conditions in the area to the recent
clearing of forestland. They see re-planting of trees as the only hope for the restoration of the
area's productivity. Asked what they would expect to be the area’s condition as a result of
changing land use, many said that the area could as well become a desert if no intervention
104

measures were undertaken. Most such respondents are the ones who settled in the area in the
early 1970s and have witnessed three decades of land use change constituting a
transformation from a 4 Jungle' into a densely populated area. To them, this is a paradise lost.
Although climatic patterns are generally controlled more by large scale atmospheric systems
and modified by meso-scale systems like topography and large water bodies rather than a
small catchment area like Lake Nakuru Catchment, the response serves to show the local
people’s awareness and concern on environmental issues.
Plate 5.14: Soil Conservation Measures in Small-scale Farmlands
There is also increased ecological awareness of the functioning of the watershed. Mainly
because o f the efforts of the LNCDP, many people are now aware of the relationship and
effects of activities in one area to the rest of the Catchment. Ecological awareness among the
peasants is then a positive score for environmental conservation in the catchment. The105
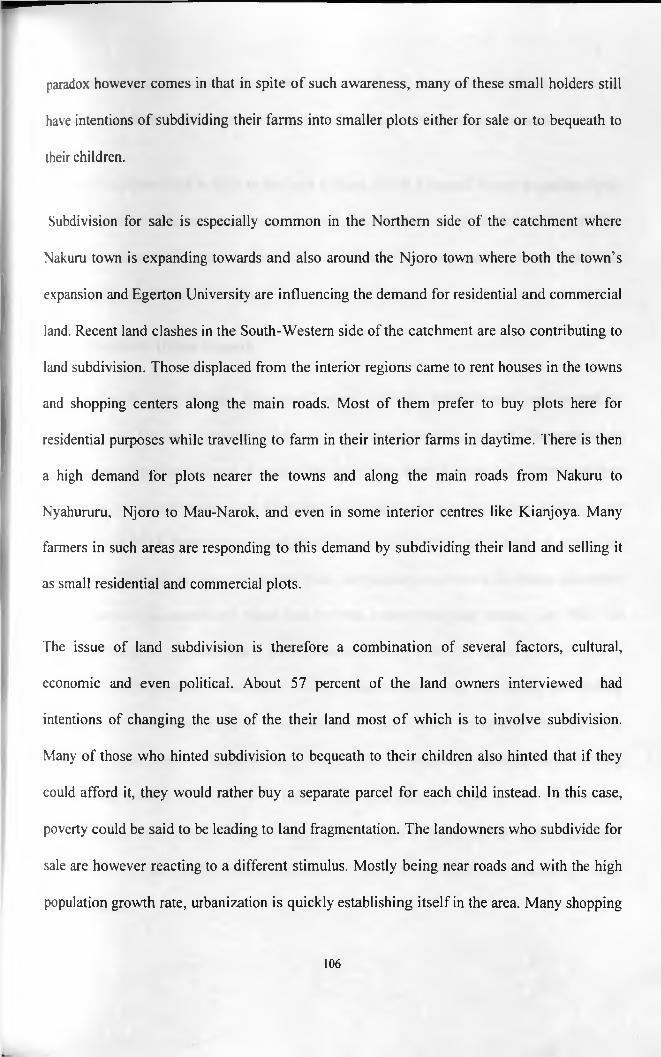
paradox however comes in that in spite of such awareness, many of these small holders still
have intentions of subdividing their farms into smaller plots either for sale or to bequeath to
their children.
Subdivision for sale is especially common in the Northern side of the catchment where
Nakuru town is expanding towards and also around the Njoro town where both the town’s
expansion and Egerton University are influencing the demand for residential and commercial
land. Recent land clashes in the South-Western side of the catchment are also contributing to
land subdivision. Those displaced from the interior regions came to rent houses in the towns
and shopping centers along the main roads. Most of them prefer to buy plots here for
residential purposes while travelling to farm in their interior farms in daytime. There is then
a high demand for plots nearer the towns and along the main roads from Nakuru to
Nyahururu, Njoro to Mau-Narok, and even in some interior centres like Kianjoya. Many
farmers in such areas are responding to this demand by subdividing their land and selling it
as small residential and commercial plots.
The issue of land subdivision is therefore a combination of several factors, cultural,
economic and even political. About 57 percent of the land owners interviewed had
intentions of changing the use of the their land most o f which is to involve subdivision.
Many of those who hinted subdivision to bequeath to their children also hinted that if they
could afford it, they would rather buy a separate parcel for each child instead. In this case,
poverty could be said to be leading to land fragmentation. The landowners who subdivide for
sale are however reacting to a different stimulus. Mostly being near roads and with the high
population growth rate, urbanization is quickly establishing itself in the area. Many shopping
106
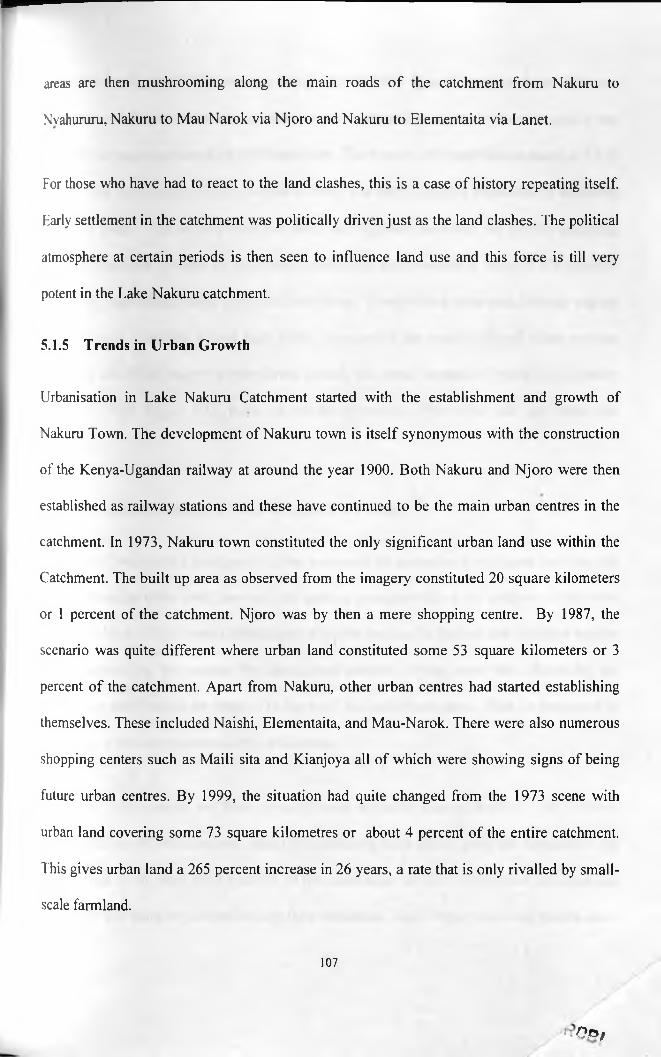
areas are then mushrooming along the main roads o f the catchment from Nakuru to
Nvahururu, Nakuru to Mau Narok via Njoro and Nakuru to Elementaita via Lanet.
For those who have had to react to the land clashes, this is a case of history repeating itself.
Early settlement in the catchment was politically driven just as the land clashes. The political
atmosphere at certain periods is then seen to influence land use and this force is till very
potent in the Lake Nakuru catchment.
5.1.5 Trends in Urban Growth
Urbanisation in Lake Nakuru Catchment started with the establishment and growth of
Nakuru Town. The development of Nakuru town is itself synonymous with the construction
of the Kenya-Ugandan railway at around the year 1900. Both Nakuru and Njoro were then
established as railway stations and these have continued to be the main urban centres in the
catchment. In 1973, Nakuru town constituted the only significant urban land use within the
Catchment. The built up area as observed from the imagery constituted 20 square kilometers
or 1 percent of the catchment. Njoro was by then a mere shopping centre. By 1987, the
scenario was quite different where urban land constituted some 53 square kilometers or 3
percent of the catchment. Apart from Nakuru, other urban centres had started establishing
themselves. These included Naishi, Elementaita, and Mau-Narok. There were also numerous
shopping centers such as Maili sita and Kianjoya all of which were showing signs of being
future urban centres. By 1999, the situation had quite changed from the 1973 scene with
urban land covering some 73 square kilometres or about 4 percent of the entire catchment.
This gives urban land a 265 percent increase in 26 years, a rate that is only rivalled by small-
scale farmland.
:-O o ,
107

Nakuru town is quickly expanding along the Nakuru Nairobi road and the Nakuru-
Nyahururu road. The other smaller towns have continued to expand. Njoro township has
grown to be an urban centre of significant size. The town’s 1979 population stood at 9,026
people. This increased to 22,023 people in 1989. Currently, Njoro’s population is estimated
at 44,000 people. The areas around this town and Egerton University are quickly acquiring
an urban character. Around the university, landowners have reacted to demand of residential
houses by constructing rental houses in their farms. Those with a main road frontage engage
in commercial activities within their farms. Because o f the good road and other services
including electricity supply to the farms around this area, demand of plots by university
workers is high. Figure 5.11, below shows the dynamics o f the urban land use within the
Catchment.
5.1.5.1 Urbanization as a Force in Land Use Change
Within the Lake Nakuru Catchment, urban land could be termed as the ultimate land use, not
only influencing other land uses but also gaining quantitatively at the expense of the other
land uses. Most o f the farmers interviewed sell their produce in Nakuru and the other smaller
urban centers. As the market for agricultural produce, urban areas then determine the
production activities of the farmers in the rural and sub-urban areas. What is demanded in
the towns is what the farmers end up producing.
The small scale-farmers are then currently using intensive farming methods that involves
widespread use o f fertilizers and other agro-chemicals to be able to meet the demands of the
urban areas. More than three quarters of the small-scale farmers interviewed use chemical
fertilizers and other agro-chemicals in their farmlands. These farm inputs are bought from
108

the urban centres, mostly Nakuru town. Agricultural land use therefore ends up having a
symbiosis with urban land use. Urban centres also facilitate activities and operations of the
large-scale farmers. They not only serve as market areas for agricultural produce, but also
serve as processing and value adding points. Farm inputs and implements including
machinery are also sourced from the urban centres.
Figure 5.10: Gradual Increase in Urban Land Use in Lake Nakuru Catchment
1973 1987 1999
Year
Within the catchment, Nakuru is a primate town. The town is also ranked fourth in the
country. The town’s population has expanded rapidly from 47,000 people in 1969 to 163,900
people in 1989. Currently, it is projected to be about 400,000 people. The town has also
grown to be a significant industrial center with over 100 registered industries. The industries
range from soap making, battery manufacturing, steel fabrication, paint production, milk
processing and blanket making. The town is also an important commercial center with
several banks, hotels retail and wholesale shops. The residential area is quite large and
109

"
ranges from well planned and serviced, high and middle income areas to virtually unplanned
urban settlements or slums.
5.1.5.2 Implications of Trends in Urban Land Use to the Environment
It is evident that the urban phenomenon has reached significant proportions within the
catchment. Urban expansion poses a major threat to environmental sustainability. Among
these threats are pollution of underground and surface water by effluent and runoff from the
urban area. It also causes land use conversion from other uses like agriculture and
conservation to urban use. In Nakuru town for example, the bulk of the water supply comes
from ground reserves through some 13 boreholes. Increased town population will imply
more boreholes, 20 o f which are already planned behind Menengai Crater (Daily Nation, 26th
October 1999). This may end up lowering the water table. Increased water supply also
implies increased effluent from the sewerage treatment works. Although the sewage is
treated for organic pollutants, it definitely contains a lot o f inorganic pollutants.
Plate 5.15 The Rapidly Expanding Nakuru Industrial Area
110
(JMnA C}/

The town is also a major encouragement to deforestation. Its high demand for timber
charcoal and even firewood results to more felling of trees from forestlands. Some industries
in the town use charcoal and firewood as a source of energy. The urban phenomenon is
therefore one of the main factors influencing decrease in forestland. It has also encroached
on rural farmlands thereby reducing the area under agriculture, forestland and even
geologically unstable land. An analysis of the land use pattern maps reveal that while urban
growth has taken land from all other land uses, it has not lost land to any other uses itself. It
can then be concluded that the catchment is slowly evolving into one large urban center
where urban land may be viewed as the ultimate land use.
The environmental effects of the expansion of Nakuru town especially to the National Park’s
ecology are well documented in the Nakuru Strategic Structure Plan. For effective
environmental management within the catchment, it is imperative that the effects of
upcoming towns be studied and urban land use planning and environmental management be
done at the earliest possible time. Njoro town, which is expanding quite first, lacks sewage
treatment works. Much of its effluent including sludge from an abboitor and several
industries enters river Njoro while still untreated and finds its way into the lake. The Other
smaller centres are also quickly gaining an urban character. Plate 5.13 shows one such
upcoming urban center. Such settlements needs to have their growth planned and controlled
at the earliest moment possible or else the quality of their development will have major
environmental impcats.
I ll
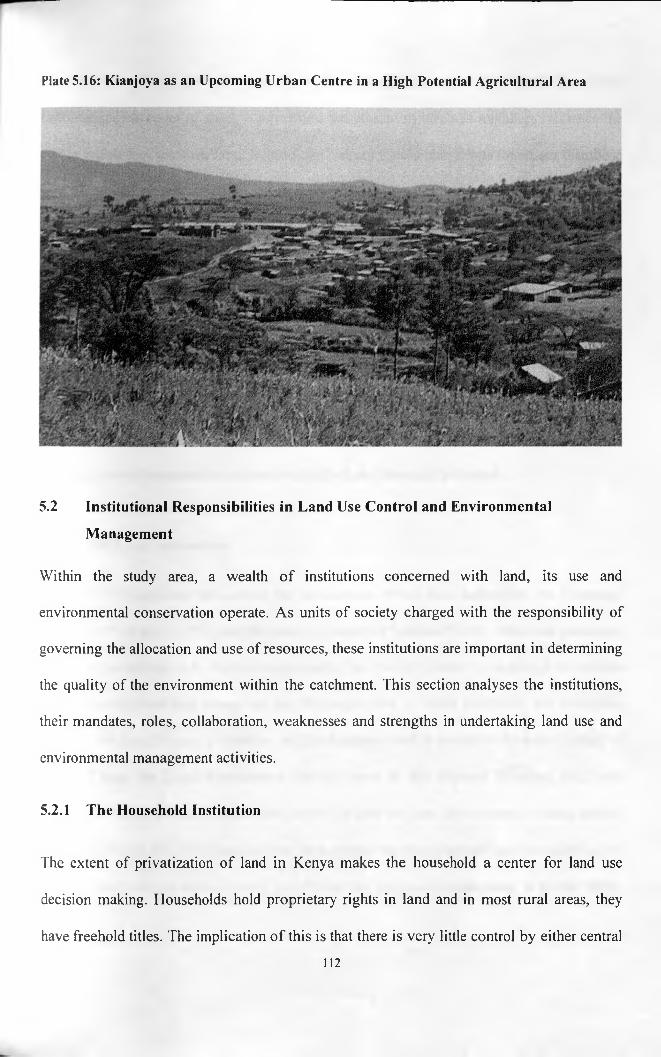
Plate 5.16: Kianjoya as an Upcoming Urban Centre in a High Potential Agricultural Area
5.2 Institutional Responsibilities in Land Use Control and Environmental
Management
Within the study area, a wealth o f institutions concerned with land, its use and
environmental conservation operate. As units of society charged with the responsibility of
governing the allocation and use of resources, these institutions are important in determining
the quality of the environment within the catchment. This section analyses the institutions,
their mandates, roles, collaboration, weaknesses and strengths in undertaking land use and
environmental management activities.
5.2.1 The Household Institution
The extent of privatization of land in Kenya makes the household a center for land use
decision making. Households hold proprietary rights in land and in most rural areas, they
have freehold titles. The implication o f this is that there is very little control by either central
112
government or local authorities on how these households use their land. Household
characteristics in terms of sizes, composition and education levels of members influence the
way in which they use their land. In the Lake Nakuru Catchment, it was found out that those
with many sons intend to subdivide among the sons while those with higher education were
found to generally intend to introduce some commercial activities in their farms. Where
family members were adequately educated, most tended to work outside their farms, this
having a limitation on excessive subdivision.
As an institution, the household is then the first body that conservation efforts should be
directly concerned with. This is the unit of society that shapes and decides the land use
pattern. They own resources in terms o f land, labour and capital that ought to be harnessed in
the promotion of sustainable land use within the Lake Nakuru Catchment.
5.2.2 The Local authorities
Lake Nakuru Catchment falls within the jurisdictions of two local authorities, the Municipal
Council of Nakuru (MCN), and the County Council of Nakuru (CCN). While the municipal
council’s jurisdiction is in Nakuru municipality, the County Council is in charge of all areas
in the district other than towns and the Municipal area. A small portion o f the catchment
towards the Mau Ranges is however in Narok district and is under the County Council of
Narok. Under the Local Government Act and even in the Physical Planning Act, local
authorities are identified as important players in land use and development control control
issues. Under the Physical Planning Act for example, any development must be approved by
the local authority on whose area of jurisdiction the proposed development is to take place.
113
The two local authorities in the catchment are then institutions of critical importance in as far
as controlling and guiding of future land use is concerned.
5.2.2.1 Municipal Council of Nakuru
The Municipal council of Nakuru is in charge of some 290 square kilometres or about 16
percent o f total catchment area. The crucial role of this area emanates from the high
concentration of people and land use in Nakuru town. The town is the main point source of
pollution to Lake Nakuru. As the main urban centre containing more than a half of total
catchment population, the town is arguably the most influential land use within the
catchment both in terms of pollution threat and also in influencing other land uses.
It is because of these crucial effects o f the town that the municipal council is a centre stage
institution in the planning and control o f land use within the catchment. It has been identified
as the main implementing agency in the Nakuru Strategic Structure Plan (NSSP), which
aims at experimenting on localising Agenda 21 in a Third World African City. The plan
recognises institutional collaboration and community participation as main strategies
towards achievement of the plan objectives. Since the results and lessons learned from the
NSSP will be used in duplicating the LA21 to other towns in similar settings, the council
faces a major challenge on how to fit in this role.
522.2 The County Council of Nakuru
In Kenya, a county council covers the administrative area o f the district. The jurisdiction of
the county council however excludes those areas under Municipal and town councils. The
county Council of Nakuru is therefore the authority having the bigger share o f the catchment
under its jurisdiction. It is in charge o f all the small and medium sized urban centres. The
114
potential role of the County Council in managing land use and environmental issues in the
catchment can not therfore be overemphasised.
5.2.2.3 Weaknesses of the Local Authorities
Like most other local authorities in Kenya, the current capacity of the councils to undertake
land use change monitoring and control is very limited. There are operational restrictions
imposed by the Central Government making the councils unable to hire or even consult
technical experts who my be required to undertake the tasks involved in land use studies.
The councils are then made to rely on the services of the district and provincial central
government officers for data and information and even advise regarding land use change and
control in their area of jurisdiction. Such officers are however answerable to their respective
ministries and often do not serve the councils requests adequately. For the same reason, the
role of the local authorities tends to be eclipsed by that of the District Development
Committee, which comprises o f the District Departmental Heads.
The local authorities, being responsible for licensing of all commercial activities within their
areas of jurisdiction have important databases on changes in land use. The rate at which rural
shops are being established is an indication of changes in the general area where catchment
population concentration must have risen to warrant an establishment of a rural shop. The
management of the information is however very poor. Old filing systems are in use and there
is no attempt at computerisation of the data. The staff is also not trained in modern data
management methods. This poor information management system results in wastage of time
in accessing information and definitely limits the utility o f the information. It also limits the
scope o f collaboration with other stakeholders who may require the information. With the
current requirement by the Physical Planning Act that all development applications be
115

submitted to local authorities, the need for technical expertise among council employees and
the establishment o f a land use and environmental information system is even more urgent.
5.2.3 The Kenya Wildlife Services
The importance of Kenya Wildlife Services (KWS), in the environmental management of the
Lake Nakuru Catchment stems from the centrality of Lake Nakuru in the National park.
KWS is the body mandated to manage and be custodian o f all the wildlife in Kenya. This
role automatically makes it the manager of all national parks and game reserves within the
country. KWS is therefore a centre stage institution in the management of land use and
environment within the catchment. Initially, KWS was not concerned with activities outside
the park and concentrated within the park boundaries. The current park management
however recognises the fact that most o f the problems facing the park emanate from land use
outside the park and that the park cannot be planned and managed in isolation.
The depletion of water volume in Lake Nakuru, its siltation and the increased chemical
pollution of the lake waters have been some of the reasons prompting KWS to develop an
interest in land use outside the National Park. KWS has been keeping records o f water flows
for all main rivers entering the lake including their chemical content. It has also collaborated
with researchers especially from Egerton University and WWF in undertaking
environmental studies within the catchment. KWS therefore joins the two local authorities as
one of the major institutions that should pool their resources towards the development of a
land use monitoring and environmental conservation programme in the catchment. These
institutions already have massive data and information which is currently unavailable to the
other institutions, either through deliberate restriction or due to the shear effort required in
116

retrieving any meaningful information from the data due to the storage and management
methods.
Although in terms of personnel training KWS staff have better appreciation for
environmental management and information systems than those in the local authorities, there
was still identified some need for prioritisation of information collection and management
programmes. The staff members also need to be further trained and be provided with modem
information technology equipment.
5.2.4 The Physical Planning Department
The Mission of the Physical Planning Department is stated as
to ensure that human settlements are planned providing an appropriate spatial framework within which
environment and socio-economic development activities of the country can harmoniously take place
through the preparation of National, Regional and Local land use development plans (GOK, 1968).
This mission statement gives the department a leading role in the determination of land use
policies and plans. The PPA also gives the Director o f Physical Planning the role of
preparing Regional and Local Physical Development Plans that local authorities are then
supposed to use in guiding development within their areas of jurisdiction. Since these plans
will directly influence the future land use pattern in their respective areas, the department is
then a main player in the development o f a land use monitoring and control system.
Through the District and Provincial Physical Planning offices, there is a scope for
collaboration on issues concerning land use and environmental planning. The department has
of late been able to spearhead the preparation of both the Nakuru Strategic Structure Plan
and a Nakuru Regional (District) Physical Development Plan. The Department however
117

suffers from many limitations. Like many other Central Government departments, it is
beleaguered with a bureaucracy that often makes collaboration difficult. It is also ill
equipped, understaffed and the staff members are quite unexposed to modem office
operations especially in modern planning data and information management systems.
The strength of the department lies in formulation and advice on land use planning policies
to the local authorities and also assisting in monitoring o f their implementation. Since the
department’s operations cover the entire catchment and even beyond, it is the best forum to
bring the County council, the Municipal council and the KWS together in the management
of their land resources, as all these other institutions are only mandated to manage specific
areas of the catchment.
5.2.5 Department of Lands
The Kenyan, constitution vests all land in the state. The president as the head of state is the
trustee for the national land resource. He however appoints a Commissioner of Lands who
heads the Lands Department within the Ministry of Lands and settlement. The commissioner
administers all national land on behalf of the president. The commissioner has powers to
give grants to individuals and institutions of government land under the Government Lands
Act. Before the enactment of the Physical Planning Act, the commissioner had to approve all
development proposals including Part Development Plans (PDPs), made by the director of
Physical Planning. The lands department is then an influential department in as far as
deciding and future land use is concerned.
118
5.2.6 Other Central Government Departments
Most Central government departments are represented in the District Development
Committee, (DDC). The DDC could then be regarded as a multi-disciplinary institution
concerned with all aspects of development within the district. There are several departments
whose interests touch on issues related to land use and whose operations may generate
important land use information. Such departments could also benefit from an integrated land
use information system within the catchment. Although such departments normally operate
at the administrative unit level such as the district, it is also true that they often deal with
issues at a project basis. For those projects that are based in Lake Nakuru catchment, a scope
of collaboration exists with other institutions
The departments/ministries include that of Agriculture, water, industrial development,
environment/forestry and natural resources, among many others. The Ministry of
Agriculture’s extension officers were for instance found to be very effective in disseminating
soil conservation methods among the farmers. Such a network is then very useful in land use
data collection and the dissemination o f conservation information regarding peoples use of
their land. The Ministry of Water development keeps hydrological records including
volumes and quality of water. Variations in this statistics could be correlated with those in
land use in an attempt to model land use-environment relationships. The department of
Resource Surveys and Remote Sensing in the Ministry of environment is yet another
relevant central government organ that deals with land use information gathering. The
department makes regular aerials surveys of crop vigour, forest resources and stocking levels
of wildlife and rangeland areas. Formally, the department has undertaken vegetation
mapping of the Lake Nakuru National Park. The capacity of the department to work with119

other institutions in general and in undertaking specialised resource surveys using aerial
surveys and satellite remote sensing techniques is quite high.
The Survey of Kenya as the government department responsible for surveying and mapping
the national wealth also has a crucial role in the management of the environment. The
department makes accurate maps, which are useful in various types of studies. The
department also engages in aerial photography and remote sensing data analysis. The
Director of Surveys is also custodians of massive data on proprietary units of land and
topographical maps at various scales. Bureaucratic requirements that one acquire clearance
from the Department of Defence however discourage people from requesting for the maps.
The data held by this department ends up not being fully utilised by the same public that
pays for its compilation and storage. The department also suffers from lack of proper
equipment and personnel and is unable to update the maps in a continuous basis.
5.2.7 NGOs and CBOs
Non-Govemmental Organisations (NGOs) and Community-Based Organisations(CBOs)
have played an important role in the development and also in the environmental conservation
of the Lake Nakuru Catchment. Church groups have especially been undertaking
development projects including water and educational projects. The WWF through its
LNCDP has been the main agency undertaking conservation studies and education within
the catchment. The Miti Mingi Project has also been active in afforestation measures in most
parts of the catchment.
NGOs and CBOs, because of their nature of operation, which unlike in government
departments has less bureaucracy, were seen to be the best link between the government
agencies and the local communities. They provide a good network or forum for organising
the community into groups, which facilitates their participation in and benefiting from
conservation efforts. NGOs also source extra funds from external agents to supplement local
resources in conservation efforts.
5.3 The Prevailing Legal Framework for Land Use and Environmental Management
Various legislation have been put in place to give institutional roles and also aid them in the
control and regulation of land use and formulation of environmental management
programmes. In Kenya, the legislation that governs the use of the nation’s land resources is
diverse ranging from general laws to resource specific laws. The legislations, their scopes,
weaknesses and strengths are reviewed in the remaining part of this chapter.
5.3.1 Forest Act and the Forest Bill
The forest Act, CAP 385 of the Laws of Kenya, came into operation in March 1942.
Although the act was meant to facilitate the management and protection of forest resources,
recent developments in resource management and conservation paradigms have made it
inadequate. The act adopts a Top-Bottom approach, which places the management of forests
in the hands of government bureaucrats while ignoring the role of communities in
conservation of forest resources. The Act has been unable to protect forests and at times even
facilitated their depletion.
There is currently a bill of parliament that proposes to put emphasis on community based
forest management as a main strategy for securing the country’s forest resources and placing
it under cheap and effective management structures. The bill comes out the realisation that at
121

the current rate of depletion, the country’s forests will be decimated by 2050. This could be
supported by the findings on forest depletion in Nakuru catchment since 1973. The bill seeks
to establish a statutory body to oversee the management of forests in the country. This body,
the Kenya Forest Service will have powers to protect all forests in the country, prepare
management and exploitation plans for all the forests in the country. It shall also include the
establishment of state forests on un-alienated government land, purchased government land
and compulsorily acquired land
The proposed bill is however not devoid of weaknesses. It does not provide a memorandum
of understanding between various stakeholders. Although it seeks to have local communities
involved in the management and conservation of forest resources, it does not give the
modalities of bringing them to participate, neither does it give the gains that the communities
are to derive from such a participation. The bill also fails to give a clear definition of who are
to be considered to constitute the community living around the forest. Although the bill
proposes a penalty for those found plundering forest resources, the penalty is not harsh
enough to serve as a deterrent. The maximum penalty is Ksh. 10,000 or six months
imprisonment or both fine and imprisonment. It is unreasonable that following this bill’s
proposals, someone caught fetching firewood in the forest may be penalised the same way as
one found using a power saw for logging in a plantation forest. Like with many other laws
the effect of this bill may end being that the small timer, who usually has less impact is the
one who gets the blunt of the law while the big-time plunderer goes scot-free.
122
5.3.2 The Environmental Management and Co-ordination Act
The Environment Bill was passed by parliament in December 1999 and became the
Environmental Management and Co-ordination Act after presidential accent. The Act seeks
to establish a Parastatal, the National Environmental Management Authority (NEMA) which
shall be charged with the responsibility of among other things overseeing the state of the
environment as well as its management. Section 68(1) o f the act requires the authority to
carry out an audit of all those activities that are likely to have significant impacts on the
environment. The Act establishes a Standards and Enforcement Committee which shall be
advising the authority on criteria and procedures in environmental quality assessment.
The Act makes it mandatory for manufacturers to publish an environmental impact
assessment report before commencement of any project. It also gives citizens a right to be
heard in court {Locus Standi), over issues concerning the environment. Another positive
aspect of the Act is its recognition of the roles of multiple actors in environmental issues.
The National Environmental Council is mandated to co-ordinate the activities of public
departments, local authorities, private sector and NGOs engaged in environment
conservation. It will also formulate policy and set national goals regarding environmental
conservation and also publish annual reports on the state o f the environment. The Act will
also oversee environmental education and public awareness in environmental conservation.
The Act gives a right to the access of environmental information to the public.
The Act however has got some shortcomings. Although it gives to citizens a locus standi on
environmental issues, it ignores the role of indigenous knowledge in environmental
conservation. The Act also sounds utopian in its requirement for water and air quality checks
123

within an environment of limited quality analysis facilities. Although the bill sets harsh
punishment for polluters of the environment including the cost for restoration, the method of
valuation of the pollution damage are not clearly stated.
5.3.3 The Land Control Act
The Land Control Act (CAP 302) of 1967 is the most influential legislation when it comes to
subdivision and transactions in agricultural land. It lists a number of controlled transactions
for which consent has to be obtained by the agricultural landowner before the transaction can
have the force of law. The Act defines agricultural land as land; that is not within a
municipality, a township, trading centre or market, or any other land that the Minister may
by notice in the gazette declare to be agricultural land. A hierarchy of land Control boards is
then established ranging from the divisional to national level. The boards have representation
consisting of the provincial administration, central government officers from relevant
ministries, local authorities and community members.
In the context of this study, the Land Control Act is important in as far as regulating of the
subdivision and change of user of agricultural land is concerned. Provisions of the Act if
properly followed could salvage agricultural land while lack of its enforcement can result to
sub-economic agricultural land sizes and even conversion to urban uses.
5.3.4 The Water Act
The Water Act, Cap 372 of 1962 is an act of parliament to make provision for the
conservation, control apportionment and use o f Water resources. Section 3 o f the act vests
all water over or upon any land in the government. Subject to any rights of user which may
be granted to any person. Section 8 empowers the Minister to acquire land for the
124

conservation, improvement or use of water resources. Section 14 empowers the minister to
declare an area a protected catchment. This may include that he order, require, regulate or
prohibit the doing by any person in such protected area of any act which he considers
necessary for the protection of such an area or for the protection of water supply obtained
therefrom. Any person who fails to comply is guilty of an offence and liable to a fine not
exceeding ten thousand shillings. Section 20 of the act establishes a Water Resources
Authority, whose duty includes investigating the water resources and advising the minister in
regard to the improvements, preservation and conservation, utilisation and apportionment of
such resources, and to the provision of additional water supply.
In section 22, the authority is empowered to subdivide the country into catchment areas and
to amend such catchments from time to time. A board is appointed for each such catchment
by the minister, its duty being to advise the water apportionment board of the area. In section
24, Regional Water Committees are appointed by the Minister to advise him on the water
conservation and development policies, and also to receive recommendations for water
development from local authorities. Section 25 establishes Water Apportionment Boards
which subordinates the Water Resources Authority.
In section 158, the penalty for polluting water resources that are used for human
consumption is provided. The section however considers water resources in the narrow sense
of water for domestic use. Water bodies such as Lake Nakuru, which are not sources for
domestic water does not therefore benefit from provisions o f the act. The section particularly
exempts: -
1. A ny lawful method of cultivation o f land or the watering o f livestock which in the opinion o f the Minister does not conflict with the principles o f good husbandry,
125

2. Reasonable use of oil, tar or other substances on any highway or road so long as the authority concerned takes all reasonable measures of preventing any liquid thereof from polluting any source of water.
3. The disposal of effluents or waste. (GOK, 1999).
These exemptions are however seen to be among those posing the greatest risks in the Lake
Nakuru Catchment, especially the Non-point sources of pollution. To this extent it is true
that the Water Act fails to protect Lake Nakuru as a water body.
5.3.5 The Local Government Act
The Local Government Act, CAP 265 o f 1963 is an act o f Parliament to provide for the
establishment o f authorities for local government, to define their functions and to provide for
matters connected therewith and incidental thereto. Under the act, Local authorities include
Municipal, County, Town and Uban Councils. Section 145 (v) of the act requires Local
Authorities to establish, maintain and assist information centres and inquiry bureaux. Section
147(d) empowers authorities to control the cutting of timber and destruction of trees and
shrubs to prohibit the wasteful destruction of trees and shrubs and to require the planting of
trees. In section 155 (f), Local Authorities are given power to establish and maintain forests.
Under section 159, county councils have power to prohibit and control shops in the rural
areas. All council are given power under section 162(g) to control the subdivision of land
within their areas o f jurisdiction. Under section 166, every local authority is empowered
subject to any written law to prohibit and control the development and use of land and
buildings in the interest of proper and orderly development of its area.
The Local Government Act is therefore seen to be a comprehensive legislation in as far as
land use and environmental conservation is concerned. In as far as it allows local authorities
to make by-laws, the act has a capacity to address unique local situations like those found in
126
the Lake Nakuru cacthment. The main weakness of the act lies in that it denies Local
Authorities the autonomy they need in order to effectively implement the programmes they
are mandated to undertake.
5.3.6 The Registered Land Act
There are various legislations giving various forms of land tenure in Kenya. Different land
tenure types are then administered using specific statute that specify not only the form of
ownership but also the type of use and method of conveyancing. To reduce the multiplicity
of legislation on land the government’s intention is to have all land registered under the
Registered Land Act (Cap 300) of 1963. Land initially registered under the Registration of
Titles Act (Cap 281), is then being converted to RLA. The reasoning behind the conversion
is for easier administration of land.
From a Planner’s point of view, land held under the Registration of Titles Act may seem
easier to administer because the law has specific provision for conditions under which
owners of land can subdivide, use or develop and transfer their title. The essence of the
Registered Land Act is however historic in nature. By the time of independence, the African
land problem was top in the agenda. Registration under the Registration of Titles Act
required rigorous survey and accurate fixing of land boundaries. This not only meant much
delay but was also quite expensive. The Registered Land Act was then enacted in 1963 to
facilitate registration of land under general boundaries where less-accurate but quicker and
cheaper surveys could be used. Registered Land Act however covers registration of land
under both general and fixed boundaries. Private land held under Registered Land Act has no
user conditions listed in the title. The prohibitive legal mechanisms in-built in the
127
Registration of Titles Act are legislated in other separate legislation like the Land Control
Act and the Physical Planning Act.
While it is true that the Registered Land Act has made land administration easier, it is
observed that this ease has been accompanied by difficulties in land use control and
environmental regulation. The act is not explicit in terms of planning provisions and
therefore requires much reference to the other more explicit planning legislation.
5.3.7 The Physical Planning Act
The Physical Planning Act (1996) is an Act o f Parliament to provide fo r the preparation and
implementation o f physical development plans and for connected purposes. Passed in 1996
as a law in Kenya, the Act came into commencement in mid 1999. Section 3 of the Act
defines development as to include the making o f any material change in the use or density o f
land or the subdivision o f land. Section 4 of the Act establishes the office of the Director of
Physical Planning who is the chief government advisor on all matters relating to physical
planning. In section 5 of the act, the Director is empowered to formulate national, regional
and local physical development policies, guidelines and strategies and to prepare regional
and local physical development plans with reference to any Government land, trust or private
land.
A regional physical development plan is taken to be a plan for an area or part thereof of a
county council while a local physical development plan will be within the area of a city,
municipal town or urban council, a trading or market centre. The Director’s duties also
include advising the Commissioner of lands and local authorities on the most appropriate use
of land including land management such as change of user, extension of user and lease,128

subdivision and amalgamation of land. He is also empowered to require local authorities to
ensure the proper execution of physical development control and preservation orders.
On the approval of a physical development plan, no development is allowed to take place on
any land within the plan area unless it is in conformity with the plan. Each local authority is
empowered to prohibit or control the use and development o f land in the interest of proper
and orderly development of its area. It is also required to control or prohibit the subdivision
of land or existing plots into smaller areas and to consider and approve all development
applications and grant all development permissions. Section 30 (1) requires anybody
intending to carry out development within an area of a local authority to get permission from
the authority. Under section 30 (5), no licensing authority can grant a license o f commercial
or industrial use of land if the respective local authority has not granted development
permission. The Local authority on the other hand is required to ensure that the Director has
issued the developer with a certificate of compliance before granting development
permission.
Where any development application require subdivision or change of user of any agricultural
land, the local authority is required to refer the issue to the relevant Land Control Board for
advise on whether to approve or reject the application. Where the Local authority feels that a
proposed development will have injurious impact on the environment, it may require the
applicant to submit together with the application an environmental impact assessment report.
Subdivision and land use plans in relation to any private land are to be prepared by
registered physical planners and approved by the Director. The act requires that no private
129
land within the area o f a local authority may be subdivided except in accordance with the
requirements of a local physical development plan approved in relation to that area.
Section 23(1) empowers the Director to declare an area with unique development potential
or problems as a special planning area for the purpose o f preparation of a physical
development plan irrespective of whether it lies within or outside the area of a local
authority. This includes an area cutting across the boundaries of two or more local
authorities and which has spatial or physical development problems. Section 42 requires that
due regard be taken of the requirements o f the relevant physical development plan before
subdivision, consolidation lease or renewal of lease of un-alienated government land or trust
land under the Government Lands Act and Trust Land Act respectively.
130
CHAPTER SIX
CONCLUSION AND RECOMMENDATIONS
6.0 Summary of Findings
The study has revealed the general trends in land use over the past twenty-six years and the
likely environmental implications of this trend. Table 6.1 is a summary o f these changes.
The most remarkable changes are the increase in small-scale farmland and urban land at 304
percent and 265 percent respectively. Small-scale farmland has now overtaken forestland as
the main land use within the catchment. Urban land, although still the smallest in terms of
areal extent has consistently maintained a lead in the rate o f growth. Given that the growth in
small-scale farms is a step towards urban development, it is true that the region is growing
towards becoming one large urban area. While majority o f the landowners acquired land in
the catchment between 1973 and 1987, settlement is still going on through government
allocation of degazetted forestland or through buying of subdivided large-scale farms.
Land use was were also found to have potential negative implications on environmental
conservation in the catchment. The upcoming urban centres are largely unplanned and pose
major threats as point sources of pollution. The large and small-scale farmlands are non
point sources of pollution while still exposing the soil to major soil erosion hazards. Erosion
hazard is especially acute in the southern side of the catchment. This is the area which has
higher amount o f annual rainfall and yet with steeper slopes. Clearing of forests has
aggravated the risk. All these activities are bound to increase the level of pollution of ground
and surface water resources and increase siltation of the Lake.
131
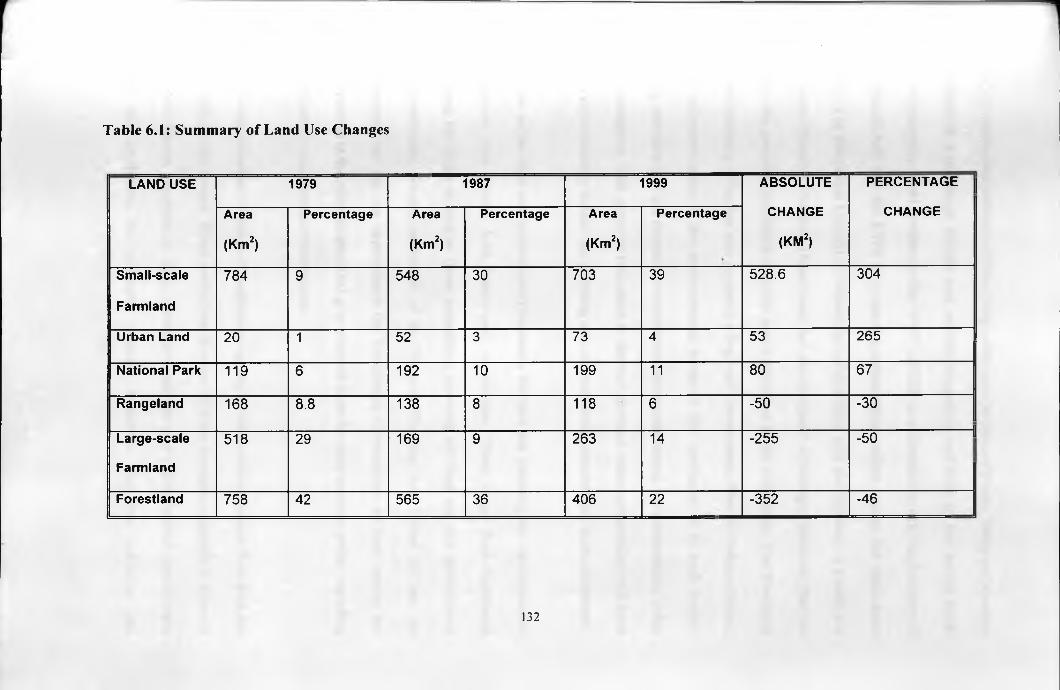
Table 6.1: Summary of Land Use Changes
LAND USE 1979 1987 1999 ABSOLUTE PERCENTAGE
Area
(Km2)
Percentage Area
(Km2)
Percentage Area
(Km2)
Percentage CHANGE
(KM2)
CHANGE
Small-scale
Farmland
784 9 548 30 703 39 528.6 304
Urban Land 20 1 52 3 73 4 53 265
National Park 119 6 192 10 199 11 80 67
Rangeland 168 8.8 138 8 118 6 -50 -30
Large-scale
Farmland
518 29 169 9 263 14 -255 -50
Forestland 758 42 565 36 406 22 -352 -46
132

There are various conservation efforts being undertaken in the catchment. These are however
undertaken in a piecemeal fashion and without integration and ends up not having much
positive outcomes. Most notable are the WWF/LNCDP in collaboration with the Ministry of
agriculture/KARI and the KWS in promoting conservation efforts among the small-scale
farmers. The Municipal Council of Nakuru in collaboration with the Ministry of Lands and
Settlement/ Physical Planning Department has also prepared a Strategic Structure Plan for
Nakuru, the greatest contributor of point source pollution in the catchment. The Provincial
Physical planning office has also prepared a Regional Development Plan for Nakuru district,
which addresses some of the environmental issues in the catchment. It is such already
existing activities that has promoted conservation awareness among the communities living
in the catchment. This gives an indication to the way forward where partnerships will have
to be a major strategy in land use planning and environmental conservation in the catchment.
A review of the legal and institutional framework for land use planning and environmental
management also reveals both hopes and weaknesses. These range from legislation
governing the rights in land to those prescribing planning and land use and development
control measures. Recent enactment of the Physical Planning Act, Forest bill and the
Environment Act and the appointment the Presidential Commission on land matters are
developments at the national level that give renewed hope for more positive policy regarding
land use and environmental conservation.
There is also revealed a wealth of institutions operating within the catchment from both the
public and private sectors. These institutions however lack the necessary capacity in terms of
funds and human resources to fully undertake land use and environmental conservation
studies and implement the necessary remedial measures. The data collection and133
management systems of these institutions are also rudimentary with hardly any updating of
their records. This not only makes it difficult for collaboration in research but also makes
information acquisition to the public very difficult.
6.1 Towards Sustainable Land Use in the Lake Nakuru Catchment
From the analysis, and guided by the research objectives and questions, the study makes
recommendations on the way forward for better land use and environmental management in
the Lake Nakuru Catchment. The recommendations touch on the various interventions that
need to be made in order to arrest further deterioration of the environment. These range from
community sensitization and partnership formation to enhancement and more strict
enforcement of legislation concerned with land resources and their utilization.
6.1.1 Changes in Predominance of Land Use
The trends in land use within the catchment since 1973 to the present reveals that the area
has seen quite some dynamism in terms of land use. It is evident that land use has changed
over the years from predominantly forest and grassland area to large-scale farmlands and
currently to small-scale farmlands as the main user of land. The small-scale farmlands have
also given in to urban land use, making it reasonable to conclude that urban land is the
ultimate land use within the catchment. The observation leading to this is not only the fast
expansion of Nakuru town but also the mushrooming of many smaller and medium centres.
Land use planning and environmental conservation measures within the catchment will then
have to take this into consideration. Immediate measures are required to deal with the
negative implications of the predominance of small-scale farmlands and their ultimate
134
conversion to urban land. The measures in this case will range from direct land use control to
incentives for sustainable land use.
6.1.2 Provision of Alternative Economic Opportunities
Most of the small scale farmers in the catchment were found to be peasants, relying on the
little produce from their farms for subsistence and many having no alternative sources of
income. Most of them have low or no formal education at all. For such farmers who on
average have four children, the worry is that if their children do not get better education and
other forms of economic empowerment, they will end up having to rely upon the farms as
well for subsistence. The solution then lies in provision of off-farm employment
opportunities for the youth.
For the Youth to be involved in off-farm employment, education is of prime importance.
Fortunately for the younger generation, they are better educated than their parents, 77
percent of those below the age of 25 having at least completed primary education, 43 percent
secondary education and 18 percent with post secondary education. It was generally found
out that those with post secondary education tended to move out of the rural areas and seek
employment in urban areas. Most secondary and primary school leavers however lack
vocational training, which could enable them to be self-employed or compete effectively for
employment. There is then a need to focus on promotion o f vocational training in the area.
This will involve the establishment o f youth polytechnics within the rural areas. Currently,
such institutions only exist in the urban centres thereby putting the youth from the remote
parts of the catchment at a disadvantage.
135

The Ministry of Vocational Training ought to collaborate with the church and other
community based organisations in establishing and maintaining such institutions. There is
also need for assistance of youth and women groups to undertake non-farm income
generation activities. Such measures are bound to reduce the level of reliance on the
diminishing farm sizes hence stem land subdivision among children o f the current
landowners. Retention of current farm sizes will not only avoid deterioration of impacts to
the environment but also prevent further reduction in the current level o f farm productivity.
6.1.2 Land Use Control Measures
The right and duty o f the state to control and regulate use o f private land arises out of the
negative externalities resulting from the use of private land. Whereas legal stipulations
provide for detailed land use control measures in urban areas where leases are given with
certain user conditions, the same is not quite true of rural land. Most rural land is held under
freehold tenure and the authorities have very little powers to control their use and
development other than in cases of formal subdivision, sale or lease. There is evidence that
much informal conveyancing has taken place where both the buyer and the seller just
exchange land without going through the cumbersome, and expensive bureaucracy of formal
conveyancing. This informality in land sales has made it very hard for any concerned
authorities to keep track of development in land use and changes in farm holding sizes.
For freehold land that is quickly gaining an urban character, there is need to develop some
land use and development control measures. Such measures will include the conversion to
leasehold whenever subdivision approval is applied for, the control of the proportions of
land being used for specific purposes and even prohibition of certain land uses perceived as
being environmentally harmful in certain parts of the catchment. Cultivation in certain parts136

of the catchment without terraces could be not just be outlawed but also strictly enforced by
a joint effort of the Ministries of agriculture and Environmental conservation. Operation of
shops and other commercial activities in non-designated shopping centres could also be
discouraged by the County Council.
The issue of rural land use control is a contentious one and may be beyond the scope of this
study. The issue may even not be adequately addressed at a local level such as the Lake
Nakuru catchment. It ought to be part o f a national land policy, whose formulation would
necessitate a review of the current land and property laws. The recently appointed
presidential commission on land is an excellent forum to discuss the issue. The fact however
remains that rural land cannot continue being under the little land use control as it currently
enjoys. The fact that non-point sources of pollution have been identified as being a higher
contributor of pollution and also that the rural land of today is tomorrow’s urban land is a
pointer to the necessity for controlling rural land use.
6.1.4 Conservation Training
Even as measures are undertaken to reduce dependency on farm income, it is true that the
small-scale farmlands will continue being a major land use within the catchment. Emphasis
should then be placed on farmer education on the need for environmentally friendly land use.
Although the farmers who have been in the area for same time seem to have appreciated the
need for soil conservation, those who are currently settling in the area will take some time to
reach the same level of appreciation. The harmful environmental impacts of agro-chemicals
are not yet fully appreciated by farmers. Where organic fertilisers and pest control methods
are used, this is simply as a cost cutting measure and rarely because of environmental
considerations. The need for afforestation and re-afforestation is recognised by most large137

and small scale farmers who have been in the area for some time. This is evident in the Miti
Mingi area where through afforestation, part o f a rangeland is being reclaimed to arable land.
To most current settlers, the tree cover may however appear too much and inexhaustible.
Emphasis needs to be given to sensitising the new settlers on the environmental fragility of
the catchment and the need for conservation efforts. Older settlers will also have to be
encouraged to continue with conservation efforts as well as being taught new methods.
Organic farming could for example be promoted so as to reduce chemical pollution of water
resources. Agro-forestry as a way of increasing tree cover amidst decreasing land sizes will
also need to be promoted. Research on tree species that can coexist with crops and that have
a high utility to the farmers, for example as animal feeds, source of wood and also adding
soil fertility, ought to be facilitated. The issue of tree nurseries needs to be addressed. Apart
from the Miti Mingi project, there are no other major tree nurseries within the catchment.
The forest department is required to replant all areas cleared of forest but currently, there
seems to be no interest in this direction. Emphasis should however be on establishment of
private and community based tree nurseries as a way of promoting agro-forestry and
plantation forestry within private farms.
6.1.5 Urban Planning Measures
The transformation o f the catchment to a highly urbanised area is quite eminent. Nakuru is
already a major urban centre with a high residential population and a substantial industrial
base. Several satellite towns have also developed including Njoro, Naishi and Mau Narok
and these are bound to expand rapidly. Regional urban planning at the catchment level then
needs to be undertaken so as to achieve guided urban growth.
138
While the growth o f Nakuru has been planned under the LA21 programme, the smaller
towns have not been given much attention and are bound to cause major land use and
environmental problems in the future unless their growth is guided through planning. It was
for instance found that Njoro town with a current estimated population of 44,000 has over
grown the capacity of the initial septic tanks that were meant to serve it. Much of the
sewerage including sludge from the slaughterhouse finds its way into Njoro River while still
raw. The urban centres if well planned will be centres o f employment, attracting many
youths from the surrounding rural areas. Here, they will engage in non-farm economic
activities thus reducing pressure on the diminishing land parcels in the rural areas. This will
have positive implications on and use and environmental impacts in the rural areas.
6.1.6 Lake Nakuru Catchment Authority
Most of the conservation problems arising in the Lake Nakuru Catchment are as a result of
the absence of a single body to control land use and development within the area. The
multiplicity of agencies with only a part of the catchment to manage or only one aspect of
environmental management to oversee has led to lack of integration in conservation efforts
of government departments and private agencies. The mandate of the KWS is restricted to
the National Park while that of the Municipal Council of Nakuru extends only to the
Municipal boundary. The county council is responsible for development in not only the other
parts of the catchment but also the rest of the district. None of these bodies is able to
effectively address conservation issues within the catchment as a region.
For effective conservation of the catchment, there is need to establish an authority to
undertake land use planning, control and co-ordination of conservation activities within the
catchment. Such a body will have representatives from the Municipal council, the County139

Council, KWS, the DDC, NGOs and community interest groups. Such an authority would be
best suited to address issues affecting the catchment in a wholistic manner. It could also have
the capacity to undertake land use studies and planning at the catchment level and also
monitor the changes in land use in a quick and efficient manner so as to provide timely
remedial measures. Although member agencies could be required to contribute to its
funding, the authority would have the necessary partnerships with NGOs and CBOs to raise
funds from donors and international conservation agencies. It would also liase with local and
international research institutions in undertaking land use and environmental studies. The
authority will then be extending the LA21 principles to the entire catchment.
6.1.7 Community Involvement in Forest Management
The reduction in forest cover within the catchment is one o f the most remarkable changes
and the environmental effects of this can not be overemphasised. There is then need for more
effort to reduce further deforestation. One method that has for long been used in the
management of forests in Kenya is that of Non-Resident Cultivators (NRC) or shamba
system. In this system, local people are allowed to cultivate forest areas where seedlings
have just been planted. The cultivators on their part are to cater for the seedlings by weeding
and ensuring their survival.
For the period that it has been in use, NRC has had many advantages. It not only ensured a
high seedling survival rate but also contributed significantly to the food requirements of the
local communities. In the year 1962-63 for example, NRC contributed about 10 percent of
small holder maize production in the country. The system was however banned in 1987
because o f cases of invasion of forests by squatters who deliberately destroyed seedlings
140

through cutting of roots and debarking in order to reduce competition with crops. Seedling
survival rates had then dropped to an average of 60-70 percentage from an average of 90
percent in 1984 (World Bank, 1988). The system was then reintroduced in 1994 but with
new conditions. A cultivator is currently required to sign a contract with the Forest
Department binding him to ensure a seedling survival of over 90 percent. No building of
structures is to be undertaken in the forest area and the cultivation period must end in three
years. The cultivator is also required to care for the seedlings in non-crop seasons.
Re-introduction of NRC has had some positive impacts on the development of forests in
Kenya. Between 1994 and 1996, backlogs in forest plantation reduced dramatically. In
1994 they stood at 176,578 hectare of replanting, 133,886 o f thinning, 22,750 pruning and
2175 of copice reduction. By 1996, the backlogs had reduced to 11,000, 85,000, 5000 and
1000 hectares respectively. Due to labour shortage only 20 percent of the clear felled areas
were replanted between 1987 and 1994. Lack of weeding also saw seedling survival fall to
below 30 percent (Kenya Forest Development Project, 1996).
Despite its acknowledged effectiveness, NRC has not been widely used in the Lake Nakuru
Catchment. The politically volatile nature of settlements in the area may be one reason. The
conditional titles initially intended to be given to new settlers had this sort o f licensing in
mind, but one that never worked. Because of lack of legal basis of the intended conditional
titles, the settlers have ended up with freehold titles and this has had a dramatic reduction in
forestland. Management of the remaining forest areas will then need to incorporate local
people through the NRC system. This way, it will offer them an opportunity to own fertile
land and ensure food security to the community. Since they will have a sense of ownership
to the forestland. Local people will jealously guard against the encroachment of forests by
141

external agents. The remaining forest areas are however in the high erosion hazard areas.
Any cultivation in such areas will need to be supervised by both agricultural and forestry
officers to avoid excessive exposure of the soil to erosion.
6.1.9 Environmental Information System For Lake Nakuru Catchment
The institutions operating within the study area were seen to be custodians of various forms
of data regarding land use, its change and effects on the environment. Information systems
per se were however seen not be emphasised among all the institutions. This is in spite of the
recognised importance of accurate, relevant and timely information by all these agencies.
There is need for the operations o f the institutions to change so as reflect the current need for
land use information. Modernisation and streamlining of the council departments so as to
make their systems more available and accessible to the public and other collaborating
agencies is of particular importance.
There is also need for the undertaking o f regular land use surveys. This will not only assist in
controlling the changes in land use but also in identifying where variations or adjustments in
the council zoning plan are necessary. Urban land use is more intricate as compared to rural
land use. This calls for more refined land use survey methods in the urban areas. Large and
medium scale aerial photographs (1:10,000-1:25,000), combined with ground data collection
will provide much o f the needed information in establishing a land use monitoring system or
observatory. Such a system will require use of digital techniques in management of the
massive data sets that will be generated. The council will in addition be able to efficiently
manage information on land transactions and use of buildings within the Municipality.
142
Some aspects of the relevant urban land use database may be developed and maintained by
the council on an incremental basis. The undertaking o f certain scientific and technical
studies will however require the participation of other public and even private institutions
that are well endowed with both human and material resources for these specialised tasks.
The Survey of Kenya for instance maintains for the municipality a Topo-Cadastral map at a
scale of 1:10,000, showing both property boundaries and the topographical features. The
map ought to be extended to cover the extended municipality area. This could also involve
enlargement of the mapping scale to 1:5,000 or 1:2,500 so as to be able to map the
decreasing plot sizes. This would then be the base map used in establishment o f a Municipal
Geographic Information System. Each council department would be responsible for
establishment of information layers relevant for its functions and relating this to the general
functioning of the council. Because of the digital format o f this data, updating, and sharing
of the information both within the council and by other agencies including the general public
will be quite efficient.
The Lake Nakuru Catchment Authority will be the institution in focus when designing an
information system for the entire catchment. At this scale, satellite remote sensing coupled
with small and medium scale aerial photographs will help in monitoring land use and other
environmental changes. The authority will then be the central body under whose custody all
the other institutions will be keeping their data. It will also be a conduit for data and
information exchange. The municipal councils database will then be a subset of the
catchment environmental information system. To be able to implement and maintain such an
information system, the authority will need to have the latest state of technology in land use
143

and environmental information systems. Proper funding and training of the personnel will
also have to be provided.
6.2 Conclusion
The study set out to investigate the land use changes that have taken place in the Lake
Nakuru Catchment between 1973 and 1999 together with the environmental, implications of
these changes. The Catchment emerges as an area that has experienced major changes in
land use over the past 26 years with indications that the changes are bound to continue,
some at a higher rate than before. These changes have seen small-scale farmlands take the
biggest proportion of catchment, a position initially held by forestland. Urban land, although
currently having the least area has been seen to have the highest rate of growth. The
indication is then that the area is quickly attaining an urban character.
It is important to note that some of the areas classified here as small-scale farmlands are
actually areas of mixed use with quite substantial proportions of commercial and residential
use. Most of the rural land can then be perceived as land in transition from forest and large-
scale farmlands to urban land. The areas along Nakuru-Nyahururu road, Njoro-Mau-Narok
road and also the Rhonda- Mwariki area could as well have been classified as mixed use
areas to show the transition. Since the changes from forestland and large-scale farmlands to
small-scale farmlands is as a result of population pressure, it is right to regard such a change
as a move towards urban development. The study then arrives at the conclusion that urban
land is the ultimate land use in the catchment.
144
The lands most vulnerable to urban conversion are the large-scale farmlands and gazetted
forest areas. The large-scale farmlands are being subdivided by their owners who are either
speculating or selling because o f reduced profitability of large-scale farming and also the
high prices and demand for land in the area. Forestland has also variously been degazetted to
allow settlement of people. Most of these activities are taking place on the more accessible
parts of the Catchment especially along the major transport routes.
The trends in land use as revealed by the study have negative implications to environmental
sustainability. Intensification of use is causing major environmental threats including higher
rates of soil erosion and pollution to water resources. The land use trend in the area then
poses a major threat to its environmental sustainability and calls for immediate measures to
ensure harmony between development and the environment.
Within this quickly urbanising region, there are impressive conservation efforts and
awareness. The Menengai crater and the Lake Nakuru National Park have remained under
very little interference from human settlement, with the area of the park increasing by 50
percent. Public and private collaboration has been witnessed in planning and conservation
efforts within the catchment. The hope lies on the continued and improved collaboration
between all actors concerned with environment and development. This will be in the field of
land use studies and environmental planning within the catchment.
Specific areas to be addressed are continued farmer education in soil conservation and
afforestation, monitoring and seeking alternatives to the use of agro-chemicals. Organic
agriculture should be promoted among the small scale farmers as a way of reduction of
chemical pollution The planning of the small and upcoming urban centres is also of
145

particular importance given that they are to be the biggest point sources of pollution in the
near future. These efforts require a collaborative effort of the relevant agencies and also a
continuos review of the legal framework controlling land use, land rights and environmental
conservation.
The study has also revealed the importance and applicability of rapid land use change
information and its management. Satellite Remote Sensing has been identified as an
effective method of acquiring such information for expansive areas such as the Lake Nakuru
catchment. Since satellite data is being acquired continuously by space borne sensors, it is
possible to be undertaking historic land use analysis and relating these to the current land use
conditions. This will help in projection o f the future land use and its implications thus the
appropriate environmental intervention measures.
Once land use information has been acquired, GIS has been identified as an appropriate
management and analysis tool. It will not only help information management but will also
increase the utility o f data by combining information layers to give new information. The
lack o f use o f these modem tools in the environmental management within Lake Nakuru
catchment therefore points to the need for sensitisation among managers o f the relevant
institutions on the crucial roles of GIS and Remote sensing in land use planning and
environmental management. This study is a step towards that end.
146

REFERENCES
A. Berstein, J. D. (1993): Land Use Considerations in Urban Environment Management;
Urban Management Programme Series No. 12, The World Bank, Washington D.C.
2. Bracken, I. and C. Webster (1990): Information Technology in Geography and
Planning, Including Principles of GIS; Routledge, London.
3. Burrough, P. A. (1986); Principles o f Geographic Information Systems for Land
Resources Assessment, Clarendon Press, Oxford.
4. Chapin, S. F. and E.J. Kaiser.(1979): Urban Land Use Planning. University of Illinois
Press, Urbana
4 5. Davidson, D.A. (1980): Soil and Land Use Planning, Longman, New York.
6. Dionnet. M. C. U 9851 Recent Evolution o f Land Use System In the Abruzzi Region Italy,
Land Use policy, October 1985, 327-335.
7. Edington, J. M: (1977): Ecology and Environmental Planning; Chapman and Hall,
London
y8. Edmonds, R. L. and William. J.K(1998): Land Use in Macau: Changes between 1972
and 1994, Land Use Policy , Vol. 15 No. 4, 1998, 223-236
J9. Erickson, D. L. (1995): Rural Land Use and Land Cover change: Implications for Local
Planning in River Raisin Watershed, Land Use Policy Vol 12(3). 223-236.
V10. FAO (1994): Guidelines for Land Use Planning, FAO Development Series 1. FAO,
Rome
11. Kenya, Republic of, (1994): The National Environmental Action Plan (NEAP);
Government Printer, Nairobi.
147

12. Kohler, T., (1987): Land Use In Transition^ Aspects and problems of small scale
farming in a new Environment, The example of Laikipia district, Kenya; Geographica
Bemesia, Switzerland.
13. Leitman, J: Rapid Urban Environmental Assessment, Urban Management and the
environment Series No. 14, The World Bank , Washington D.C.
14. Lovejoy, D. (Ed.) (1973): Land Use and Landscape Planning. Barnes and Noble, New
York.
15. Marsh, W. M. (1991): Landscape Planning: Environmental Applications, John Wiley,
New York.
/1 6 . Mather, A. S. (1986): Land Use. Longman Scientific and Technical, London
17. McAllister, D. M. (ed.) (1973): Environment: A New Focus for Land Use Planning ,
National Science Foundation, Washington , D.C.
18. Meyer, W. B and B. L. Turner II (1994): Changes in Land Use and Land Cover: A
Global Perspective: UCAR, New York.
19. Meyer, W.B, and B. L. Turner (1992): Human Population Growth and Global Land
Use Change: Annual Review of Ecology and Systematics, Vol. 23, 39-61
20. Misrati, A. A. M: (1983): Land Conversion to Urban Use .Its Impact and Chatracter in
Libya, Ekistics 300 May/June, 1983, pp 183-194
21. Newson ,M. (1992: Land, Water and Development: Sustainable Management of River
Basin Systems, Routledge, London
22. Pathan, S.K. et al. (1993): Urban Growth Trend analysis using GIS Techniques :-A
Case Study of Bombay Metropolitan Region : International Journal of Remote sensing
Vol. No. 17,3169-3179.
148
23. Paulsson, B.:(1992): Urban A pplications o f Satellite Rem ote Sensing and G IS Analysis.
Urban Management programme, Series No. 9. The World Bank, Washington, D.C.
24. Roberts, R. D and T. M. Roberts (1984): Planning and Ecology. Chapman and Hall,
London.
25. Roberts, T. H. (1988): Land Use P lann ing . in Catannese, A. J. and J. C. Synder (eds.):
Urban Planning. McGraw Hill, New York.
26. Ryszkowski, L. A. Kedziora and J. Olejnik (1991): Potential Effects Of Climate On
Land Use Change on The Water Balance Structure in Poland. In Brouwer et al,. (1991)
Land Use Changes in Europe Processes of Change , Environmental Transformations
And Future Patterns Kluwer Academic Publishers London
27. Star, J. and John E. (1987): Geographical Information Systems: An Introduction;
Prentice Hall, Englewood Cliffs
28. Steiner, F. (1991): Landscape P lanning-. A M ethod A pplied to growth M anagem ent
Exam ple: Environmental Management Vol 15(4), 519-529.
29. Steiner, F. (1991): The Living Landscape: An Ecological Approach to Landscape
Planning; McGraw-Hill Inc, New York.
30. Thampy, R. J. (1995): An Overview o f Human Occupation, Changing Land Use and
Environmental Impacts In the Lake Nakuru Catchment Basin; in KWS, (1995)
Workshop Proceedings; No. 1 KWS, Nairobi.
31. UNCHS (Habitat) (1985): Guidelines for the Planning o f Rural Settlement and
Infrastructure: Using Automated GIS in Network Planning, UNCHS, Nairobi.
32. UNCHS (Habitat), (T994.b): Sustainable Human Settlements Development:
Implementing Agenda 21. UNCHS, Nairobi.
149

33. Van Lier, H. N. C.F. Jaarsma, C. R. Jurgens and A. J. De Buck (eds), (1994):
Sustainable Land Use Planning . ELSEVIER. Amsterdam
34. Poleman, I. T. and D.K. Freebairn (1973): Food. Population and Employm ent: The
Impact o f the G reen Revolution . Praeger Publishers, London.
35. Tolba, M.K. (1992): Saving our Planet: Challenges and H opes. Chapman and Hall,
London.
150

APPENDIX I: Household Questionnaire
Declaration : The Information given in this questionnaire will not be used for any other
Purpose, besides academic.
Questionnaire Number_________ Date o f Interview
Name of interviewee
1 Name of local area
2 Household Composition
Name Age Sex Marital
Status
Education
Level
Occup
ation
work
Place
Monthly
Income
3 Relationship of respondent to household head_________________
4 Type of House: 1) Temporary 2) Semi-permanent 3)Permanent
5 For how long have you Lived in this area_____________________
6 Where did you live before then____________________________
How long have you lived in this particular plot_________________151
7

W hat is the size of the plot/farm ________________ Acres
H ow many households live in this plot/farm
W hat is the main land use in this plot/farm_____________
W hat other land uses are undertaken on the plot/farm
i) .
ii) .
iii) .
iv) .
12 What is the annual income from the land
Land Use Annual Income
13 What is the dominant land use in the neighbouring farms________________
14 What other land uses are undertaken in those Farms
i) .
ii) .
iii) .
iv) .
15 Nature of land Tenure a) Freehold,__b). Leasehold___ c) Others, Specify
16 Does the land has a title deed 1 )Yes_______ 2) No______
152
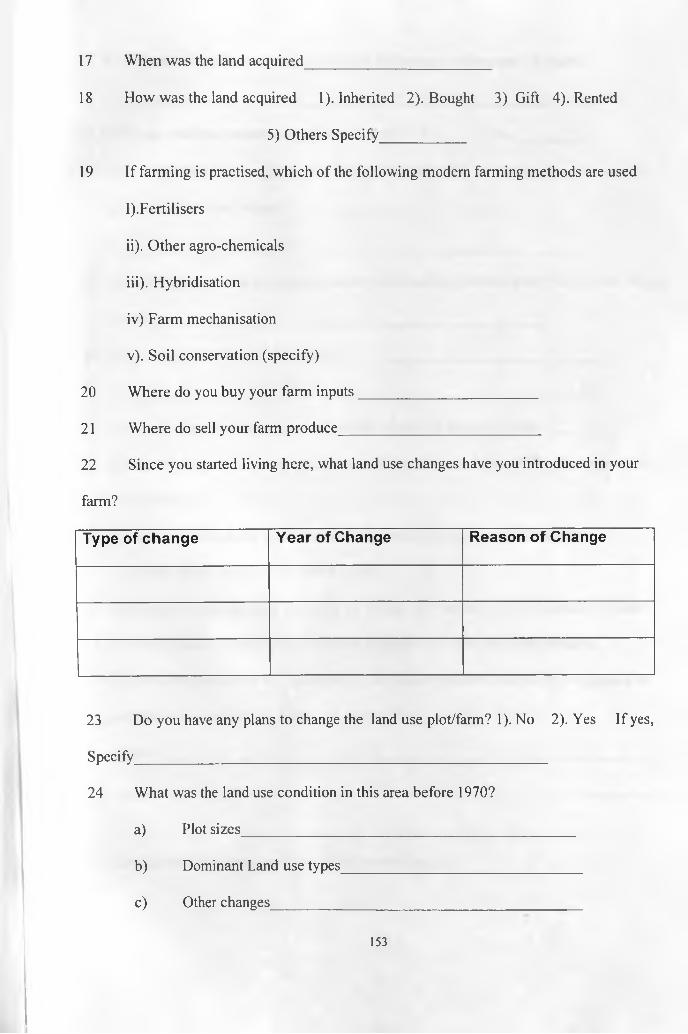
17 When was the land acquired_________________________
18 How was the land acquired 1). Inherited 2). Bought 3) Gift 4). Rented
5) Others Specify___________
19 If farming is practised, which of the following modern farming methods are used
I).Fertilisers
ii) . Other agro-chemicals
iii) . Hybridisation
iv) Farm mechanisation
v) . Soil conservation (specify)
20 Where do you buy your farm inputs________________________
21 Where do sell your farm produce___________________________
22 Since you started living here, what land use changes have you introduced in your
farm?
Type of change Year of Change Reason of Change
23 Do you have any plans to change the land use plot/farm? 1). No 2). Yes If yes,
Specify________________________________________________________
24 What was the land use condition in this area before 1970?
a) Plot sizes_____________________________________________
b) Dominant Land use types_________________________________
c) Other changes__________________________________________
153

25 What land use condition would you expect in this area in the next 15 years?
26 Is this the land use conditions you would prefer? Yes____2). No_________
27 If No, what land use condition would you prefer and what do you think can be done in
order to achieve your vision?____________________________________
28 Are there any conflicts or competition between land uses in this area? Yes 2) No If yes,
specify______________________________________________________
29 How can these conflicts be resolved?_____________________________________
30 What is the present market price of an acre of land in this area? Kshs.________
31 What is your source of water? a). Piped b).borehole c). River d) Roof catchment e).
Others (Specify)
32 What is your household’s major source of power a) Fuel wood 2)Electricity
3) Petroleum products 4) Others specify
33 What type of road accesses your plot a.) tarmac b) Murram c)Earth/Graded d). Others
34 What is the road condition and transport services your land and Nakuru town.
35 Are there any hardships or constraints in the use of your land caused by its physical or
natural characteristics like slope, soil types a). Yes b). No If yes
explain____________________________________________________________________
36 How far away is your farm from the following facilities
154

Facility Distance (Km) Time taken to reach
there
Water point (Permanent)
Tarmac Road
Power line
Primary school
Secondary school
Youth Polytechnic
37 Do you experience land subsidence problems in this area? 1) Yes 2) No. If Yes
Explain, N ature______________________________________________, When
___________How far was it from your plot/farm?_________Km
38 What other environmental problems do you experience in this area (Soil Erosion, water
pollution)___________
39 How can this problems be solved?_____________________________
40 Are there any environmental community based organisations (CBOs) in your area? 1).
Yes.........2). No . What do the groups engage in?
Name of CBO Activities
41 Are you a Member of any such group? Yes 2) No
155

42 What other organisations undertake environmental conservation activities in your area
Organisation Activities
43 In your opinion, what is land and what role does play in the life of the individual?
Thank You
156
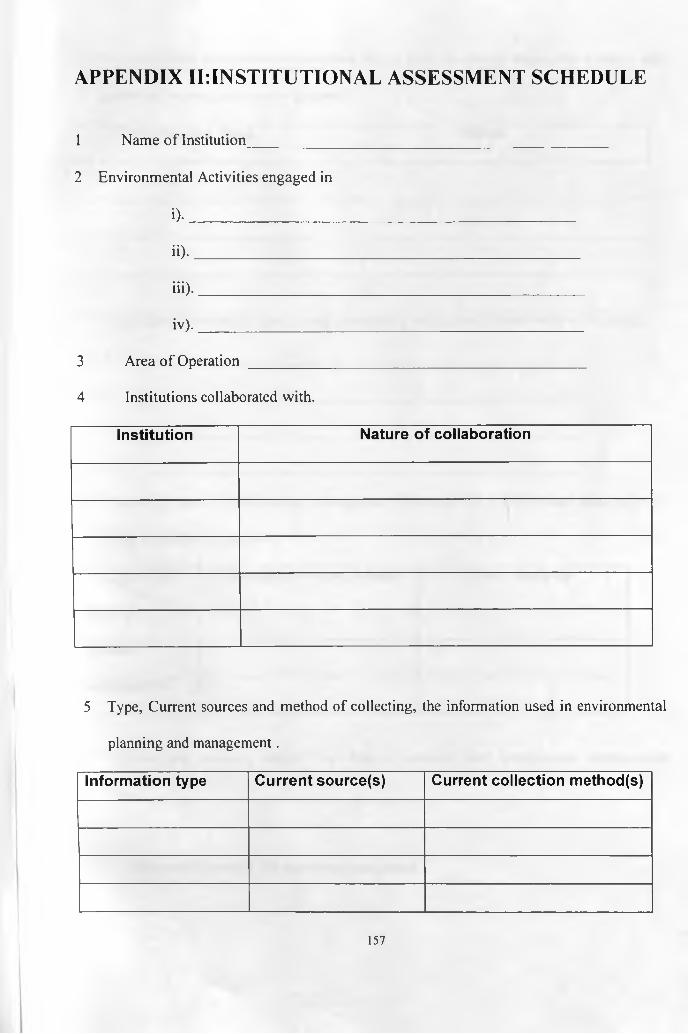
APPENDIX II-.INSTITUTIONAL ASSESSMENT SCHEDULE
1 Name o f Institution____________
2 Environmental Activities engaged in
i) ._____________
ii) . _______________
iii) .____________
iv ) . _______________
3 Area o f Operation ___________
4 Institutions collaborated with.
Institution Nature of collaboration
5 Type, Current sources and method of collecting, the information used in environmental
planning and management.
Information type Current source(s) Current collection method(s)
157
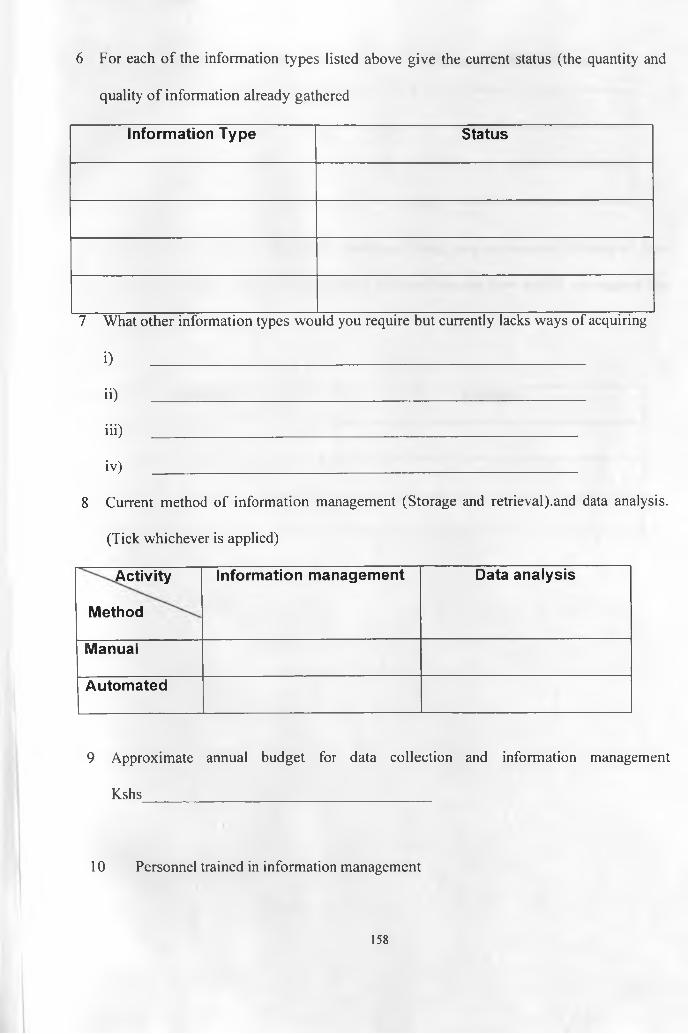
6 For each o f the information types listed above give the current status (the quantity and
quality o f information already gathered
Information Type Status
7 What other information types would you require but currently lacks ways of acquiring
i) ___________________________________________________________
ii) ___________________________________________________________
iii) __________________________________________________________
iv) __________________________________________________________
8 Current method of information management (Storage and retrieval).and data analysis.
(Tick whichever is applied)
Activity
Method
Information m anagem ent Data analysis
Manual
Automated
9 Approximate annual budget for data collection and information management
Kshs _______
10 Personnel trained in information management
158

Type of Training Number of Staff trained
11 What are the three most significant problems facing your institutions in terms of land
use information acquisition, management and analysis, and how would you suggest that
the same be solved,
Problem Solution
159