LAND TENURE CENTER - ed
94
A
Transcript of LAND TENURE CENTER - ed

A

DOCVNENT REWIEED 032 987 RC 003 744
George W.; Co !las. Manuel_-
The Minifundia Economy and Society of the Guatemalan Highland Indian.Spons Agency-Wisconsin Univ.. Madison. Land Tenure Center.Report No-RP-30Pub Date Jul 68Note 92p.MRS Price MF -$0.50 HC-54.70Descriptors -*Agricultural Production, *American Indians, Economically Disadvantaged, Family (Sociological Unit).Farmers. *Illiteracy. interviews. *Latin American Culture. Living Standards. Migration Patterns. RuralEconomics. *Rural Environment, Rural Population, Social Cha.-acteristics, Social Environment. Tables (Data)
Identifiers =Guatemala. MayansThis study of the Minifundia society in the Guatemalan Highlands was intended to
describe and analyze the social and economic complex within which these MayanIndians lived and carried on their system of traditional agriculture. A random sampleof 348 families were interviewed and results were reported. According to the surveythe average household contained 5 members who provided the main labor force forthe family farm. Almost 95 percent of the farmers claimed to own all or part of theirland. Income from farming was low, and farmers supplemented their earnings eitherby engaging in various business ventures or by obtaining agricultural or industrialemployment. The survey indicated that 62 percent of the farmers interviewed wereilliterate. and 16 percent of those who were !iterate had never received any formaleducation. Only 26 percent of the children older than 7 years were attending school.while 54 percent had never enrolled in school and 29 percent had dropped out afterenrollment. Tables are used extensively to present data resulting from the study. (IL)

it 1 . 7 7* -_-_,
A Research Paper
LAND TENURE CENTERUniversity of Wisconsin, Madison, Wisconsin 53706

DEMINEIT Of NUM fratra t IffifltfOffICE Of EDUCIDON
nos DOCUINIT Iili tEEl EPt0DDD EXAM LS ECDYED ETON TEl
PENSON 02 0/61111/ATION OMIT* IL PONTS Of VIEW 0! OHMS
STIED DO NOT NECESSLINY 0E3E11 OffICRI OFFICE Of BLM
POSITION 02 POLICY.
All views, interpretations, recommendations, and conclusionsexpressed in this paper are those of the authors, and notnecessarily those of the Land Tenure Center or of the sup-porting or cooperating institutions.
July 1968 RP No. 30
THE-MIN:FUNDIA ECONOMY AND SOCIETY
OF THE GUATEMALAN HIGHLAND INDIAN
By
George W. Hill and Manuel Gollas*
'George W.-Hill, a- rural socidbgisto is currently workingwithLouis Berger, Inc. in Brazil. Manuel Golias is a graduatestudent in agricultural 'economics at the Universety of1Wisconsin.

TABLE OF CONTENTS
Page
Preface . i
Chapter I. introduction 1
Chapter II. The Population Resource 8
Chapter 111. The Land Base 23
Chapter IV. The Highlands Milpa ........ 32
Chapter V. Manpower and Technology i 42
Chapter VI. Sources of Income 56
Chapter VII. Standards of Living 62
Chapter VIII.Education 70
Chapter IX. Summary and Conclusions 80
LIST OF TABLES
1. Rural and Urban Population Change, Guatemala,
1950 to 1964 9
2. Total Population of Sample Families, By Five-YearAge Groups and Sex 10
3. Families Classified According to Number of Persons
in Family 15
4. Families With Household Heads Over 40 Years of Age,Classified According to ?!umber of Children Who Had Died... 16
5. Civil Status of Heads of Families, Classified By Age 17
6. Present Place of Residence of Heads of Families, By
Department 19
7. Measure of Mobility of Children and Siblings of Head
of Family 22
8. Land Concentration in Guatemala, By Size of Holdings,
1950 24
Page
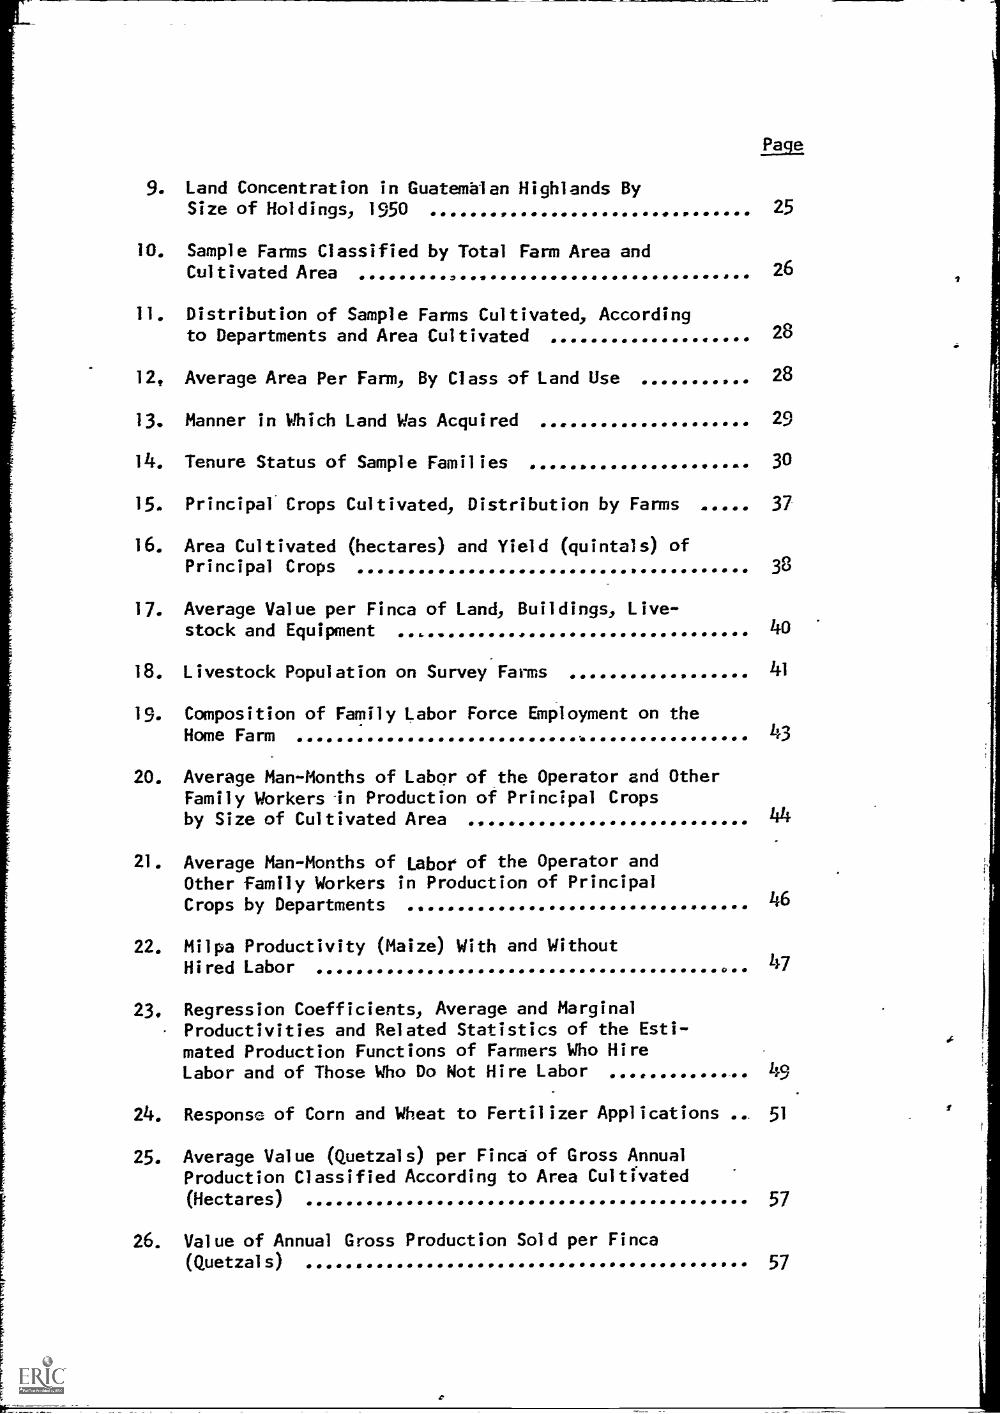
9. Land Concentration in Guatemalan Highlands BySize of Holdings, 1950 . 25
10. Sample Farms Classified by Total Farm Area andCultivated Area
11. Distribution of Sample Farms Cultivated, Accordingto Departments and Area Cultivated
12, Average Area Per Farm, By Class of Land Use
26
28
28
13. Manner in Which Land Was Acquired 29
14. Tenure Status of Sample Families 30
15. Principal' Crops Cultivated, Distribution by Farms 37
16. Area Cultivated (hectares) and Yield (quintals) ofPrincipal Crops 38
17. Average Value per Finca of Land, Buildings, Live-stock and Equipment 40
18. Livestock Population on Survey Farms 41
19. Composition of Family Labor Force Employment on theHome Farm
20. Average Man-Months of Labor of the Operator and OtherFamily Workers in Production of Principal Cropsby Size of Cultivated Area
21. Average Man-Months of Labor of the Operator andOther family Workers in Production of Principal
Crops by Departments
22. Milpa Productivity (Maize) With and WithoutHired Labor
43
44
46
47
23, Regression Coefficients, Average and MarginalProductivities and Related Statistics of the Esti-mated Production Functions of Farmers Who HireLabor and of Those Who Do Not Hire Labor 49
24. Response of Corn and Wheat to Fertilizer Applications .. 51
25. Average Value (Quetzals) per Finca of Gross AnnualProduction Classified According to Area Cultivated
(Hectares) 57
26. Value of Annual Gross Production Sold per Finca
(Quetzals) 57

Page
27. Annual Family Incomes of Migratory and Hon-MigratoryFarmers in their Home Communities 58
28. Comparison of Total Incomes for Migrants and Hon-
Migrants 61
29. Average Annual Outlay per Family on Principal Ex-
penditure Categories
30. Some Selected Items of Family Levels of Living
63
65-66
31. Some Measures of Communications Facilities andCommunity and Church Responsibilities of Family Heads ... 67
32. Languages Spoken Outside of Home by Heads of Families
and Wives, by Tribal Origins 71
33. Education Level of Male Heads of Households and Spouses.. 72
34. Educational Attainment of Parents Compared WithOffspring, 17 Years and Over
35. Educational Status of Children by Sex, Age and
Highest Grade Attained
36. Percentage of Literates in Various Categories of the
Sample Population.
74
76
77
37. Farms Classified by Area Cultivated and Value of Output.. 82
38. Selected Characteristics of Four Sub-Groups of the
Sample Population 83
Figure 1. Distribution of Sample Population According to
Age and Sex 11
Figure 2. Infant Deaths per Live Births 14
Preface
This paper is a preliminary report of a research project
undertaken in 1964-65 by the University of San Carlos and the
University of Wisconsin. This study of the minifundia economy
and society in the Guatemalan Highlands was the first coopera-
tive research project undertaken by the two universities. The
analysis is still in progress and is being completed by Manuel
Gollas, now a Rockefeller scholar at the University of Wiscon-
sin. In the meantime a second cooperative study by Lester
Schmid on the Role of Migratory Labor in the Economic Devel-
opment of Guatemala (Ph.D. thesis, Wisconsin, 1967) has been
completed.* It was both an outgrowth of and in part based
upon this first study. It may be useful for the understanding
of the present report to indicate the orientation of this
initial cooperative research- program.
A study of the Highland minifundia was first suggested
by Mr. Rafael Piedra-Santa (now Dean of the School of Econo-
mics), then Director of the Instituto de lnvestigaciones
Econ6micas y Sociales and leader of this project for the
University of San Carlos.
The inquiry took shape around a few general objectives.
a) The basic purpose was to establish a somewhat detailed
picture of the nature of the system of economy and rural
society which is currently operative in a number of highland
areas. This area is a region of high population density. In
terms of contemporary discussions of economic development,
the Highland region has some of the characteristics of an
area with "unlimited supplies of labor," to advert to the
famous phrase of Arthur Lewis. b) It was hoped that this
initial study would provide a better understanding of the
real income and the real reservation wage of the "surplus"
population in the Highland area. The anticipation was that
from such a base, it would be possible to better understand
c) the nature and significance of the movement of migratory
farm labor between the Highland regions and the large scale
commercial agriculture, as studied by Schmid, and to develop
an understanding of the movement to the areas of new coloni-
zation, especially on the Atlantic slope. in this latter
respect it was anticipated that a better understanding of
the traditional "subsistence" economies of the Highland
Indians would be helpful in planning colonization projects in
the lower eastern regions; presumably, the farming abilities
of prospective colonists are shaped by the farming practices
of their home communities.
*LTC Research Paper No. 22.

41K,,d11.110, INalfIrm.,
K.H.P.
it
The design and conduct of a research project, as herereported, are achieved only by the participation and colla-boration of many different persons. The major part of the
funds for this project was provided by a research contactbetween the University of Wisconsin, administered throughthe.Land Tenure Center, and the Agency for International
Development. The planning of this project was discussed at"length with representatives of the MAID mission to Guate-mala, especially with Mr. Leonard Rhodes, then agricultural:economist for the mission, as well as with leaders in sev-eral of the ministries and agencies of the Government of
Guatemala. However, ultimate and sole responsibility for the
research effort was assumed by the cooperating universities --in keeping with the long traditions of intellectual indepen-dence of both.
The final revisions and editing of the manuscript owe'much to.Russell Cheetham, a research assistant in the Depart-,Tent of Agricultural Economics at the University of Wisconsin,
and to Dr. Lester Schmid of the Universities of San Carlos and
Wisconsin. Professor Ronald Clark, now with the Land TenureCenter in Bolivia, shared in the early planning and executionof this study. Professor K. H. Parsons has provided guidancein the general design and conduct of the research, in-theediting of this manuscript and in the coordination of this"project with closely related research undertaken in four
Central American countries.
I. INTRODUCTION
The general purpose of this study is to describe andanalyze the social and economic nature of the minifundiasystem of the Guatemalan Highlands. The study is intendedto contribute to the understanding of the social and economiccomplex within which the Mayan Indian carries on his systemof traditional agriculture, so as to provide a basis fordevelopment policies appropriate to the alleviation of thepoverty which al? previous studies of the area have reported.
The Highlands, as here defined, include all the lands thatlie at altitudes ranging from one thousand to three thousandmeters in the seven departments of Chimaltenango, Quiche,Totonicap4n, Huehuetenango, Quezaltenango, San Marcos, andSoloti. The Highlands is the most densely populated regionof Guatemala with a population density of 178.1 inhabitartsper square mile, compared to 109.2 for the entire country(or 155.3 for all Guatemala if the sparsely settled depart-ment of Petdn is excluded). The Highland region accounts for36 percent of the population of Guatemala.
In general, the Highlands has a temperate climate,which in the highest zones becomes relatively cold betweenDecember and February. Like the remainder of the country,it has two distinct seasons of about equal length. The wetseason (winter) lasts from May until November; the dryseason (summer) occurs during the remainder of the year.Winter is usually broken by one and sometimes two brief dryrespites, colloquially known as veranillo, or little summer,but more correctly, canicula, which coincides with the "dogdays" of mid-August in the temperate zone.
There is little level land in the mountainous terrain somost of the crops are planted on the slopes, some at extremelyprecipitous angles. The fields are usually divided into strips,separated by narrow margins marking individual holdings. Muchof this land has been under cultivation for many centuries.
From a cultural viewpoint, the homogeneity of the regionis readily observable. All of the inhabitants are descen-dants of the Mayan Indians. Most people still converse inone of the many Mayan dialects, and the women, particularly,dress in traditional costumes. With few exceptions thesepeople follow planting and cultivating practices handed downthrough many generations.
In an economic and social sense, the region is equallyhomogeneous. Poverty is the general rule. The few centavosthat the Indian makes when he is able to find work away from
home are needed to buy more corn. Corn is the mainstay of
his diet, but his farm is not large enough to provide for
his sustenance. The rate of illiteracy is overwhelming:two-thirds of the heads of families in our study can neither
read nor write. The population of the area has little voice
or influence in the government of the country, which in true
Latin tradition "is a country governed by the written law."'
(Guatemala es un pars de derecho cscrito.) However, the
sheer numbers of the Indians have made it impossible for their
situation to go unnoticed through the years. There has been
legislaticin in their behalf, albeit mostly ineffective, so much
so that Sifontes exclaimed, "Never before has there been so
much legislation and so little accomplishment."2 (Nunca antes
se habra legislado tanto y cumplido menos.) Reviewing the leg-
islation that has been enacted and the programs that have been
devised to improve the lot of the Highland Indians, we found
both uniformly inadequate and haphazardly administered.
Design of the Survey
Analysis of the Guatemalan Agricultural Census of 1950
indicated that 21.3 percent of the nation's farms were less
than 0.7 hectares (micro-fincas), 67.1 percent were between
0.7 and 7.0 hectares (sub-familiares), 9.5 percent were be-
tween 7.0 and 45 hectares (fincasfamiliares), and the re-
maining 2.1 percent were over 45 hectares (fincas muiti-
familiares).3 There was a higher concentration of small
farms in the western highlands, the area of our study:
24.8 percent were micro-fincas, 64.8 percent were fincas
sub-familiares, 9.1 percent were fincas fpmiliares, and only
1.3 percent were fincas multi-familiares.'4 Since our interest
1 Nathan L. Whetten, Guatemala the land and the,t9201
(New Haven, Yale University ress, 1 i / P. 1
2Julio Hernandez Sifontes, Realidad Jurraica del Ind; eve
Guatemalteco (Guatemala City, Ministerio de Educaci6n, 1965)
p. 284
3 See Sergio Maturana, ,Las Relaciones Entre. la Tenencia
de is Tierra y la Eficiencia del Uso de los Recursos Agrrcolas
en Guatemala (Guatemala City, Central American Integration
Scheme, 1962).
4 Calculations made on the basis of the Agricultural Cen-
sus of 1950.

was in traditional agriculture, we wished to choose our samplefrom farms of family size or smaller.
We selected a series of municipios5in the Highlands whichwe believed would yield a representative sample of traditionalagriculture as practiced in the region. Three municipios werechosen from the Department of Chimaltenango and two in theDepartment of Solola, but all of these within the Cakchiquellinguistic area. Three were chosen in the first departmentbecause it has a more heterogeneous system of agriculture thanthe others in our study due to greater variation in soil, al-titude, and other factors. Two municipios were selected inthe Department of Quiche, two in Totonicapan, one in Quezal-tenango and one in Sololg -- all representing the Quichelinguistic area. In order to include the linguistic area ofMaim, we selected two municipios in the Department of Huehue-tenango and two in San Marcos. The Cakchiquel, Quiche andMam are the three major linguistic groups of the Maya who in-habit the Highlands. To complete the sample, three additionalmunicipios were selected from Huehuetenango to representminor linguistic groups: two for the Kanjobal and one forthe Aguacateca.
The municlpio is the political unit next in size to thedepartment (state) and, for rural Guatemalans, it is the mostsignificant of their political units. The only other thatsometimes may rival the importance of the municipio is thealdea (community or neighborhood). The municipio is a group-
ing of aldeas. It is in the cabecera (capital) of the muni-cipio that the history of the average Indianr's life begins andends. Here his birth is registered, if it is registered atall, and here his death certificate is filed. Most of his
life is spent in the municipio, but now and again dependingon distance and size of the market located there, he willtravel to his departmental capital and more rarely beyond.
The aldea has special significance in the life of theIndian male because it is commonly the aspiration of an am-bitious man to hold the position of alcalde auxiliar (assis-tant to the mayor) some time in his later years. The alcalde
5 As the term is employed in Guatemala, municipio woulderroneously be translated "municipality." To be sure, it doesmean that, but as it is here used, the closest translation intoEnglish would be "county" because it is a dispersed geographicarea, sometimes of considerable size, having its own governingcapital or cabecera. The term aldea likewise can be trans-lated as "village," but in Guatemala rural usage it is moreakin to "township" or "neighborhood" because it too cancover an extensive area of dispersed homesteads and have novillage characteristics whatever.
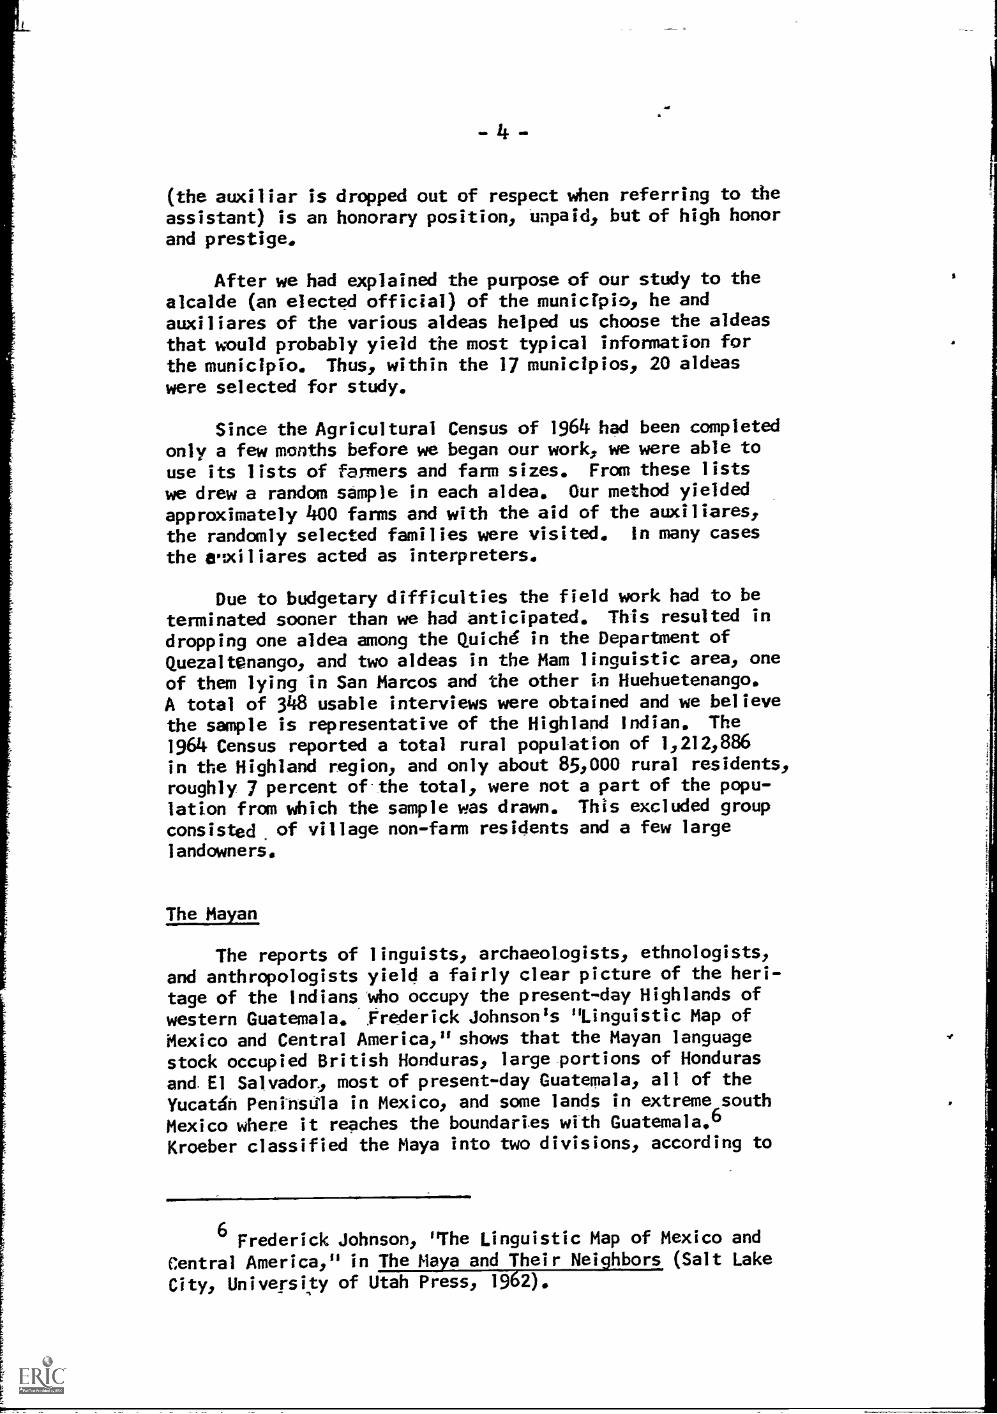
(the auxiliar is dropped out of respect when referring to theassistant) is an honorary position, unpaid, but of high honor
and prestige.
After we had explained the purpose of our study to thealcalde (an elected official) of the municTpio, he andauxiliares of the various aldeas helped us choose the aldeasthat would probably yield the most typical information for
the municlpio. Thus, within the 17 municlpios, 20 aldeas
were selected for study.
Since the Agricultural Census of 1964 had been completedonly a few months before we began our work, we were able to
use its lists of farmers and farm sizes. From these lists
we drew a random sample in each aldea. Our method yielded
approximately 400 farms and with the aid of the auxiliares,the randomly selected families were visited. In many cases
the imiliares acted as interpreters.
Due to budgetary difficulties the field work had to be
terminated sooner than we had anticipated. This resulted indropping one aldea among the Quich6 in the Department of
Quezalt@nango, and two aldeas in the Mam linguistic area, oneof them lying in San Marcos and the other im Huehuetenango.A total of 348 usable interviews were obtained and we believe
the sample is representative of the Highland Indian. The1964 Census reported a total rural population of 1,212,886in the Highland region, and only about 85,000 rural residents,roughly 7 percent of the total, were not a part of the popu-lation from which the sample was drawn. This excluded group
consisted of village non-farm residents and a few large
landowners.
The Mayan
The reports of linguists, archaeologists, ethnologists,and anthropologists yield a fairly clear picture of the heri-
tage of the Indians who occupy the present-day Highlands of
western Guatemala. Frederick Johnson's "Linguistic Map of
Mexico and Central America," shows that the Mayan language
stock occupied British Honduras, large portions of Honduras
and. El Salvador, most of present-day Guatemala, all of the
Yucatan Peninsula in Mexico, and some lands in extreme south
Mexico where it reaches the boundaries with Guatemala.6
Kroeber classified the Maya into two divisions, according to
6 Frederick Johnson, "The Linguistic Map of Mexico and
Central America," in The Maya and Their Neighbors (Salt Lake
City, University of Utah Press, 1962).
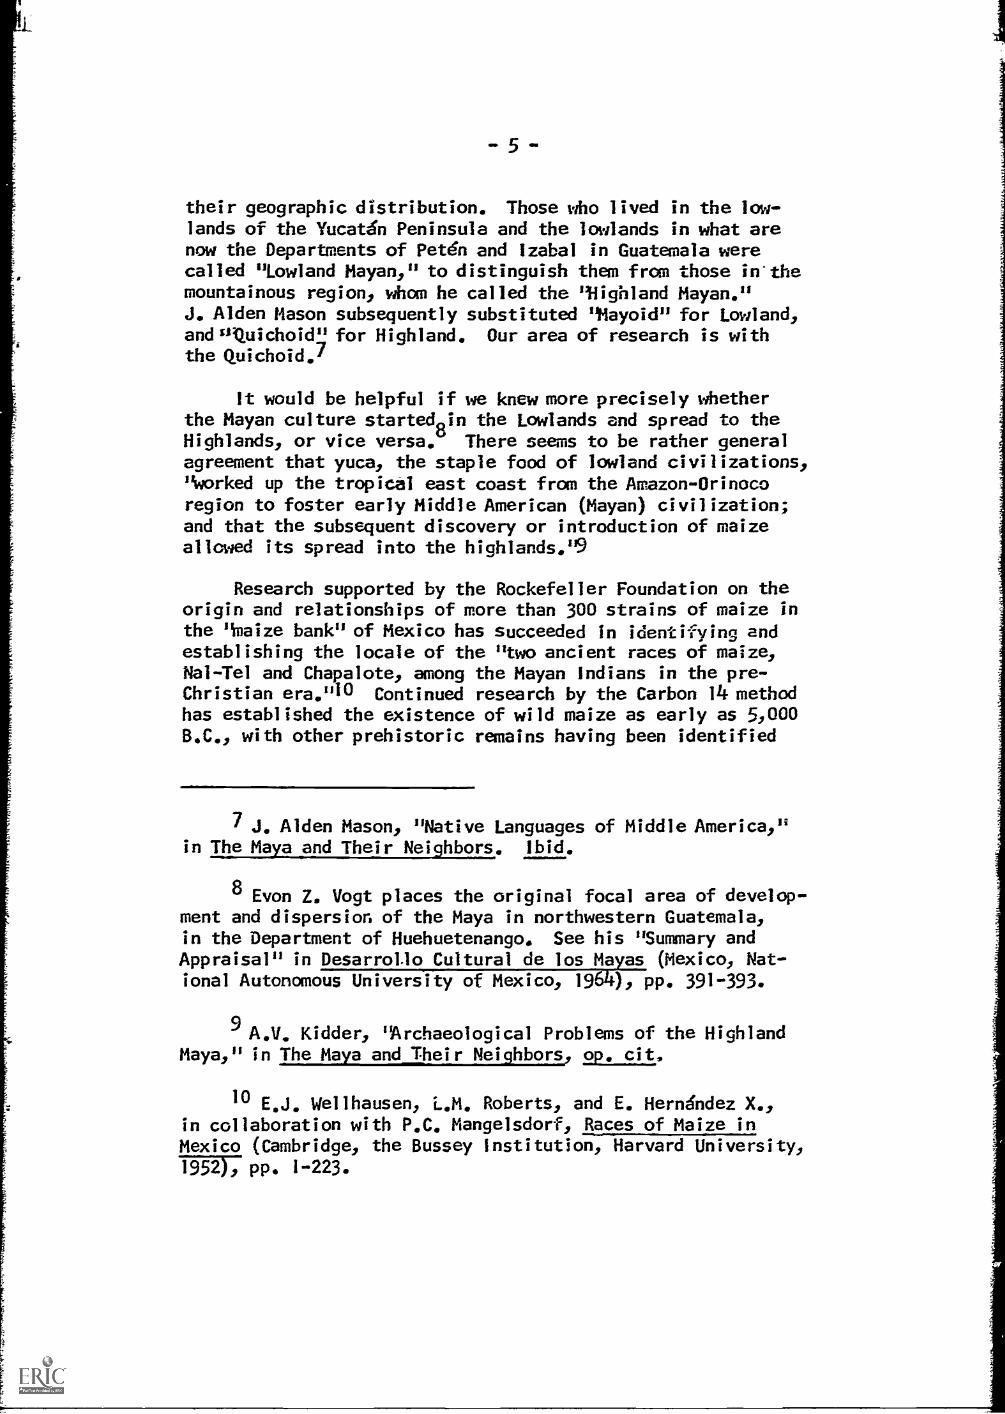
their geographic distribution. Those who lived in the low-lands of the Yucatan Peninsula and the lowlands in what arenow the Departments of Pet& and Izabal in Guatemala werecalled "Lowland Mayan," to distinguish them from those in'themountainous region, whom he called the "Highland Mayan."J. Alden Mason subsequently substituted 9Mayoid" for Lowland,andliquichoid" for Highland. Our area of research is withthe Quichoid.7
It would be helpful if we knew more precisely whetherthe Mayan culture startedoin the Lowlands and spread to theHighlands, or vice versa. There seems to be rather generalagreement that yuca, the staple food of lowland civilizations,"worked up the tropical east coast from the Amazon-Orinocoregion to foster early Middle American (Mayan) civilization;and that the subsequent discovery or introduction of maizeallowed its spread into the highlands."9
Research supported by the Rockefeller Foundation on theorigin and relationships of more than 300 strains of maize inthe ',maize bank" of Mexico has succeeded In identifying andestablishing the locale of the "two ancient races of maize,Nal-Tel and Chapalote, among the Mayan Indians in the pre-Christian era."10 Continued research by the Carbon 14 methodhas established the existence of wild maize as early as 5,000B.C., with other prehistoric remains having been identified
7 J. Alden Mason, "Native Languages of Middle America,"in The Maya and Their Neighbors. Ibid.
8 Evon Z. Vogt places the original focal area of develop-ment and dispersion of the Maya in northwestern Guatemala,in the Department of Huehuetenango. See his "Summary andAppraisal" in Desarrollo Cultural de los Mayas (Mexico, Nat-ional Autonomous University of Mexico, 1964), pp. 391-393.
9 A.V. Kidder, 'Archaeological Problems of the HighlandMaya," in The Maya and Their Neighbors, op. cit.
10 E.J. Wellhausen, L.M. Roberts, and E. Hernandez X.,in collaboration with P.C. Mangelsdorf, Races of Maize inMexico (Cambridge, the Bussey Institution, Harvard University,
pp. 1-223.

in New Mexicoltnd Peru as early as 3650 B.C., and 2200 B.C.
respectively.
We know that as early as the sixth century B.C. the Maya
had developed a precise calendar for recording the passage of
time. This period marks the zenith- of_what Is called the
Old Empire period, and the New Empire grew and flourished
until shortly before the coming of the Europeans in the six-
teenth century A.D. The architectural ruins of these two
periods and the recasting of Mayan pre-history and recent cul-
ture indicate that the early Maya had established a material
culture that in many respects equalled that of the Old World
of that time. But why the Maya succumbed so easily to the
Aztec shortly before the arrival of the Spaniard, and why the
Aztec in turn was so easily subdued by the handful of conquis-
tadores under Hernan Cortes, is still a mystery.
The late Venezuelan writer, Mariano PicOn Salas, offered
one theory when he said:
"For continuc:a progress, however, these aboriginal
civilizations had many technological handicaps.
They lacked the horse and other domestic animals
to lighten their labor; the wheel was unknown,
and they had no real knowledge of metallurgy. If
the religious and plastic arts of the Maya, Tol-
tec, and Inca could compete with Oriental crea-
tions, in other respects they still had not pro-
gressed much beyond Neolithic man."12
Oliver La Farge sets forth five stages in the post-con-
quest sequence of Mayan development, and we are especially
attracted by his fifth, which he labels the Second Recent
Indian Stage, dating from about 1880 to the present.13 His
11E. J. Wellhausen, "Opportunities for Crop Improvement
in the Latin American Tropics," Cornell Latin American Year
(Ithaca, Cornell University, Dec. 1966). Also, Colin Clark
and M. R. flaswell, The Economics of Subsistence A riculture
(London, MacMillan & Co., 19 y pp. 25-26. Also Paul C.
Mangelsdorf, R. MacNeish and W. C. Galinat, "Domestication of
Corn," Science, Vol. 1k3, p. 359.
1 .2Martano Pic& Salas, A Cultural History of Spanish
America from Con uest to Inde endence. English translation
by Irving A. Leonard Berkeley, University of California
Press, 1963), P. 6.
1 .301tver La Farge, "Mayan Ethnology: The Sequence of
Cultures," in The Maya and Their Neighbors, ap_tsit.

7irst Recent Indian Stage took up the preceeding eighty years,most of which included the period following Guatemala's inde-pendence from Spain, a period In which the new Republic wasbusy getting itself established and the Indian was left aloneto develop a rather stable culture.
Ironically, the First Stage came to a close when Guate-
mala was beginning to achieve national development after threecenturies of colonialism. Having begun coffee production inthe mid-nineteenth century, it was exporting over 500,000quintals by 1870 when the government issued decrees thatstopped the progress made by the Highland Indian during thecultural renaissance of La Farge's First Recent Indianperiod. One of these was the system of mendamientos, underwhich Highlanders were forcefully recruited and impressedas harvest hands in the coffee fields. The other was the
decree issued by President Rufino Barrios making illegal thecommunal operation of lands. The latter decree, by denyingthe Indian his traditional system, was intended to make forcedrecruitment of idled Indians under the mandamiento more ef-fective. Even though this latter decree was superceded towardthe close of the nineteenth century by a more "humane" habilf-taciOn decree, the application of its anti-vagrancy provisionseffectively continued the unwilling servitude of the Indianand provided a pool of cheap labor for the landholding class.As a result, the Highlander suffered almost a century of de-privation. La Farge arrived in Western Guatemala long afterthe habilitaciOn system had replaced the mandamiento, and givesus the following description of his Second Recent St:e.
"The conflict which we see going on today is not asimple one of Indian versus Spanish, or Indian ver-sus Spanish plus Machine culture, but is in fact aclash between the Machine culture on the one hand,allied to Spanish American culture having its own in-dividuality and itself in conflict with the Machine,and what I am calling the Recent Indian Stage, awell stabilized, complex culture containing certainelements which, although deriving from its prede-cessors, are not to be found among them. This
conflict is the most recent of a series of stabili-zations and clashes, a sequence without which presentproblems cannot be understood."14
14 Ibid., p. 183.

I1. THE POPULATION RESOURCE
Population Size and Composition
According to the 1964 Census, Guatemala continues to beoverwhelmingly a rural country. In 1964) 71 percent of thetotal population was resident in rural areas, indicating onlya slight reduction from the figure of 75 percent in 1950.The total population of the Republic is reported to have in-creased by 53.5 percent in the 14-year intercensal period, atan annual rate of Increase of 3.1 percent per year.] The1964 Census data suggested increases of 33 percent in therural population and 105 percent in the urban population forthe entire country between 1950 and 1964. However, the defi-nition of urban population in the recent census was differentfrom that used in 1950, thus invalidating direct comparisonof the census data. Adjustment of the 1964 data, using the1950 definition of urban residence suggests increases of45.7 percent in the rural population and 77.1 percent Inthe urban population (Table 1).
The population of the Highlands region increased by41.3 percent in the period 1950 -64, at an annual rate of in-crease of 2.5 percent. The Highlands urban population in-creased by 51.9 percent whereas the rural population increasedby 39.5 percent. All but one of the departments in theregion participated in the large urban increase. This oneexception was Totonicapan, where the increase was only 3.3percent.
Table 2 and Figure 1 show the age and sex distributionof our sample population of 348 families. The sample con-tained 1,747 people, of which 53.6 percent were male. Theaverage age of the male heads of households was 42.8 years,while the average age of wives was 41.0 years.
Several factors may have influenced the age distributionand composition of the sample population. The most importantfactor affecting age distribution was the limitation of thestudy to farm operators who had some land of their own whichthey cultivated. Farm laborers, therefore, were not included.
1 An annual rate of increase of 3.1 percent would indi-cate that either the country is among those in the world thatare experiencing the highest rates of population growth orthat much of the reported "increase" is a reflection of a morecomplete census in 1964 than was the case in 1950.
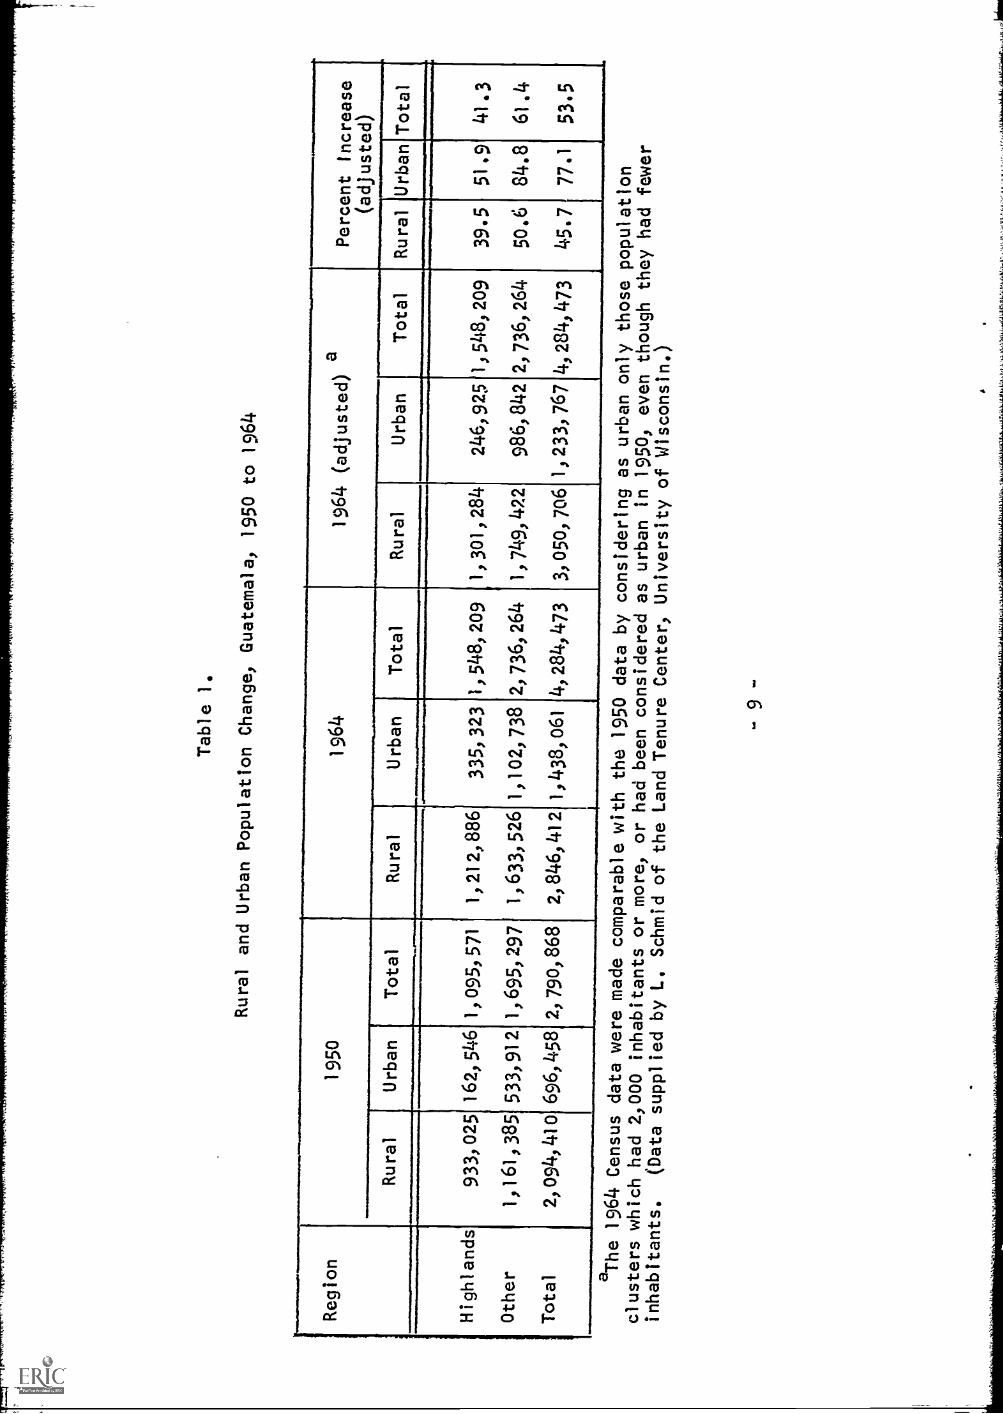
Table 1.
Rural and Urban Population Change,
Guatemala, 1950 to 1964
Region
1950
1964
1964 (adjusted) a
Percent Increase
(adjusted)
Rural
Urban
Total
Rural
Urban
Total
Rural
Urban
Total
Rural
UrbanTotal
Highlands
933,025
162,546
1,095,571
1,212,886
335,323
1,548,209
1, 301,284
246,925
1,548,209
39.5
51.9
41.3
Other
1,161, 385
533, 912
1,
695,
297
1, 6
33, 5
261,
102,
738
2,736,264
1, 7
49, 4
2298
6, 8
422,
736
, 264
50.6
84.8
61 .4
Total
2, 0
94, 4
1069
6, 4
582,
790
, 868
2, 8
46, 4
121,
438
, 061
4, 2
84,4
733,
050
, 706
1, 2
33, 7
674,
284
, 473
45.7
77.1
53.5
aThe 1964
Census data were made comparable
with the 1950 data by considering
as urban only those population
clusters which had 2,000 inhabitants
or more, or had been considered as urban in 1950,
even though they had fewer
inhabitants.
(Data supplied by L.
Schmid of the Land Tenure Center, University
of Wisconsin.)
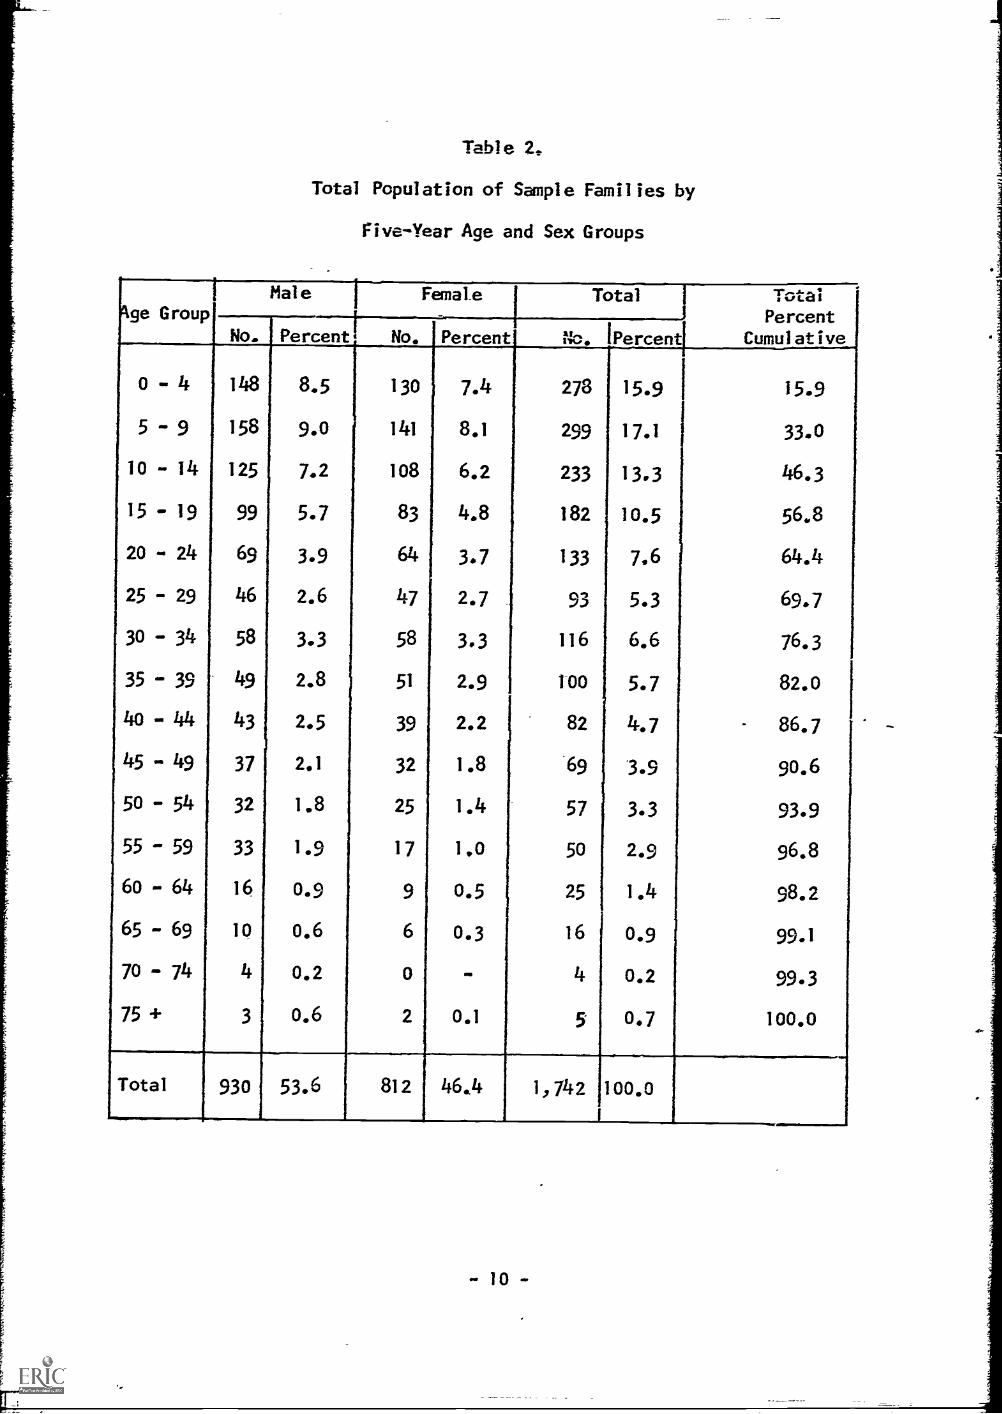
Table 2.
Total Population of Sample Families by
Five-Year Age and Sex Groups
4ge GroupMale Female Total I
1
Total
PercentCumulativeNo. Percent No. Percent No. 'Percent!
148 8.5 130 7.4 278 15.9 1 15.9
5 - 9 158 9.0 141 8.1 299 17.1 33.0
10 - 14 125 7.2 108 6.2 233 13.3 46.3
15 - 19 99 5.7 83 4.8 182 10.5 56.8
20 - 24 69 3.9 64 3.7 133 7,6 64.4
25 - 29 46 2.6 47 2.7 93 5.3 69.7
30 - 34 58 3.3 58 3.3 116 6.6 76.3
35 - 39 49 2.8 51 2.9 100 5.7 82.0
40 - 44 43 2.5 39 2.2 I 82 4.7 - 86.7
45 - 49 37 2.1 32 1.8 69 3.9 90.6
50 - 54 32I
1.8 25 1.4 57 3.3 93.9
55 - 59 33 1.9 17 1.0 50 2.9 96.8
60 - 64 16 0.9 9 0.5 25 1.4 98.2
65 - 69 10 0.6 6 0.3 16 0.9 99.1
70 - 74 4 0.2 0 - 4 0.2 99.3
75 + 3 0.6 2 0.1 5 0.7 100.0
Total 930 53.6 812 46.4 1,742 100.0
I
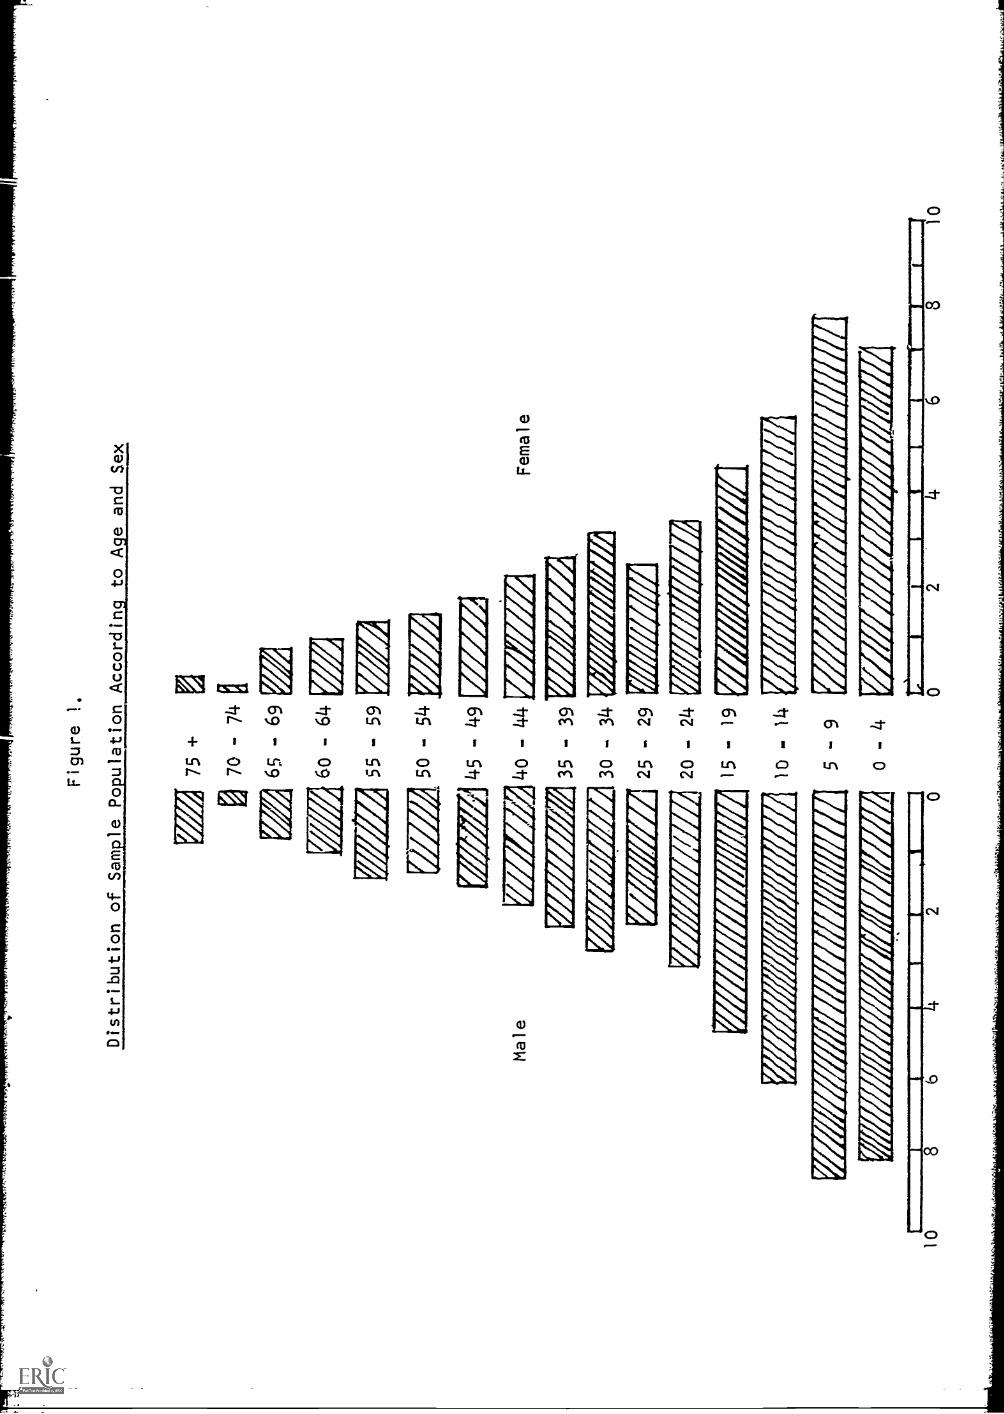
Figure 1.
Distribution of_SEple Population According to Age and Sex
Male
UZ
75E2
70 -
74
v yff]
6o-
61+
55-5
9
=05
054
JW
IErE
Mi 4
5-
=2a
Z40
-44
=22
235
MEE22130
PM2221
25
IME
=21
2=2M
10
82
0
20
15
A
- 39
FZ
EZ
ZM
34M
EM
EM
29E
ZZ
EZ
24=
ZZ
ME
10 -
14
5 -
9
o -
4
Female
ffZ=ZZEZEilif=
102:=)=T:=

- 12 -
This decision eliminated younger families because farm la-borers, who occupy the bottom rung of the agriculturalladder, are younger than operators. Had laborers been in-
cluded, the average age of the male family head would have
been lower. The average age of the wives was 41.0 years,again higher than the average age, of mothers in the total
rural population. From the foregoing it follows that the
number of children under 5 years of age would be smaller in
the sample than their corresponding numbers in the total
rural population, because the mothers in the sample werereaching the upper limits of normal fecundity.
The sex ratio in the sample is heavily biased in
favor of males, with 115.1 males for each 100 females. In
the 1964 census the sex ratio-of the national populationwas 102.7; for the seven departments we have calculated it
to have been 101,7 for the same census year. The sex ratio
in the sample, which favors the male population so sigr.if i-cantly at younger years, almost disappears at the age levelof 20 to 24 years, and actually favors the female from thatage through the age interval 35-39. We attribute this
change to the heavier rate of migration of males than fe-males due to the comparative advantage of males in. the labormarket on the plantations of the Pacific Coastal Plain.That females do migrate, however, is suggested by the sharpnarrowing of the population pyramid, starting at the age in-terval of 15 to 19 years and reaching its greatest point ofcontraction in the 25-29 interval. At the interval 40 to 44
the sex ratio swings back to slightly favor the male and there-after at higher ages the males predominate significantly.
Notwithstanding the factors that have influenced the com-position of the sample, it was still a young population, with46.3 percent of the total being under 15 years of age. This,
however, appears to be in accord with national demographiccharacteristics for the 1964 Census indicating that 47.6 per-cent of the rural population were under 15 years of age.
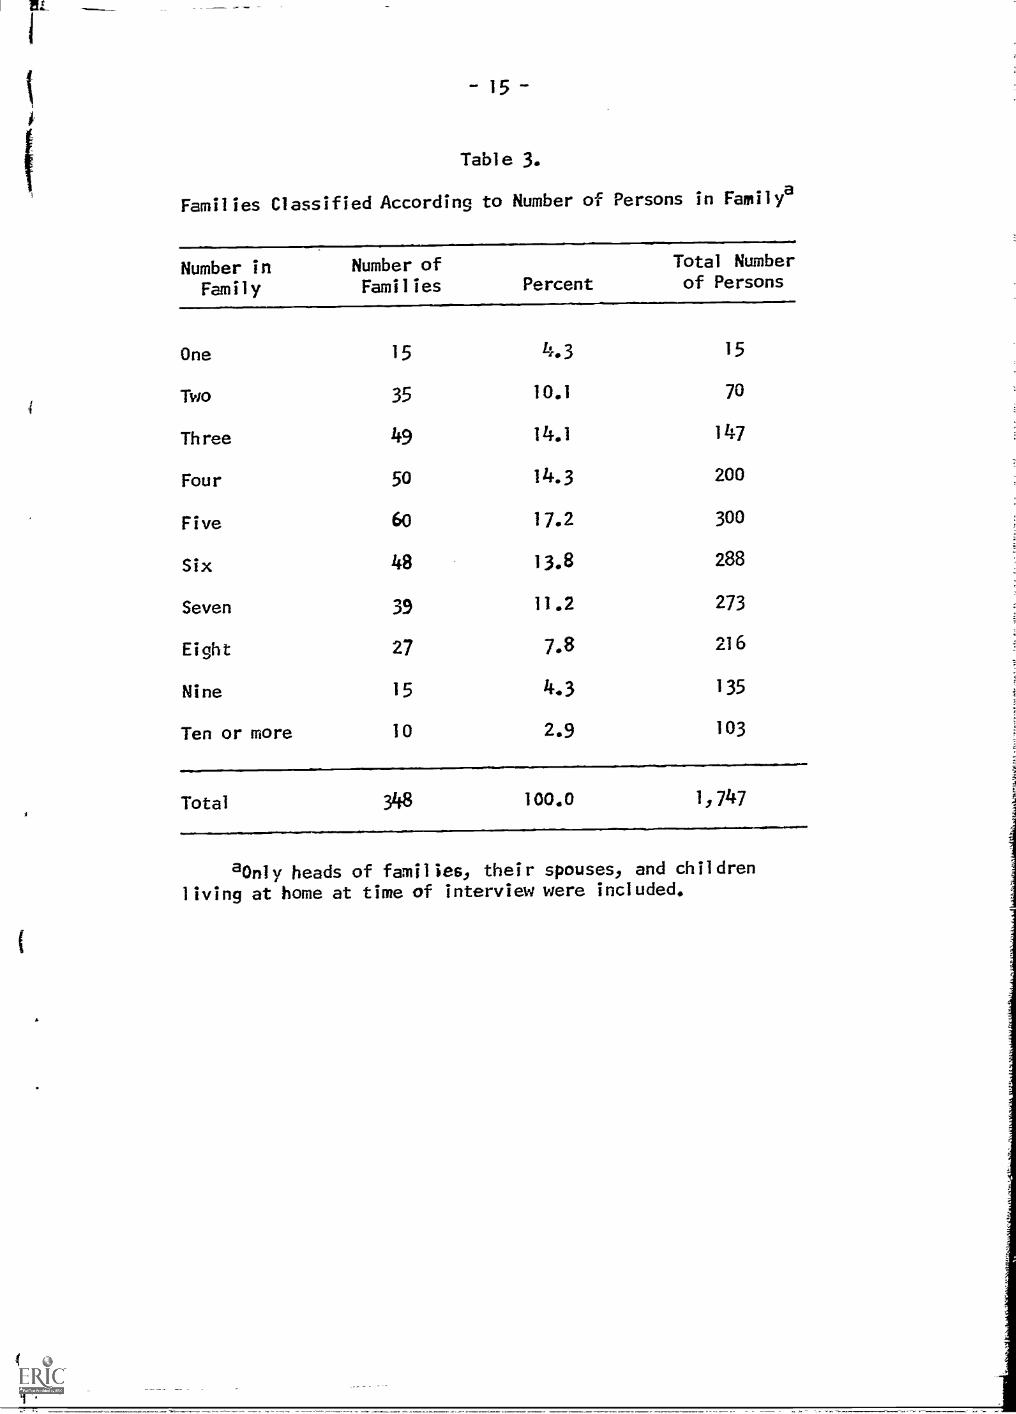
The average family in the sample population consistedof five persons. Although this is smaller than might be ex-pected, considering how much has been said concerning thehigh fertility rates among rural families, the number ofchildren living at home at any given moment must be less thanthe average number of children per family since the sampleis sure to include families whose children have left home aswell as families who will be having more children. The
Housing Census of 1964 also indicated that there was.anaverage of 5 persons per unit in the rural households ofall departments except Pet6n, which reported 6 per unit.

- 13 -
Table 3 shows the distribution of the sample familiesby sizb from which it can be noted that both the median andmean occur in the interval containing five.
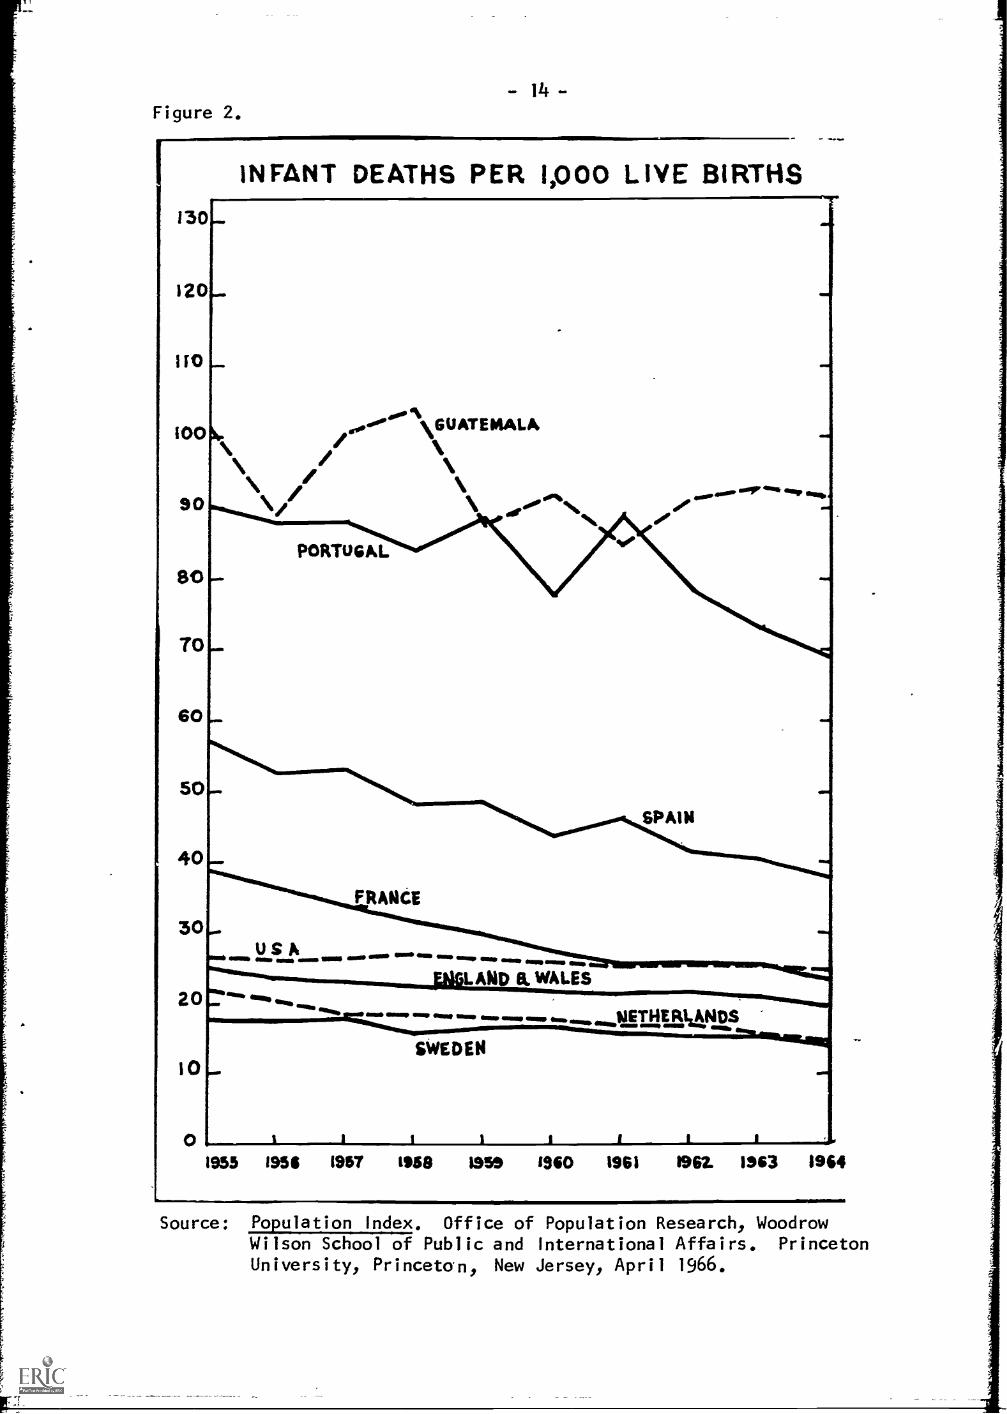
Public statistics for births and deaths were available.only by place of their incidence rather than by place ofresidence. Since all hospitals in the area we studied arein the urban centers of population, we could not gathervital statistics for the rural population of the study areabecause any such attempt would have necessitated informationfrom primary sources, the search for which would have beenprohibitively expensive. Our statements, therefore, arebased upon the available published statistics, and we only 2have these for the country as a whole for the period 1955-64,According to these data, infant mortality has varied from alow of 34.8. to a high of 103.9 per thousand in the ninety-year period, while general mortality has shown a rather con-siste nt tendency to drop, from a high of 21.3 to a low of16.3 per thousand. Birth rates in the same period have beenaround 49 per thousand. Infant mortality in Guatemala is avery serious problem. During 1964 more than three times thenumber of infant deaths per thousand occurred in Guatemalaas copj5ared with the:United-States: <See Figure 2.)
We question whether infant mortality in Guatemala hasyet dropped below a rate of 100 per thousand; thus it isdoubtful that general mortality has reached the average of13.8 per year reported for 1955-64. One can speculate on-thecompleteness of such reports. We observed that when anadult died the event was something to which the entire familysystem reacted. It is reasonable, therefore, to supposethat these deaths of adults were reported quite faithfullyby the auxiliares to their superiors in the. munictpio offices.We did not find the same to be true when very young childrendied. Their deaths are not as significant as those of adultsand undoubtedly many children died in their first year oflife without having the fact recorded.
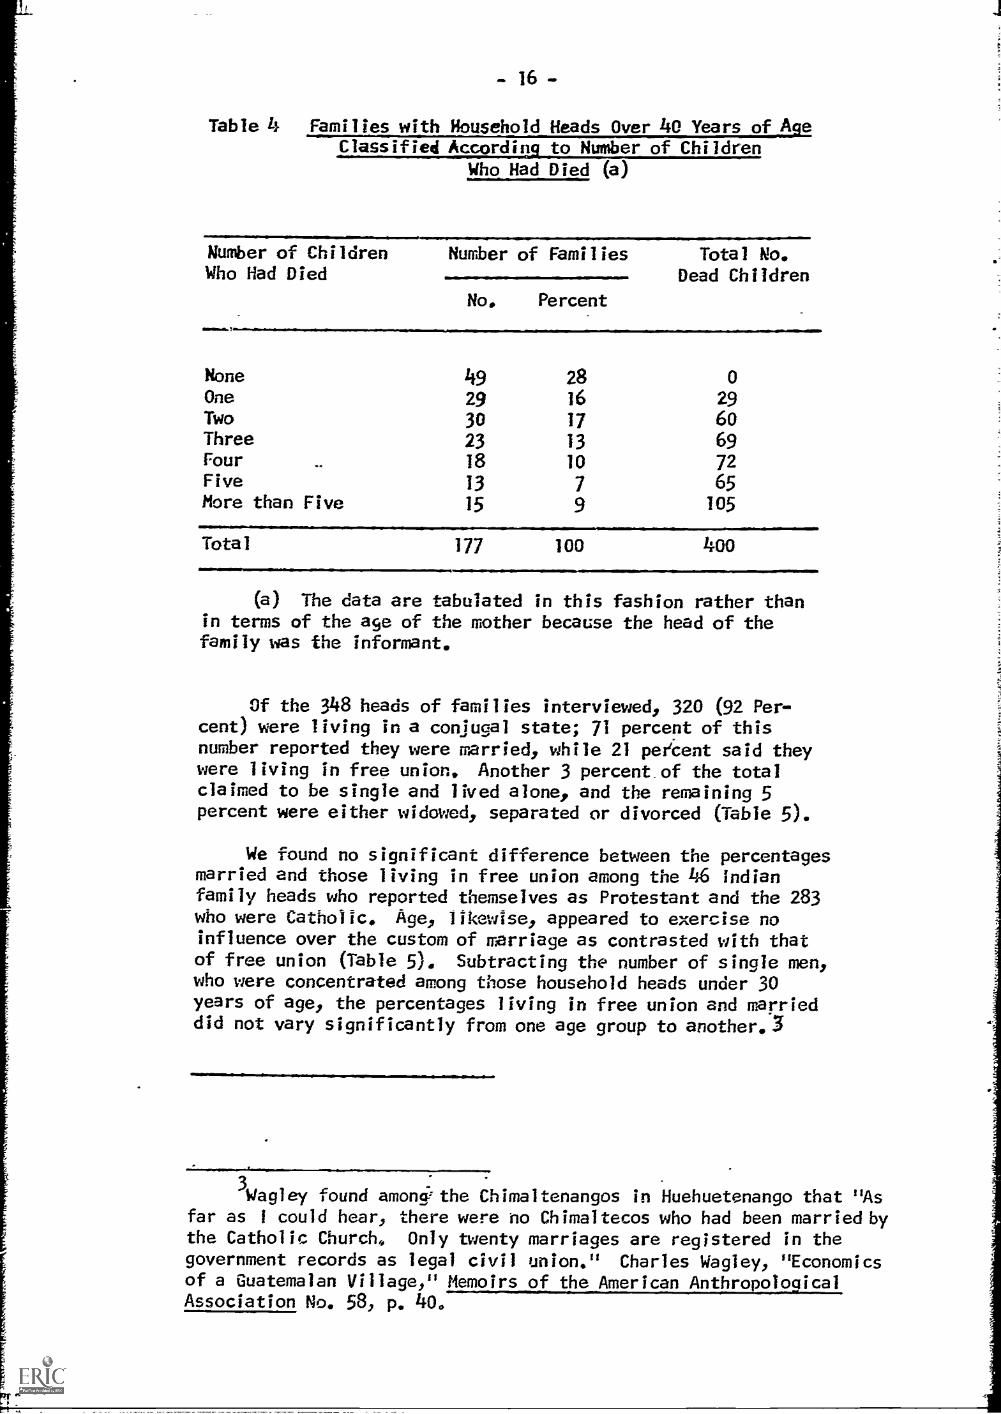
An average of 2.3 children per family have died infamilies-where the head was over 40 years of age (Table O.This rate in the sample population is-only a crude suggestionof what the true mortality of the region might be, but never-theless, suggests that the incidence of infant (and child)'mortality has been high.
2Trimestre Estadfstico, 1963, October, November, and
December, Direcciein General de Estadfstica, Ministerio deEconomia, Guatemala, and itaulation Index (Princeton, N.J.,Princeton University, April 1966).
- 14--
Figure 2.
INFANT DEATHS PER 1,000 LIVE BIRTHS130
120
110
16
100 .,,,..°".. \GUATEMALA\ \\ //90 .
/ \ ,...,,,........../ .."4" //
80
TO
60
50
40
3oL
20
10
0
IMMO SWIM
PORTUGAL*/
SPAIN
FRANCE
USA au,. ONO ame awe ammo was mow 111 Imo
.111111ft, sowsLAND & WALES
sine COMM MOO WNW WINN IIMP WNW MUM ill,...
NETHERLANDS
SWEDEN
1955 195$ 1957 1158 1959 1960 1961 1967. 1963 1964
41=INIMmIls
Source: Population Index. Office of Population Research, WoodrowWilson School of Public and International Affairs. PrincetonUniversity, Princeton, New Jersey, April 1966.
I
-15-
Table 3.
Families Classified According to Number of Persons in Familya
Number inFamily
Number of
Families Percent
Total Numberof Persons
One 15 LI., 3 15
Two 35 10.1 70
Three 49 14.1 147
Four 50 14.3 200
Five 60 17.2 300
Six 48 13.8 288
Seven 39 11.2 273
Eight 27 7.8 216
Nine 15 4.3 135
Ten or more 10 2.9 103
Total 348 100.0 1,747
°Only heads of families, their spouses, and childrenliving at home at time of interview were included.
- 16 -
Table 4. Families with Household Heads Over 40 Years of AgeClassified According to Number of Children
Who Had Died (a)
Number of Children Number of Families Total No.Who Had Died Dead Children
No. Percent
111.,
None 49 28 0One 29 16 29Two 30 17 60Three 23 13 69Four 18 10 72Five 13 7 65More than Five 15 9 105
Total 177 100 400
(a) The data are tabulated in this fashion rather thanin terms of the aye of the mother because the head of thefamily was the informant.
Of the 348 heads of families interviewed, 320 (92 Per-cent) were living in a conjugal state; 71 percent of this
number reported they were married, while 21 peecent said theywere living in free union, Another 3 percent of the totalclaimed to be single and lived alone, and the remaining 5percent were either widowed, separated or divorced (Table 5).
We found no significant difference between the percentagesmarried and those living in free union among the 46 Indianfamily heads who reported themselves as Protestant and the 283who were Catholic. Age, likewise, appeared to exercise noinfluence over the custom of marriage as contrasted with thatof free union (Table 5), Subtracting the number of single men,who were concentrated among those household heads under 30years of age, the percentages living in free union and marrieddid not vary significantly from one age group to another. 3
3Wagley found amonsithe Chimaltenangos in Huehuetenango that "Asfar as I could hear, there were no Chimaltecos who had been married bythe Catholic Church,, Only twenty marriages are registered in thegovernment records as legal civil union." Charles Wagley, "Economicsof a Guatemalan Village," Memoirs of the American AnthropologicalAssociation No. 58, p. 40.

Table 5.
Civil Status of Heads of
Families Classified by Age
Age
Married
Free Union
Single
Othera
Total
No.
Per-
cent
No.
Per-
cent
No.
Per-
cent
No
Per-
cent
No.
Per-
cent
20 - 29
37
59.18
16
25.8
812.9
11.5
62
100.0
30 - 39
80
80.8
17
17.2
02
2,0
99
100.0
4o - 49
57
71.2
19
23.8
11.2
33.8
8o
100.0
50
59
49
72.1
15
22.1
11.1+
34.4
68
100.0
60
24
61.5
615.4
09
23.1
39
100.0
Total
247
71.0
73
21.0
10
3.0
18
5.0
348
100.0
aIncludes widowed/ separated
or divorced.

- 18 -
The fact that three-fourths of the heads of familieswere married (we did not try to ascertain whether this wasa civil or religious marriage, or both), and only one-fourthlived in free.union, speaks for the value which the Indianplaces on the institution of marriage. In another studyof a rural population that was more typical of rural LatinAmerica (a mixture of white, of mestizo and Negro), wefound only 55 percent of the sample household heads weremarried while 27 percent lived in free union, and another10 percent lived in a declared "single" status which seemedto represent their legal interpretation of their civilstatus.
Mobility of the Population
Among sample households, 80.2 percent of the householdheads were living in the communities of their birth, 1S.4 per-cent in another community but in the same department, andonly 1.4 percent in other departments (Tabe 6).
In San Marcos 90 percent of the heads of families wereliving in the communities of their birth. The correspondingfigures for Solola and quiche were 91 and 94 percent respec-tively, while in both Quezaltenango and Huehuetenango thefigure- was 96 percent.
Heads of families in the Department of Chimaltenangowere the most mobile: 56 percent still lived at their birth-place while 42 percent lived in an adjoining municfpio. Chi-maltenango was. one of the departments most directly affectedby agrarian reform attempts from the rewriting of the Consti-tution in 1945 to the promulgation of the Ley de Transforme-d& Agraria In November 1°62. It was among the departmentshaving the highest number of private.fincas expropriatedat various times during the past 20 years and has the largestfiumber.of rural families settled on these expropriated pro-perties. Subsequently, some of the fainilies were forced toabandon thisland when a succeeding government decreed legis-lation contrary to that of its predecessor.
Most of the mobile 42 percent in the Chimaltenango sam-pie were found in the municfpio of Comalapa, aldea Cojoljuyu.in this township a finca was parcelled out by its owner in1928 among Indian families who agreed to pay for their occu-pancy rights by working during the coffee harvest on theowner's coastal finca. With the coming of the reform erafollowing the events of 1945, modifications were made inthis finca in accordance with the political power structurethen in control. By the terms of Decree 900 issued during
IN

Table 6.
.1
Present Place of Residence of Heads of Families,
by Department
.Department
611imaltenango
Totonicapgn
Quezaltenango
Quich4
Soio14
Sall Marcos
,
Huehueteriiingo
At Place of",
In Adjoining Commu-
In Another
Birth
':,
nit
in Same Department
Do artment
Total
No.
Percent
No.
Percent
No.
Percent
No.
56
56.0
42
42.0
22.0
100
33
75.o
11
25.o
044
21
95.5
14.5
022
61
93.8
46.2
065
64
91.4
34.3
34.3
7o
18
90.0
210.0*
020
26
96.3
1.
'3.7
027
Total
=la
ysIM
I,0
411
279
80.2
64
18.4
51.4
048
.)

-20-
the regime of President Jacobo Arbenz, each of the families
was assured a parcel measuring 30 cuerdas.4 With the fall
of the Arbenz government in 19544 changes were made both in
arrangement of the parcels and their occupants. Strife and
struggle ensued, and with the coming of still another govern-
ment policy under President Castillo Armas, the parcels were
returned to their original status in 1956. While the fore-
going is not a full history of the 54 families who were
living in this aldea in 1964, it is enough to indicate why
the percentage of mobility is so high in Chimaltenango.
The immobility of the Highlands population is further
demonstrated by the fact that the children and siblings of
76.7 percent of household heads still lived in the community
of their birth at the time of these interviews. (Table 7) In some
of the departments, none of the adult children have migrated
from their home communities; and only 4.3 percent of sample
families reported that one or more of their adult children
had migrated. Most of the migration that occurred was ac-
counted for by siblings of the family head. The heaviest
migration of siblings, which occurred in Quezaltenango,
can be explained by the fact that the aldea studied was
less than three kilometers from the capital city of this
department. The migration rate of siblings in the other
departments was much less than that of Quezaltenango.
In all the studies we have made on the subject of mobility,
and in all others that we know about, we have never encountered
as stable a population as the Highland Indian.5 Richard
Adams, who perhaps has had more direct contact studying
rural life in Guatemala in recent years than any other social
scientist, has under way a study of migration patterns among
the Kekchi, originally inhabitants of the department of Alta
Unfortunately, one cuerda is not a uniform measure-
ment. One cuerda might vary from .028 hectares to .110
hectares according to wheiher the cuerda contains 20 or 40
varas (some are smaller). One vara is approximately 33 inches.
5 See George W. Hill, Jog A. Silva M., and Ruth Oliver
de Hill, La Vida Rural en Venezuela (Caracas, Ministerio de
Sanidad y Asistencia Social, 1960), p. 57. Also see C.E.
Lively and Conrad Taeuber, Rural Migration in the United
States (Washington, D.C., 1939).,for the first systematic study
made on this topic. To some degree this relative permanency
of residence reflects the-res6rt to seasonal employment away
from the home community.

MIR
TIF
FIR
Table 7.
Measure of Mobility of Children and Siblings
of Head of Family
Department
All family members
still living in
communit
of birth
Families from which
adult children have
migrated
Families from which
siblings of family
head have
Total
No.
Percent
rNo.
Percent
No.
Percent
Chimaltenango
63
63.0
77.0
30
30.0
100
Totonicapin
31
70.5
3.3
10
22.7
44
Quezaltenango
13
59.1
09 d
40.1
22
Quich4
58
89.2
07
10.8
65
so1old
60
85.7
57.1
57.1
70
San Marcos
16
80.0
04
20.0
20
Huehuetenango
26
96.3
01
3.7
27
Total
267
76.7
15
4:3
66
19.0
348

;,.
- 29-
Verapaz, who have been migrating in increasing number intoEl Pe-ten, Guatemala's sub-country sized department, almostuninhabited since the flight of the "Old Empire= Mayanfrom there about the-ninth century A.D. Thus far, hehas not found a single Western Highlands Indian who hasmigrated toward this lowland.°
wiWwW.W.IIN.NOWA.
.,
6Richard N. Adams, Miraciornes
Ex ansiOn A raria de los indloenas Kekchies hacia el Peten.University of Texas, mimeo, n.d.).

III. THE LAND BASE
Farm Size
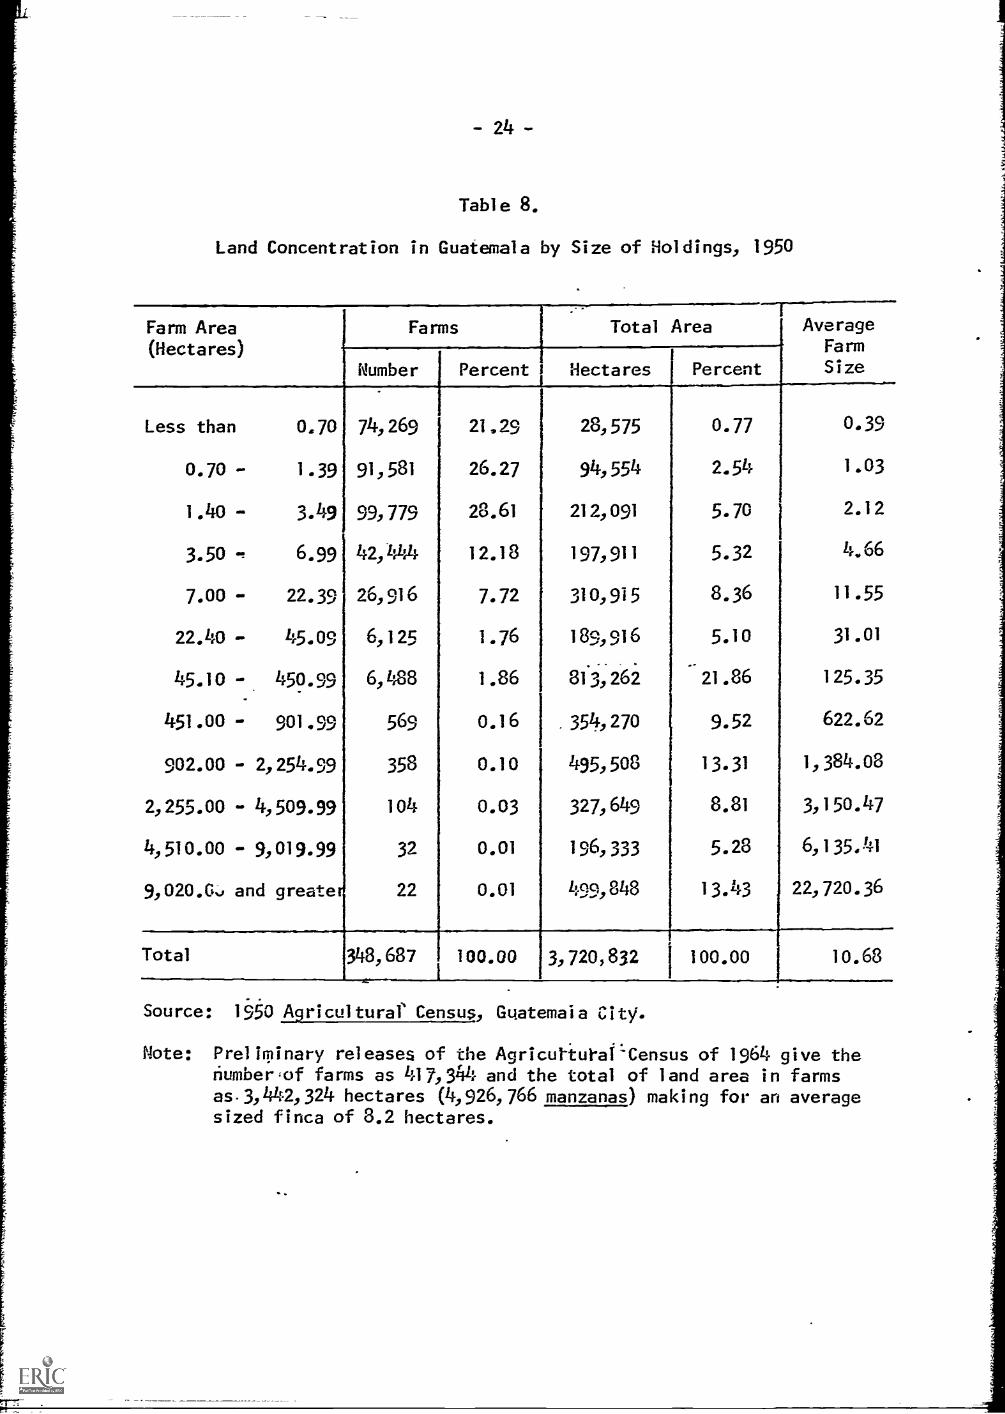
Guatemalan agriculture is characterized by a concentrationof farming land in a few large farms. According to the 1950 Agri-cultural Census there were 348,687 farms in Guatemala, which occu-pied an area of 3,720,833 hectares. The average size of farms was10.68 hectares (Table 8). The Census data indicated that thefarms which were 45 hectares or larger (0.31 percent of the totalnumber of farms) contained 50.35 percent of the land whereas farmsof less than 7 hectares in area (88.35 percent of the total numberof farms) contained only 14.33 percent of the farm land (Table 8).
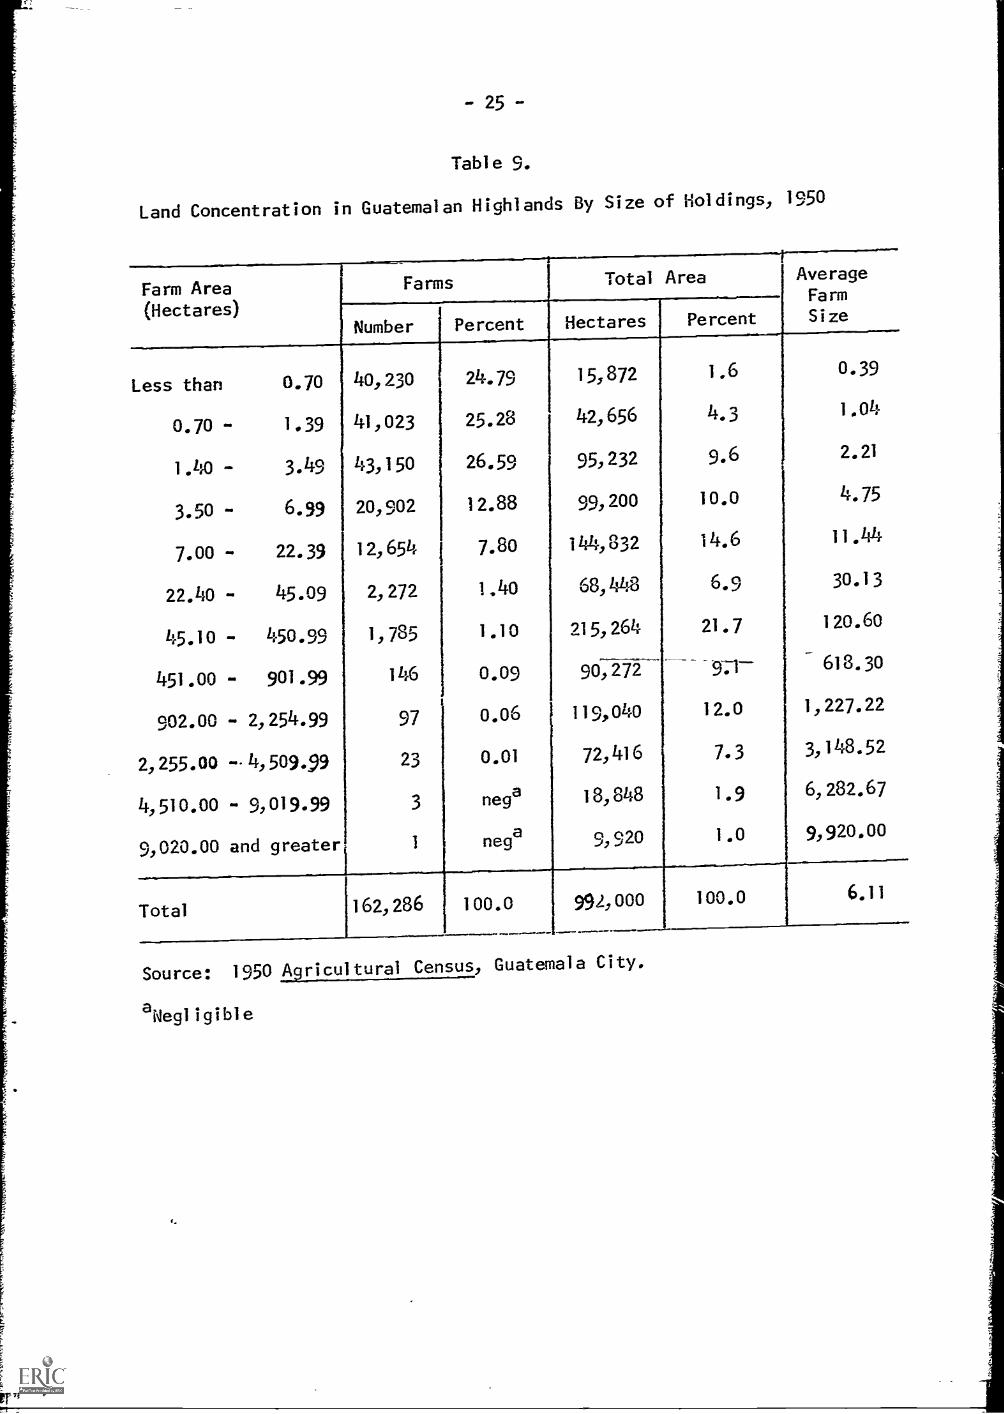
At the time of the 1950 Census the Highlands of Guatemalacontained 162,289 farms (46.54 percent of the nation's farms), andthey occupied 992,000 hectares (26,62 percent of the total farmland). As a result, the average farm area in the region was 6.11hectares (Table 9). The Highlands contained a larger proportionof the nation's small farms than did other regions, while it con-tained fewer large farms. It contained 54.17 percent of the farmsless than 0.70 hectares, but only one farm larger than 9.020 hec-tares.
The sample population was classified according to the totalfarm area and also by area cultivated. The average total farm areafor the sample was 3.00 hectares, while cultivated area was 1,49hectares (Table 10). The average total farm area and cultivatedarea was computed for each of the six classes used in the classi-fication of the sample data (Table 10). This analysis indicatesthat as the total farm area increases, the proportion of the farmcultivated diminishes. Farms less than .50 hectares cultivated 79.3percent of the farm, while those in excess of 2.49 hectares culti-vated 41.6 percent of their land.
1The farm size data given in hectares was converted from themeasure which is used in the Highlands--the cuerda, which was intro-duced from Spain to measure land areas where possessions are tiny.It is a square measure, which varies within and between Highlandcommunities, and even on individual farms. The concept itself isbased on another measure--the vara, which is also an old Spanishlinear measure of varying length, but in Guatemala it has beenaccepted as being 0.835 meters (approximately 33 inches) in length.A cuerda of land can vary from measuring 15 varas square to ashigh as 40, and usually when referring to the size of his corn fieldor milpa, a different size cuerda is used than that which describesthe family garden or huerta. We did not find out the etiology ofthis variance in the size of the cuerda because none of our inform-ants was able to follow as sophisticated an inquiry as such anattempt would have entailed.
-23-
- 24 -
Table 8.
Land Concentration in Guatemala by Size of Holdings, 1950
Farm Area Farms Total Area AverageFarm(Hectares)
Number Percent I Hectaresi
Percent Size
Less than 0.70 74, 269 21, 29 28, 575 0.77 0.39
0.70 - 1.39 91, 581 26.27 94,554 2.54 1.03
1.40 - 3.49 99, 779 28.61 212, 091 5.70 2.12
3.50 -, 6.99 42,444 1 2.1 8 197, 911 5.32 4.66
7.00 - 22.39 26, 916 7.72 310, 915 8.36 11.55
22.40 - 45.09 6,125 1.76 189,916 5.10 31.01
45.10 - 450.99 6,488 1.86 813, 3,262 21.86 1 25.35
451.00 - 901.99 569 0.16 . 354, 270 9.52 622.62
902.00 - 21254.99 358 0.10 495, 508 13.31 1,384.08
2, 255.00 - 4,509.99 104 0.03 327, 649 8.81 3,1 50.47
4,510.00 - 9,01 9.99 32 0.01 196,333 5.28 6,1 35.41
9,020.G., and greate 22 0.01 499,848 13.43 22, 720.36
Total 348, 687 100.00 3, 720, 832 100.00 10.68i
Source: 1950 Agricultural' Census, Guatemala City.
Note: Prel iminary releases of the Agricutiurai 'Census of 1964 give thenumber ,of farms as 417,344 and the total of land area in farmsas- 3,442, 324 hectares (4, 926, 766 manzanas) making for an averagesized finca of 8.2 hectares.
-25-
Table 9.
Land Concentration in Guatemalan Highlands By Size of Holdings, 1950
Farm Area
(Hectares)
Farms Total Area Average
Number Percent Hectares Percent
FarmSize
Less than 0.70 40,230 ti24.79 15,872 1.6 0.39
0.70 - 1.39 41,023 25.28 42,656 4.3 1.04
1.40 - 3.49 43,150 26.59 95,232 9.6 2.21
3.50 - 6.99 20,902 12.88 99,200 10.0 4.75
7.00 - 22.39 12,654 7.80 144)832 14.6 11.44
22.40 - 45.09 2,272 1.40 68,448 6.9 0 30.13
45.10 - 450.99 1,785 1.10 215,264 21.7 120.60
451.00 - 901.99 146 0.09 90,272 971 618.30
902.00 - 2,254.99 97 0.06 1 119,040 12.0 1, 227.22
2,255.00 -- 4,509.99 23 0.01 72,416 7.3 3,148.52
4,510.00 - 9,019.99 3 nega 18,848 1.9 6,282.67
9,020.00 and greater- I nega 0 920 1.0 9,920.00
Total 162,286 100.0 992,000 100.0 6.11
Source: 1950 Agricultural Census, Guatemala City.
aNegl igible

Table 10.
Sample Farms Classified by Total Farm Area and by Cultivated Area
Area Class
(Hectares)
No. of
Farms
0.00
-0.49
0.50
- 0.99
1.00
- 1.49
1.50
- 1.99
2.00
-2.49
54
65
42
47 30
over 2.49
110
Total
348
Classification b
Total Area
Percentage
Av. Total
Farm Area
Av. Cult.
'Farm Area
% of Farm
Area Cult
15.5
0.29
0.23
79.3
18.7
0.73
0.56
76.7
12.1
1.24
0.92
74.2
13.5
1.75
1.18
67.4
8.6
2.20
1.66
75.5
31.6
7.11
2.96
41.6
100.0
3.00
1.49
49.3
Classification b
Cultivated Area
No. of
Farms
Percentage
Av. Cult.
Farm Area
82
93 53
46
27
47
23.6
26.7
15.2
13.2
7.8
13.5
0.28
0 72
1.25
1.73
2.18
4.80
31+
810
0.0
1.49

-27-
The largest farm in the sample was 42.24 hectares; twofarms had an area in excess of 20 hectares and only 18 (5.2percent) had more than 10 hectares. At the other end of thedistribution, 54 of the 348 had less than 0.5 hectares ofland. The highest concentration of farms of less than 0.5hectares was in Totonicap6n. On the other hand, in Sololdwe found the highest percentage of farmslthe area of whichis 2.5 hectares or more (Table 11),
Land has only two major use classifications in theHighlands -- crop land and wood lot. The average area ofland among the sample farms allocated to pasture, wood lotand cultivation was 0.21, 1.03 and 1.49 hectares, respec-tively (Table 12). Wood lots were found on 58.6 percentof the farms. Pasture lands (accounting for 8 percent ofall land in farms) were found only at altitudes over 2,500meters, and then only in the extreme western part of theregion. Only 14,6 percent of the farms contained pasture,and only in TotonicapSn and San Marcos was there a signifi-cant incidence of pasture land.
Patterns of Inheritance
Inheritance practices vary somewhat in the Highlands,but traditionally land is divided equally among sons of thedeceased father, if he had any, and quite often among thedaughters. We found that 40.8 percent of heads of house-holds obtained all the land they had through inheritance;another 26.6 percent had added to their original legacy bypurchase, so that 67.4 percent of the total sample had ob-tained all or part of their land by inheritance (Table 13).Only 25 percent had obtained all their land through outrightpurchdse.-
Traditionally, it is the custom to have one's landsgiven or promised to one's sons as the latter reach manhood,but if that is not the case and time allows, partitioningtakes place just before death occurs, even -though such atransfer may not be legally registered. Complications mayarise when a farmer dies intestate. We found groups offarmers whose names did not appear in the census lists withwhich we had been provided for the respective communities.Upon questioning, we found that their fathers had diedintestate but they still reported their deceased fathersas owners and operators of the lands.

- 28 -
Table 11.
Distribution of Sample Farms Cultivated According toDepartments and Area Cultivated
1
.UnderDepailment
0.5
N . nJ
0.5 - 0.9
NNo. %
1.0 - 1.41i.5 - 1.9 2.01
iN % No. %No.- 2.4
%
2.5 &over
NO %
Total
Ch imal ttnango 8 8 34 34 24 24 J 20 20 4 4 10 10 100
-.--
Totonicapgn 23 52 13_ 30 3 . 7 3 7 2 4 .. 44
Quezal tenango 9 40 5 23 1 5 2 9 - - 5 22 22
Quithe 25 39 19 29 9 14 6 9 2 3 4 6 65
SOlotg 8. ii 9- 13 10 14 9 13 11 16 23 33 70
:,-
Huehiietenango 11 41 7 26 4 2 7 3 11 3 11 27
San Marcos - 4 20 5 25 4 20 5 25 2 10 20...-
,
Total 84 24 91 26 j 53 15 46 13 27 8 47 14 348
Table 12.
Average Area Per Farm by Class of Land Usea
Department Pasture lloodsb Cultivated Otherc i. Total
Chimal tenango 0.05 1.56 1.41 0.16 3.118
Totonicapgn 0.40 0.86 0.64 0.31 2,21
Quezal tenango 0.11 0.44 2.06 0.09 2.70
Quiche 0.12 0.97 1.00 0.01 2.10
Huehuetenango 0,25 0:85 1,11 0.02.-- 2,23-:. ,..
Sol olg . O.O6 1;12- . -2.46. - 0.34 3,96
San Marcos :1 .54 0.44 1.74 0,04 3.76
Average 0,21 1.08 1.49 0,22 3.00
aAverage for 348 farms,
blncl odes waste 1 and.
c1 ncl udes household area.

Fj
Table 13
-29-
Manner in Uhich Land was Acquired
Process Number Percent
Inheritance 142 40.8Inheritance and Purchase 93 26.6Purchase 87 25.0Donation 14 4.2Unknown 12 3.4al......woons111.
Total 348IIMMIIIMM1101/
100.0
Individual and Communal Ownership
As one would expect in a traditional society where pro-perty is mainly acquired through inheritance, the bulk of theoperators were owners. In all, 329 of the 348 informants(94.5 percent) owned all or part of their farms. There-maining 5.5 percent rented and paid rent in cash or kind(Table 14).
Without exception, the proprietors all claimed to havedocumentary evidence of title to their properties. We didnot verify these claims. However, as all anthropologicalstudies among Middle American Indians have shown, Indianboys take on the responsibilities of manhood at an earlyage. The father's wealth is indicated by the extent of hislandholding and when marriages are arranged by the parents,rather than by the young couples themselves, the amount ofland which the father can bestow on his son has much to dowith the bride he eventually obtains. The land given in thismanner is given the son for use only; the father retains titlein his own name. Knowing this practice, undoubtedly manyof the "owners" of land whom we interviewed interpreted theirperiod of "ownership" from the time they were in reality onlyusers of their father's lands. If the fathers were stillliving, some may not even have been legal owners at the timeof the interview. Wagley puts the time of possession in thefollowing manner: "Not until a man is a father or even agrandfather is he actually the owner of family lands. Mostfathers keep control over the bulk of their property and thusover their sons until death."2
2 Charles Wagley, ' Op. Cit., p. 6.

-30-
Table 14 Tenure Status of Sample Families
Tenure Status Number Percent
Owner 247 (a) 71.0Renter 8 2.3Owner & Renter (b) 58 16.6Renter & Owner (c) 24 6.9Share Cropper 11 (d) 3,2
Total 348 100.0
(a) Nine owners also had rights to use of landin communal properties(b) Owned the major part of landholding,(c) They rented the major portion of theirlandholdings,(d) Seven share croppers also owned land whichthey had acquired through inheritance.
Because individual ownership of land is something thatwas imposed relatively recently upon the Indians by theSpanish culture, and because communal ownership has centuriesof tradition, repeated governmental decrees of the nineteenthcentury have not yet abolished this type of ownership. Com-
munal ownership was supposedly abolished by Presidential de-cree in Guatemala in the nineteenth century, and although thatdecree was supported by subsequent presidents, the practicecontinues to persist. We found it prevalent in the Departmentof Totonicapan, where the system went under the name ofilapialidades. There were, for example, the parcialidadesof the towns of Momostenango, Santa Marla Chiquimula, SanBartolo, and San Andr4s Xecul. They bear a family name;usually the name of the one who supposedly obtained theoriginal land grant during the early colonial period. Wewere informed of seven parcialidades in the department andwere given their approximate land areas, which ranged from89.4 hectares in the smallest communal holdings to 2,012.4hectares in the largest. The president of one of these pro-perties -- at least that was the official title bestowed uponhim by the members of the association -- said his group wascomposed of 103 members, and the membership is limited ex-clusively to males whose paternal or maternal name is thatof the original beneficiary of the land grant. Some of thesegrounds are limited exclusively to the gathering of fire wood,

31 -
and even the amount of that is strictly allocated to each
member every year. Some can be used for pasture. The royal
grants or titles which stipulate the metes and bounds of
these properties are zealously guarded by an elected mem-
ber of the parcialidad, and he and only one other designated
member know where it is held for safekeeping.
Charles Wagley, who studied the Indians of the Department
of Huehuetenango, reports the same preference for the communal
title that McBride had found in Mexico quite a few years
earlier. Consequently, few Chimaltecos have ever bothered toobtain individual land titles at either the municipio or
Amtmento offices. We suspect that the majority of the
owners have no documents-to prove their rights to the land.
"Chimaltecos (residents of Santiago Chimaltenango,Huehuetenango), however, still guard with greatcare their municipal title, given to them during
the early nineteenth century, trusting in itspower to preserve to them all the lands of their
municlpio, although their Titulo has long sincebeen invalid in the eyes of the governmentalauthorities."3
Wagley also goes on to say:
"The Titulo is kept in almost sacred state bythe current Principles and the Alcaldet themost important officials in the village.Around it revolves great secrecy; no one willsay exactly where it is kept for fear of theft
of the paper and thus rights to the lands."4
The antiquity of the Titulo and zealousness in guardingthe secret of its whereabouts are similar to the account wewere given concerning the document establishing the validity
of the parcialidades in Totonicapan. They both attest to
the persistence of the institution of communal property, andtheir similarities suggest their common origins.
We conclude, therefore, that many of the assurances oftitle given by our informants may mean they possess a bundleof rights that are recognized only among members of theirfamily and the local community. These rights would notnecessarily be upheld in a court of law in the event of achallenge to ownership of the land.
3 Ibid., p. 62.
4 Ibid., p. 62.

IV. THE HIGHLANDS MILPA
Maize,the Basis of the Enterprise
Maize is the principal food of every Indian so its cul-
ture predominates in the Highlands. Preparation of the land
for planting, the actual planting, and the firsts second,
third, and sometimes, the fourth cultivation to control weeds
and to repair storm damage, and then finally harvesting,
shelling and storage make maize culture a year-round process.
Only a few weeks after the seed ears have been hung away under
the eaves or stored under the rafters of the house, it is time
to start the job of clearing the dried stalks and accumulated
vegetation in the fields so that they can be burned, and thus
begin the annual task on its next cycle.
Beans are another important item in the indigenous diet.
The planting techniques vary between localities, partly because
of cultural determinants which many anthropologists have des-
cribed, and partly because of the dictates of experience.
While "large" farmers will plant whole fields of corn and
beans separately, hoe culture permits combining both in the
same field. Even in the same hole which the peasant opens
with his hoe, hewill drop in the required four or five ker-
nels of corn, followed with a variety of pole bean and a lima
bean. In jamumus and Chimazat, aldeas of the Cakchiquel in
the Department of Chimaltenango, we saw women in fields that
already had been planted to corn; following with their own
coas or planting sticks, seeding beans. The planting of beans
is the woman's task and although she plants the beans in the
same hill into which was dropped the seed corn, she follows
her husband in planting by a period of "two days later so
that it will not kill the corn."1 The pole bean is planted
with the corn so as to grcw up around its stalk, while the
dwarf bean or frijol de suelo or surco, as its name implies,
is planted within,the furrows. Lima beans are likewise
planted between the rows as are many varieties of chilacayotes
(squash), the duisduil of Guatemala or the "Chayote, as it
is known in other Latin countries, milscy) or pumpkin, and
cucumbers.
Potatoes are planted between the rows and when that is
done, a lesser amount of the other crops is planted, so that
here and there will be a squash, a pumpkin, and frequently a'
I See Wagley's monograph for an anthropologist's interesting
account of how the women are excluded from the ritual surrounding
the cultivation of maize for fear of casting an evil spell on
the crop. Op. cit., p. 33ff.
- 32 --

- 33
lima bean stalk. If the farmer has a special field of potatoes,even though it measures only two or three cuerdas in size, hehas reached a level that takes him above the average peasantwe are describing because he has land and enough money totake a risk on a cash crop in addition to the milpa which heplants elsewhere to ensure his family's subsistence.
The fraccionamiento may have had its origin, not in thesplitting up of land due to inheritance patterns, but in thesearch for plots of land at different ecological levels, pro-viding variation in drainage and soil types to allow both a"summer" and a "winter" milpa. The first would provide themuch sought elote, or roasting earl in July or August, while inthe other, corn would not begin to mature until in Septemberand October, depending upon altitude. Because storage facili-ties are inadequate and harvests from the plots are small,every advantage that nature provides has to be seized iftortillas are to be on the table regularly; otherwise the High-landers must suffer a long period before harvest without corn.
The agricultural season starts when the dry period of"summer" is sufficiently advanced to perMit the burning of theprevious season's vegetation. This begins in January and de-pending upon the variations of altitude, continues throughFebruary and March. When we speak of burning we do not wishto imply that the Highland Indian practices "swidden"2 farmingor a shifting type of agriculture, where he shifts from oneplot of land, whose fertility he has exhausted, to anotherwhere he slashes and burns either the virgin or second growthforest and thus starts his "swidden" anew. Evon Vogt refersto "swidden" farming among the Highland Maya of Chiapas, astate on the southeastern border of Mexico and Guatemala.He asserts that "swidden" agriculture is the rule and if heuses the term correctly, these Mexican Mayans are more for-tunate than their cousins in Guatemala becaUse the jatter.cannot afford to leave land in fallow:3
2English dialect meaning "burned clearing" suggested by
Clark and*Haswell, op. cit., who have a good description ofswidden farming on pages 38ff.
Evon Z. Vogt, "Some Observations and Predictions onTrends of Change in Highland Chiapas, Mexico," paper read atthe Cornell Latin American Year Conference on the Developmentof Highland Communities in Latin America, March, 1966.

34
Shifting agriculture exists where there is land withvirgin or secondary growth which can be reclaimed when existinggarden areas are no longer considered suitable for cultivation,or where each farmer has enough land to allow plots to liefallow and thus recoup a portion of their fertility in the pro-cess, while he cultivates others in their regular order ofsequence. This is too wasteful a practice for Highlanders tofollow, because it would call for each to possess a minimum offour and a half hectares of crop land, of which only a thirdwould be in production in any one period of the cycle. Aswe have shown, only the largest farmers have this amount ofcrop land (Table 10).
We suspect the Highlander burns chiefly to control weeds,not to fertilize. In this tropical zone with an annual rain-fall of about 60 inches, weeds grow fast, and when cultivatingand weeding are tasks that have to be carried out during therainy season, dry spells are too infrequent and short toallow weeds to be effectively controlled. If the vegetationcan be burned before land is made ready many weed. seeds .aredestroyed, thereby reducing the subsequent amount of laborrequired for weeding.
The first rains, which may start as early as late April,but more often the middle of May, produce changes that seemabsolutely incredible. Fields and hillsides that were dead,brown and dusty, suddenly are green and scintillating withnew life. The summer maize planted late in February or earlyMarch thrusts up its leafy stalks. By six o'clock in themorning, workers are in the fields, taking a break for lunchat eleven and working again until four or five to complete aneight to ten hour day. The summer milpa is planted before therains start, but the winter milpa is planted after the rainshave begun, as late as the first of May. Extra help ishired, or relatives come to exchange labor, in the heavychore of land preparation, which is done by most Indians withthe hoe, and many collaborate to get a field seeded in oneday if possible. Six to eight weeks after the planting ofthe first summer milpa, the maize is ready for cleaning andhoeing, and when that has been done, the winter maize callsfor its turn.
Completion of the third and final round of cultivatingwinter fields varies within the region from late July to Sep"tember. Occasionally, the hill farmer has to cultivate yetagain very late in the season. After the cultivation Cyclehas been completed, the farmer is free to look for work awayfrom home. Then he may spend one or two months picking coffeein the cafetales that abound below the altiplano and on thePacific slopes; as his ancestors were forced to do from the
- 35
time that Guatemala became a major exporter of coffee in the
later half of the nineteenth century. With the advent of
cotton as a major export crop following World War II. some
of the Highlanders began towork in its harvest during the
months of November, December and January.
Shortly before the corn is mature stalks are bent
over to protect the ripening ears from the rains because the
downpours (aguaceros) of the temporal) which generally occurs
in November, could rot the ears. Actually, with the killing
of the stalk in this fashion the corn dries faster. This
practice also provides more protection against marauding
birds. Early potatoes are dug in September and early squash
are marketed, although neither harvest gets into full swing
until much later. Some of the aldeas have a climate that
favors two harvests of wheat, one in September and another in
February, as was the case in Chipata, in the northern extremity
of the department of Chimaltenango. Harvests reach their
height in December and January, so almost a full calendar
year has gone by since the first raking and burning of vege-
tation began.4
Although a few farmers still use animals to tramp out
the grain from wheat and other small grains, most of the
threshing floors are no longer used because threshing rigs of
the Gremial Nacional de Trigueros, whose main offices are in
Quezaltenango, or those proi.fided by the Servicio de Fomento
de la Economra Indrgenal thresh most of the crop. Also, their
trucks haul most of the grain to the several mills in the
region. Bean vines are carried to the patio of the farm
home. After they are well-dried the women and children do the
flailing and the winnowing whenever there is a strong enough
wind blowing.
Corn is picked and carried to the house in the husk and
then stored according to the means of the farmer. If he is
one of the fortunate, he will have a small troje, or corn
crib, measuring no more than about five feet square and about
as high, made of adobe and set on a slightly raised platform.
4Leon Vailadares found that in Huehuetenango guisquil
is planted near the house at the beginning of the rainy season
and harvested during the months of August, September and October,
depending on the length of the growing season. It is planted
near the house so that the vines may climb the nearby shade
trees. The ayote he specifies "se siembra el 6 de enero y se
cosecha en Julio y agosto." We did not find out why it has to
be seeded on January 6th. See B. Costa -Amic, Editor, El Hombre
(1957), P. 53.
-36
The majority, however, store their maize in one corner of the
house in a temporary bin made of corn stalks and from there
the woman of the house takes the ears day by day, shells them
in her hands and so, starts the daily task of tortilla making.
principal Crops and Yields
From the preceding description, it should be obvious
that any breakdown of the farm enterprise into precise units
by crops is difficult. All of the farms had some corn plant-
ings (Table 15). There was an average of 1.03 hectares of
"sole" corn plantings per farm. Corn yields ranged from a
low of 14.4 quintals per hectare in Huehuetenango to 24.4
quintals in Quezaltenango, with a regional average of 18.96
quintals per hectare (Table 16).5 'The high yield in Que-
zaltenango may have been obtained because most of the farmers
used chemical fertilizer. This was not true in the other
departments. In Huehuetenango not a single operator had
used any.
Wheat was cultivated on 130 farms. The total area
planted was 128.1 hectares, about 36 percent of the area
planted to maize. Two of the departments, Quiche and Huehue-
tenango, planted little or no wheat. The highest concen-
tration of wheat farmers was found in Solola and San Marcos.
With a yield of 27.9 quintals per hectare, Solo16 was the
department with the highest yield and since a large portion
of the farmers in this department grew wheat, the overall
regional yield is unduly influenced. It amounted to 23.0
quintals per hectare. Without Solo16, the regional average
would drop to about 19 quintals per hectare.
Although potatoes represent an insignificant part of
the farm enterprise, we included the crop separately only
to indicate its scarcity as a crop in the subsistence eco-
nomy. A total of 42 farms reported they had separate potato
plantings bi't the total area planted amounted to only 5.9
hectares. Even if we add to this the area of land in which
potatoes were interplanted with corn, the total is only 10.6
hectares, or less than three percent of the amount of land
in corn. If we remove the department of Totonicapan from the
total, the average yield could be about 197 quintals per hec-
tare, a good demonstration of the possibilities of this crop
in the Highlands.
5 The quintal used here is a hundred weight measure,
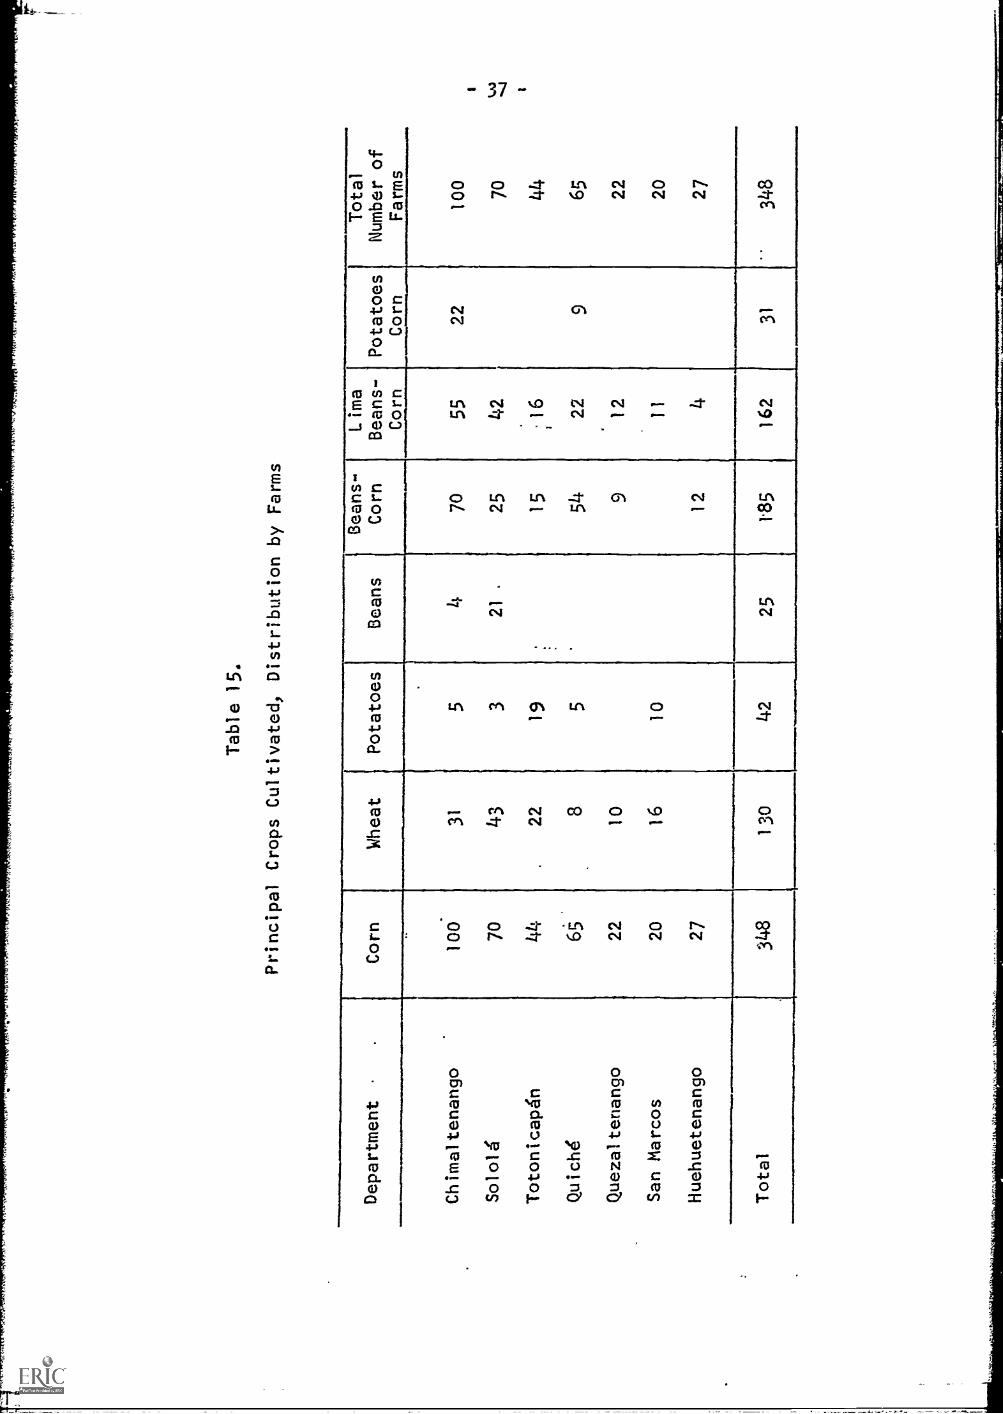
Table 15.
Principal Crops Cultivated, Distribution by Farms
Department
Corn
Wheat
Potatoes
Beans
Beans-
Corn
Lima
Beans-
Corn
Potatoes
Corn
Total
Number of
Farms
Chimaltenango
100.
31
54
70
55
22
100
Solo14
70
43
321
25
42
70
Totonicapb
44
22
19
.
15
.16
44
Quich4
65
85
54
22
965
Quezaltenango
22
10
912
22
San Marcos
20
16
10
11
20
Huehuetenango
27
12
427
Total
348
130
42
......
....r
......
o....
....
25
1.85
162
rra.
......
.....
31
348

Table 16.
Area Cultivated (hectares) and Yield (quintals) of
Principal Crops
Corn
-Wheat
Potatoes
Beans
Department
Area
Yield
per
Hectare
Area
Yield
per
Hectare
Area
Yield
per
Hectare
Area
Yield per
Hectare
Chimaltenango
119.4
20.4
18.3
18.3
1.2
235.9
0.8
8.6
soioIA
104.2
16.4
53.3
27.9
0.5
134.7
8.2
11.0
Totonicap4n
14.8
17.6
7.6
17.3
2.7
60.0
Quich4
58.3
21.3
5.8
13.0
0.6
145.2
Quezaltenango
15.0
24,
30.1
22.4
San Marcos
18.5
20.7
13.0
18.3
0.9
210.0
Huehuetenango
29.2
14.4
--__-__
Total
359.4
19.0
128.1
23.0
5.9
134.0
9.0
10.8

-39-
Frijoles de suelo were grown as a separate crop on only 25 of
the 348 farms studied, whereas frijoles de milpa, or frijoles de vara,
were intertilled on 54 percent of the milpas and used about 45 percent
as much land as did corn. But the yields of the two varieties of
beans were radically different. The first yielded 10.8 quintals
per hectare, while the other yielded only 1.7 quintals.
The haba (similar to the lima bean) was another popular crop
interplanted with corn, appearing on 162 farms. Yields with such
beans were slightly higher than for the other varieties, averaging
2.0 q%!intals per hectare, with no marked variation between depart-
ments.
Capital Investment
Taking the owners' estimates of current market values for their
land, buildings, livestock and tools, we arrived at an average value
of Q1,370 per farm (Table 17). Omitting for the moment the atypical
department of Quezaltenango, the estimates are reasonably uniform
between departments, the difference between the lowest and highest
values being only Q500, or about one-third the average value. There
were three main factors that influenced the variation.
One was the proximity of the sample aldea to a large urban con-
centration. The sample community in Quezaltenango, which was less
than three kilometers from the capital of the department ciearly
demonstrates this factor's influence. This sample aldea is really
a part-time farming community where many of the farmers work in the
factories, commercial establishments and service industries of the
city in the morning, and tend their lands in the afternoon. Con-
sequently, land values are high. Rentals, for example, were found
to be as high as Q1,25 per cuerda per year for the best land, but
since much of the land is hilly and stony we found prevailing
rentals to be around Q0.75 per cuerda.
Another factor which influenced average farm values was prox-
imity to an all-weather road. If this happened to be the paved
inter-American Highway, as was the case for part of the sample drawn
in the department of Totonicapen and for the aldeas of Chimazat in
Chimaltenango, or San Andres Se metabaj in Solola, the estimated
values reflect this proximity. In contrast, to mention only a few
communities where isolation held down values, we would cite the case
of Pamumus, which as our field notes say, "is reached only after a
difficult and muddy climb of eight kilometers north from the capital
of Comalapa municipie: Again, quotrng from our notes concerning-
Zeabaj, "One arrives there by a shortcut that leads-up a slope
which is almost 45-degrees as are the cultivated lands."
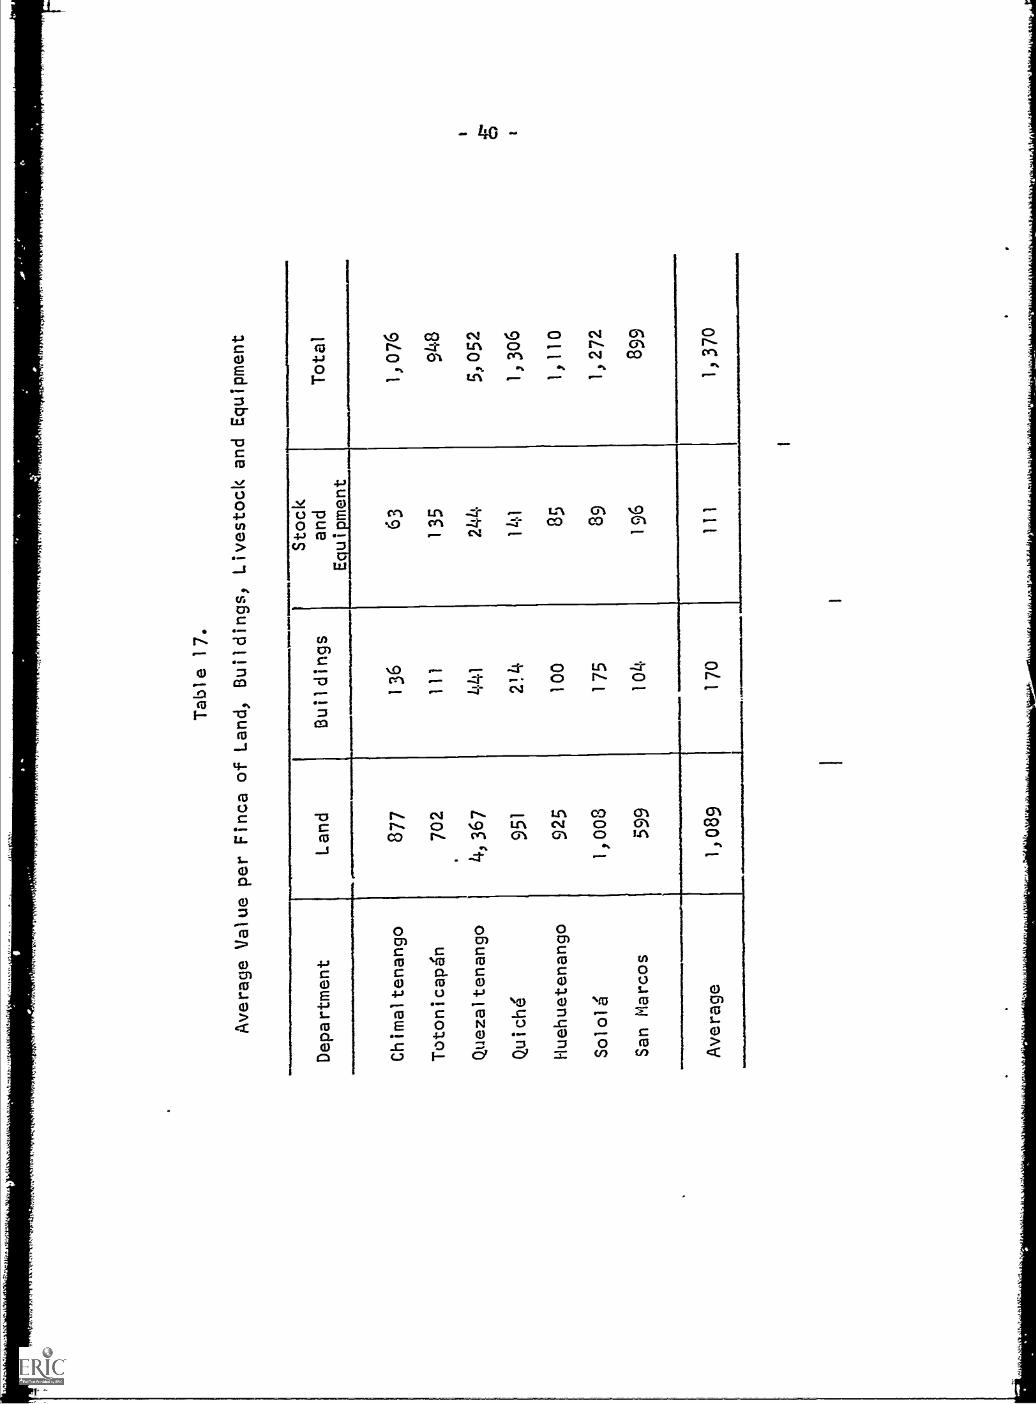
Table 17.
Average Value per Finca of Land, Buildings, Livestockand Equipment
Department
Land
Buildings
Stock
and
Equipment
Total
Chimaltenango
877
136
63
1,076
Totonicap4n
702
111
135
948
Quezaltenango
4,367
441
244
5,052
Quich4
951
2!4
141
1,306
Huehuetenango
925
100
85
1,110
So1o14
1,008
175
89
1,272
San Marcos
599
104
196
899
Average
1,089
170
111
1,370

-41-
A final example, "The trail which leads to Chipata is poor, and
frequently disappears," (el casino que conduce a Chipata es malo y
frecuentemente se escoride") because it is lost under landslides that
are almost a daily occurrence in the rainy months of July to
November. All these last three aldeas are in the department of
Chimaltenango and depress the average farm values in that state.
Since the only means of reaching the local market was on foot or
pack horse, land values were low.
Table 18
Livestock Population on Survey Farms
CategoryNumber Number
of Head of Farms
Sheep 1,085 65
Cattle (dairy) 80 45
Fowl 2,668 290
Pigs 175 125
Capital investment in stock and equipment was influenced by
the type of farming. Livestock was the most influential component
in this category. Most farmers owned a machete and hoe and a few
also possessed hand sprayeri and cross-cut saws. In the group
composed of Totonicapan, Quezaltenango, Quiche, and San Marcos, the
average investment was Q179.per farm, whereas for the other three
it was Q79 or only about half as large. The higher figure for
Quezaltenango was due to the presence of fairly large flocks of
sheep on some farms. Sheep were almost totally absent in Chimaltenango.

V. NAHPOWER AND TECHNOLOGY
The Labor Force
Taking the group as a whole, 42 percent of the family heads
reported they were the only ones employed on their farms; family
head and wife constitute the labor force on 11.5 percent of the
farms. In another 27.6 percent; the labor force was made up of the
head and his sons; in another 17.5 percent the entire family worked,
including the wife as well as the husband and children (Table 19).
Thus the farms in the Western Highlands may appropriately be called
family farms.
Half of the 58 percent of farms, where the head was not the
sole person workingIemployed peons (or mozos, as they are usually
called in rural Guatemala). As might be expected, 5/44 percent of
the hired labor was on farms having a cultivated land area of more
than two hectares; the percentage dropped to 28.6 on the farms with
the cultivated land area that averaged between one and two hectares;
while ,;nly 16.9 percent were on those having less than one hectare
of crop land)
Our data confirm those of the anthropologist, Sol Tax, who
found that women shared in all the work of farming except 'Masks
considered too difficult for women--preparing the soil for corn,
making garden teds, planting coffee bushes; and only men (using the
trumpline) carry heavy loads.n2
in order to obtain the data relating to labor units each farmer
was asked how many man-days of labor were used in land preparation
and how it was prepared. tie was asked about the labor inputs in
planting and cultivation, including the time spent on herbicidal weed
control and insect control with pesticides, harvesting, threshing,
shelling and winnowing. This kind of questioning was repeated for
each of the major crops--corn, frijoles, wheat, and potatoes.
1These percentages are calculated from a random sample of one-
third of the 348 farms.
2Sol Tax, Penny Capitalism: A Guatemalan Indian Economy, Smith-
sonian Institution, Publication No. 16 (Washington, D.C., 1953), pp.
90-95. Also see Wagley, 22. cit., Bunzel, op. cit., for other an-
thropological descriptions of customs concerning agricultural prac-
tices which prevailed in some Highland communities. Some of our
informants told us they still consulted the local shaman who deter-
mined the appropriate day for planting. Some also still complied
with the semi-pagan rituals prescribed for the planting ceremonies.
-42-

Table 19.
Composition of Family Labor Force
Employed on the Home Farm
Department
Total
Head Alone
Wife and
Head
Head, Wife
and Sons
Head and
Sons
Other
No.
Percent
No.
Percent
No.
Percent
No.
Percent
No.
Percent
Chimaltenango
100
53
53.0
11
11.0
88.0
25
25.0
33.0
Totonicapgn
44
19
43.2
49.1
818.2
12
27.3
12.2
Quezaltenango
22
12
54.4
4.
18.2
627.3
Quichd
65
14
21.5
17
26.2
18
27.7
16
2148.:
Huehuetenango
27
13
48.2
27.4
725.9
So1o16
70
28
40,0
45.7
10
14.3
27
38.6
11.4
San Marcos
20
735.0
210.0
630.0
525.0
Total
348
146
42.0
40
11.5
6t
17.5
96
27.6
51.4

- 44-
Table 20.
Average Man-Monthsa of Labor of the Operator and Other
Family Workers in Production of Principal Crops
By Size of CultivatrA Area
HectaresCultivated
!AverageHectarePer Farm
I NumberofFarms
Percent
'AverageMan-MonthsEmployedb
AverageMan-Months!Employee]
Under 0.5 0.27 83 23.9 1.0 1.70
0.5 to 0.9 0.72 92 26.4 1.85 3.18
1.0 to 1.4 1.25 53 15.2 2.96 4.98
1.5 to 1.9 1.73 46 13.2 3.14 6.69
2.0 to 2.4 2.18 27 7.8 3.34 6.73
2.5 + over 4.80 47 13.5 4.51 11.74
Total 1.49 348 100.0 2,65 5.68
a0ne man-month is defined to consist of the labor input of a male
adult for 26 days, each day being nine hours' duration,
bEmployment period includes time in land preparation, cultivation,
harvest, and threshing. These figures are for the labor provided by
the head of the family only.
cThese figures include labor of the head of the household and his
family.

-45-
The family labor used on the farms increased from 1,70 man-months on holdings of under 0.5 hectares (average 0.27) to 11.74man-months on farms of 2.5 hectares or more, Of this, one man-monthof a total of 1.7 man-months was supplied by the operator on thesmallest farms; and on the largest farms the operator supplied 4.5man-months.
If we use the number of man-months used by the head of thehousehold and his family on the farm, the amount of labor required tocultivate an average farm of 0.27 hectares increases from 1.0 man-month to 1.7 man-months. We believe that man-month figures whichinclude the labor of the head of the household and his family area more accurate estimation of the amount of labor inputs used by thehighland farmer than those figures that consider the labor input ofthe head of the family alone. Table 20 shows that the number of man-months employed on the farm increases as the size of the farm in-creases.
Table 21 shows that the intensity of labor use on the farm doesnot vary significantly among various departments. This fact suggestsa high degree of homogeneity among the peasants of the Guatemalanhighlands with respect to the use of labor in.farm activities.
Table 22 shows that the input of man-days by the operator doesnot vary significantly within given size groups, irrespective ofwhether he hires help or not. The intensity of labor use per hectaredecreases dramatically as the area cultivated increases.
Usually, one day of the week was spent at the local market.If the aldea was a part of a large community with regional drawingpower, many spent time at those markets as well, whether or not theycarried anything to sell, because marketing is a social as well asan economic process with the Indian.
Farms were classified into three groups according to area cul-tivatedland within each category corn yields per hectare, averageman days allocated to corn cultivationland the yields per man daywere calculated separately for farms that hired labor and thosethat did not. On the farms with the largest cultivated area, therewas little difference between the two groups (Table 22). The yieldper hectare of corn was about 50 percent greater on the medium-sizedfarms that hired help compared to farms in that same interval thatdid not hire help. in the smallest area cultivated class, the dif-ferences in yield per hectare were even greater.'
These differences are most suggestive, indicating that farmerswho hire labor also buy other productive inputs and/or make a moreefficient use of the resources at hand. In order to estimate factorproductivity among farmers that do not hire labor and among thosethat do hire labor, a production function for each category was

-46-
Table 21.
Average Man-Montha of Labor of the Operator and Other
Family Workers in Production of Principal Crops
by Departments
DepartmentAverageHectaresper Farm
AverageMan-MonthsEmployedb
AverageMan-MonthsEmployedc
Chimaltenango 1.41 2.81 4.80
Totonicapgn 0.64 1.74 4.13
Quezaltenango 2.06 1.71 3.37
Quich4 1.00 1.85 3.90
solo] g 1.11 1.96 4.00
San Marcos 2.46 . 3.02 7.29
Huehuetenango 1.74 2.16 5.23
Total 1.49 2.17 4.67
aOne man-month is defined to consist of the labor input of amale adult for 26 days, each day being nine hoursiduration.
bEmployment period includes time in land preparation, culti-
vation, harvest, and threshing. These figures are for the laborprovided by the head of the family only.
cThese figures include the labor of the head of the householdgahis family.

-47-
Table 22.
Milpa Productivity (Maize) With and Without Hired Labora
Area Cultivated FarmsAverageQuintals
Per Hectare
AverageMan-Days
Per Hectare
AverageQuintals
Per Man-Day
Over 2 Ha.
With hired help 18 16.7 37.4 0.45
Without hired help 10 18.8 35.7 0.50
1 to 2 Ha.
With hired help 10 26.9 63.3 0.42
Without hired help 26 18.2 67.1+ 0.27
Under I Ha.
With hired help 4 27.6 72.0 0.38
Without hired help 32 14.6 80.5 0.16
aCalculations based on a random sample of one-third of thequestionnaires.

48
calculated. As a regression equation a function which is linear in
the logarithms was used. Production functions of the Cobb-Douglas
type belong to this class of functions. The estimated production
functions are:
Y 91 L'08
C-77
Y = 110 L19 C71
Farmers that do not hire labor
Farmers that hire labor
where Y refers to-total agricultural output measured in-dollars;
L-refers to labor -use on the farm by the head of the household and
his family measured in man-months; and C refers to cultivated land
measured in hectares. Table 23 summarizes the statistical results.
The average percentage of the variation in the dependent vari-
able which is associated with the independent variables is given by
the coefficient of multiple determination. These coefficients are
a measure of the goodness of fit of the estimated regression equation.
It is desirable that the coefficients of multiple determination be as
close to -unity as po;sible. Coefficients of determination of 0.62
and 0.67 indicate, we believe, that our fitted function adequatelycharacterize the data. The coefficients of determination indicatethat for the farmers that do not hire labor, 62 percent of the
variation in the value of agricultural output is ',explained!! by the
factors of production considered in the analysis. .The corresponding
figure for farmers who hire labor is 67 percent.
The regression coefficients of the function we fitted to ourdata are elasticities, i.e., they indicate the percentage changes
in output which on the average will result from a one percent change
in the input of the fattors of production. For example, an increase
of one percent in the amount of land for farmers that do not usehired labor is associated, on the average, with an increase in agri-
cultural output of 0.77 percent. On the other hand, an increase of
one percent in labor will result in an increase of only 0.08 percent.
The values of the estimated elasticities indicate that increasesin family labor inputs will result in higher increases in output for
farmers that hire labor than for those who do not. But on the other
hand, increases in land inputs will result in higher increases inoutput for farmers that do not hire labor than for those who do
hire labor. For both kinds of farmers land seems to be the most im-
portant factor of production, but land is relatively more important
for farmers who only use family labor than for those who hire labor
inputs in addition to the labor force provided by the family.
Each of the elasticities calculated is less than one, henceindicating diminishing marginal returns for each factor of production.In other words, a one percent increase in input of land or laborwill result in an increase in the value of production of less than
one percent, but in addition the return per unit of a given resource
will decline as more of it is used, holding the others constant.

-149-
Table 23.
Regression Coefficients, Average and Marginal Productivitiesand Related Statistics of the Estimated Production Functions of Farmers
Who Hire Labor and of Those Who Do Not Hire Labor
Item
Value of Elasticities:*
Labor
Land
Sum of Elasticities
Partial Correlation Coefficients
Labor
Land
Multiple Correlation Coefficients
Coefficients of Determination
Average Products at Resource Means:
Labor ($ /Man-Month)
Type of Farming
Not HiringaLabor
Hiring Laborb
.08 .19
.77 .71
.85 .90
.08 .22
.60 .65
.79 .62
.62 .67
.
27.60 47.90
Land ($ /Ha.) 111.70 1: 35.30
Marginal Products at Resource Means:
Labor ($ /Man-Month) 2.20 9.20
Land ($ /Ha.) 86.00 96.00
Average Value of Variable Capital 71.38 157.02
Average Value of Agricultural Pro-duction at Resource Means 134.00 251.00
*All elasticities are significant at 5% and 1% levels, exceptthe one for farmers that do not hire labor which is significant at10% level. By the F ratio test the null hypothesis that all re-gression coefficients are equal to zero was rejected at 5% and 1%levels.
aThe number of farmers in this category is 198.
bThe number of farmers in this category is 131.
-50-
The sum of the elasticities indicates that if, as an average,
land and labor are increased by one percent the value of the agri-,cultural output is increased by only .85 percent for farmers that
do not hire labor and by .90 percent for farmers that hire labor.
Production functions of the Cobb-Douglas type permit us toobserve the phenomenon of returns to scale. The sum of the estimated
input coefficients is taken as an indication of the returns to scale.
If this sum is smaller than one it indicates decreasing returns to
scale; if it is equal to one it indicates constant returns to scale;
and if it is larger than one there are increasing returns to scale.
Our analysis suggests the presence of decreasing returns to scale among
the two categories of farmers we are studying. This means that an in-
crease in the inputs of all factors of production by a given percentage
will increase agricultural output by less than this percentage.
Marginal productivities indicate the returns that might be ex-pected, on the average, from the addition of the various resources.For example, an additional man-month-of the family labor force of
farmers that do not hire labor will increase the value of agricul-tural output by $2.209
From Table 23 we can see that factor productivity (as indicatedby the values of average and marginal productivity) of the two mostimportant factors of production is hipher for farmers that hire laborthan for those who do not. Marginal productivity of labor calculated
at its geometric mean - is over four times higher for farmers that
hire labor than for those who do not. Marginal productivity of land
calculated at its tiebmetri-c- mean is also higher for farmers that hirelabor than for those farmers that employ only family labor in the pro-duction of agricultural output.
We do not know what the factors are. that cause these differencesin productivity. One factor to consider is the differences in manager-ial skills between the two groups of farmers. Another important con-
sideration is the tIuality of the land. Unfortunately we do not have
information necessary to incorporate these considerations in the
analysis. Nevertheiess, we have information about the differencesin the value of variable capital (agricultural tools, horses, etc.)
between the MO groups of farmers that could help to explain differ-ences in productivity. As can be seen from Table 23, farmers thathire labor own, on the average, twice as much variable capital asthose farmers that only employ the family labor forcein the produc-tion of agricultural output.
Response to Innovation
Comparison of corn and wheat yields obtained with and withoutthe use of fertilizers suggests farmers obtain a positive response
to fertilization. However, the data are not adequate to indicatewhether this activity is profitable (Table 24).

- 5 1 -
Table 24.
Response of Corn and Wheat to Fertilizer Applications
(Quintals per Hectare)
Department
Corna Wheat
WithFertilizer
WithoutFertilizer
WithFertilizer
WithoutFertilizer
Chimaitenango 23.3 14.7 21.4 11.6b
Totonicapdn 24.7 13.4 22.8 12.4
Quezaltenango 24..6 22.4
Quichd 25.5 11.9
Solold 18.8 13.3 27.4 9.3c
San Marcos 19.0 16.1d 25.1. 22.4
Huehuetenango 14.5
Average 22.8 13.3 24.5 12.8
aA total of 170 farms reported using fertilizer during the current
crop year and 173 did not.
b Excludes:one finca that reported a yield of 47.3 quintals per
hectare.
cExcludes one finca that reported a yield of 69.8 quintals per
hectare.
Excludes two fincas that reported a combined yield of 42.9
quintals per hectare.

-52-
Without fertilization, the average corn yield per hectare was13,3 quintals and with fertilization the yields of corn rose to 22.8quintals, These figures seem to compare favorably with those givenby Stadelman. He found that when the fields were fertilized withmovable sheep corrals they would yield around 23 quintals per hectareand when the same lands were not fertilized their yields dropped toabout 14 quintals per hectare. Apparently the communities we studiedin Huehuetenango were of the latter type, because the farmers in thatarea used neither animal manure nor chemical fertilizer and they hadyields of only 14.5 quintals.3
The western Highland Indian has long recognized the importanceof animals in the farm system as a source of fertilizer for crops. As
Stadelman pointed out, for the Huehuetenango Indians he studied, The
one factor that has made it possible for the Todos Santos Indian topossess a permanent and continuous maize culture on the same lands is
fertilization. 4 Stadelman describes the process by which the Indianfenced in his sheep for periods of time in small enclosures within themilpa and when the manure and urine had penetrated that piece of ground,the enclosure was moved to another part of the field. We found thatsheep and chicken manures were carefully saved and applied as fertilizers.Another common practice'was that of using kitchen waste to make a mulchof corn, leaves and other dead vegetative matter. According to our infor-
: mants, the mulch was used to:control.erosion and to increase fertility.
The use of chemical fertilizers is a recent innovation in theHighlands, brought about through the campaigns and help given by thecooperatives that collaborate with the Gremial Nacional de Triguerosand through the advice and help of the Servicio de Fomento de la EconomfaIndigena (SFE1), which is a national extension service type of programcreated to aid the Indian population of the country. In general,
farmers were more prone to apply chemical fertilizer to their wheatfields than to corn. Part of the difference can be ascribed to thegreater preSsure to use chemical fertilizers in wheat production becauseof the campaigns of the two agencies, one of them almost exclusivelyinterested in wheat which they hoped would come to their mills forgrinding. There were other reasons, however, for the difference.Some told us the tortillas had a strange taste when made from cornthat was grown on chemically fertilized soils. Others said they didnot apply chemical fertilizer to.potatoes because the buyers in theirarea refused to pay standard prices for the product; they were told
3Raymond Stadelman, "Maize Cultivation in Northwestern Guatemala,"Contributions to American Anthropology and History, No. 33 (Washington,D.C., Carnegie Institution of Washington, 1940), p. 117. A more recentstudy by the Comite Interamericano de Desarrollo Agricola (CIDA) foundyields in the altiplano quite similar to ours: corn about 17.25 quintalsper hectare and wheat 12 quintals per hectare where the land in thelatter crop is not fertilized. a. cit., p. 119.
149.2, cit., p. 164.

- 53 -
that the housewives do not like the produCt. In Ixtiapoc, one of the
villages studied in Huehuetenango, we were told "chemical fertilizers
make the land sick" ("el abono enferma latierra"). In this community
natural fertilizers were .not used because there were so few animals and
ignorance did not allow the introduction of chemical fertilizers.
We have already referred to the lack of machinery; the only modern
tool we could classify in this category is the hand spraying machine,
which we found on 33 of the 348 farms. Twenty-six of the 33 were owned
by farmers in Quezaltenango and the two communities serviced by the
cooperative of San Andres Semetabaj, all three communities being located
in the sphere of influence of the. National Wheat Growers Association.
Transportation
Since wheat was..the principal commodity produced for the market,
our comments concerning transportation apply mainly to this product.
We found that approximately 40 percent of those who grew wheat had
their threshed grain picked up by the trucks of the National Wheat
Growers Association cooperatives or by the associations organized by
SFEI. Another 35 percent carried the grain to market on mule*horseback, while the remaining 25 percent depended on carriers who made
their living working as human beasts of burden.
The small proportion of corn that was sold went to market also
on the shoulders of these same carriers, or less frequently, 'it was
taken to the market when the operator and his wife traveled there on
the bus. For a small fee, local busses carted baggage on the roof.
tops and in the rear seats--the loads often outweighing the passengers
themselves.
Credit
The average amount of credit obtained per farm was Q16,111 but
only 10 of the 348 families had obtained individual loans in excess
of mo.op during the agricultural year. Two obtained Q300.00 each
from the.National Agrarian Bank in Chimaltenango, one to plant four
cuerdas of potatoes and the other to pay the salary of his mozos.
Another obtained Q150.00 from the Bank in Totonicap4n to plant 52.5
cuerdas of corn and 17.5 cuerdas of wheat. Three of the families in
Quezaltenango obtained credit, two from private sources and the other
from the bank. Two families borrowed from private sources in Quiche,
paying interest at the rate of three percent per month, to finance their
cottage industries; one obtained.4400.00 to finance his hat making
activities and the other Q300.00 to buy yard goods or telas. There
were two borrowers in Solola; one obtained Q290,00 fra7rfriend at
five percent annual interest to pay the wages of his mozos; while the
second obtained Q168.00 from a local liquor distributor to finance
his own "negocio de licores." Another 55 (16 percent of the remaining
338 families) said they had used small amounts of credit for one pur -.
pose or other during the year; their borrowings averaging Q28150 each.

- 54 -
One credit agency that could have an important role in' the develop-
ment of.Highlandd agriculture, the Servicio Cooperative Interamericano%de
Credit° Agricola Stiper.v4-sado (Cooperative Se'rvice of Supervised Agrrcul-
tural Credit) was ,rarely:encountered. The only .evidence we found of its
presence in the area was in the collaboration it provided the wheat
producer cooperatives that had, in turn, been approved for service
by the Programa de Desarrollo Agrario de la Naci6n (Program of Agri-
cultural Development of the Nation). The absence of SCICAS undoubtedly
is explained by the limited budget under which it operates. The other
credit agency that was created to cater "exclusively to small farmers,'1
according to its charter, is the Banco Nacional Agrario, but like
SCICAS, it operates on a restricted budget and has only been able to
accommodate a limited number of families in our sample population.
Agricultural credit has been totally ineffective as a developmental
factor among the small Highlands farmers. In view of these facts, it
is not surprising to find so critical and pessimistic a commentary on
the problem as was contained in the CIDA report:
This leads to the strong presumption that the overwhelming
majority of the funds available for agricultural credit is
distributed among the medium and large-sized operators, who
have access to and who also have the necessary financial
worth to qualify for such credits....This (policy of dis-
crimination against the small farmer) can be understood
from the purely economic point of view, where capital is
invested where its marginal returns are greatest; unfor-
tunately, however, this situation aggravates the social
problems resulting from unfair patterns of land tenure.5
Extension Services
The wheat growers' privately organized cooperatives were more
influential in stimulating change than the government agencies, be-
cause of their more aggressive sales campaigns with personnel better
qualified than those in the government sponsored SFEI organization
and because of their superior transportation and credit facilities.
SFEI has not made a great impact in the region in which it was designed
to work. The enthusiasm which was responsible for its creation a few
years ago has long since waned and consequently, its programs have been
restricted. In general, we found the SFEI far out of step and behind
the communities which the dynamic (even in a traditional society) pro-
cesses of social change had altered in the decade since the agency
was created. The Agricultural Extension Service of the Ministry of
Agriculture was rarely encountered. Apparently its personnel and pro-
grams are concerned with parts of the agricultural economy of the
country other than those represented in this study. The single ex-
tension service activity we encountered was the work of the inspectores
of the Institute Agrario Nacional (IAN) who collaborated with the
private wheat producers' association, the Gremial Nacional de Int-
gueros, in Chimaltenango, Solole, San Marcos, and San Andres Semetabaj.
5CIDA, 2R. cit., p. 180. The same observations concerning the
inadequacies of the current credit of the governmental agencies and
contained in the OIT lnforme, 22. cit., p.

-55-
Their function seemed to be to audit the books of the cooperativesthat had received governmental loans. A few, in addition, promoted theorganization of youth clubs among the members of the cooperatives. We
found no other evidence of extension service activity among the High-land peasant farmers.

VI. SOURCES OF INCOME
There are three principal'sources of income for the people of the
Highlands: from farming on their own where a substantial part of the
production is consumed directly; from supplementary employment within
their home communities; and from earnings received as a migratory farm
laborer in commercial agriculture, mostly in the coastal region.
The gross value of annual production per farm varies, as would
be expected, directly with the size of farm. The average value per farm
in this study was $207.55 (Table 25). Of this amount about one half was
sold and the other half consumed by the family. If account is taken of
the area cultivated per farm, the farms with the smaller area cultivated
sell a smaller proportion of the total product than the larger (Table 26).
Although the proportion of the crop sold is not correlated precisely with
the area cultivated, it may be noted that for farms under 1.5 hectares
in size, about two thirds of the total amount (less than 40 percent) is
sold, while for farms over 1.5 hectares in size, about 56 percent of the
crop is sold.
Since the Highland area is a low income farming area from which a
considerable number of campesinos are known to migrate annually to the
coastal region for employment as agricultural laborers, the net family
incomes of the campesinos interviewed were calculated separately accord-
ing to whether or not they were migrant farm laborers. Twenty percent of
the respondents were migrant workers (Table 27).
The net farm income of the migrant was smaller in all departments
than for the cultivators who did not migrate, although the difference
was negligible in Totonicapdn. For the group as a whole, the net farm
income of all migrants was Q99.63, compared with QI69.90 for those not
migrating. Thus, net agricultural income for non-migrants was 70 per-
cent higher.
The farm income was also supplemented by income earned in the
local communities by working as hired laborers, craftsmen or petty
traders. Income so earned again was not evenly distributed. Migrant
farm workers were less successful in earning extra income locally than
were those who did not migrate. In the group as a whole, the average
annual supplementary earnings received locally were Q27.93 for the
migratory laborers and Q98.81 for those who did not migrate (Table 27).
As noted in Table 25, the average combined income earned locally
by the respondents was Q239.22 per family. Again the incomes of non-
migrants were much larger, more than twice as large on the average, as
migrants, Q268.71 compared to Q127.56.
The source of these supplementary earnings varied greatly among
communities. In the communities where raw cotton or wool was available,
spinning and weaving provided a handsome supplement to farm earnings.

- 57 -
Table 25.
Average Value (Quetzales) per Finca of Gross Annual
Product icon Classified According to. Area Cultivated (Hectares)
Under
0.5
2.5 Ha.and
DepartmL(21211125:0231.0-1,4 .5 -1 ..9 2.0-2.4 over A .
Chimaltenango 37.70 118.35 197.95 248.30 242.00 498.50 208.00
Totonicapb 37.95 73.15 99.35 92.00 339.50 --- 69.90
Quezaltenango 66.55 72,60 75.00 719.00 ...... 1190.00 382.70
Quichd 67.05 106,40 169.75 231,65 468.50 496,25 145.95
Solold 62,90 60.75 194.90 183.75 238.60 621.05 308.35
Huehuetenango 33.55 49.30 207.00 97.00 211.35 420.65 108.05
San Marcos ..... - 69,00 148.20 271.50 446.80 757.50 297.20
Average 50.95 93.70 179.40 239.45 299.20 629.55 207,55
Table 26.
Value of Annual Gross Production Sold Per Finca (Quetzales)
HectaresCultivated
Numberof
Fincas
Average ValueGross AnnualProductionPer Finca
,,
Average Vatue.Product Sold
Per Finca
PercentageProduct SoldPer Finca(By Value)
Under 0.5 83 50.95 17.30 34.0
0.5 - 0.9 92 93.70 33.40 35.7
1,0 - 1.4 53 179.40 70.00 39.0
1.5 - 1.9 46 239.45 120.35 50.3
2.0 - 2.4 27 299.20 125.30 41.9
2.5 and over 47 ,629.20 393.30 60.0
Total 348 207.55 102.35 49.3

-58-
Table 27.
Annual Family Incomes of Migratory and Non-Migratory
Farmers in Their Home Communities(Quetzales)
Department
Number ofFarmers.
nterviewed
Net Agricul-tural Incomes
Other Income Total Income
in Community in Community
PliaglIman22
MigratoryNon-migratory 69
Totonicapn
31
Migratory 7
Non-migratory 37
Huehuetenang2
Migratory 11
Non-migratory 16
quich4
Migratory 7
Non-migratory 58
Solo14
Migratory 8
Non-migratory 62 ,
San Marcos
Migratory 7
Non-migratory 13
Quezaltenango
Migratoryb .
Non-migratory 22
$115.26 $ 20.88
215.15 50.50
44.43 55.8545.48 154.46
61.58 23.55
106.16 55.07
44.37 46.89
96,31 138.90
120.25 33.61
259.48 89.86
205.76 12.86
269.28 58.75
. .
170.00 131.86
Average of total
Migratory 71 98.00Non-migratory 277 166.00
32.00
97.00
$136.14265.50
100.28199.94
85.13161.23
91.26235.21
:153.86349,34
348 132.00 64,50
218.62328.03
301.86
130.00
263.00110010101*.m.=10
aNet agricultural income calculated by deducting all farming costs
from the gross value of production.
bNo cuadrilleros were interviewed in Quezaltenango in this study.

- 59 -
,
This was especially true of the villages studied in San Marcos, Quiche,
and Totonicapdn. Not only were the returns profitable, but these sup-plementary tasks also provided the basis for a permanent cottage industry
(industria casera). This gave the families who participated a permanentresidence and they did not become exposed to the problems that plague
migrant labor families.
When employed at piece work, especially in the making of blouses oritiistiles as Guatemalans say, the more skilled and industrious farm wivesreported earnings that were in excess of the average farm production, or
over Q207.55. Basket makers reported family earnings of Q328,00, hatmakers Q120.00, and shoe makers from Q312 to Q542. No wool carding orspinning families fell into the sample so we cannot report on supplemen-tary earnings for that product. Carpenters earned from Q158 to Q419,
masons 060, and kindred skilled workers Q787 during the year. TheSce.,
figures might vary, depending on the proportion of the worker's timegiven over to such employment.
The quarries es well as the kilns are usually owned by the wealthierlandlords who rent them out to the small farmers when they have spare timefor lime making. In Patzaj, for instance, we found 32 kilns owned by nineindividuals, which were usually in operation only when they were rentedout on a share basis--the owner of the pit and the kiln receiving one-thirdof the baked lime. The work, including the arduous labor involved in carry-ing the stone from. the quarries to the kilns, was done by men and boys.The adult carriers were paid Q0.50 for the tarea of work performed. The
boys were paid Q0.35 for the same task. This meant that all the stonethat had been quarried at a distance of about 300 meters, would havebeen carried to the site of the kiln, a task that took ten or more hoursto finish.
In these same communities, women used the local clay to fashionpots, bowls and water vases of various sizes. Since the shaping of thepottery was done by hand without the aid of a potter's wheel, we askedif they did not know how the wheel might be employed. "Only vaguely,"their husbands replied, but they would like to have someone come totheir community to help build and demonstrate the wheel, We were in-formed that the women who spent their spare time at such work couldfinish an average of five pots per week, which in turn were sold forQ0.20 to Q0.30 each depending on size, in the nearby market at Sta.Apolonia or Tecpan.
In another of the caserfos, a principal source of supplementalincome was the gathering of firewood. It was sold in the same nearbymarkets but yielded no more than 00.50 for a day's labor, includingcarrying the wood to the market.
As noted above, only one-fifth of the 348 family heads had par-ticipated the preceding agricultural year in the annual migration ofharvest workers to the coffee and cotton haciendas of the Pacific
-60-
Coastal slopes. The migrant workers did not come from all departmentsin equal proportions. Moreover, workers seemed to come from certaincaserles within departments. For example, among those interviewed inthe department of Chimaltenango, none who lived in Chimazat participatedin the migrant movement; those who went were from the farms in theComalapa and Sta.. Apolonia municipios. The same was true of Solo16-theCampesihos of Los Canoes, an aldea of San Andr6s Semetabaj, stayed home,while almost all among those who were interviewed from the departmentWho went were from Santa Catarina Ixtahuacan. In this respect, our find-ings differ from those of Adams who found that -People from almost allthe highland communities in which there are no large fincas participatein labor migrations."1
As would be expected, most migrants were from the lower incomefarms. The data suggest that 25 percent of the operators of fincasunder one hectare in crop land participated in the migrant stream tothe coast along with 22 percent of the operatorS of fincas with morethen one but under two hectares of crop lantl,'.and'ohly 14 percent ofoperators from fincas with more than two hectares of crop land.
Contrary to our expectations, there was only a slight difference inthe average age of the "migrant" and the operators as a whole-40.2years and 42.7 years, respectively. As a general rule, migratory laborerscome from the younger ages, but here we found the low average farm, incomeoperating as a "push'" factor causing the migrants. to come, from all age
groups.
Considering the sample as a whole, the average migrant returned homewith Q31.55 cash in his possession. This is an average of approximatelyQ15.00 per month for the two months' sojourn on the coast and compared toprevailing farm wages in the Highlands, it is only a little over thehighest daily rate paid in. the area, which we found to have been 50 cents(centavos).
When incomes from all sources are combined, the average incomereported per family for non-Ttorants was Q26%..000 for migrants Q/6/156,with an overall average of Q2,1410.5 (Table 28). it is then clear thatthe migrants are the poorer persons by far. Although the net cashearnings reported from such employment were only 01.55, the workersdid have some sort of subsistence while they were so employed.2
. '
1
Adams, 9.2. cit., p. 304 (underlining ours). (The findings ofthe Schmid study, "The Role of Migratory Labor in the EConomic Develop-ment of Guatemala" lend support to Adam's interpretation.) Ed.
2This aspect of the problem has been studied in depth by Schmid,
a. cit.
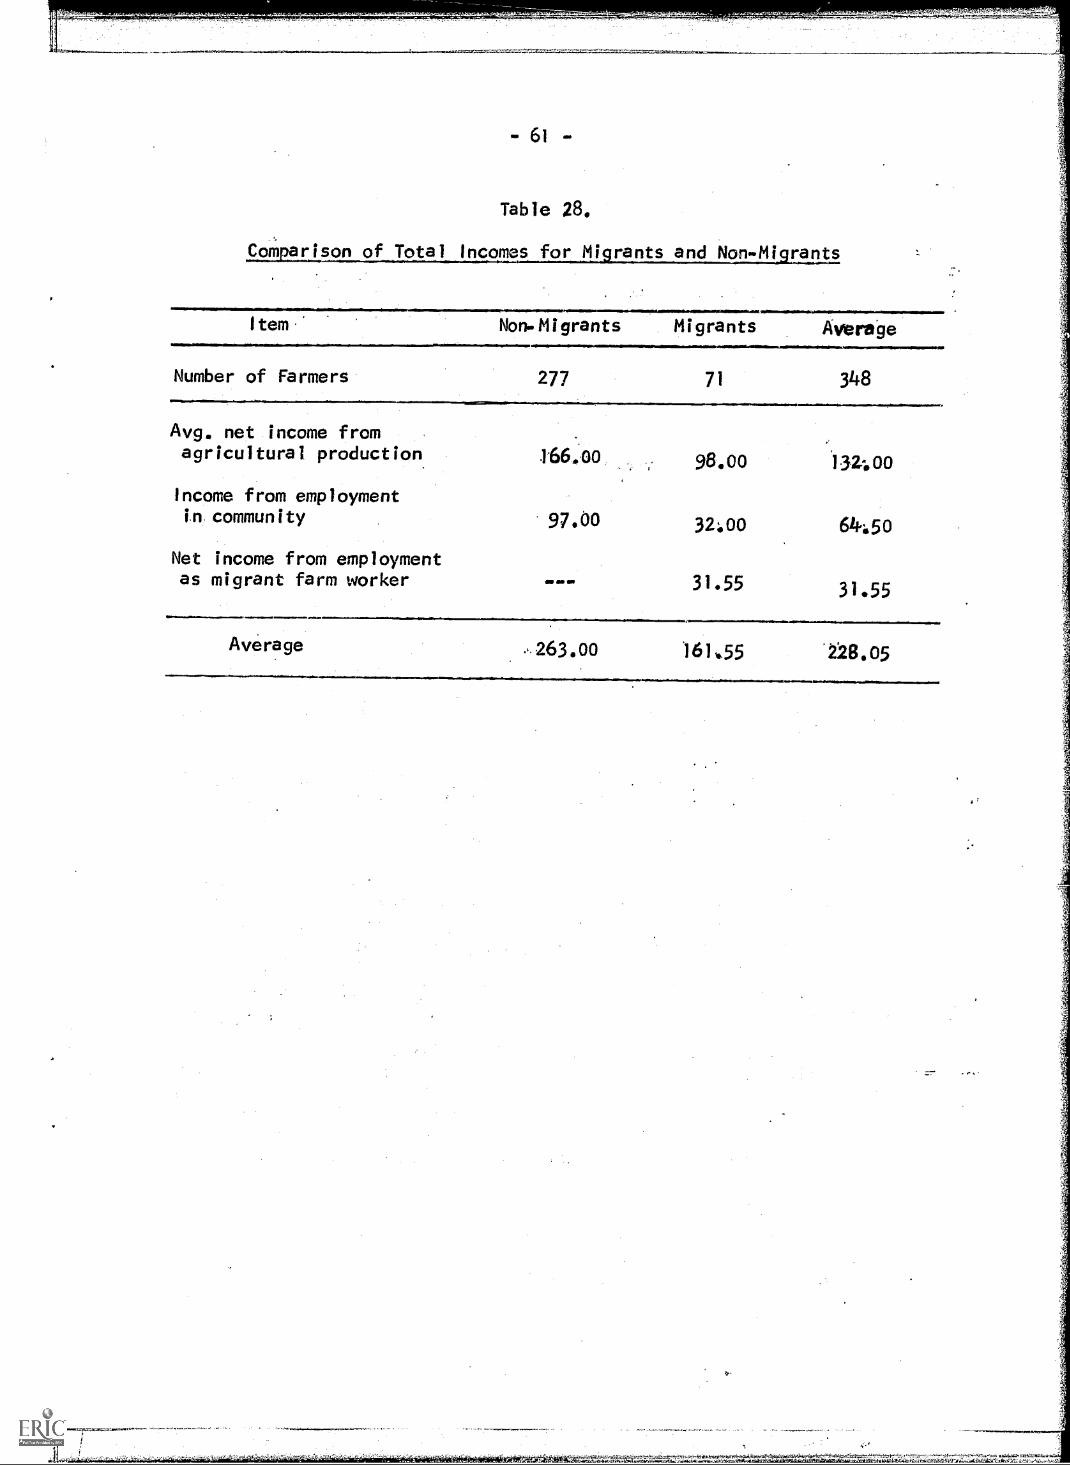
- 61 -
Table 28.
Comearisongi121allnccilqLfor Mi rants and Non-Mi rants
Item Non-Migrants Migrants Average
Number of Farmers 277 71 34.8
Avg. net income fromagricultural product ion 166.00 98.00 132400
Income from employmentin community 97.00 32.00 64:50
Net income from employmentas migrant farm worker - -- 31.55
31.55
Average .,263.00 16455 228.05
..mIIIMMI.mlumwlwlawm.u1INNNNdIMMD

P VII. STANDARDS OF LIVING
The most striking fact about family expenditures of the persons
interviewed is that '67 percent of the total-was spent on food. Such a
proportion is.fairly representative of the.wenditures of low income
people all over the underdeveloped world...
An annual'food budget of Q250.00 (Q144.80 purchased and Q105.20
provided by the finca), shared by a family of five,' allows approximately
one quetzal per member per week for food. Two-thirds of the farmers
interviewed ate the same foods for breakfast, .lunch and evening dinner--
tortillas,,a variety Of tamales, frijoles', pane lad salt, and coffee.
Only the amount would vary--there was generally more for the evening
meal. Some used a pepper or chili sauce to spice the tortillas. About
one third of the men' said they had rice and a vegetable in addition to
the ever present tortillas. Only occasionally was the diet fortified
with meat,.eggs, or cheese, and then for, one meal of the day only.
The houses in which the majority of the sample lived were construc-
ted from, materials most prevalent in the respective areas and the con-
struction type conformed to the variations in climate. In our sample, we
found the most frequent wall construction to be of adobe, with approxi-
mately two-thirds covered with a tile roof, and one-third with thatch
roofs (pale). Very little metal roofing of any kind has made its ,appear
ance in rural Guatemala.
When the rancho has nothing but wattle and daub walls 0.1212tIs de
2212 1 lodo) and the roofing is thatch, then the adobe is more apt to be
called a choza, termed construccitin de bahareque. Such housing was more
prevalent in the lower reaches of the altiplano.
We found a most interesting change in housing taking place in the
municipio of San Andres Semotabaj. Were the peasants have shifted to
wheat cultivation in recent years, under the influence of the cooperative
in that community. The Increased income is being used to replace mud-
walled, thatched-roof huts (bahareques) with modern adobe and tile build-
ings. The effect is startling and noticeable as one approaches the
community.
About one-fourth of the sample families lived in single-roomranchos, with nothing more than a bench outside to make living more com-fortable than is possible when a family sleeps, cooks, eats and lives in
a single-roomed enclosure.' Three-fourths of the families, however, lived
in ranchos that had several rooms and very often there was a sweat bath
(temascal) of adobe, a structure not more than seven or eight feet square,
1When the single room home was all that the family had, we gener-ally put this into the "choza" rather than the"rancho" class. Finca
and farm are used interchangeably in this study.
-62-
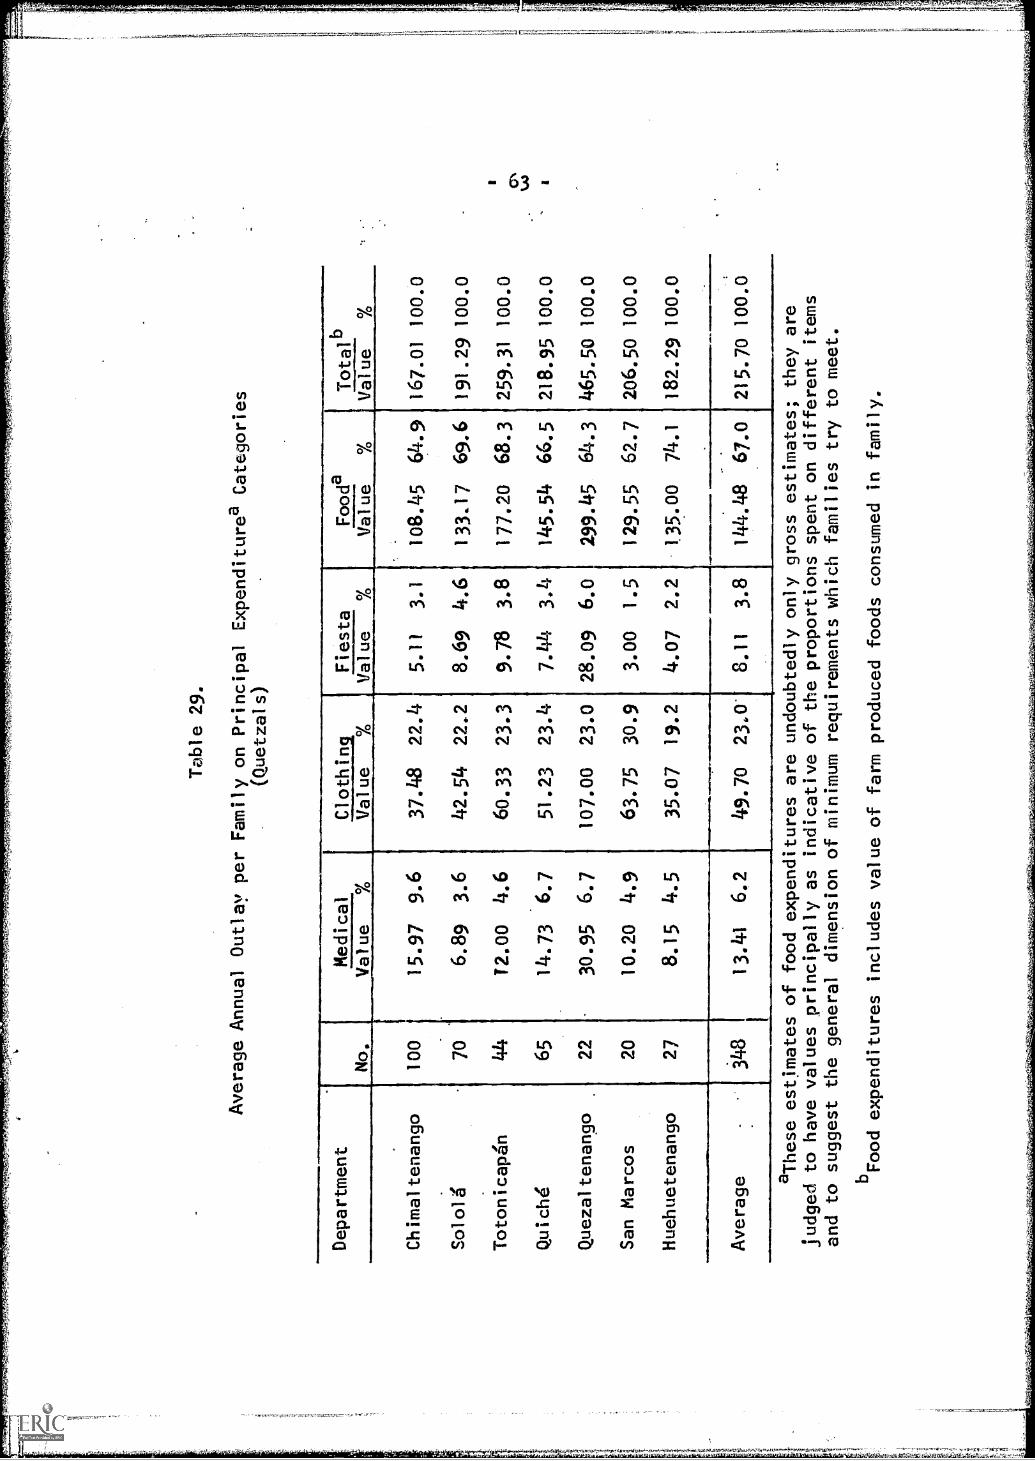
--
Table 29.
Average Annual Out
per Family on Principal Expenditurea Categories
(Quetzals)
Department
No.
Medical
Clothin.
Fiesta
Fooda
Totalb
Value
%Value
Value
Value
Value
Chimaltenango
100
15.97
9.6
37.48
22.4
5.11
3.1
108.45
64.9
167.01
100.0
Sololg
70
6.89
3.6
42.54
22.2
8.69
4.6
133.17
69.6
191.29
100.0
Totonicapgn
44
T2.00
4.6
60.33
23.3
9.78
3.8
177.20
68.3
259.31
100.0
Quichd
65
14.73
6.7
51.23
23.4
7.44
3.4
145.54
66.5
218.95
100.0
Quezaltenango
22
30.95
6.7
107.00
23.0
28.09
6.0
299.45
64.3
465.50
100.0
San Marcos
20
10.20
4.9
63.75
30.9
3.00
1.5
129.55
62.7
206.50
100.0
Huehuetenango
27
8.15
4.5
35.07
19.2
4.07
2.2
1.35.00
74.1
182.29
100.0
Average
:348
13.41
6.2
49.70
23.0.
8.11
3.8
144.48
67.0
215.70
100.0
aThese estimates of food expenditures are undoubtedly only
gross estimates; they are
judged to have values principally as indicative of the proportions spent on different items
and to suggest the general dimension of minimum requirements which families try to meet.
bFood expenditures includes value of farm produced foods consumed in family.

64
with a single opening about three feet high. The Mayan name for the
sweat bath was chul or tul. Some of the more affluent establishments
had granaries, although this was the exception and not the rule.
In both the rancho and choza the floor was of dirt, packed hard
(apelmazada) by constant use and sweeping. Most of the dwellings had
no openings other than the doorway; only the better ones had window
openings. There were no glazed window panes, only shutters and not
always these.
When the kitchen was In the one-room choza or rancho, cooking was
.done over an open hearth fire (t2010 built into one corner. We found
that only 21 of the 348 homes studied had a chimney; a kerosene stove
was even more of a rarity; and we found only five of these. The rest
of the houses had nothing more than chimneyless open fires (Table 30).
We found that 74 percent of the 'homes were lit by kerosene and
less than a quarter of the families dependent upon ocote and candles.
Tax, in his study in the area '30 'years ,earlier, found most families who
lived 111 the village of Panajachel burried sticks of pitch pine (ocote)
to light their homes.
Water for household use .for most families came from a nearby stream
or spring. Approximately a third got their'.Water from wells or cisterns
Cala) which were usually installed in the villages. Very few had wells
of their own. The majority of the homes (87 percent) had no privies or
sanitary faciiities of any kind.
From all that has been said before, it is apparent that we should
not find so significant a communication media'as the newspaper among the
families. Only 24 families in the sample said they did receive them
ITable 31). Twice as many (47) had radios.
Less than one in ten of the heads of households said they were
identified with either local government or church functions in any
official capacity.. Anthropological descriptTons of community life among
the Maya had led us to anticipate that the "community service" respon-
sibilities of the individual would take a significant portion of his time.
Sol Tax, for example, estimated that community work occupied more of the
"usable time" of the. individual in Panalichel than did either marketing
or working for others and most of the time was consumed serving as
local government and church functionaries.2 Charles Wagley, likewise,
gives us a detailed, description of the public services performed by
the naturales of Huehuetenango, where "The political and church organi-
zation of Chimaltenango is an adjustment between their traditional
Spanish-Indian village organization and the statutory requirements of
the modern Guatemalan state." Custom and duty, he says, call all men
for several years.of service in the *rinks of the local government
2Sol Tax, a. cit., pp. 86-88.

Table 30.
Some Selected Items of Family Levels of Living
-
Department
Families
Number of Rooms
Kitchen Faciltties
Windows-
Roof Construction
..
Total
Number
Pf.
.
One
all
pur-
pose
More
than
one
Open
Hearth
and
Chim-
ney
Open
Hearth
No
Chim-
'ney
Itero-
sene
Stave'
Yes
No .
Tile
Wood
Palm
Thatch
Chimaltenango
100
25
75
592
3-
32
68
40
-60
Sol ol d
7o
21
49
565
-27.43
48
121
Totonicapgn
44
440
440
-17- 27
29
15
':
-
Quicht
65
12
53
.3
61
116
49
58
16
Quezal tenango
22
220
318
1 1
814
20
-2
San Marcos
20
515
-20
-7
13
i o
19
Huehuetenango
27
12
15
126
.5
22
20
34
.
Total
348
81
267
If
322
5112 236
225
21
102
Percent
.
-23.3
76.7
6.0
92.5
1.5
32.2 67.8
64.7
6.0'
29.3

Table 30.
(Continuation)
i nuat ion)
Department
.
Floor
Construct ion
Lighting Facilities
Latrine
Source
of Water Suppl y
Spring
Well or
Pila
No.
No.
Di rt
No.
Other
No.
El ec-
trici ty
No.
Kero-
send',
No.
Candle
No.
Yes
No.
No
No.
Stream
or Ditch
No.
Ch imal tenango
96
4-
89
11
991
14
69
17
Sol ol d
65
54
50
16
11
59
11
752
(
Totonicapdn
43
1-
'39
51
43
527
12
Qu i chd
62
3-
44
21
659
13
40
12
Quezal tenango
17
5I
36
13
16
6-
220
San Marcos
20
--
18
22
18
13
16
Huehuetenango
27
--
12
15
-27
616
5
Total
330
18
7258
83
45
303
50
164
134
Percent
.94.8
5.2
2.0
74.1
23.9
12.9
87.1
14.4
47.1
38.5

LFa
Table 31.
Some Measures of Communications
Facilities and Community
and Church Responsibilities of Family
Heads
Department
Newspaper
Radio
Civic Position
Church Office
Yes
No
Yes
No
Yes
No
Yes
No
Chimaltenango
793
595
11
89
17
83
Solold
i5
65
12
58
664
664
Totonicap4n
143
341
44o
242
Quiche
461
857
-65
461
Quezaltenango
Li
18
14
82
20
121
San Marcos
218
515
218
-20
Huehuetenango
126
-27
324
-27
Total
24
324
-47
301
26
320
30
318
I rn
or the church. In the former, at one time or other, most men servedin the position of highest rank, alcalde auxiliar, or at lesser levelsas regidores, mayores, and al.....2,2cles--the latter referring to boys ofseven to fourteen years of age who begin their public rolds.runningerrands and acting as general offici boys. The chief offices in thechurch were the sacrtstanes, the mgyadomos and finally, the excueli whocorrespond to alguaciles in the secular listing. Service in these posi-tions took time and effort, and since they were non-remunerative theyrequired great personal sacrifices in terms of earnings foregone whilein uservicio."3
Although we did not find these customs of great importance, ob-viously they still exist in some Mayan communities. Evon.Vogt in hismost recent paper says that, due to the increase in population and nocorresponding change in the number of church officials, the responsibili-ties of those who serve are greater than in earlier years. Likewise, hereports that in that part of the Mayan area in southern Mexico which hehas stulied, the number of shamans (chiman in Guatemala) if; on the in-
crease.4
The violent political upheavals that Guatemala has suffered inrecent years and the ties which the Citholic Church has maintained withpolitical forces that have resisted attempts at a change of the socialand economic lot of the Indian population'in these same years, have com-bined to alienate the Indian from his customary participation in govern-mental and church affair's. Two recent publications refer to these de.moralizing influences in Indian life, one of them, by Julio HerndndezSifontes, places the blame for this trend squarely upon the Church andthe government. In his discussion, he castigates all the professionsfor giving lip service to the cause of the downtrodden Indian. peasantand on no one is he more. severe than his own profession, law. The 'mono-
graph from which we have cited was the thesis he presented for hisdegree at the San Carlos University of Guatemala in 1965.5
The other recent publication which points out the injusticeswhich have demoralized Indian life in the country is the study made bythe Comite Interamericano de Desarrollo Agrfcola, from which we havepreviously quoted. Among the factors which this study emphasizes asbeing responsible for the present plight of the Indian population areracial discrimination which has effectively excluded him from the socialand economic life of the country; continued victimizing and defraudingof the peasant at the hands of unscrupulous individuals in public andprivate life who have been the organizers of cooperatives, unions, andaction committees on his avowed behalf; and finally the indifference :and outright exclusion of the Highland indian.from governmental credit, .
4
1000.00,10100.0..ImagrammftssOwlssatmll~w010.111werNIMOI
3Charles Wagley, 22. cit., pp. 13-15.
4Ibid., p. 19.
5R221 1ALIREVica delindiona_guatemalteco, Guatemala, Minis-terio de Educaci6n, 1965.

-69-
extension, and technical aid programs.6
The lidemocratic" process of localrevolution'in.19451 abruptly supplantedgovernment. The Guatemalan peasant, innot yet been able to substitute gainfulgiven to the discharge of his. communityobligations.
.
government, ushered in with thethe Indian's "elder" system oftoday's western highlands, haswork for the time previouslyadministrative and religious
6ministerio de Educaci6n, a. cit., pp. 134-135.
=
VIII. EDUCATION
Since education is one of the avenues of advancement in under-
developed countries, we inquired about a few basic aspects of education.
One of these is the ability to speak Spanish, the language of business
conduct and public affairs in Guatemala.
Among the heads of households 13.7 percent spoke only one of the
Maya subfamily dialects, while 86.3 spoke Spanish in addition to a
tribal dialect (Table 32). There was relatively little difference in the
proportion of members of. each of the four language groups who could speak
Spanish, the percentage ranging from 83.3 percent among the Kanjobal to
93.5 percent among the Mam.
The linguistic ability of the wives was totally different from
that of their husbands. Only 28.7 percent were able to speak Spanish,
while 71.3 percent could speak only their tribal dialect. We find very
little change has occurred in the degree to which Indian women are being
educated today compared with those of a generation earlier. Among Indian
women under age 30, for example, 84.1 percent were illiterate (Table 33)
compared with 96 percent 'Of. those over 50 years of age. The difference
between these two groups is a good index of the degree of cultural change
that has occurred in the Highlands over the past generation. The women
are only slightly less monolingual today than they were when the anthro-
pologist, Ruth Bunzel, made a study in this same area more than 30 years
earlier. She found the contrast between the Spanish-speaking abilities
of the Indian men and women even greater than would be expected, as her
following comment suggests:
"My inability to handle the native language hampered my con-
tact with women and children, for I found none spoke more
than a few words of Spanish."I
It was among those who claimed to prefer Spanish to a tribal dia-
lect, or who said they spoke only Spanish outside their homes, that we
found the ladinoization process at work. The difference between a ladino
and an Indian is not a racial one. As the expression is used in Guate-
mala, ladino refers to an Indian who has foregone native dress and speech
in favor of European. Obviously, many in our sample were "transitional"
Indians, to borrow an expression from Whetter), they were fast becoming
ladinoized but still clung to some Indian traits.2 The persistence in
the use of the Mayan language suggests the Highlands Indian has resisted
acculturation or ladinoization much more than the eastern Guatemalan
'Ruth Bunzel, ChichicastenangoGoteilVillae (Seattle:
University of Washington Press, 1959), p. ix.
2Whetten, 92. cit., pp. 75-81.
- 70 -

ww
w."
117.
17.0
1177
7,77
,77>
77.7
.77-
Table 32.
Languages Spoken Outside of Home by Heads of Families and Wives, by Tribal Origins
MALE HEAD
SPOUSE
Language
Group
Only Tribal
Dialect
No. Percent
Tribal Dialect
and Spanish
No. Percent
Total
Only Tribal
Dialect
No. Percent
Cakchiquel
Kam
Quichd
Kanjobal
Mixture Spanish
preferably
19
14.1
26.5
24
16.6
216.7
IMP
Total
47
13.7
116
85.9
29
93.5
121
83.4
10
83.3
19
295
86.3
135
31
145
12
19
342
95
74.8
26
86.7
105
73.9
216.7
228
71.3
Tribal Dialect
Total
and Spanish
No. Percent
No.
32
25.2
127
413.3
30
37
29.1
142
10
83.3
12
99
92
28.7
320
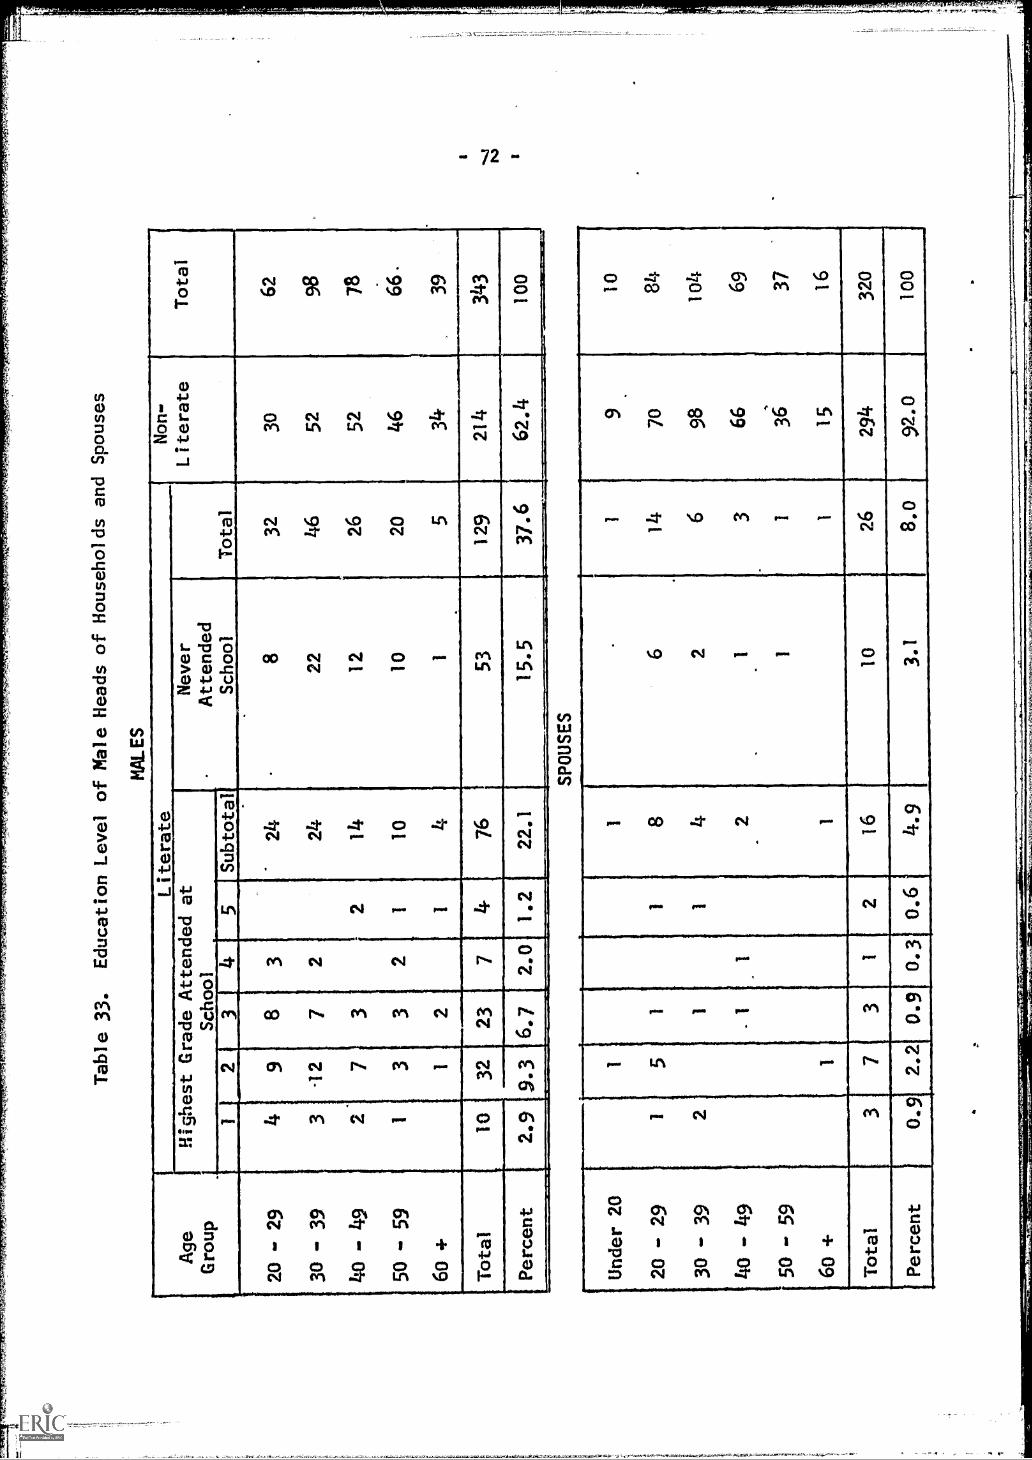
7,73
.777
Tri
:527
7,77
7-7r
if..
Table 33.
Education Level of Male Heads of Households and Spouses
Age
Group
Literate
Non-
Literate
Total
Highest Grade Attended at
School
Never
Attended
School
Total
12
34
5Subtotal
20 - 29
49
83
24
832
30
62
30 - 39
3-12
72
24
22
46
52
98
40
-49
27
32
14
12
26
52
78
50 - 59
13
32
110
10
20
46
66.
6o 4-
12
14
15
34
39
Total
10
32
23
776
53
129
214
343
Percent
2.9
9.3
6.7
2.0
22.1
15.5
37.6
62.4
100
SPOUSES
Under 20
11
910
20 - 29
15
11
86
14
70
84
30 - 39
21
14
26
98
104
40 - 49
21
366
69
50 - 59
11
36
37
6o+
11
115
16
Total
73
12
16
10
26
294
320
Percent
0.9
2.2
0.9
0.3
0.6
4.9
3.1
8.0
92.0
100
a
dl

,10
- 73 -
Indian, as Adams has shown.3
Unfortunately, we have no figures to indicate the language capa-
bilities of the children. We believe, however, we are justified in
presuming it would have been heavily influenced by that of the mother,
at least in the earlier years. Therefore, the proportion of children
who reach school age with no understanding of Spanish would be large.
To illustrate this point, enrollment figures for one school that
happens to be in the Cakchiquel language area showed that 38 students
out of a total school enrollment of 82 were enrolled in the pre-school
course, universally known throughout rural Guatemala as "castellaniza-
cion" (beginning Spanish). The need, for pre-school instruction in the
Spanish language is evident.
Of almost equal importance are the limitations of the schools and
their teachers. Many offer just one grade in addition to castellaniza-
ciOn0 with a few containing two and still fewer, three grades.
We have sorted the data pertaining to education into three cate-
gories, each with a specific definition assigned for the purposes of
this study. They are (a) illiteracy, (b) literacy, and (c) develop-
ment education, defined as being effectively literate.
Illiteracy
In interpreting the data we obtained on illiteracy we have found
it interesting to compare illiteracy rates for various age levels in
our population, as well as rates for the two sexes. In the sample
population, 62.5 percent of the male family heads could neither read
nor write (Table 34). There was a rate of illiteracy of 53.4 percent
among the boys 17 years of age and over. The difference in illiteracy
between the two groups was then 9.1 percent. However, when we elim-
inate heads of families who were under 50 years of age from the
analysis, we find the incidence of illiteracy among household heads
to be 76.9 percent. Apparently, there was a significant surge of
interest in educational opportunities or, perhaps a period of greater
relative prosperity, sometime in the late thirties and early forties
when the younger parents would have been of school age. The trend,
however, did not continue at fthe same pace; rather, it entered a period
of little change in the middle forties and did not begin to climb
significantly until the late fifties, as the following paragraph demon-
strates.
3Richard N. Adams, Cultural Surve s of Panama-Nicara ua-Guatemala-
El Salvador- Honduras (Washington, World Health Organization, 1957
pp. 271 and
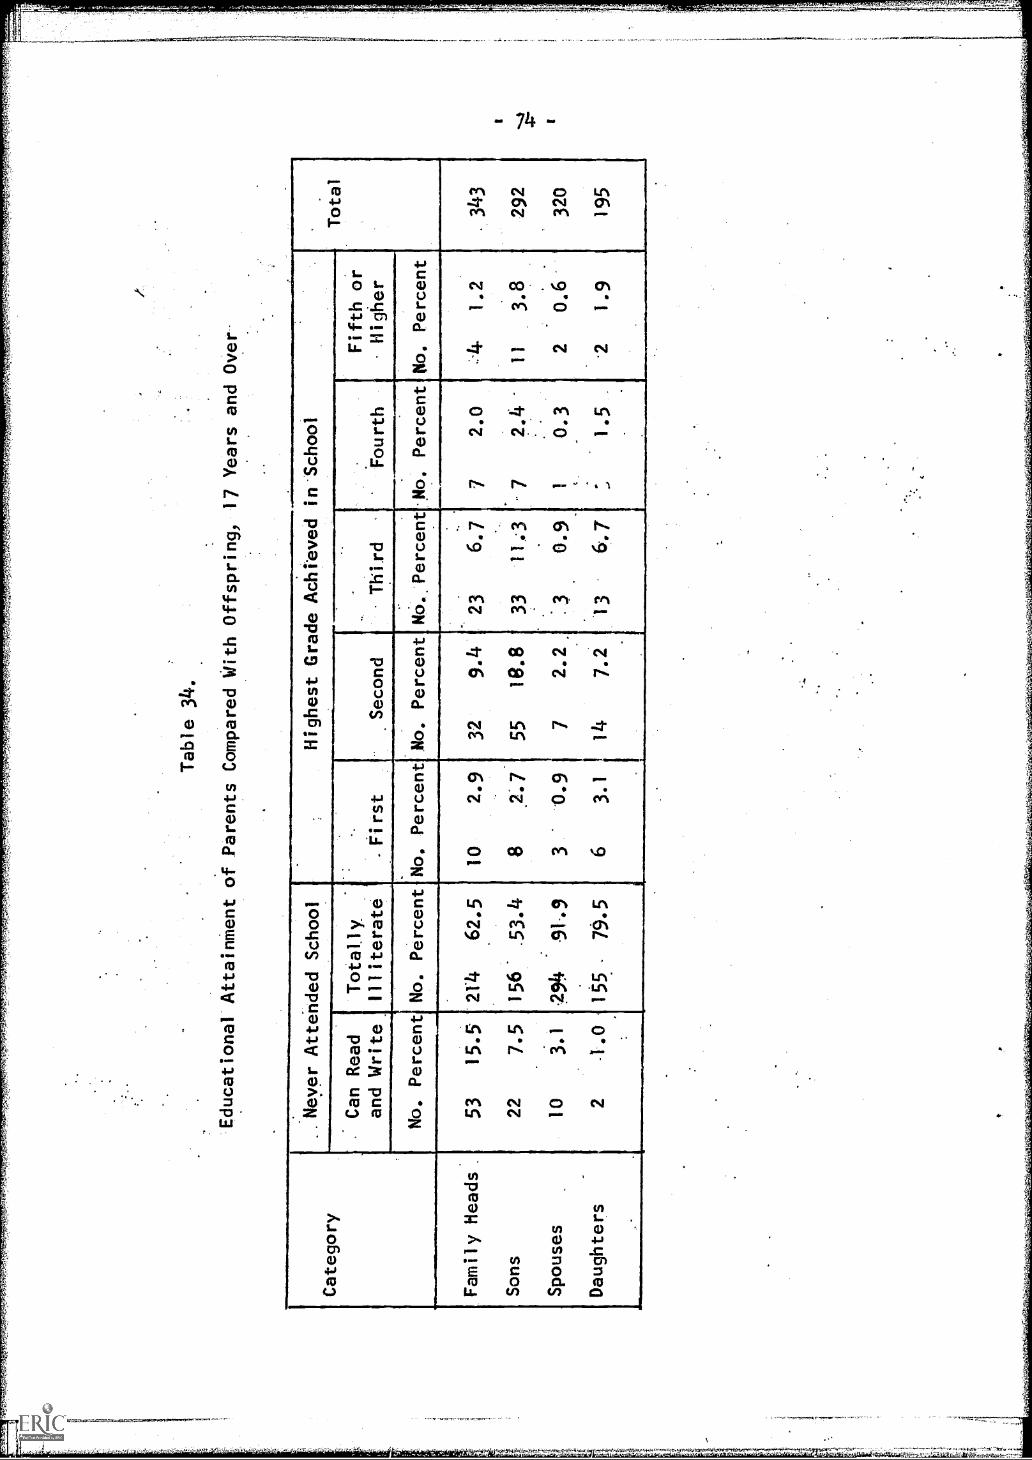
Table 34.
Educational Attainment of Parents Compared With Offspring,
17 Years and Over
Category
..Never Attended School
Highest Grade AchUeved in School
Total
.Can Read
Totally
-Fifth or
and Write
Illiterate
-First
.Second
Third
fourth
Higher
No. Percent
No. Percent
No. Percent
No. Percent
No.:Percent:No. Percent
No. Percent
Family Heads.
53
15.5
2r4
62.5
10
2.9
32
9.4
23
6.7
72.0
11-
1.2
.343
Sons
22
7.5
156
.53.4
82.7
55
18.8
33
11;3
-7
2.4
11
3.8
292
Spouses
10
3.1
294
.91,9
3-0.9
72.2
:3
0.9
-
10.3
..
.
20.6
320
Daughters
21.0
155
79.5
63.1
14
7.2
13
6.7
:..
1.5
21.9
195
"tk
4,70
143,
' Iso
m
'

-75-
Data concerning the educational status of all children seven years
of age and older are contained in Table 35. The data are given separately
for those who were in school at the time of our interviews and those who
had never attended or had discontinued.4 The rural Highland children do
not start school at as early an age as do children in urban areas. There-
fore, to evaluate the incidence of illiteracy among the children: we con-
centrate on those in the age group 10 to 16, and classify as illiterate
the following: (a) those children who were 10 years of age and had not
yet been enrolledTh-thdfififidd; (b) Children 10 years of age and
over who started the first grade at some earlier year but had dropped out,
and (c) those aged 11 and older who had progressed no further than the
first grade. Using these measures to define illiteracy in the children
of our sample aged 10 to 16, we find that 40 percent of the boys and 54
percent of the girls were illiterate.
Only 25 percent of the women we are speaking of here knew the Spanish
language which is indispensable to school attendance. Even so, the situa-
tion seems to be improving. While 91.9 percent of the wives of family
heads were illiterate, the rate for the older daughters--those aged 17 and
over--was 79.3 percent and for girls in the youngest group, as we have
stated before, it was 53.2 percent. While the rate of improvement in
eradicating illiteracy slightly favors the male, the fact that it did
decline by two-fifths among females in this past generation suggests the
degree of social change that is occurring in the Highlands of Guatemala.
It possible that the increasing participation of the female population
in the marketing of their handicrafts: as well as of minor farm products,
has had some influence on this change.
Literacy
We define as literates all individuals who have learned to read and
write Spanish. With this definition, we can recapitulate the previous
data relating to the literate proportion of our sample (Table 36).
It is interesting to note that slightly more than twice as high a
proportion of male heads of families had achieved literacy without the
benefit of formal schooling as had male children in the age group 17 and
older. We do not know whether this was due to the fact that rural schools
were not as readily available to the parent group as to their sons, thus
making self-education a greater necessity with the parents: or whether
some other incentive might explain the difference. We notice, too, that
women in all age groups appear not to have made as much progress in this
respect as did the men.
1111.1.41....1111...4414e hepitatt bse the term "drop Out" in the general sense in
reference to the Highlands Indian children since formal education forthe majority was limited to the number of grades available in the nearestneighborhood school. The majority of these had no more than one: somehad two, and a, 'lesser number three. Only children living close to the
larger towns had reasonable access to full primary and, sometimes, second-ary schools.

Educational Status of Children By Sex, Age and Highest Grade Attained
Age Group
Never
Completed Schooling
Currently Attending School
Total
Attended
School
12
34
56
6+
Sub-
total
12
34
56
7
Sub-
total
Male
.
7-9
48
37
.8
247.
95
10
71
19
61
16
24
11-14
14
44
513
18
20
23
71
170
97
15 -16
13
57
)13
23
24
11
13-
39
17+
178
855
33
72
54
114
21
21
28
300
Subtotal
260
13
64
45
72
64
141
68
38
30
11
22
3154
555
Female
-
.
-
7-9
45
35
439.
84
10
12
112
10
3-
25-,
38
11-14
35
13
15
10
16
81
35
75
15-16
25
14
21
19
14
11
11
943
174.
157
614
13
32
-
38
21
11
16
201
Subtotal
274
921
16
41
253
60
35
13
22
2114
441
TOTAL
534
22
85
61
11
38
4194
128
73
43
13
268
j996

- 77 -
'As far as achieving literacy through formal school attendance is
concerned, ,we note that approximately only one-third of those who had
attended school, in all categories, and then terminated for whatever
reason, continued their schooling as far as the third grade. The others
discontinued at the first or second grade level. With the limited data
we have at our command, the significance of these facts is difficult to..
assess. We do..not know the exact numbers whose education ended when they
'had "graduated" from whatever happened to be the highest grade offered
by their local school. Likewise, we are not able to say how many more
would have continued through the third grade had such a grade been avail-
able. Nevertheless, both the data in this section and that which.follows
adequately demonstrate that in the Highlands there is a developing aware-
ness of the value of education.
Table 36.
Percentage of Literates inVarioarrifi567-Te7-15755ffiple=12Iion
Category00
No formal schoolingbut can readand write
Heads of families
Spouses
Children 17 and. over:
Males
Females
Children 10-16 who have.'discontinued school:
Boys
Girls
15.5
3.1
7.5
Ash2a_gtqftItItug2g
First Second Third
2.9 9.4 6.7
9.9 2.2 0.9
2.7 18.8 11.3
1.0 3.1 7.2 6.7
5.6 7.5
4.5 1.9
PAIT19101i19111112Ption
We associate developmental education with effective literacy,which, for the purpose of this study we assume to be schooling beyondthird grade. Children who have finished the fourth grade appear to havegained sufficient comprehension of the learning process to be capable

- 78 -
1.1,161101114,1
of becoming "effectively literate."5 It is possible to change this situa-
tion, making various special subjects available to some of the older chil-
dren who may be enrolled in the earlier grades. However, given the
limited curriculum that is currently offered, we believe that develop-
mental education cannot be considered to exist below the fourth grade
level.
Only 3.2 percent of the family heads had reached such a level.
As might be expected, an insignificant 0.9 percent of their spouses
were effectively literate. Their older children had not done much
better; 5.6 percent of the boys aged 17 years or older had reached the
fourth, fifth or sixth grade, while only 2.7 percent of the girls had
achieved the same levels. The percentages were higher for the 10 to
16 year age group. Ten percent of the boys in this group and 3.8
percent of the girls had once been enrolled but discontinued or were
at this level at the time of our study. In this same group, we found
0.6 percent of the boys attending secondary school. None of the girls
had reached that level.
We cannot emphasize too strongly that the young Latin American,
whoever he may be, who attempts to enter the modern labor market in his
country and has no more training than he received by attending the
first, or even the second or third grade, is little more "effectively
literate" than was his completely illiterate parent.6 The latter genera-
tion, literate or not, seeking employment away from home, could find
opportunities in primary industry, or manual work in the plants that
process these crops. The modern economy that is developing and must
continue to develop in these countries, demands skilled and specialized
labor for which the illiterate and semi-illiterate are not equipped.
The semi-illiterate (the "ineffective literate") has practically no
advantage to offer prospective employers and must compete with the
totally illiterate for jobs requiring the least amount of skill.
INO011amilels1.
5See George W. Hill, El estado Sucre sus recursos humanos (Cara. .4
cast; Universidad Central de Venezuela, 1961 ; also his El estado de la
educaciOn en la Venezuela de ho $ 1962 (Caracas: Universidad Cat6lica
Andr6s Bello, June 1962 ; and with Manuel Gollds Q. and Gregorio Alfaro,
Un area en desarrollo sus roblemas econ6micos y sociales Costa Rica
San Jose: Institute Universitario Centroamericano de Investigaciones
Sociales y Econ6micas, 1964).
6This appears to be what Schultz had in mind when he said, "Then,
too, it takes about five years to become effectively literate." Trans-
forming Traditional Agriculture, p. 202.

- .
-79-
We are fully aware of the limitations imposed on educationalinstitutions in all of this region by the lack of buildings, theinadequacy of existing buildings, and the lack of trained teachers.We believe, however, that significant progress can and must be madein spite of these handicaps, even to the point where "developmentaleducation" could be started in some of the existing schools despitetheir inadequacies. Certain vocational and occupational skills couldbe introduced by visiting teachers traveling from one school to anotherto offer specialized instruction throughout a district. Somethingbeyond the ability to read must be provided to equip the younger gener-ation for entry into the labor market that the expanding economy ofthis country is creating, thus enabling them to share in the advantagesthat literacy and education presumably make possible.

IX. SUMMARY AND CONCLUSIONS
1. The 1964 Census, indicated that the Highlands contain 36 percent
of the Guatemalan population, 84 percent of which is located in rural
areas. During the 14 year period 1950-1964, the Highlands *population
increased at the rate of 2.5 percent per annum, compared with the
national population growth rate of 3.1 percent per annum for the same
period.
2. In a sample of 348 farm families in seven Highland departments
there was an average of five members per household. Although there
are no precise estimates of the relative importance of family and
hired labor on these farms, it was apparent from the survey that on
most of the farms the family provided most of the labor required.
Using data for average family composition and labor conversion
coefficients, the average labor force for the sample farms was esti-
mated to be 2 1/2 man equivalents, which gives a potential labor sup-
ply of some 625 man days a year. The survey suggested, however, that
an average of 69 man days a year were allocated for cultivation of
corn, beans and wheat which are the major crops. It would seem that
even after allowing for cultivation of minor crops, raising of live-
stock) travel, household duties, off-farm employment, and sickness,
there is a considerable amount of underemployment of the farm labor
force.
3. According to the 1964 Census) the Highlands contained 27 percent
of Guatemalan farm land and 47 percent of the farms. The average farm
size in the Highlands was 6.1 hectares, compared with the national
average of 10.7 hectares. The Census also indicated that in the High-
lands 31 percent of the farm land was controlled by .2 percent of the
farmers, a slightly less concentrated pattern of land distribution
than for the nation as a whole where 50 percent of the farm land was
controlled by .3 percent of the farmers. The extreme nature of the
land distribution is further illustrated by the fact that within the
Highlands 50 percent of the farms were less than 1.4 hectares.
The average farm size in the sample was three hectares) while
the average cultivated area was 1.49 hectares per farm. Pasture and
wood lots accounted for another 1.29 hectares.
Some 95 percent of the farmers claimed to be "owners" of all
or part of the land that they farmed. The remainder were tenants who
paid rent in cash or kind. A small number of farmers had rights to
use land that was subject to group tenure arrangements. The interpre-
tation to be given to the concept of ownership is ambiguous. In most
cases sons acquired rights to cultivate land from their father when
they married or reached maturity. Where there was more than one son,
each acquired rights to separate parcels of land rather than receiving
Joint rights to one or more parcels. This tendency to distribute
-84-
...

- 81 -
rights to specific parcels of land among individuals is likely tofurther increase the existing problem of fragmentation of holdings.Inheritance and purchase were the two most important means by whichfarmers had acquired rights to land. However, in terms of areas in-volved, the amount of land acquired by purchase was small, and forthe most part it was a redistribution of land within the low incomefarming group itself.
4. The average cash costs associated with farm production were Q53per farm, which was 25 percent of the total value of output per farm.The main cost items were hiring of labor, seed and fertilizer purchases.The average value of farm assets was Q10370, of which land accountedfor 80 percent, buildings 12 percent, and livestock and equipment theremaining 8 percent.
Only 19 percent of farmers made use of credit and for the mostpart, those who did used only small amounts for seasonal productionexpenses, business commitments, household or ceremonial expenses. The
average value of credit advanced was Q16.
5. The survey indicated that 62 percent of the farmers interviewedwere illiterate, and a further 16 percent who were literate had never
received any formal education. It was found that 92 percent of thewives were illiterate, and another 5 percent who were literate had noformal education. At the time of the survey: 26 percent of the chil-dren older than seven years were attending school, 5ft percent had notreceived any schooling and the remaining 20 percent had dropped outof the schooling system. In the latter group, only 2 of the 20 percenthad progressed beyond third grade before dropping out; most of the re-maining 18 percent dropped out after first or second grade. To a
large extent this phenomenon reflected the inadequacy of the existingschooling system as much or more than unwillingness on the part ofparents to send their children to school.
6. The average total value of farm output was Q208, of which 85percent was due to production of crops and the remainder due to live-stock. The net value of farm production, after deduction of cashcosts, was Q155. Thus, the average gross value of farm output perperson was Q42, while the corresponding figure per man unit wasapproximately 04.
Most farmers also supplemented their earnings from agriculturewith non-farm employment, either by engaging in a variety of businessventures, or by cbtaining agricultural or industrial employment. Theaverage value of income derived from these sources was Q96.*'Thus,the total value of income in cash and .kindLwas 'Q304 ors Q61 per person.
Total net income of those farmers who emigrated out of theircommunities for part of the year was Q161 compared with Q263 forthose who obtained off-farm employment in their local community. Boththe net income from agriculture and from off-farm earnings were higherfor the latter group.
* See Table 26.**See Table 28, 64.50 31.55)

-82-
7. To some extent the presence of a small number .of farmers who ob-
tain relatively high incomes from agricultural and/or.non-agricultural
employment masks the presence of a large number of farmers whose per
'capita output is quite low. Accordingly, the sample population has
been classified according to gross value of farm output and area of
land cultivated (Table 37). Clearly, there is a predominance of farms
(67 percent) that cultivate less than two hectares and produce less
than Q200 of agricultural produce.
Table 37.
Farms Classified by Area Cultivated and Value of Output(a)
Area Cultivated(Hectares)
Farm Output Quetzals)
0 - 199 200 + Total
0 -* 1.99
2.00+
232 (A) 42 (B) 274
15 (C) 59 (D) 74
Total 247
110....1111111.1.1411110101 348
(a)Capital letters in each cell denote group classification
that will be used in text.
Examination of some of the characteristics of each of these four
groups of farmers is most suggestive (Table 38). The value of crop
.production was a higher proportion of total value of farm output on
the higher income farms than on lower income farms. The low income
groups, A and C, consumed 75 and 69 percent of the total value of farm
output, compared to only 42 and 38 percent for groups B and D.
Within each income class, the farms with a'smaller cultivated
area have a higher value of output per hectare (both total farm area
and cultivated area). It may be that the Group C farms have poor
land, or that they are "on average" less capable managers than those
in Group A. Within each area class higher income farms have a higher
value of output per hectare. One explanation is that the higher in-
come farmers make more use of capital inputs such as fertilizers and
seeds, and adopt better management practices.
8. The survey was confined to farms of less than 45 hectares in .
area, of which there were 160,231 in the Highlands in 1964. With an
average of five dependents per farm these farms provide a means of
livelihood for some 800,000 people, or 66 percent of the rural popula-
tion in the Highlands. An important characteristic of this segment

. 83 .
Table 38.
Selected Characteristics
of Four Sub-Groups of the Sample Population
Item A a C 0 Average
Land Area
Total Farm Area 1.63 2,62 6.99 7.63 3.00
Cultivated Area 0.77 1,33 2.59 5.91 1.49
Crop Production
Value Crops Consumed 55.26 123.23 107.54 208.66 92.02
Value Crops Sold 13.74 166.30 23.31 319.02 84,76
Total 69.00 289.53 130.85 527.68 176.78
Livestock Production ...
;
Value Livestock Consumed 10.11 15.66 21.35 21.43 13.18
Value Livestock Sold 6 25.88 33.50 54.40 17.
17.78 41.54 54.85 75.83 30.77
Output per Hectare
Value of Farm Output perHectare 53.24 122.55 26.57 79.10 69.18
Value of Crop Productionper Hectare Cultivated 89.61 217.69 50.52 89.29 118:64
Distribution of Farm Output
Value Produce Consumed 65.37 138.89 128.89 230.09 105.20
Value Produce Sold 21.41 1*2.16 56.81 7 42 102.35
Total 86.78 331.07 185.70 603.51 207.55
of the rural population is the low land/labor ratio. The average area
of farm land per person (using 1964 Census data) for this entire por-
tion of the Highlands population was approximately .6 hectares. In
the sample of 348 farms, the corresponding figure was .6 hectares per
person as well, while the cultivated area per person was only .3 hec-
tares.
In view of the fact that the rural population in the Highlands
has been growing at the rate of 2 1/2 percent per annum and the fact
that on these small farms there is little use of capital inputs such
as fertilizer, improved seeds, and pest and disease control measures,
there is reason to believe that per capita output may not rise sig-
nificantly in the foreseeable future and, if anything, may fall. One
important issue pertinent to agricultural policy involved here is
whether increased capital inputs on these farms would provide sig..
,nifieont increases in output, given the existing level of managerial
ability of the farmers, or whether increases that are potentially
attainable are conditional upon improved levels of farm management.
In the latter case, the question of increasing the managerial ability
of farmers attains even greater importance. It seems that the exist-
ing agricultural extension services are making only a marginal contri-
bution to improving levels of farm management because of the small
number.of field staff employed relative to the number of farmers, the
inadequate level of training of extension staff and the extension
techniques used. In view of the low level of literacy among farmers,
a successful extension program may well depend on achieving regular
contact between field officers and a large number of farmers at a
personal level or in groups of sufficiently small size. However, if
there is a significant amount of underemployment on farms there may
be little incentive to introduce labor-saving technology into the
farming system.
Another important question relates to the impact of further in-
creases in the farm labor force on per capita output in this segment
of Highlands agriculture. It is not clear how additions to the farm
labor force, in the absence of any change in technology or inputs of
capital, would affect per capita output. However, in view of the low
ratio of land to labor, it is plausible that increments to the labor
force may depress average labor productivity (i.e. marginal is less
than average productivity). Wthis is the case two important policy
issues are involved in any attempt to raise per capita output. One
is the question of obtaining increases in output through increased
capital inputs and technological change sufficient to offset incre-
ments to the labor force, thereby raising per capita output. The
other is the possibility of reducing the labor force dependent for
a livelihood on these farms by providing alternate employment oppor-
tunities. Several possibilities exist here; migration to new areas
of land suitable for agriculture, redistribution of existing holdings
and migration out of agriculture into industrial employment.

The Land Tenure Center is a cooperative research andtraining program of the American Nations, the Agencyfor International Development and the University ofWisconsin.