Land Suitability Assessment for Sorghum and Maize Crops ...
21
ERJSSH 1 (1), September-October 2014 119 Original Article Land Suitability Assessment for Sorghum and Maize Crops Using a SLA and GIS Approach in Dera Wereda, ANRS, Ethiopia Ebrahim Esa 1 Abstract The land suitability evaluation for sorghum and maize found in the study area has been done in order to define the land fitness for specific land uses as well as estimating the possible increase of crop production after improving land management. Sorghum and maize are cereals that are considered in the suit- ability appreciation using GIS to match the suitability for two crops based on their biophysical requirements and the characteristics of land in Dera wereda. The methodology employed combines land quality attributes that most influ- ence crop suitability and biophysical requirements of selected crops for analy- sis. The suitability assessment for both crops was conducted using the method as described in FAO guidelines of land evaluation for rainfed agriculture. The results of the weighted overlay for biophysical suitability evaluation using the Simple Limitation Approach (SLA) identified that about 40.25%, 59.75%, and 70.67%, 27.36% of the total area of land in the wereda was evaluated as a moderately and marginally suitable for sorghum and maize production, respec- tively. However, only small patches of the area were weighted as highly suit- able and not suitable for maize production. As a result, the largest proportion of the land was only moderately suitable for maize (70.67%), but marginally suitable for sorghum production (59.75%) in the wereda. Therefore, a GIS based approach for evaluating land in terms of potentials and constraints as a useful tool in assessing land for sustainable agricultural planning cannot be overlooked in this study. Keywords: suitability evaluation, biophysical requirements, FAO method, GIS based approach, Simple Limitation Approach (SLA), sustainable agricultural planning 1 The author holds a Ph.D. in English Literature from Ahmedu Bello University, Zaria, Nigeria. He is a senior lecturer and Head of the Department of English at the Yobe State University, Damaturu, Nigeria; e-mail: [email protected].
Transcript of Land Suitability Assessment for Sorghum and Maize Crops ...
ERJSSH 1 (1), September-October 2014
119
Original Article
Land Suitability Assessment for Sorghum and
Maize Crops Using a SLA and GIS Approach in
Dera Wereda, ANRS, Ethiopia
Ebrahim Esa1
Abstract
The land suitability evaluation for sorghum and maize found in the study area has been done in order to define the land fitness for specific land uses as well as estimating the possible increase of crop production after improving land management. Sorghum and maize are cereals that are considered in the suit-ability appreciation using GIS to match the suitability for two crops based on their biophysical requirements and the characteristics of land in Dera wereda. The methodology employed combines land quality attributes that most influ-ence crop suitability and biophysical requirements of selected crops for analy-sis. The suitability assessment for both crops was conducted using the method as described in FAO guidelines of land evaluation for rainfed agriculture. The results of the weighted overlay for biophysical suitability evaluation using the Simple Limitation Approach (SLA) identified that about 40.25%, 59.75%, and 70.67%, 27.36% of the total area of land in the wereda was evaluated as a moderately and marginally suitable for sorghum and maize production, respec-tively. However, only small patches of the area were weighted as highly suit-able and not suitable for maize production. As a result, the largest proportion of the land was only moderately suitable for maize (70.67%), but marginally suitable for sorghum production (59.75%) in the wereda. Therefore, a GIS based approach for evaluating land in terms of potentials and constraints as a useful tool in assessing land for sustainable agricultural planning cannot be overlooked in this study. Keywords: suitability evaluation, biophysical requirements, FAO method, GIS
based approach, Simple Limitation Approach (SLA), sustainable agricultural planning
1 The author holds a Ph.D. in English Literature from Ahmedu Bello University, Zaria, Nigeria. He is a senior lecturer and Head of the Department of English at the Yobe State University, Damaturu, Nigeria; e-mail: [email protected].

ERJSSH 1 (1), September-October 2014
120
Introduction
The problem of selecting the correct land for the cultivation of a certain agri-
culture product is a long-standing and mainly empirical issue (Pirbalouti, et
al., 2011). Although many researchers and institutions have tried to provide
a framework for optimal agricultural land use, it is suspected that much ag-
ricultural land used currently is below its optimal capability in different parts
of the world. The classification of land into different capability classes is use-
ful in that some soil, climate, topographic and other attributes of land can be
suitable for specific crops and unsuitable for others; therefore precision, of
land utilization types is necessary. According to FAO (1976), however, capa-
bility is viewed by some as the inherent capacity of land to perform at a given
level for a general use, and suitability as a statement of the adaptability of a
given area for a specific kind of land use; others see capability as a classifica-
tion of land primarily in relation to degradation hazards, whilst some regard
the terms “suitability” and “capability” as interchangeable. The evaluation
process, therefore, provides information on the major constraints and oppor-
tunities for the use of land for particular use types which will guide decision-
makers on how resources are optimally utilized. It is a particularly important
consideration for environmental land use planning. In addition as cited in
Ahmed (2012), it also allows in identifying the main limiting factors for agri-
cultural production and enables stakeholders, such as land users, land use
planners, and agricultural support services to develop crop management able
to overcome such constraints and increase productivity.
Agriculture is the main stay of the national economy employing the
greatest proportion of the country population mainly of rural areas. However,
it is still in its primitive stage although there are some improvements in in-
puts in recent times. The production of cereal crops, such as maize and sor-
ghum is economically and socially important in Ethiopia. It is because maize,
grown at greater altitudinal ranges, is a staple food in some parts of Ethiopia.
In addition, sorghum is commonly grown in warm, moist lowlands and the
major semi arid areas of Ethiopia where the amount of precipitation is lower
in that it results in lower soil moisture condition and lower growing periods.

ERJSSH 1 (1), September-October 2014
121
On the other hand, besides its importance as a domestic food crop, maize is
becoming one of the export items of the agricultural productions of the na-
tional economy.
Cereals, such as teff, barley, maize, sorghum, oats, millet and wheat
make up 85% and 90% of the total production of field crops and account for
over 90% of input consumption in Ethiopia (CSA, 2000). However, account-
ing to Pender and Gebremedhin (2006) cited in Ahmed (2011), low productiv-
ity remains the major constraint of cereal cultivation where yields are less
than 1 ton per hectare due to poor technology, increasing degradation of
farm lands, low input and other factors. As a result, food security is one of
the national issues that still attract researchers and policy makers in the
field of sustainable land use planning to ensure production that does not
compromise the needs of the coming generation.
Maize is the second most widely cultivated cereal in Ethiopia in terms
of area but forms the largest share of production by volume (18%), and ap-
pears to be increasing (Chamberlin & Schmidt, 2011). The grains of maize
are ground into flour, fermented and made into injera and flat bread in differ-
ent parts of the country. Commonly, the grains are also used as an ingredi-
ent of home-brewed alcoholic drinks, such as araqi. In Ethiopia maize and
sorghum straw from threshed grains (residues) can be used as fodder for ani-
mals and source of energy to households complementary to fuel wood and
cow dung. Besides, it can also act as a biological measure to improve soil fer-
tility when it is left on the farmland until the next growing season. Therefore,
evaluating land suitability for comparable crops in the study area is most
important for selecting optimum land use types which will bring sustainable
agricultural production.
Objectives The aim of this study is to determine physical land suitability for sorghum
and Maize crops using a GIS and Remote Sensing approach. In addition, it is
to identify areas with physical constraints for a range of land uses and the
management requirements that will ensure that a particular land use can be
ERJSSH 1 (1), September-October 2014
122
sustained without causing significant on-site or off-site degradation to land
quality.
Methods and Materials Study Area Description
Location
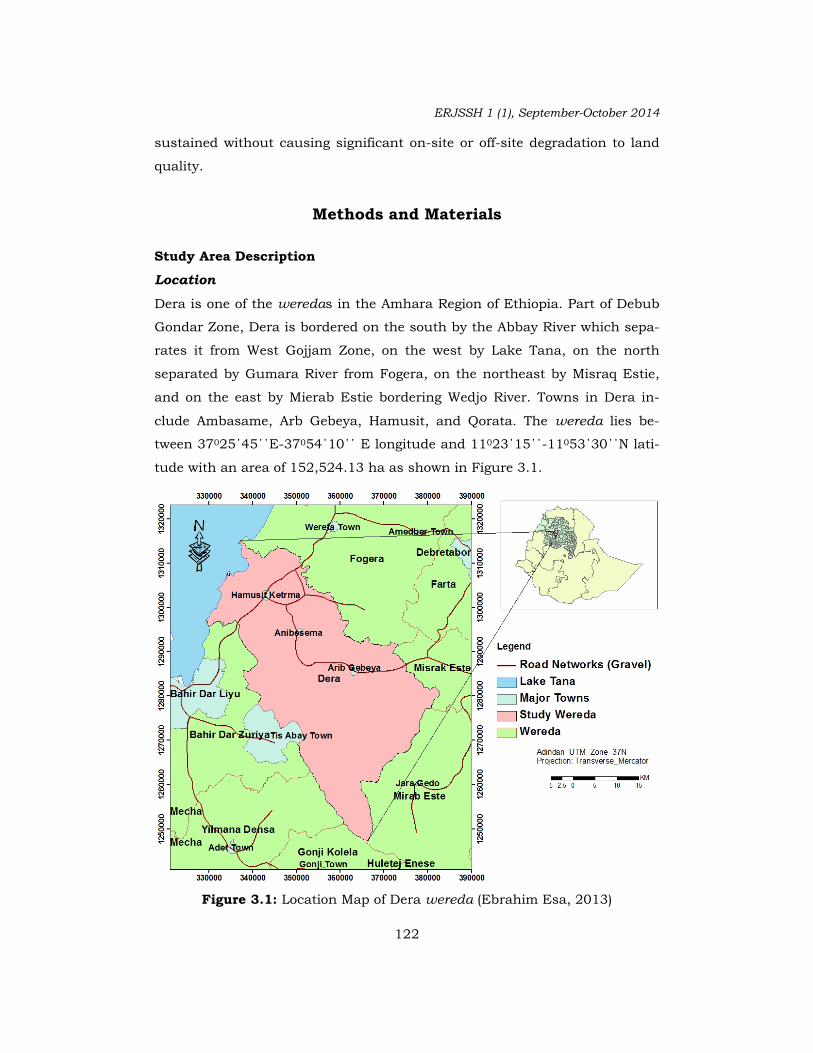
Dera is one of the weredas in the Amhara Region of Ethiopia. Part of Debub
Gondar Zone, Dera is bordered on the south by the Abbay River which sepa-
rates it from West Gojjam Zone, on the west by Lake Tana, on the north
separated by Gumara River from Fogera, on the northeast by Misraq Estie,
and on the east by Mierab Estie bordering Wedjo River. Towns in Dera in-
clude Ambasame, Arb Gebeya, Hamusit, and Qorata. The wereda lies be-
tween 37025΄45΄΄E-37054΄10΄΄ E longitude and 11023΄15΄΄-11053΄30΄΄N lati-
tude with an area of 152,524.13 ha as shown in Figure 3.1.
Figure 3.1: Location Map of Dera wereda (Ebrahim Esa, 2013)

ERJSSH 1 (1), September-October 2014
123
Physiographic Setting
Dera wereda is composed of diverse physiographic settings. The present
physiographic setting of the wereda is the result of basaltic volcanism that
forms the plateau in central and southeast, and the rest is later eroded and
dissected by the Gelda, Alata, and Gebetie rivers in the southeast, and the
Abbay River bordering West Gojjam Zone in the south-eastern margin. As it
is obtained from SRTM image (30 m × 30 m), the altitude ranges from 1,432
in Lake Tana lowland to 2,625 m A.S.L. in the southeast where higher levels
of dissection occur with an elevation range of 1,193 m A.S.L. as shown in
figure 3.2.
The study area is characterized by volcanic ridges and hills surround-
ing the wereda in the southern and south-western parts, with a relatively
gentle and flat land forms in eastern and central parts of the plateau, and
the northern part bordering Fogera wereda and Lake Tana. That is, the area
slopes downwards in the southwest bordering the Abbay River and in the
north and north-western parts into Lake Tana.
Figure 3.2: The digital elevation model showing the physiographic setting classified from SRTM (30×30m)
ERJSSH 1 (1), September-October 2014
124
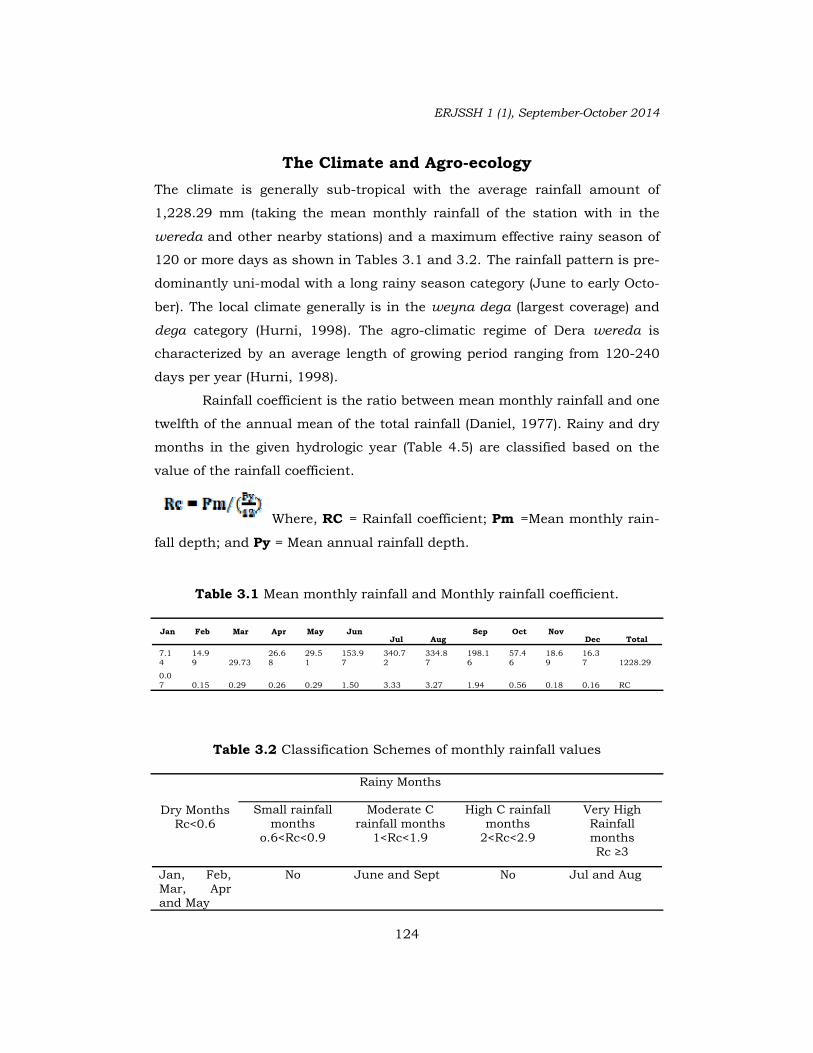
The Climate and Agro-ecology
The climate is generally sub-tropical with the average rainfall amount of
1,228.29 mm (taking the mean monthly rainfall of the station with in the
wereda and other nearby stations) and a maximum effective rainy season of
120 or more days as shown in Tables 3.1 and 3.2. The rainfall pattern is pre-
dominantly uni-modal with a long rainy season category (June to early Octo-
ber). The local climate generally is in the weyna dega (largest coverage) and
dega category (Hurni, 1998). The agro-climatic regime of Dera wereda is
characterized by an average length of growing period ranging from 120-240
days per year (Hurni, 1998).
Rainfall coefficient is the ratio between mean monthly rainfall and one
twelfth of the annual mean of the total rainfall (Daniel, 1977). Rainy and dry
months in the given hydrologic year (Table 4.5) are classified based on the
value of the rainfall coefficient.
Where, RC = Rainfall coefficient; Pm =Mean monthly rain-
fall depth; and Py = Mean annual rainfall depth.
Table 3.1 Mean monthly rainfall and Monthly rainfall coefficient.
Jan Feb Mar Apr May Jun Jul Aug
Sep Oct Nov Dec Total
7.14
14.99 29.73
26.68
29.51
153.97
340.72
334.87
198.16
57.46
18.69
16.37 1228.29
0.07 0.15 0.29 0.26 0.29 1.50 3.33 3.27 1.94 0.56 0.18 0.16 RC
Dry Months Rc<0.6
Rainy Months
Small rainfall months
o.6<Rc<0.9
Moderate C rainfall months
1<Rc<1.9
High C rainfall months
2<Rc<2.9
Very High Rainfall months Rc ≥3
Jan, Feb, Mar, Apr and May
No June and Sept No Jul and Aug
Table 3.2 Classification Schemes of monthly rainfall values

ERJSSH 1 (1), September-October 2014
125
Based on the Agro-ecological zone (AEZ) classification method which com-
bines growing periods with temperature and moisture regimes, the wereda
has three agro-ecological zones associated with distinct soil, climate and land
uses. Tepid moist mid-highlands accounted the highest coverage, i.e.,
139,597.89 ha (91.53%) followed by warm moist lowlands of 11,380.61 ha
(7.46%) in the South, and a water body of 1,363.93 ha (0.89%) adjacent to
Lake Tana as shown in Figure 3.3 and Table 3.3. In traditional climate clas-
sifications of Ethiopia, the wereda lies within weyna dega and Moist qolla
category with altitude and rainfall ranging from 1,500-2,300 m and 500-
1,500 m A.S.L., and 900-1,400 mm/y and less than 900 mm/y, respectively
(Hurni, 1998). Based on this classification of local climate system, the mean
annual temperature ranges from 20.0–17.5/16.0oC in weyna dega
(midlands) to 27.5 – 20.0oC in qolla, i.e., lowlands (Temesgen, 2010). On the
other hand, a survey of the land by the Ethiopian Electric Power Corporation
(EEPCO) in this wereda shows that 46% is arable or cultivable, 6% pasture,
1% forest or shrubland, 25% covered with water and the remaining 25.9% is
considered degraded or other (ESIA, 2006).
Figure 3.3: Agro-ecological map of Dera wereda representing the major zones (adapted from MOARD, 2013)

ERJSSH 1 (1), September-October 2014
126
Soil
The soil map of the district was obtained from the National Database at the
FDRE Ministry of Agriculture and 10 major soil types were distinguished in
the wereda. Out of the total area of the wereda, the soil is predominantly of
Dystric gleysols, Dystric Nitosols, Eutric Nitosol and Orthic luvisol compris-
ing 78.7416% while others hold small patches of land of the wereda as
shown in Figure 3.4 and Table 3.4 below. The soils found in the wereda are
diverse in that they do have influences on the land use and land cover of the
wereda, particularly relevant in agriculture. The characteristics of the soils
intern determine land use and/or land type of vegetation and crop grown in
an area.
Table 3.3 Agroecology with area coverage
Agroecology zone Area (ha) %
Water body 1,363.93 0.89
Cool moist mid highlands 171,656,021 0.11
Warm moist lowlands 11,380.61 7.46
Tepid moist midlands 139,597.89 91.53
Total 100
Figure 3.4: Soil map of Dera wereda (Adapted from MOARD, 2013)

ERJSSH 1 (1), September-October 2014
127
Table 3.4 Major types of Soils (adapted from MOARD, 2013)
Soil Type Area (ha) %
Chromic vertisol 5,954.9 3.90
Dystric gleysols 31,269.68 20.50
Dystric Nitosols 25,895.59 16.98
Eutric Cambisols 14,013.05 9.19
Eutric Nitosol 33,823.34 22.18
Eutric regosol 3,549.53 2.33
Leptosol 654.67 0.43
Orthic luvisol 29,103.4 19.08
Calcic xerosol 6,479.87 4.25
No data 1,770.03 1.16 152,514.06 100
Methodology
The methodology used for the evaluation of land suitability was based on
FAO, 1976 guidelines of land evaluation involving matching land characteris-
tics against crop requirements and assigning a suitability rate for each land
characteristic using GIS. It was used to match the suitability for two varieties
of crops, such as highland maize and sorghum based on their biological re-
quirements and the quality or characteristics of land. The FAO approach de-
fines land suitability as fitness of a given type of land to support a defined
use (FAO, 1976; 2007). The basic idea underlying the proposed method of
land suitability classification (FAO approach) is that the land should be rated
only on its value for a specific purpose (Ahmed, 2012). That means the rele-
vant biophysical variables of soil and climate and topography were consid-
ered for suitability analysis. The values of the parameter calculated for each
variable provide different suitability classes for each crop in each land map-
ping unit after it has been rated for each land characteristics as shown in
Figure 3.5.
According to the classification proposed by FAO (1976), five different
classes, ranging from “Unsuitable” to “Highly Suitable”, whose codes are rec-
ognized and constituted by a capital letter (indicating the order) and a num-

ERJSSH 1 (1), September-October 2014
128
ber (indicating the class), identify land suitability for a certain purpose as
shown in Table 3.5.
Table 3.5 Suitability classes and their description (FAO, 1976)
Suitability Class
Description
Class S1: Highly Suit-able
Land having no significant limitations to sustained application of a given use, or only minor limitations that will not significantly re-duce productivity or benefits and will not raise inputs above an acceptable level.
Class S2: Moderately Suitable
Land having limitations which in aggregate are moderately severe for sustained application of a given use; the limitations will reduce productivity or benefits and increase required inputs to the extent that the overall advantage to be gained from the use, although still attractive, will be appreciably inferior to that expected on Class S1 land.
Class S3: Marginally Suitable
Land having limitations which in aggregate are severe for sus-tained application of a given use and will so reduce productivity or benefits, or increase required inputs, that this expenditure will be only marginally justified.
Class N1 Cur-rently Not Suitable
Land having limitations which may be surmountable in time but which cannot be corrected with existing knowledge at currently acceptable cost; the limitations are so severe as to preclude suc-cessful sustained use of the land in the given manner.
Class N2: Per-manently Not Suitable
Land having limitations which appear as severe as to preclude any possibilities of successful sustained use of the land in the given manner.
Figure 3.5 Schematic diagram of suitability evaluation process (Ebrahim Esa, 2013)

ERJSSH 1 (1), September-October 2014
129
Soil Data Base
Soil attributes used for suitability evaluation such as oxygen availability
(porosity/texture), water availability (soil drainage); base saturation and pH
were used to evaluate land quality for sorghum and maize crops. These have
been derived from the essential chemical and physical properties of soils
found in the study area using soil units from FAO-UNESCO soil classification
system and extracted for the purpose at hand. The soil quality index com-
prising the physical and chemical parameters combined to form a thematic
layer generated in Arc GIS 10 environment.
Climate Database
Climatic variables relevant in the suitability evaluation were mean annual
temperature and rainfall. This has been obtained from the National meteoro-
logical Service Agency database and generated from local agroecology infor-
mation after which a thematic layer on mean annual rainfall/growing pre-
cipitation, length of growing period (LGP), and mean annual temperature
used to evaluate this characteristic were extracted.
Suitability Analysis
The diagnostic factors of each thematic layer were assigned values of factor
rating as shown in Tables 3.7. These factor ratings represent values indicat-
ing how well each land use requirement is satisfied by particular conditions
of the corresponding land quality (FAO, 1984). The ratings are signified by
lower case letters to avoid confusion with land suitability ratings of land
units which are the end products of the evaluation process. This can be done
through comparing land quality against the corresponding crop requirement
value. The resultant suitability rating values for each category is summarized
using the optimum limitation criteria where the lowest suitability rating
value in each category is considered to produce a thematic layer. Finally, the
evaluation model is defined using the value of factor rating as suitability (S)
=f (C*T*SPhy*SChe). The weighted overlay process of these layers was per-
formed to produce a resultant polygonal layer upon which the evaluation
model was applied using GIS.

ERJSSH 1 (1), September-October 2014
130
B
ioph
ysic
al R
equi
rem
ents
Tabl
e 3.
6 R
atin
g fo
r cr
op r
equ
irem
ent
of m
aize
in r
ain
fed
agri
cult
ure
in D
era
wer
eda,
SW
Eth
iopi
an H
igh
lan
ds
(mod
ified
from
Sys
, et
al. 1
991;
Hu
rni,
1998
; an
d D
ries
sen
an
d D
ecke
rs (e
ds),
2001
).
La
nd U
se R
equi
rem
ents
C
lass
, deg
ree
of li
mit
atio
n an
d ra
ting
sca
le
Land
Q
ualit
y D
iagn
osti
c Fa
ctor
/ La
nd
Cha
ract
eris
tics
U
nit
S1 (1
00-8
5)
S2 (9
5-60
) S3
(60-
40)
N (<
40)
Topo
gra-
phy
Ele
vati
on
M
1500
-220
0 10
00-1
500/
22
00-2
400
2400
-300
0 <1
000/
>3
000
Clim
ate
Mea
n L
engt
h o
f gro
win
g pe
riod
/LG
P D
ays/
y 14
0-22
0 12
0-14
0 22
0-27
0 <1
20/>
300
Tota
l Gro
win
g S
easo
n R
F/
MA
RF
Mm
50
0-12
00
1200
-160
0/
500-
400
>160
0/ 4
00-
300
-
Mea
n G
row
ing
Tem
p 0C
22
-32
20-1
6/ 3
2-35
16
-14/
35-
40
-
Soi
l (Ph
y.)
Wat
er A
va. (
Dra
inag
e)
- W
ell d
rain
ed
Mod
erat
e Po
or
No
drai
nag
e
Oxy
gen
Ava
. (te
xtu
re)
- Lo
amy
& S
ilty
loam
C
lay
loam
S
ilt-c
lay
Cla
y
Soi
l dep
th (r
) M
>2
m
1.5-
1.9
1.0-
1.4
<0.9
Soi
l (C
he.)
PH
- 5.
8-7.
8 7.
8-8.
5 5.
2-5.
8 >8
.5/
<5.2
BS
%
>7
5 75
-50
- <5
0

ERJSSH 1 (1), September-October 2014
131
Ta
ble
3.7
Rat
ing
for
crop
req
uir
emen
t of
sor
ghu
m in
rai
nfe
d ag
ricu
ltu
re in
Der
a w
ered
a, S
W E
thio
pian
Hig
hla
nds
(M
odifi
ed fr
om S
ys, e
t al
., 19
91; H
urn
i, 19
98; a
nd D
ries
sen
an
d D
ecke
rs (e
ds),
2001
)
La
nd U
se R
equi
rem
ents
C
lass
, deg
ree
of li
mit
atio
n an
d ra
ting
sca
le
Land
Qua
l-it
y D
iagn
osti
c Fa
ctor
/ La
nd
Cha
ract
eris
tics
U
nit
S1 (1
00-8
5)
S2 (8
5-60
) S3
(60-
40)
N1
(<40
)
Topo
grap
hy
Ele
vati
on
m
500–
1,50
0/1,
800
1,50
0-2,
400
- >2
,500
/ <5
00
Clim
ate
Ch
ara.
M
ean
Len
gth
of g
row
ing
peri
od/L
GP
Day
s ≤1
20
120-
140
140-
220
>220
Tota
l Gro
win
g S
easo
n R
F/
MA
RF
Mm
40
0-90
0 30
0-40
0/ 9
00-
1,20
0 30
0-15
0/ 1
,200
-1,4
00
-
Mea
n G
row
ing
Tem
p 0C
24
-32
23-1
8 /
>32
18-1
5 -
Soi
l (Ph
y.)
Wat
er A
va. (
Dra
inag
e)
- M
oder
ate
Poor
W
ell
No
Oxy
gen
Ava
. (te
xtu
re)
- S
ic, s
i, sc
, l s
i, si
l, c<
60v
Sl,
c>60
v S
, ls,
s, l
cs
cm, s
icm
, cs
Soi
l dep
th (r
) C
m
>90
90-5
0 50
-20
<20
Soi
l (C
he.
) PH
-
5.5-
8.2
5.3-
5.5/
8.2
-8.3
5.
2-5.
3/ 8
.3-8
.5
>8.5
/ <5
.2
BS
%
>5
0 50
-35
35-1
5 <1
5
ERJSSH 1 (1), September-October 2014
132
Results and Discussion
It is difficult if not impossible to directly measure land qualities in a routine
survey, but their severity levels or single-factor ratings for each evaluation
unit must be inferred from one or more diagnostic land characteristics. It is
because; diagnostic land characteristics are land characteristics that will be
used to evaluate the land quality. Therefore, these must be measured at the
appropriate scale against the land. There may be a choice of land character-
istics, in which case the simplest or cheapest to determine should be used.
In other words, assigning an evaluation unit to its correct severity level of
land quality, given data values for each diagnostic land characteristics, is the
most difficult analytical problem in land evaluation, and requires a great skill
of judgment. In this study, however, the researcher used a combination of
matching tables and GIS to properly handle the process and effectively un-
dertake suitability evaluation for maize and sorghum crops.
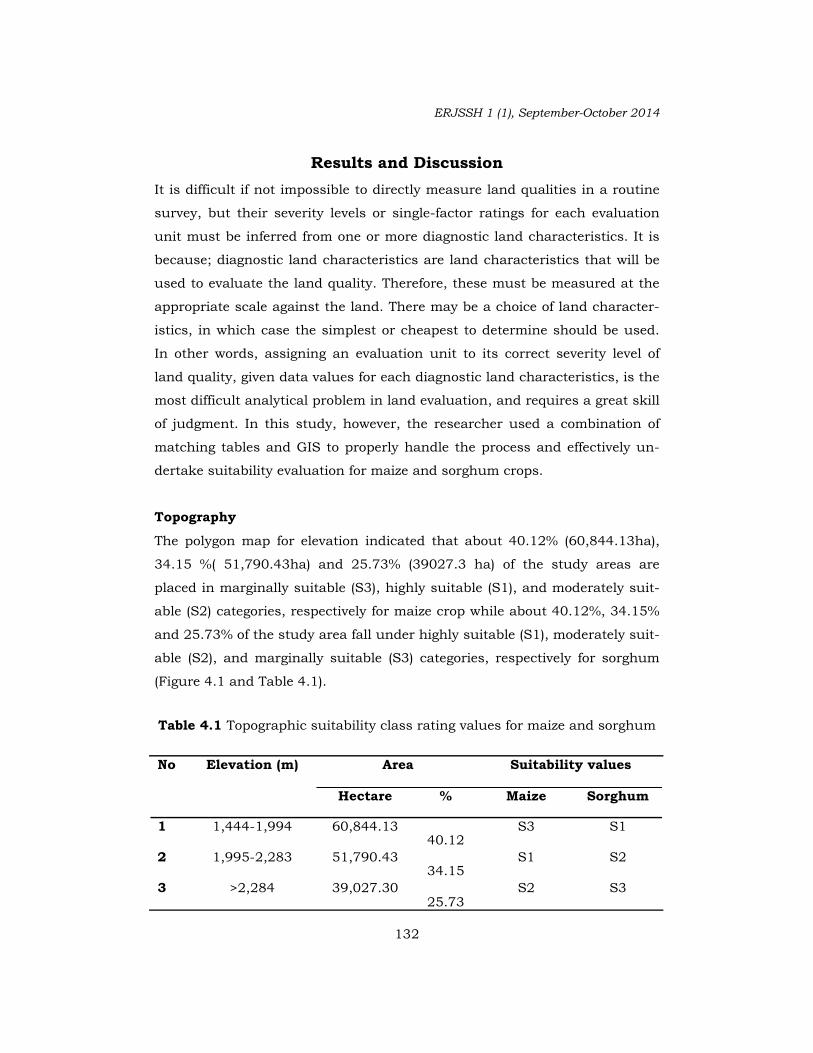
Topography
The polygon map for elevation indicated that about 40.12% (60,844.13ha),
34.15 %( 51,790.43ha) and 25.73% (39027.3 ha) of the study areas are
placed in marginally suitable (S3), highly suitable (S1), and moderately suit-
able (S2) categories, respectively for maize crop while about 40.12%, 34.15%
and 25.73% of the study area fall under highly suitable (S1), moderately suit-
able (S2), and marginally suitable (S3) categories, respectively for sorghum
(Figure 4.1 and Table 4.1).
Table 4.1 Topographic suitability class rating values for maize and sorghum
No Elevation (m) Area Suitability values
Hectare % Maize Sorghum
1 1,444-1,994 60,844.13 40.12
S3 S1
2 1,995-2,283 51,790.43 34.15
S1 S2
3 >2,284 39,027.30 25.73
S2 S3

ERJSSH 1 (1), September-October 2014
133
(a)
(b)
Figure 4.1: Topographic suitability of sorghum (a) and maize (b) for sustainable rain-fed agriculture (Ebrahim Esa, 2013)
Climate
The results of overlay process for climate variables (Length of growing period,
mean annual RF and temperature) are extracted from the local agro-ecologic
information. Based on the local agro-ecological zoning, the wereda is charac-
terized by the associated climatic conditions such as mean annual tempera-
ture (20 to17.5/160C) and (27.5 to 200C) for cool sub-humid climate (weyna
dega) and semiarid (moist qolla) area, respectively (Belay Simane, et al,
2013). However, the length of growing period (days/year) and mean annual
rainfall indicated that there are no significant changes such as it ranges from
120 to 240 days/y; and 900-1,400 mm for warm moist (sub-humid) climate
and warm moist lowlands (warm semiarid) areas, respectively (Hurni, 1998).
Therefore, almost all areas of the wereda, i.e., 99 %, are evaluated as mar-
ginally suitable (S3) and moderately suitable (S2) for sustainable sorghum
and maize cultivation under rainfed agriculture (Figure 4.2 and Table 4.2).
The rest 0.89 % of the area is unsuitable for both maize and sorghum pro-
duction due to the permanent cover of the land with water throughout the
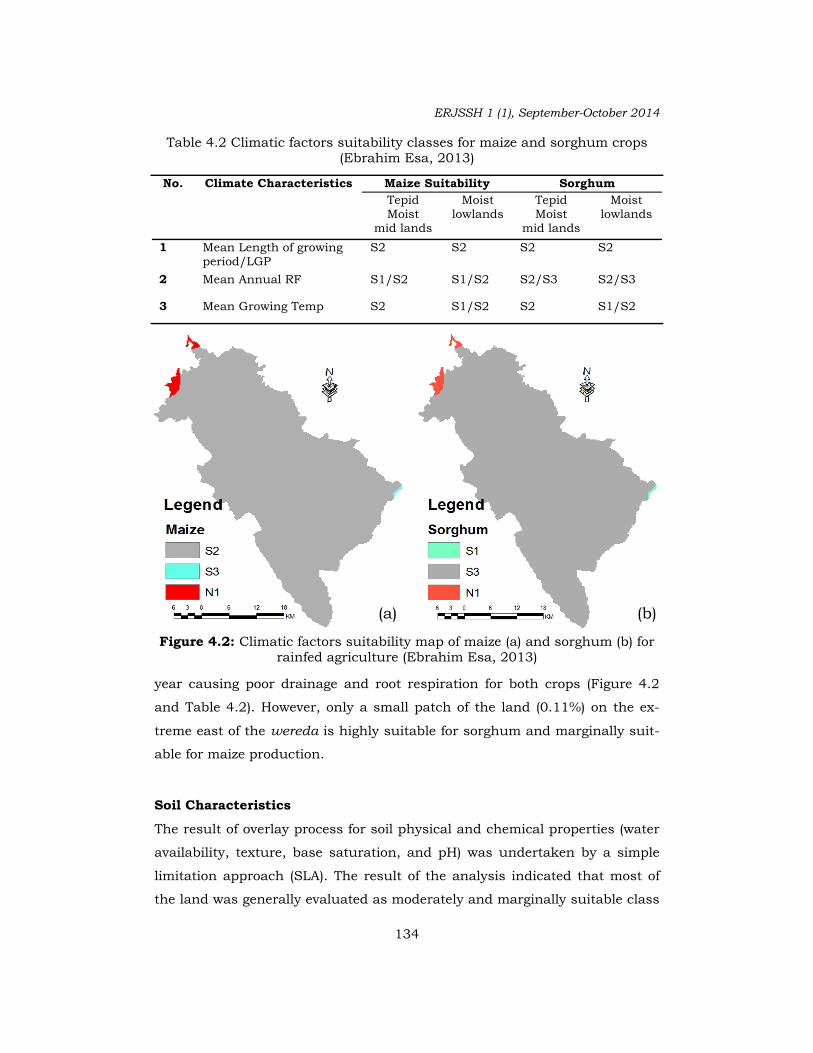
ERJSSH 1 (1), September-October 2014
134
year causing poor drainage and root respiration for both crops (Figure 4.2
and Table 4.2). However, only a small patch of the land (0.11%) on the ex-
treme east of the wereda is highly suitable for sorghum and marginally suit-
able for maize production.
Soil Characteristics
The result of overlay process for soil physical and chemical properties (water
availability, texture, base saturation, and pH) was undertaken by a simple
limitation approach (SLA). The result of the analysis indicated that most of
the land was generally evaluated as moderately and marginally suitable class
Table 4.2 Climatic factors suitability classes for maize and sorghum crops (Ebrahim Esa, 2013)
No. Climate Characteristics Maize Suitability Sorghum Tepid Moist
mid lands
Moist lowlands
Tepid Moist
mid lands
Moist lowlands
1 Mean Length of growing period/LGP
S2 S2 S2 S2
2 Mean Annual RF S1/S2 S1/S2 S2/S3 S2/S3
3 Mean Growing Temp S2 S1/S2 S2 S1/S2
(a) (b)
Figure 4.2: Climatic factors suitability map of maize (a) and sorghum (b) for rainfed agriculture (Ebrahim Esa, 2013)

ERJSSH 1 (1), September-October 2014
135
with 32.62% and 58.80% for maize production, respectively (Figure 4.3 and
Table 4.3). However, only small patches of the land were regarded as highly
suitable (S1) and not suitable (N1) for maize production. On the other hand,
the result of the analysis for sorghum production indicated that the study
area was largely evaluated as moderately suitable (S2) and marginally suit-
able class with 22.51% and 52.79% area coverage, respectively. However,
about 20.45% of the land was evaluated as not suitable class as shown in
Figure 4.3 and Table 4.3. Therefore, an extremely small area is highly suit-
able (S1) for the production of maize and sorghum in the wereda.
(a) (b)
Figure 4.3: Soil suitability class for maize (a) sorghum (b) for rainfed agriculture (Ebrahim Esa, 2013)
Table 4.3 (a) and (b) representing soil suitability classes and limiting factors of Maize and Sorghum for rainfed agriculture, respectively
(Ebrahim Esa, 2013)
No. Area Coverage Soil Suitability classes for maize
Limiting factors Hectare %
(a) 6,503.48 4.26 S1 None 49,764.16 32.62 S2 Flooding
89,700.26 58.80
S3
Flooding, Workability, drainage, erosion
6,571.63 4.31 N1 Flooding, workability (b) Hectare % Soil Suitability
classes for sorghum Limiting factors
6,489.48 4.25 S1 None 34,333.80 22.51 S2 drainage, workability, erosion 80,524.00
52.79 S3 Flooding, drainage, workability,
erosion 31,188.60
20.45 N1 Flooding, drainage, workability, etc.

ERJSSH 1 (1), September-October 2014
136
Total Suitability
The final suitability maps resulting from the spatial overlay of factors and the
corresponding areal coverage in Dera wereda are shown in Figure 4.4 and
Table 4.4 for sorghum and maize, respectively. The three parameter overlays
for land suitability evaluations are given equal weights assuming that they
have similar influences in determining the suitability of the land for sustain-
able production of sorghum and maize crops in rainfed agriculture. The re-
sults of the weighted overlay for biophysical (climate, topography and soil)
suitability evaluation using the simple limitation approach (SLA) identified
that 40.25% and 59.75%, and 70.67% and 27.36% of the total land of the
wereda was evaluated as moderately and marginally suitable area for sor-
ghum and maize production, respectively. However, only small patches of the
area were weighted as highly suitable and not suitable for maize production.
Table 4.4 Suitability classes and limiting factors for Sorghum and Maize in Dera wereda, respectively.
Suitability classes
Sorghum Maize Area (ha) % Area (ha) %
S1 - - 2,865.35 1.90 S2 60,780.17 40.25 106,684.07 70.67 S3 90,241.11 59.75 41,304.21 27.36 N1 - - 107.03 0.07
(a) (b)
Figure 4.4: Total suitability class values of Sorghum (a) and Maize (b) crops (Ebrahim Esa, 2013)

ERJSSH 1 (1), September-October 2014
137
Therefore, the largest proportion of the land was only moderately suitable for
maize (70.67%), but it is marginally suitable for sorghum production
(59.75%) in the wereda.
Conclusion
Although there were almost no areas which showed no limitations for both,
sorghum and maize crops, the largest proportion of the land was only moder-
ately suitable for maize (70.67%), but it was marginally suitable for sorghum
production (59.75%) in sustainable rainfed agriculture of the wereda. The
marginally suitable (S3 class) for sorghum were evaluated as land unit where
aggregate limitations are more severe for sustained application of a given use
and will thus reduce productivity or increase required inputs that will only
be marginally justified. However, the moderately suitable class for the maize
represented land unit where limitations will reduce productivity and increase
required inputs to the extent that the overall productivity will still be attrac-
tive for sustained application of a given use.
The main restricting factors observed for good land suitability in the
study area were water logging and the resulting poor aeration for rooting con-
ditions, workability problems during the wet season cultivation in the north
and northwest and poor nutrient availability in some patches of northern
and eastern parts of the wereda. In addition, areas in the south and south-
eastern parts of the wereda are sensitive to erosion hazards due to changes
in altitude more frequently than in the other parts of the wereda. Therefore,
improved drainage conditions, soil inputs like fertilizers and sustainable soil
conservation are an important land management approaches to enhance
sustainable productions in the study area.
The study provides information about the suitability of sorghum and
maize in the study area and hence offers farmers alternative land uses to
lessen the risk of crop failure. The suitability maps can be overlaid with the
district administrative map and be used to show specific locations or sub-
locations where the two crops are at different suitability classes.
Land suitability evaluation in rainfed agriculture is a very important
piece of information in order to help agriculture development planners and

ERJSSH 1 (1), September-October 2014
138
decision makers for sustainable crop productions. The suitability maps could
also be used by extension agents and farmers to make choice of appropriate
uses for specific areas. Therefore, a GIS based approach cannot be over-
looked in this study as a useful tool in land suitability assessment for agri-
cultural planning.
Acknowledgements I would like to acknowledge Dr. Mohammed Assen (Associate Professor,
AAU) for his professional advice and encouragement in this work. I would
also like to thank the University of Gondar, College of Social Science
and the Humanities and the Ethiopian Renaissance Journal of Social Sci-
ences and Humanities (ERJSSH) for publishing this research work.
References Belay Simane, et al. (2013). Agroecosystem Analysis of the Choke Mountain
Watersheds, Ethiopia. Sustainability 5, 592-616.
Chamberlin, Jordan & Schmidt, Emily (2011). Ethiopian Agriculture: a Dy-
namic Geographic Perspective; ESSP II Working Paper 017. Addis
Ababa, Ethiopia (Development Strategy and Governance Division, In-
ternational Food Policy Research Institute. Ethiopia Strategy Support
Program II).
Driessen, P. & Deckers, J. (Eds.). (2001). World Soil Resources Reports:
Lecture Notes of the Major Soils of the World. FAO: Rome, Italy.
FAO (1976). A Framework for Land Evaluation: FAO Soil Bulletin 32. Rome,
Italy.
FAO (1984). Guidelines: Land Evaluation for Rainfeed Agriculture. Rome, Italy.
FAO (2007). Land Evaluation: Towards a Revised Framework. Rome, Italy.
FAO (2006). World Reference Base for Soil Resources 2006: a Framework for
International Classification, Correlation and Communication. Rome,
Italy.
Gatheru, M. & Maingi, P.M. (2010). Evaluation of Land Suitability for Maize
Using Geographic Information Systems (GIS): a Case Study for Two
Maize Varieties in Machakos District. Proceeding at the 6th National

ERJSSH 1 (1), September-October 2014
139
Fertilizer Conference, Loresho, Nairobi, 20-21st August, 309-315.
Hurni, Hans (1998). Agroecological Belts of Ethiopia: Explanatory Notes on
Three Maps at a Scale of 1:1,000,000. Soil Conservation Research Pro-
gramme, Ethiopia.
Kuit, Michiel & Jansen, Don M. & Van Thiet, Nguyen (2004). Coffee
Handbook: Manual for Arabica Cultivation. Quang Tri, Vietnam: tan l
am Agricultural Product Joint Stock Company and Project “Improvement
of Coffee Quality and Sustainability of Coffee Production in Vietnam”.
Perveen, M.F., et al. (no date). Crop-land Suitability Analysis Using a Multicri-
teria Evaluation & GIS Approach. Tottori University, Japan.
Pirbalouti, A.G., et al. (2011). GIS Based Land Suitability Assessment for
German Chamomile Production. Bulgarian Journal of Agricultural Sci-
ence 17 (1), 93-98.
Rabia, A.H. (2012). A GIS Based Land Suitability Assessment for Agricultural
Planning in Kilte Awulaelo District, Ethiopia. The 4th International
Congress of ECSSS, EUROSOIL 2012, 2-6 June, Bari, Italy. 12-57.
Sys, C., et al. (1991). Land Evaluation Part II: Crop Requirement. Agricultural
Publication 7. Brussles, Belgium.
Temesgen, T.D. (2010). Factors Affecting the Choices of Coping Strategies for
Climate Extremes: the Case of Farmers in the Nile Basin of Ethiopia.
Centre for Environmental Economics and Policy for Africa; Final
START, ACCFP Report. Pretoria, SA.