Land Development Risks Along State Transportation … · Research Office Washington State ......
70
September 2013 Anne Vernez Moudon Amir Sheikh Andy Kraus Orion Stewart Mark E. Hallenbeck WA-RD 805.1 Office of Research & Library Services WSDOT Research Report Land Development Risks Along State Transportation Corridors
Transcript of Land Development Risks Along State Transportation … · Research Office Washington State ......
September 2013Anne Vernez MoudonAmir SheikhAndy KrausOrion StewartMark E. Hallenbeck
WA-RD 805.1
Office of Research & Library Services
WSDOT Research Report
Land Development Risks Along State Transportation Corridors

Final Research Report Agreement T4118, Task 91 Land Development Risks
LAND DEVELOPMENT RISKS
ALONG STATE TRANSPORTATION CORRIDORS
by
Anne Vernez Moudon, Professor Amir Sheikh, GIS Analyst and Andy Kraus, Doctoral Research Assistant
Orion Stewart, MUP, Research Scientist URBAN FORM LAB (UFL)
University of Washington, Box 354802 Seattle, Washington 98195
Mark E. Hallenbeck, Director
Washington State Transportation Center
Washington State Transportation Center (TRAC)
University of Washington, Box 354802 Seattle, Washington 98105-4631
Washington State Department of Transportation Technical Monitor Karena Houser, Transportation Planning Specialist
Prepared for The State of Washington
Department of Transportation Lynn A. Peterson, Secretary
September 2013

1. REPORT NO. 2. GOVERNMENT ACCESSION NO. 3. RECIPIENT'S CATALOG NO.
WA-RD 805.1 4. TITLE AND SUBTITLE 5. REPORT DATE
LAND DEVELOPMENT RISKS ALONG STATE September 2013 TRANSPORTATION CORRIDORS 6. PERFORMING ORGANIZATION CODE 7. AUTHOR(S) 8. PERFORMING ORGANIZATION REPORT NO.
Anne Vernez Moudon, Amir Sheikh, Orion Stewart, Andy Kraus, Mark E. Hallenbeck
9. PERFORMING ORGANIZATION NAME AND ADDRESS 10. WORK UNIT NO.
Washington State Transportation Center (TRAC) University of Washington, Box 354802 University District Building; 1107 NE 45th Street, Suite 535
11. CONTRACT OR GRANT NO.
Seattle, Washington 98105-4631 Agreement T4118 Task 91 12. SPONSORING AGENCY NAME AND ADDRESS 13. TYPE OF REPORT AND PERIOD COVERED
Research Office Washington State Department of Transportation Transportation Building, MS 47372
Final Research Report
Olympia, Washington 98504-7372 14. SPONSORING AGENCY CODE
Project Manager: Kathy Lindquist, 360-705-7976 15. SUPPLEMENTARY NOTES
16. ABSTRACT:
Land development that is not coordinated with transportation planning can compromise the performance
of Washington’s state routes. Identifying land at risk for development along state routes can provide
opportunities for proactive, collaborative planning to improve access, mobility, and safety while supporting
economic development. This project, described in two parts, provides tools to help turn adverse risks of land
development into opportunities to make route improvements. In part one, systems for identifying land at risk for development were developed for the state and local
levels from relevant literature and expert input. Risk factors for land development at the state level include
historic population and job growth, population and job forecasts, and traffic conditions. Additional risk factors at
the local level include regulatory constraints, critical areas, vacant and undeveloped lands, recent sales history,
building permit history, and sewer and water utilities. The local level system was applied to three case study
areas. Results generally agreed with local knowledge, yet the method offered an objective and systematic means
for comparing corridors across the state fairly. In part two, a menu of strategies for responsibly developing state routes was developed from current
WSDOT practices, literature on standard approaches, and reports of novel solutions. Strategies were classified as
planning and coordination activities, non-engineering and engineering strategies, and funding/enforcement
strategies.
17. KEY WORDS 18. DISTRIBUTION STATEMENT
Land development, right of way, risk analysis,
transportation planning, corridor planning, forecasting,
land use, access management
No restrictions. This document is available to the public through the National Technical Information Service, Springfield, VA 22616
19. SECURITY CLASSIF. (of this report) 20. SECURITY CLASSIF. (of this page) 21. NO. OF PAGES 22. PRICE
None None

iii
DISCLAIMER
The contents of this report reflect the views of the authors, who are responsible for the
facts and the accuracy of the data presented herein. The contents do not necessarily reflect the
official views or policies of the Washington State Department of Transportation or Federal
Highway Administration. This report does not constitute a standard, specification, or regulation.

iv
v
CONTENTS
EXECUTIVE SUMMARY ................................................................................................. ix
INTRODUCTION................................................................................................................ 1
SCOPE OF WORK AND PROCESS ................................................................................ 1
PART I: FACTORS USED TO IDENTIFY ADVERSE RISK ....................................... 4
Literature Review................................................................................................................... 4 State-level Risk Factors ......................................................................................................... 7 Data .................................................................................................................................. 7 Analyses ........................................................................................................................... 7 Socioeconomic Factors .............................................................................................. 7 Traffic Conditions ...................................................................................................... 15 Composite Risk Score ................................................................................................ 15 Summary .......................................................................................................................... 18 Local-Level Risk Factors ....................................................................................................... 18 Case Study Area Determination....................................................................................... 18 Spokane/West Plains .................................................................................................. 20 Issaquah...................................................................................................................... 20 Three Creeks Special Planning Area: Clark County (including the Fairgrounds, Salmon Creek, and Pleasant Highlands Subareas) ................................................. 20 Local-Level Factors ......................................................................................................... 20 Data .................................................................................................................................. 23 Data Cleaning/Processing .......................................................................................... 23 Data Preparation and Development ........................................................................... 24 GIS Processing ................................................................................................................. 25 Analyses ........................................................................................................................... 26 Further Explorations of Underdeveloped and Re-developable Lands ............................. 33 Summary .......................................................................................................................... 35 Discussion and Conclusions .................................................................................................. 35 Calibrating the Risk Analysis with Historical Data ......................................................... 36 Improving Estimates of Development Capacity .............................................................. 36 Determining the Study Areas Is an Incomplete Science .................................................. 37
PART II: COLLABORATIVE STRATEGIES FOR MANAGING ADVERSE RISK 38
Overview of the Risk Mitigation Approach........................................................................... 38 Step 2: Manage Risk through Planning and Coordination..................................................... 39 Step 3: Identify Specific Non-Engineering Mitigation Strategies ......................................... 44 Step 4: Identify Specific Engineering Mitigation Strategies ................................................. 48 Step 5: Fund and/or Enforce Mitigation Strategies................................................................ 50
REFERENCES ..................................................................................................................... 52
APPENDIX 1: EXPERTS WHO PARTICIPATED IN THE ROUNDTABLE ............ 54
APPENDIX 2: REAL ESTATE DATA OVERVIEW ...................................................... 55
vi
FIGURES
1-1 Census Tracts That Fall within the Upper Quartile of Absolute and Percentage of Population Change.................................................................................................... 9
1-2 Census Tracts That Fall within the Upper Quartile of Absolute and Percentage of Job Change ............................................................................................................... 10
1-3 Counties That Fall within the Upper Quartile of Absolute and Percentage of Projected Population Change ................................................................................... 11
1-4 County and County Aggregations That Fall within the Upper Quartile of Absolute and Percentage of Projected Employment Change ................................... 12
1-5 Factor Scaling for Census Tracts (Combination of Statewide Factors Given Equal Weights) ......................................................................................................... 14
1-6 Line Density of Composite Risk Score within 0.5-Mile Buffer (Statewide) ........... 16
1-7 Line Density of Composite Risk Score within 0.5-Mile Buffer ............................... 17
1-8 Land Development Risk Case Study Areas.............................................................. 19
1-9 West Plains Area, Factors Used for Likelihood of Development for the Case Studies.............................................................................................................. 27
1-10 West Plains Area, Zoning Data with Weights Added According to Specific Zoning Designations for the Likelihood of Land Development .............................. 28
1-11 Development Risk Per Parcel for the Greater West Plains/Airway Heights Study Area ................................................................................................................ 29
1-12 Detail of Development Risk of Vacant Parcels for the West Plains Airway Heights, and Spokane International Airport Study Area .......................................... 30
1-13 West Plains Area, Risk of Development with Sewer and Water Utilities Overlaid. 31
1-14 Three Creeks Area, Development Risk of Parcels ................................................... 32
1-15 Risk of Development for Underdeveloped Land for the Greater West Plains Study Area ................................................................................................................ 34
vii
TABLES
1-1 Examples of Approaches to Identify Corridors Most At Risk for Development ..... 5
1-2 Weighting of Individual Risk Factors for Land Development ................................. 6
1-3 Statewide Factors and Data Sets .............................................................................. 7
1-4 Descriptive Statistics of Statewide Analysis ............................................................ 8
1-5 Number of Scored Census Tracts by County ........................................................... 13
1-6 Case Study Data ....................................................................................................... 22
2-1 Strategies for Planning and Coordination ................................................................ 42
2-2 Non-engineering Mitigation Strategies .................................................................... 46
2-3 Engineering Mitigation Strategies ............................................................................ 49
2-4 Fund and/or Enforce Mitigation Strategies .............................................................. 51

viii
ix
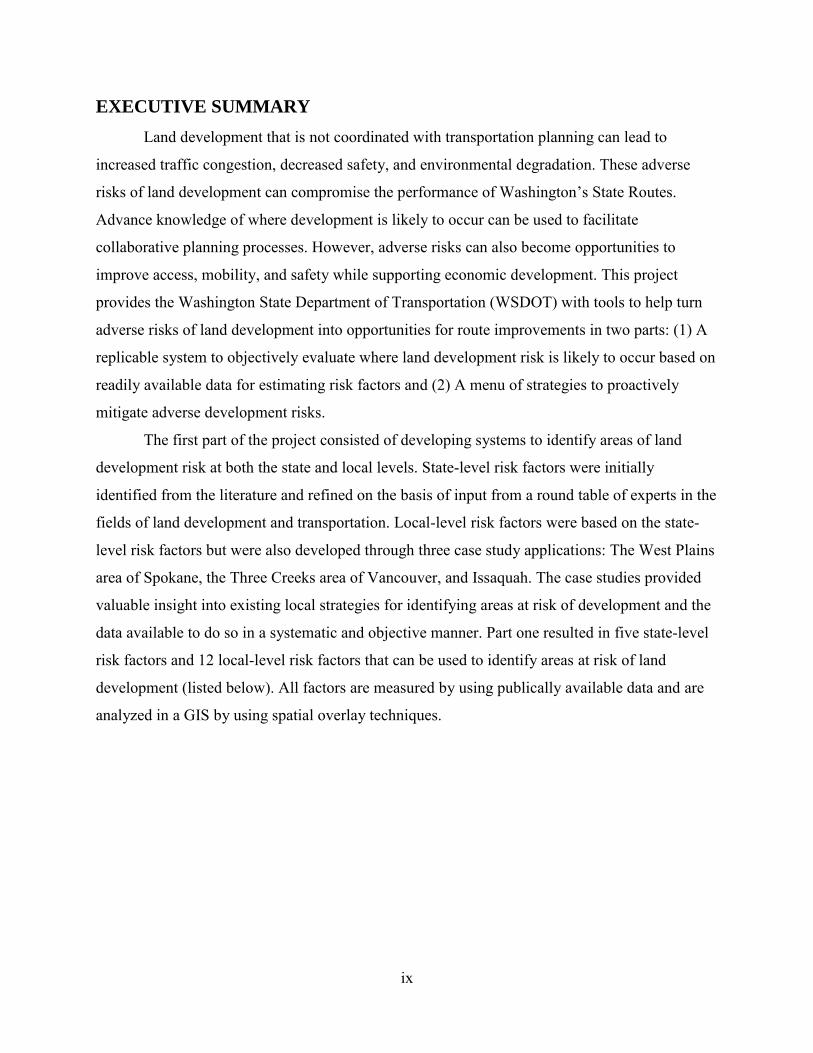
EXECUTIVE SUMMARY
Land development that is not coordinated with transportation planning can lead to
increased traffic congestion, decreased safety, and environmental degradation. These adverse
risks of land development can compromise the performance of Washington’s State Routes.
Advance knowledge of where development is likely to occur can be used to facilitate
collaborative planning processes. However, adverse risks can also become opportunities to
improve access, mobility, and safety while supporting economic development. This project
provides the Washington State Department of Transportation (WSDOT) with tools to help turn
adverse risks of land development into opportunities for route improvements in two parts: (1) A
replicable system to objectively evaluate where land development risk is likely to occur based on
readily available data for estimating risk factors and (2) A menu of strategies to proactively
mitigate adverse development risks.
The first part of the project consisted of developing systems to identify areas of land
development risk at both the state and local levels. State-level risk factors were initially
identified from the literature and refined on the basis of input from a round table of experts in the
fields of land development and transportation. Local-level risk factors were based on the state-
level risk factors but were also developed through three case study applications: The West Plains
area of Spokane, the Three Creeks area of Vancouver, and Issaquah. The case studies provided
valuable insight into existing local strategies for identifying areas at risk of development and the
data available to do so in a systematic and objective manner. Part one resulted in five state-level
risk factors and 12 local-level risk factors that can be used to identify areas at risk of land
development (listed below). All factors are measured by using publically available data and are
analyzed in a GIS by using spatial overlay techniques.
x
State-level risk factors Local risk factors
Historic population and job growth (2 factors) Historic population and job growth (2 factors) Population and job forecasts (2 factors) Population and job forecasts (2 factors) Traffic conditions Traffic conditions
Regulatory constraints (zoning and urban growth boundaries)
Critical Areas Vacant and undeveloped lands Recent sales history Building permit history
Sewer and water utilities
The second part of this project identified ways in which WSDOT can collaboratively and
proactively work with local agencies, developers, and other stakeholders to encourage
responsible development along state routes. This menu of strategies was developed from current
WSDOT practices, literature on standard approaches, and reports of novel solutions. Strategies
were classified as planning and coordination activities, non-engineering and engineering
strategies, and funding/enforcement strategies. The appropriate strategy will depend on the
corridor and development characteristics as well as the available resources.
Feedback from transportation and land-use professionals indicated that the state and local
factors for identifying development risk work well. Case study results generally agreed with
local knowledge, yet the method offers an objective and systematic means for comparing
corridors across the state fairly. Additional work is necessary to calibrate the risk factors to
optimize the ability to predict where development will occur and to improve estimates of land
development capacity to better estimate how much added demand on transportation facilities will
result from development. These improvements would result in a powerful tool that could be used
to strategically allocate resources where proactive planning could result in the best return on
investment.
1
INTRODUCTION
Land development can compromise the performance of the state transportation system.
Potential risks to the state transportation system from land development include increased traffic
volumes; parking, loading, and turning impacts; safety issues; light, glare and other driver
distractions; storm water runoff; increased right-of-way acquisition costs; and incompatible
development. If these risks are realized, political pressure may mount to fund expensive retrofits
or capacity improvements that impose both short-term and long-term social, environmental, and
financial costs. Identifying the corridors most likely to be affected by development will help the
Washington State Department of Transportation (WSDOT) strategically target its planning
resources. WSDOT can then work more closely with local governments to develop and
implement proactive strategies and lower-cost practical solutions for the transition of these state
highway facilities to support more urban development, economic development opportunities, and
community quality of life.
This short-term project had two goals:
1. to develop a framework for a repeatable, data-driven method to identify and
prioritize sections of state transportation infrastructure vulnerable to land
development; the goal was to develop and test an evidence-based method that
will enable state planners to compare, prioritize, and benchmark needs for risk
management on state transportation corridors
2. to create a menu of appropriate collaborative strategies for managing adverse
risks.
SCOPE OF WORK AND PROCESS
Several questions were posed at the inception of this project that framed the approach to
assessing the relative risk of land development along transportation corridors:
What are the sources of land development risk to the transportation system?
What are the relative likelihoods of development occurring along transportation
corridors?
Where are these risks most likely to occur?
2
What are the potential consequences and horizons?
What can WSDOT do to manage or mitigate the risks?
What are the most effective strategies for balancing costs, benefits, and risks?
How can WSDOT collaborate with local governments to implement these strategies
proactively?
At its inception, the project was set up to address land development risk at the state and
local levels. The state level would require a more general set of criteria and measures to assess
risk than the local level. Also, different data would be available at these two levels. Three case
studies were planned for the local level, with the goal of engaging local planners in the
development of the framework for risk assessment.
A series of workshops were held with transportation and urban planning professionals as
well as development stakeholders. First, a round table meeting was held on January 28, 2013, at
the University of Washington, which gathered experts in the field of land development and
transportation (see Appendix 1). These experts reviewed a preliminary list of factors to be
considered in future work. Preliminary factors were presented by the research team along with
data sources that were expected to be available for the study. A range of case studies was
considered by the participants, and three cases were selected:
West Plains, a case study featuring SR 2 as it passes through Airway Heights in
Spokane County
Three Creeks, a case study featuring land development near the I-5/I-205 interchange
in Clark County, and
Issaquah, for development north of I-90.
Second, the West Plains Workshop was held on May 20, 2013, at the offices of the
Spokane Regional Transportation Council (SRTC). This meeting allowed the project team to
physically tour one of the case study sites, listen to discussions about development potential from
representatives of each of the jurisdictions and agencies actively involved in the West Plains
study area, present the preliminary findings from the new risk identification tool, gain feedback
on differences between what the tool identified and what the local planners expected, identify
weaknesses in the tool, and gain insight into how the prototype risk identification tool could be
improved.
3
A third and final workshop took place in Tumwater on June 10, 2013. At that workshop,
the project team presented the findings of both the West Plains and Three Creeks case studies.
Only partial findings could be presented on the Issaquah case study, as key data had yet to be
obtained on that project. The workshop attendees were all WSDOT staff. The workshop
attendees provided feedback on the usefulness of the risk identification tool, described where and
when such a tool would be used and provided feedback to WSDOT’s Headquarters Community
Transportation Planning Office regarding the next steps for the project.
The project team used the results from these meetings and the lessons learned from
performing the three case studies to refine the risk identification tool and to develop the
recommendations for future WSDOT activities and follow-on work.
This report presents the results of this study in two parts. Part I, Risk Factors, presents a
framework for a repeatable, data-driven method to identify and prioritize sections of state
transportation infrastructure vulnerable to land development. And Part II, Collaborative
Strategies for Managing Adverse Risks, presents approaches to managing risk through planning
and coordination; reviews non-engineering (soft) and engineering (hard) mitigation strategies;
and discusses funding and enforcement of mitigation strategies.
4
PART I: FACTORS USED TO IDENTIFY ADVERSE RISK
This section describes the development of a system to identify sections of Washington
state routes that are at risk to the adverse effects of uncoordinated land development. First, the
literature was reviewed for examples of similar efforts to forecast land development risk for
transportation planning purposes. On the basis of the literature and expert input, factors that
represented greater or lesser risk of land development were identified. Publically available data
to measure these factors were collected and processed to produce two simple ranking systems for
development risk. The first system was at the state level and the second system was at the local
level. These two separate yet parallel systems were created because of the varying availability of
data at the state and local levels and the necessity to use coarser geographic units of analysis at
the state level and finer resolution geographic units of analysis at the local level. The statewide
system was applied to Washington state, while the local system was developed and applied in
conjunction with three case study areas: Spokane/West Plains, Issaquah, and a portion of the
Three Creeks Special Planning Area in Clark County (including the Fairgrounds, Salmon Creek,
and Pleasant Highlands subareas). Finally, this section discusses the strengths and limitations of
the two systems for identifying land development risk and proposes next steps to make the
system more useful for WSDOT corridor planning.
Literature Review
A growing number of initiatives call for the coordination and integration of both
transportation and land-use planning (NCHRP, Partnership for Sustainable Communities HUD,
DOT, EPA). Transportation agencies are seeking to implement strategies that help forecast land-
use change and evaluate their effect on transportation corridors.
Factors used for identifying and assessing the risk of adjacent land development are
numerous; they relate to the scope and objectives of the development, the scale of analysis, and
the availability of data. Past studies have indicated that the following factors serve to evaluate
land development risk: population and employment density, household demographic and socio-
economic information, land use and zoning, vacant land, environmentally constrained land,
underdeveloped land, improvement-to-land ratio, slope, proximity to existing development,
undervalued land [2-5]. Additional factors include network distances to amenities, commute
5
times, traffic capacity, and the profit ratio of parcels (method of incorporating land values vis-à-
vis costs for development) [6-8].
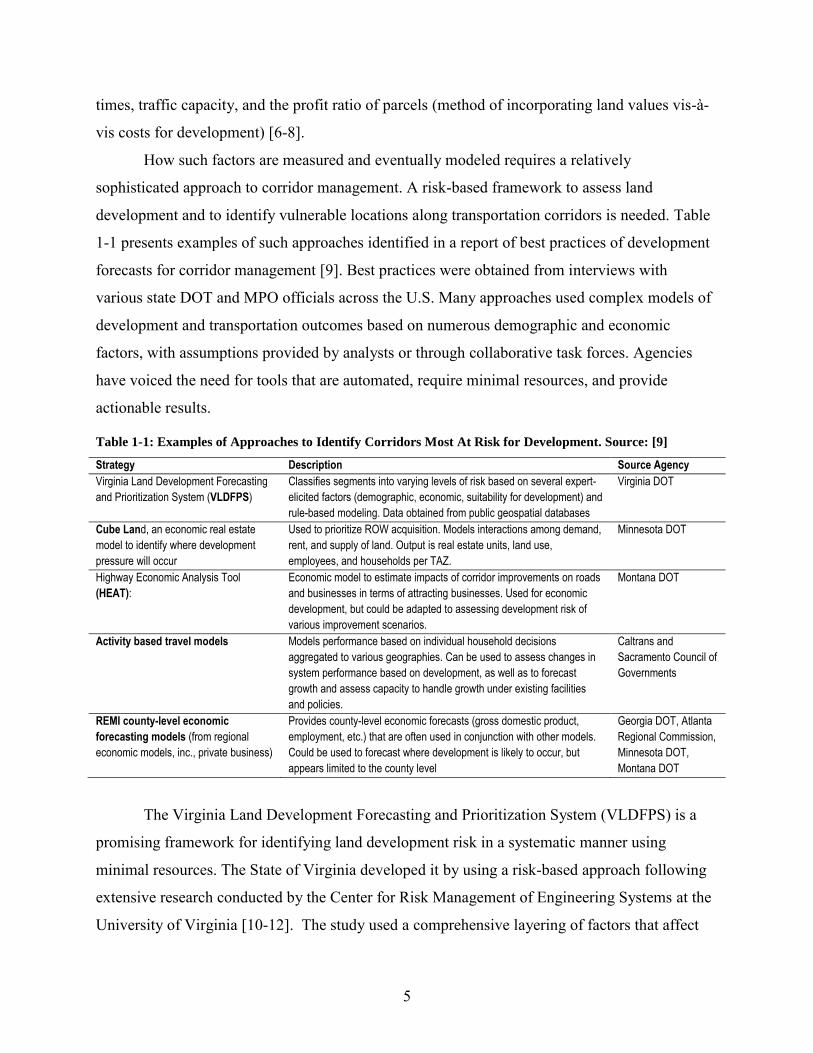
How such factors are measured and eventually modeled requires a relatively
sophisticated approach to corridor management. A risk-based framework to assess land
development and to identify vulnerable locations along transportation corridors is needed. Table
1-1 presents examples of such approaches identified in a report of best practices of development
forecasts for corridor management [9]. Best practices were obtained from interviews with
various state DOT and MPO officials across the U.S. Many approaches used complex models of
development and transportation outcomes based on numerous demographic and economic
factors, with assumptions provided by analysts or through collaborative task forces. Agencies
have voiced the need for tools that are automated, require minimal resources, and provide
actionable results.
Table 1-1: Examples of Approaches to Identify Corridors Most At Risk for Development. Source: [9]
Strategy Description Source Agency
Virginia Land Development Forecasting
and Prioritization System (VLDFPS)
Classifies segments into varying levels of risk based on several expert-
elicited factors (demographic, economic, suitability for development) and
rule-based modeling. Data obtained from public geospatial databases
Virginia DOT
Cube Land, an economic real estate
model to identify where development
pressure will occur
Used to prioritize ROW acquisition. Models interactions among demand,
rent, and supply of land. Output is real estate units, land use,
employees, and households per TAZ.
Minnesota DOT
Highway Economic Analysis Tool
(HEAT):
Economic model to estimate impacts of corridor improvements on roads
and businesses in terms of attracting businesses. Used for economic
development, but could be adapted to assessing development risk of
various improvement scenarios.
Montana DOT
Activity based travel models Models performance based on individual household decisions
aggregated to various geographies. Can be used to assess changes in
system performance based on development, as well as to forecast
growth and assess capacity to handle growth under existing facilities
and policies.
Caltrans and
Sacramento Council of
Governments
REMI county-level economic
forecasting models (from regional
economic models, inc., private business)
Provides county-level economic forecasts (gross domestic product,
employment, etc.) that are often used in conjunction with other models.
Could be used to forecast where development is likely to occur, but
appears limited to the county level
Georgia DOT, Atlanta
Regional Commission,
Minnesota DOT,
Montana DOT
The Virginia Land Development Forecasting and Prioritization System (VLDFPS) is a
promising framework for identifying land development risk in a systematic manner using
minimal resources. The State of Virginia developed it by using a risk-based approach following
extensive research conducted by the Center for Risk Management of Engineering Systems at the
University of Virginia [10-12]. The study used a comprehensive layering of factors that affect
6
the risk of land development and devised several risk management strategies and land
development models. The modeling layers consist of six steps: 1) the elicitation of factors most
influencing land development, 2) setting logical combinations of factors influencing land
development 3) measuring the potential for development, 4) assessing the sensitivity of results,
5) analyzing the transition of land from one state of development to another, and 6) determining
strategic actions to minimize regret and prioritizing investment [11].
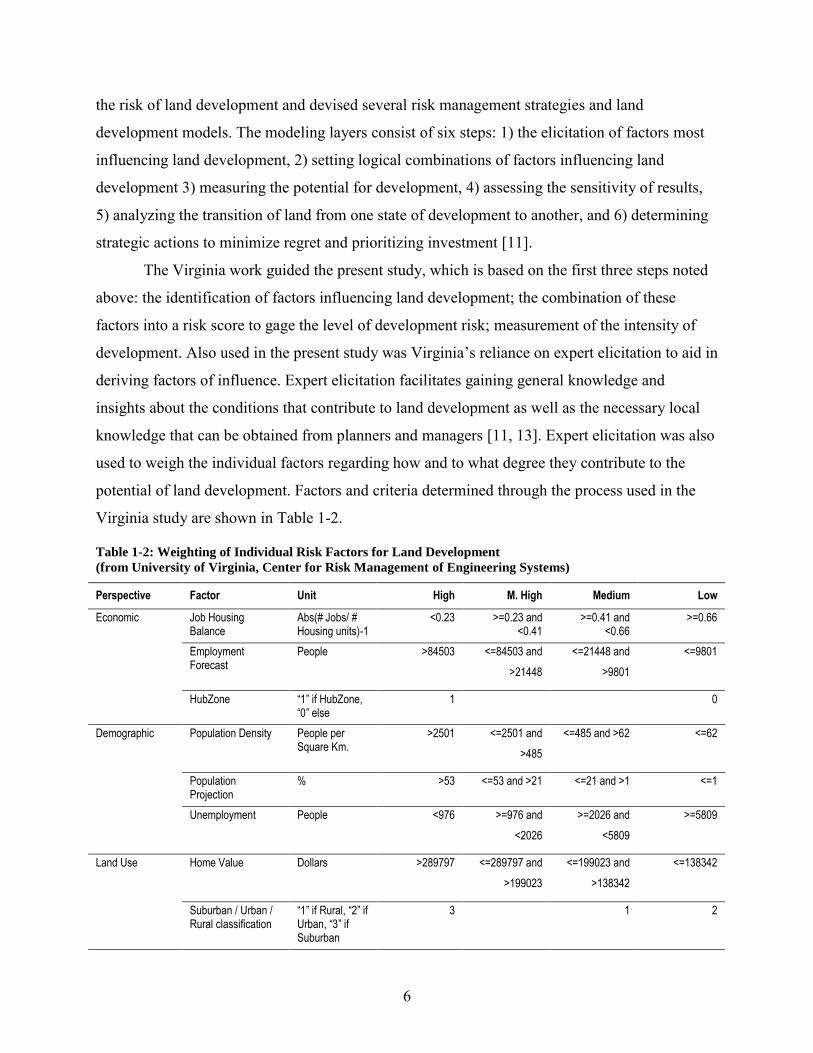
The Virginia work guided the present study, which is based on the first three steps noted
above: the identification of factors influencing land development; the combination of these
factors into a risk score to gage the level of development risk; measurement of the intensity of
development. Also used in the present study was Virginia’s reliance on expert elicitation to aid in
deriving factors of influence. Expert elicitation facilitates gaining general knowledge and
insights about the conditions that contribute to land development as well as the necessary local
knowledge that can be obtained from planners and managers [11, 13]. Expert elicitation was also
used to weigh the individual factors regarding how and to what degree they contribute to the
potential of land development. Factors and criteria determined through the process used in the
Virginia study are shown in Table 1-2.
Table 1-2: Weighting of Individual Risk Factors for Land Development
(from University of Virginia, Center for Risk Management of Engineering Systems)
Perspective Factor Unit High M. High Medium Low
Economic Job Housing Balance
Abs(# Jobs/ # Housing units)-1
<0.23 >=0.23 and <0.41
>=0.41 and <0.66
>=0.66
Employment Forecast
People >84503 <=84503 and
>21448
<=21448 and
>9801
<=9801
HubZone “1” if HubZone, “0” else
1 0
Demographic Population Density People per Square Km.
>2501 <=2501 and
>485
<=485 and >62 <=62
Population Projection
% >53 <=53 and >21 <=21 and >1 <=1
Unemployment People <976 >=976 and
<2026
>=2026 and
<5809
>=5809
Land Use Home Value Dollars >289797 <=289797 and
>199023
<=199023 and
>138342
<=138342
Suburban / Urban / Rural classification
“1” if Rural, “2” if Urban, “3” if Suburban
3 1 2
7
State-Level Risk Factors
A system for assessing the likelihood of land development along all Washington State
Routes was developed by using a GIS- based analysis. Factors that contributed to risk of land
development were evaluated through a series of spatial overlays. State-level factors were
selected following the literature search and review by experts present at the January 28, 2013,
roundtable.
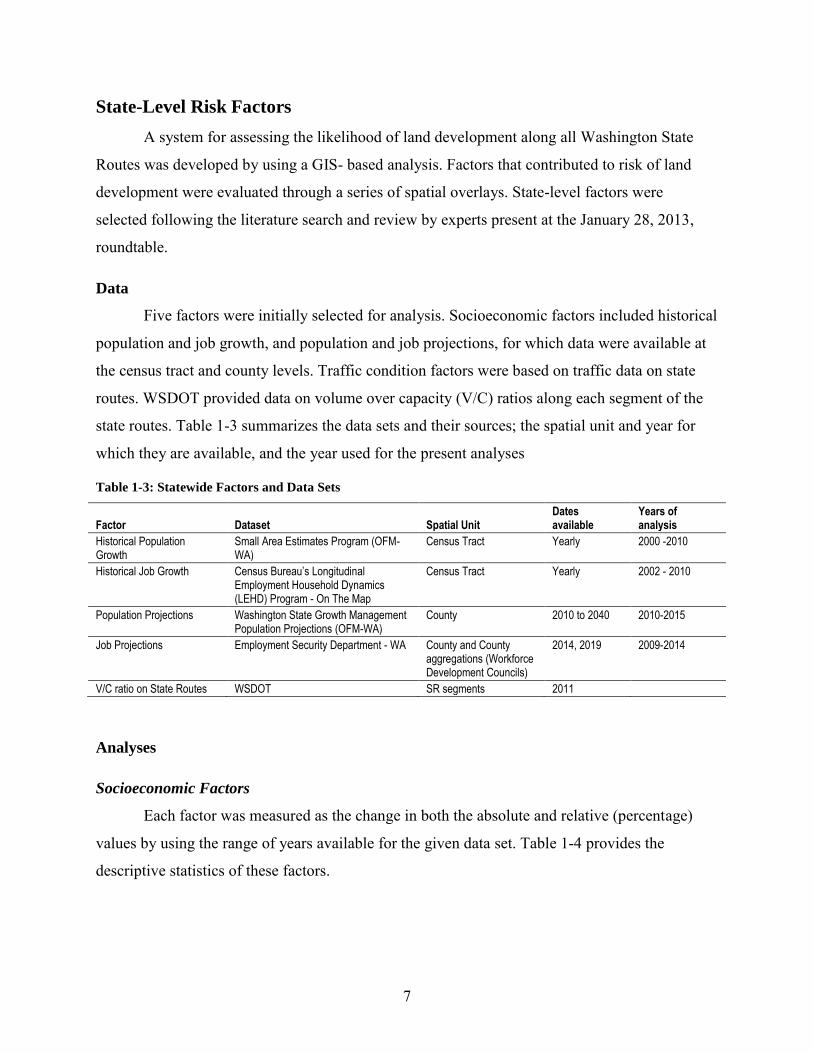
Data
Five factors were initially selected for analysis. Socioeconomic factors included historical
population and job growth, and population and job projections, for which data were available at
the census tract and county levels. Traffic condition factors were based on traffic data on state
routes. WSDOT provided data on volume over capacity (V/C) ratios along each segment of the
state routes. Table 1-3 summarizes the data sets and their sources; the spatial unit and year for
which they are available, and the year used for the present analyses
Table 1-3: Statewide Factors and Data Sets
Factor Dataset Spatial Unit Dates available
Years of analysis
Historical Population Growth
Small Area Estimates Program (OFM-WA)
Census Tract Yearly 2000 -2010
Historical Job Growth Census Bureau’s Longitudinal Employment Household Dynamics (LEHD) Program - On The Map
Census Tract Yearly 2002 - 2010
Population Projections Washington State Growth Management Population Projections (OFM-WA)
County 2010 to 2040 2010-2015
Job Projections Employment Security Department - WA County and County aggregations (Workforce Development Councils)
2014, 2019 2009-2014
V/C ratio on State Routes WSDOT SR segments 2011
Analyses
Socioeconomic Factors
Each factor was measured as the change in both the absolute and relative (percentage)
values by using the range of years available for the given data set. Table 1-4 provides the
descriptive statistics of these factors.
8
Table 1-4: Descriptive Statistics of Statewide Analysis
Factor count min max mean std. dev. 1st-quartile median 3rd-quartile
By census tract, 2000 – 2010 change
population (absolute change) 1446 -3195 8526 574.29 913.22 59 313.5 813.88
population (percent change) 1446 -100 15715 33.912 432.57 1.5785 8.043 19.92
employment (absolute change) 1446 -12002 30808 319.01 1408 -38 108.5 468
employment (percent change) 1446 -90.128 4546.2 28.387 153.55 -5.102 10.713 32.669
By county, 2010 – 2015 change
population projections (absolute change) 39 -60 81531 7632.3 15191 288 1677 9421.5
population projections (percent change) 39 -1.2357 12.272 3.1857 2.7024 1.1559 2.8706 4.5705
By county or county aggregations, 2009 – 2014 change
employment projections (absolute change) 12 5959 86498 19676 21943 7453 13575 21049
employment projections (percent change) 12 5.2797 11.319 7.4577 1.7968 6.2053 7.002 8.3785
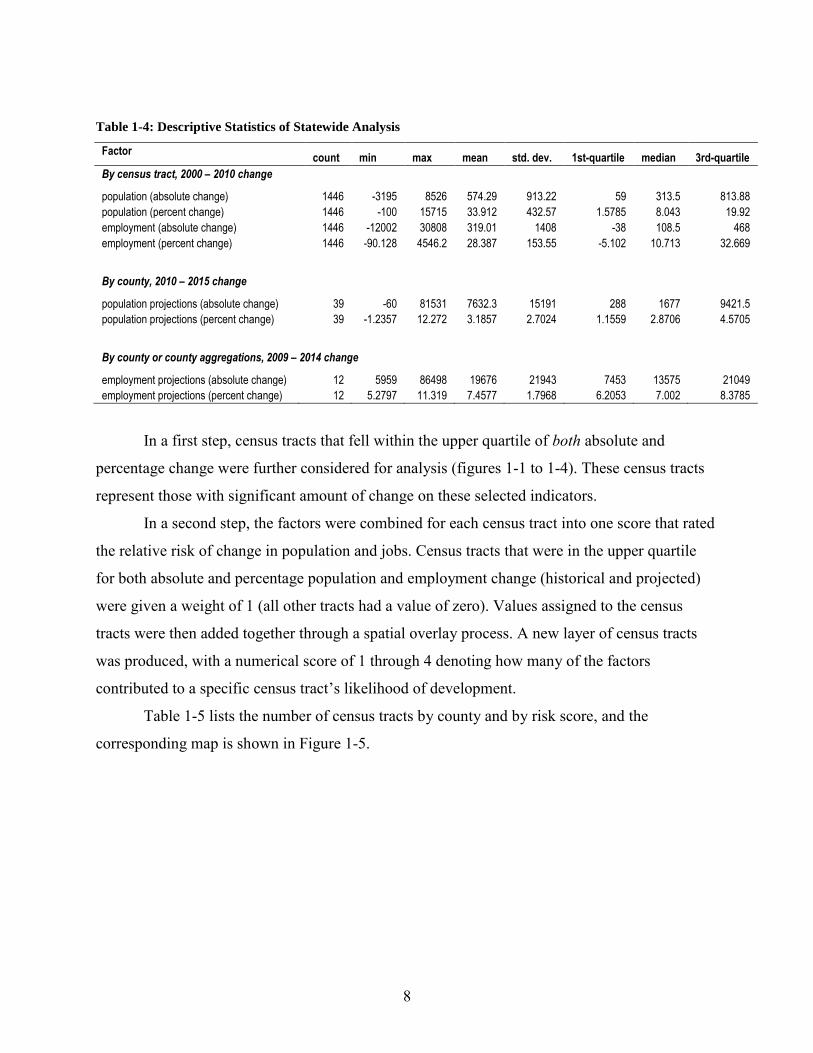
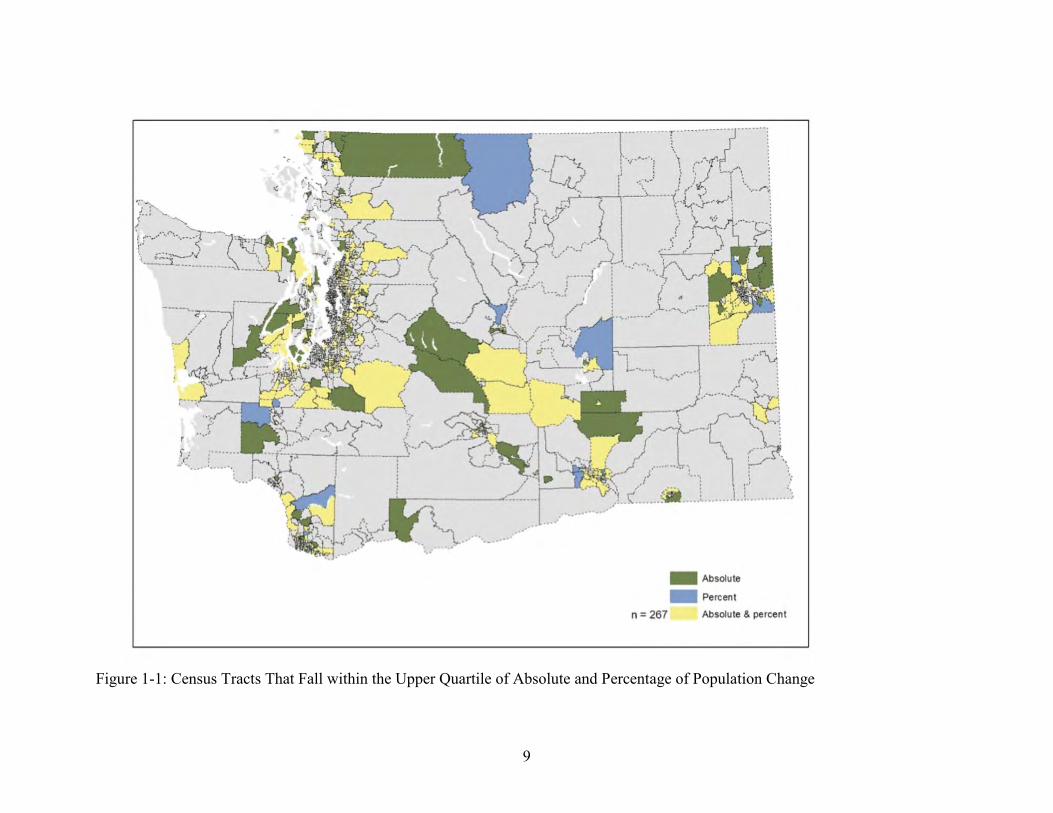
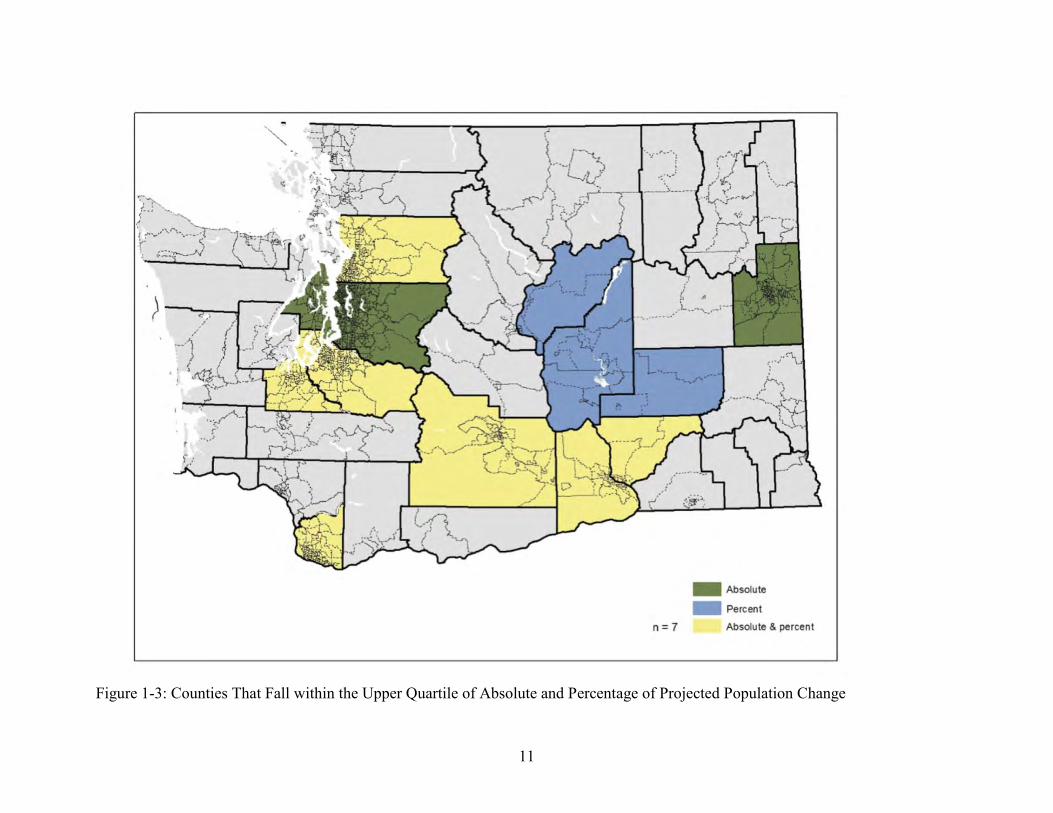
In a first step, census tracts that fell within the upper quartile of both absolute and
percentage change were further considered for analysis (figures 1-1 to 1-4). These census tracts
represent those with significant amount of change on these selected indicators.
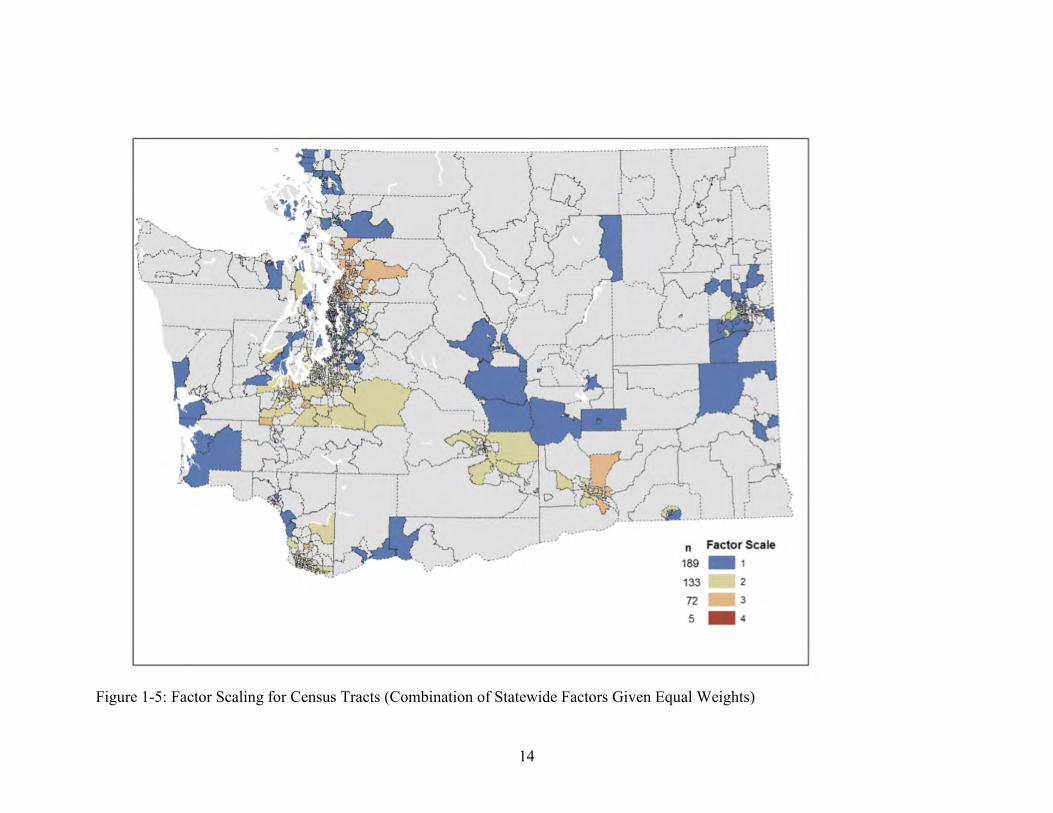
In a second step, the factors were combined for each census tract into one score that rated
the relative risk of change in population and jobs. Census tracts that were in the upper quartile
for both absolute and percentage population and employment change (historical and projected)
were given a weight of 1 (all other tracts had a value of zero). Values assigned to the census
tracts were then added together through a spatial overlay process. A new layer of census tracts
was produced, with a numerical score of 1 through 4 denoting how many of the factors
contributed to a specific census tract’s likelihood of development.
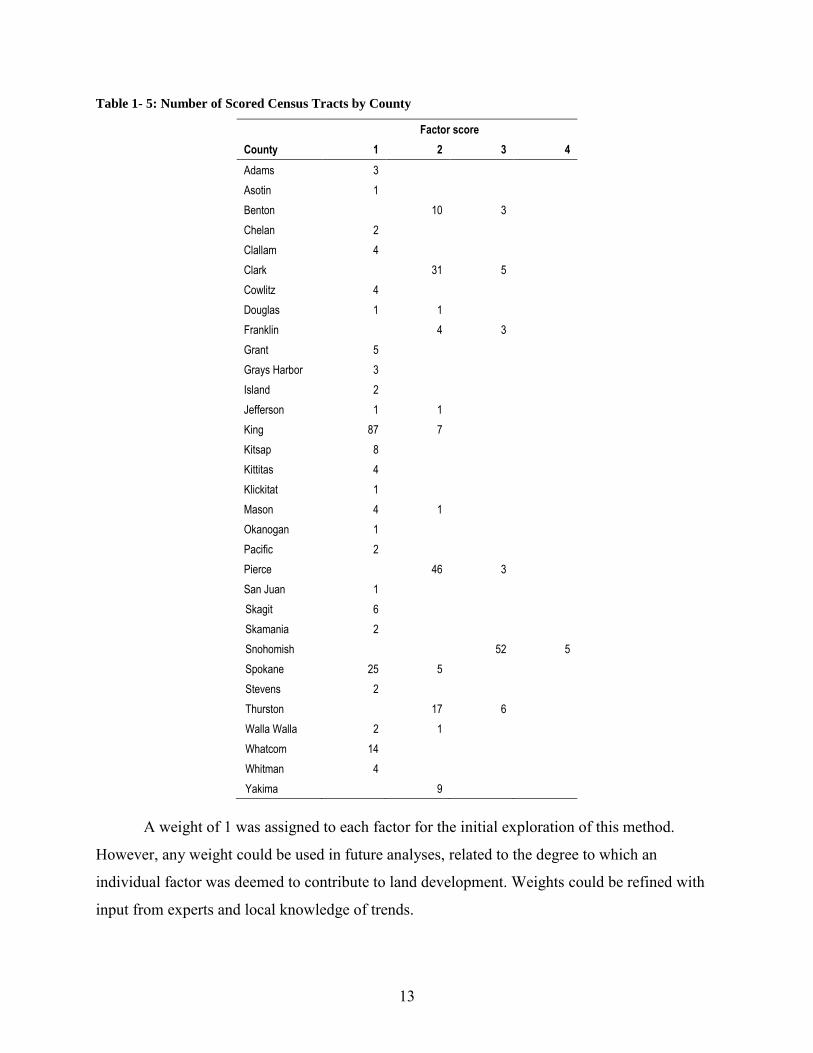
Table 1-5 lists the number of census tracts by county and by risk score, and the
corresponding map is shown in Figure 1-5.
9
Figure 1-1: Census Tracts That Fall within the Upper Quartile of Absolute and Percentage of Population Change

10
Figure 1-2: Census Tracts That Fall within the Upper Quartile of Absolute and Percentage of Job Change
11
Figure 1-3: Counties That Fall within the Upper Quartile of Absolute and Percentage of Projected Population Change
12
Figure 1-4: County and County Aggregations That Fall within the Upper Quartile of Absolute and Percentage of Projected Employment Change
13
Table 1- 5: Number of Scored Census Tracts by County
Factor score
County 1 2 3 4
Adams 3
Asotin 1
Benton 10 3
Chelan 2
Clallam 4
Clark 31 5
Cowlitz 4
Douglas 1 1
Franklin 4 3
Grant 5
Grays Harbor 3
Island 2
Jefferson 1 1
King 87 7
Kitsap 8
Kittitas 4
Klickitat 1
Mason 4 1
Okanogan 1
Pacific 2
Pierce 46 3
San Juan 1
Skagit 6
Skamania 2
Snohomish 52 5
Spokane 25 5
Stevens 2
Thurston 17 6
Walla Walla 2 1
Whatcom 14
Whitman 4
Yakima 9
A weight of 1 was assigned to each factor for the initial exploration of this method.
However, any weight could be used in future analyses, related to the degree to which an
individual factor was deemed to contribute to land development. Weights could be refined with
input from experts and local knowledge of trends.
14
Figure 1-5: Factor Scaling for Census Tracts (Combination of Statewide Factors Given Equal Weights)
15
Traffic Conditions
In a third step, two thresholds of volume over capacity (V/C) values were used in the
analysis: ≥ 0.7 and ≥ 1. A 0.5-mile buffer was used along all segments to (1) better display the
segments in the maps and (2) with GIS, capture the values of the census tract along the segments
(see “composite risk score” section).
In a fourth step of this analysis, state route segments with V/C values of ≥ 0.7 but < 1
were given a weight of 1, and segments with V/C values ≥ 1 were given a weight of 2.
Composite Risk Score
In a fifth step, a composite score of socio-economic and traffic conditions factors was
calculated. Factor scores for census tracts on the two sides of road segments (calculated in step
two) were then assigned to the closest state route segment. Of all the adjoining census tracts
along a particular segment, the value of that with the highest factor score was assigned to the
segment. To calculate the Composite Risk Score, the census tract factor score was simply added
to the score of the segment by using a spatial overlay function.
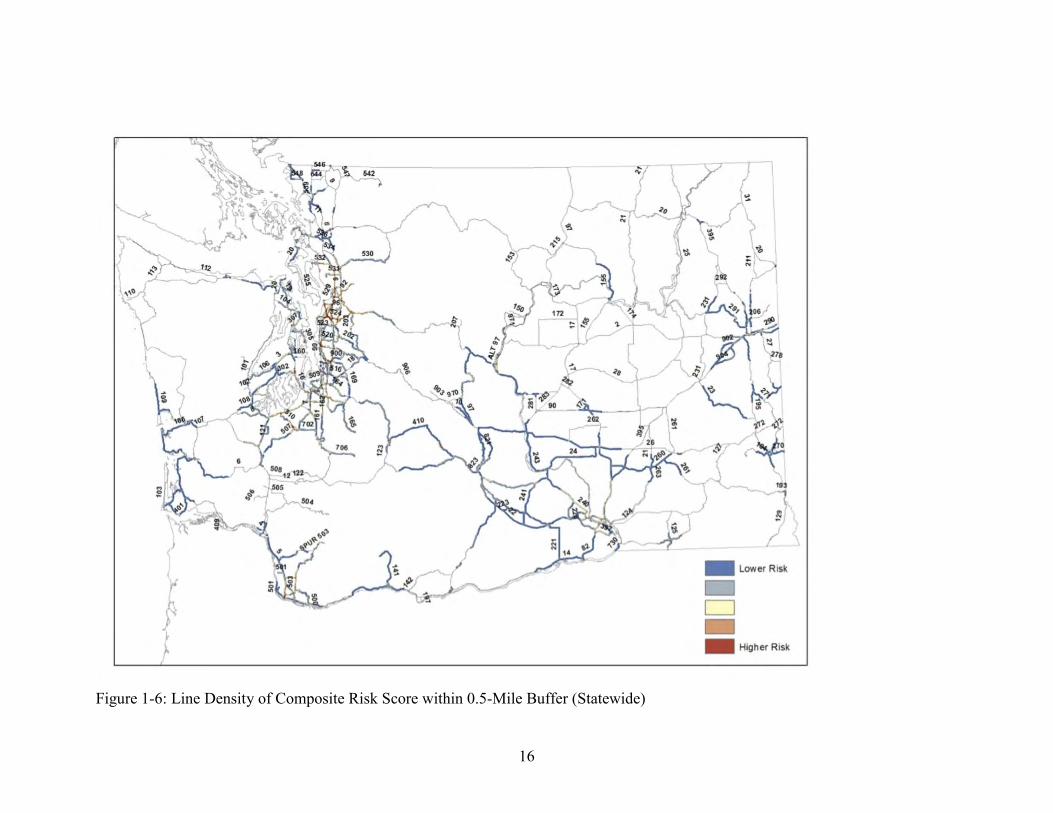
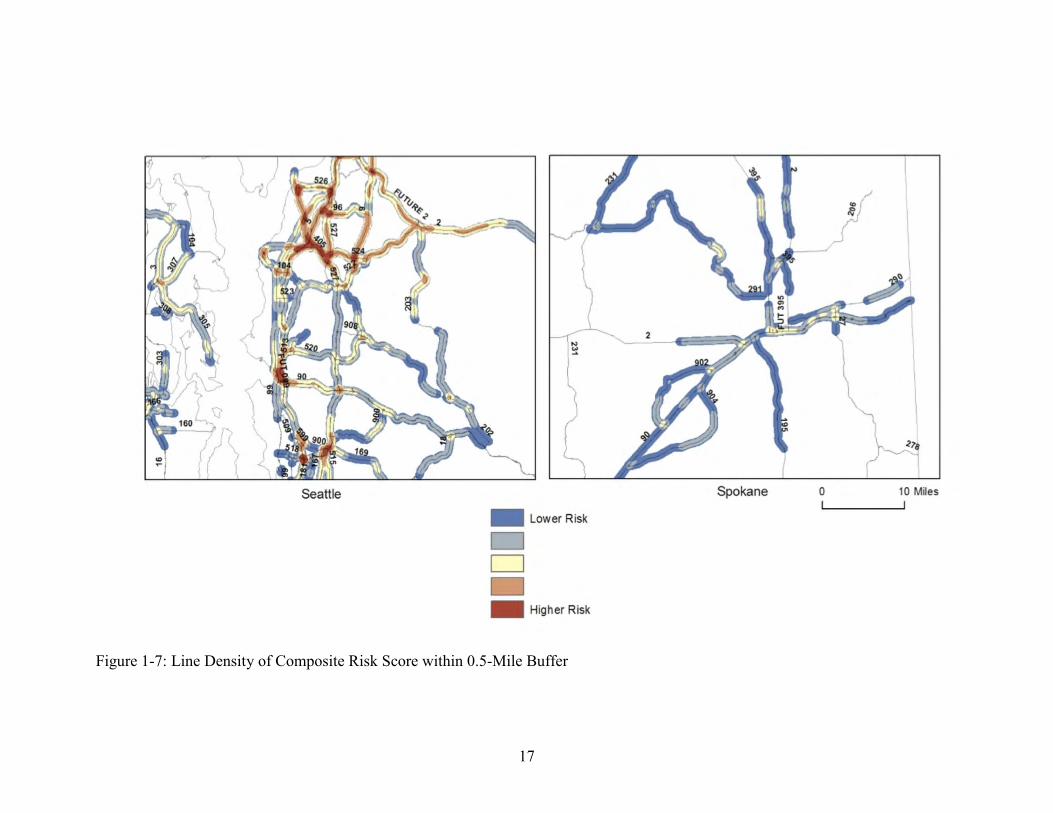
In a sixth and final step, a line density calculation was used to average the Composite
Risk Score within a 0.5-mile radius of the segments by using a 100-m grid (figures 1-6 and 1-7).
Census tract factor scores and segment scores were then calculated as follows:
Risk Score = length of segment that is ≥ .7 V/C * the combined census tract and segment score that fall with a 0.5-mile radius/ divided by the area of the circle within 0.5 miles from a tract.
This final step served two purposes: (1) to better display the results on a map—it
translated the segment polylines into buffered areas that display “thicker” segments; and (2) to
“smooth” the Composite Risk Score values between segments—by averaging the segment values
along a “moving window” at 100-foot intervals and within a 0.5-mile radius, adjacent segments
with different values could be read and measured as being continuous, an important
consideration, especially at road intersections.
16
Figure 1-6: Line Density of Composite Risk Score within 0.5-Mile Buffer (Statewide)
17
Figure 1-7: Line Density of Composite Risk Score within 0.5-Mile Buffer
18
Summary
The method used in this preliminary analysis is flexible. It can accommodate the same
type of data found at other scales where available. Other factors can be added or substituted as
deemed appropriate. For example, job forecast data were readily available at the aggregate
county scale. However, where available (Table 1-3), finer scale data could be incorporated for
analysis. Also, indicators other than volume/capacity ratios, such as percentage of posted speed,
could be substituted for traffic data. Finally, each factor can be given a weight that is
proportional to how that specific factor is known to contribute toward land development. The
specific weights given to the individual factors and the resolution of the data used will influence
the Composite Risk Score.
Local-Level Risk Factors
The state-level system for identifying land development risk can highlight corridors that
should be prioritized for proactive planning and eventual risk mitigation efforts. Once such
corridors have been identified, however, a more refined system is necessary to confirm that the
corridors are indeed of high risk and to pinpoint precisely which areas or parcels are at greatest
risk for land development. This will help planners understand the specific potential impacts on
the corridor and engage the appropriate development stakeholders. To develop this local system
for assessing risk along state corridors, three case studies were selected during the Land
Development Risk roundtable held on January 28, 2013, at the University of Washington with
members of the UW Urban Form Lab (UFL)/TRAC, WSDOT, and other invited parties. The
case studies were 1) West Plains, City of Airway Heights area just west of Spokane, 2) Three
Creeks Special Planning Area north of the Vancouver area, and 3) the area around the City of
Issaquah in King County.
Case Study Area Determination
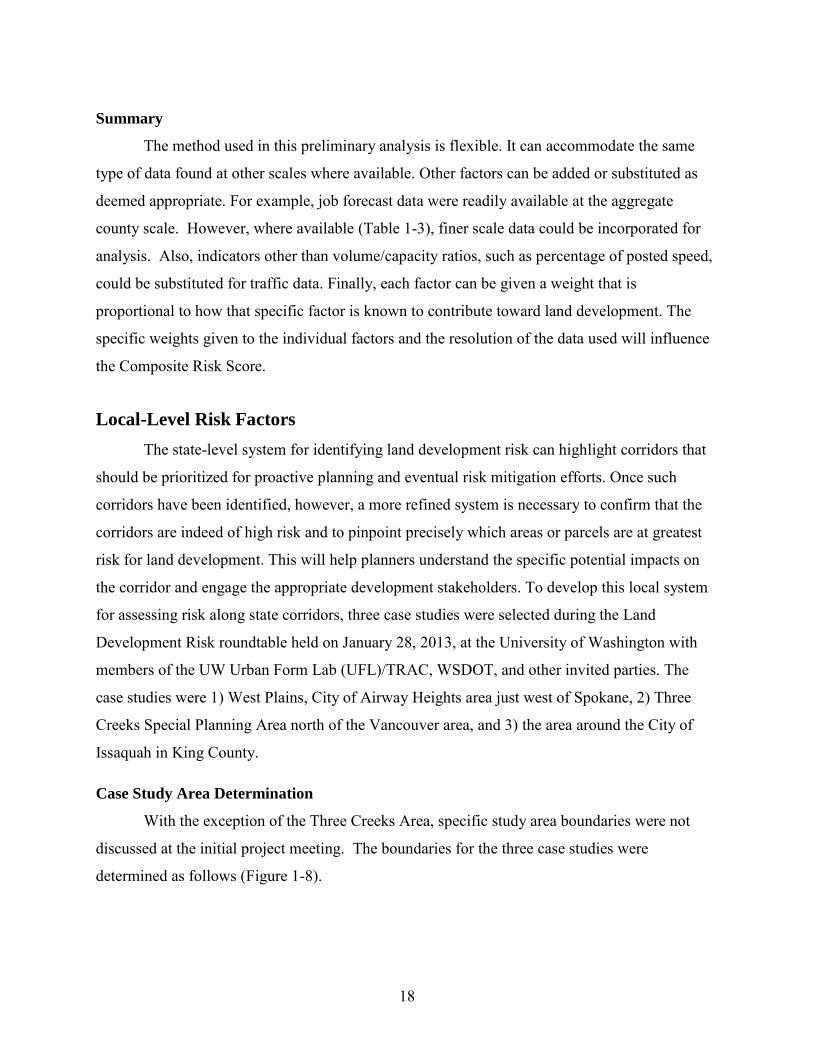
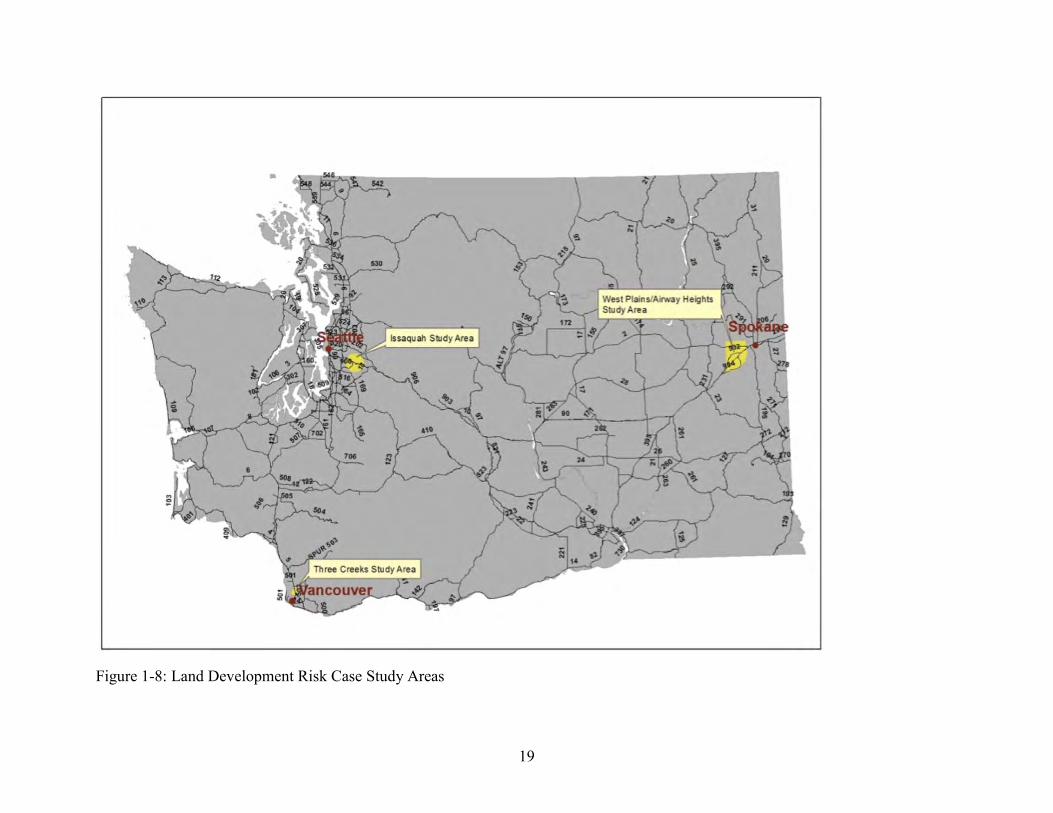
With the exception of the Three Creeks Area, specific study area boundaries were not
discussed at the initial project meeting. The boundaries for the three case studies were
determined as follows (Figure 1-8).
19
Figure 1-8: Land Development Risk Case Study Areas
20
Spokane/West Plains
In a document provided to the UFL [14], WSDOT initially identified a number of intersections along U.S. Highway 2 and Interstate-90 that had peak hour volumes at or greater than 90 percent. To capture all of these areas, we drew the study boundary as a wedge-shaped polygon roughly bounded by the intersection of Hwy 2 and I-90 in the east; Cheney-Spokane Road in the south; Espanola Road in the west; and a parallel line three miles north of Hwy 2 in the north. The rationale for this particular set of boundaries was to capture the area in which development might occur that would reasonably affect the intersections described in the WSDOT document [14]. This study area was divided into two sub-areas: 1) a north area surrounding Hwy 2; and 2) a south area surrounding Interstate-90.
Issaquah
The Issaquah case study was not originally included in the WSDOT document presented at the roundtable meeting, and as a result, little guidance was provided regarding the desired geographic scope of this case study. We applied a 5-mile buffer from the intersection of Interstate-90 and Front Street to serve as our study area. We chose a 5-mile buffer on the basis of a number of travel shed calculations made internally, as well as judgments based on the existing and potential development patterns in the area. While far from perfect, this 5-mile radius contained most of the development areas likely to affect the WSDOT-managed transportation network within and around Issaquah.
Three Creeks Special Planning Area: Clark County (including the Fairgrounds, Salmon
Creek, and Pleasant Highlands Subareas)
The initial case studies document presented the larger Three Creeks area as a potential study area but also offered the smaller Discovery/Fairgrounds, Salmon Creek/University District, and Pleasant Highlands sub-areas as being of particular interest to future transportation planning efforts. We used these three smaller areas as our study area boundary for this analysis.
Local-Level Factors
Factors identified for analysis at the case study level included the socioeconomic factors
selected for the statewide analyses. Census blocks were used rather than census tracts to provide
finer-grained spatial information. Factors relating to land use and regulations and economic
activity were added, with the following factors being included in the analyses of all three case
studies:
historical population and job growth
21
population and job projections
vacant parcels
zoning
recent real estate sales
urban growth boundaries
traffic volume and capacity on state and main routes.
Additional data were obtained, but because of time pressures, they were not used in all of the
analyses.
Building permit data from Clark County were used in the Three Creeks analysis, but
we did not obtain these data for the other two case studies.
Critical areas layers were not used because more detailed local knowledge was
needed to use them appropriately (i.e., various critical areas are developable to certain
degrees, and particular criteria determine the developability of the areas).
Data on utilities, such as sewer and water lines, were added after receiving feedback
on our initial findings at the Spokane workshop. These data were deemed to be
primary indicators of risk of development. The absence of sewers, for example,
would hold or at least slow development. Although not incorporated into the actual
final analysis, utilities data were overlaid for visualization purposes.
Historical parcel data were also acquired for future research, as they could calibrate
relationships between the variables and development outcomes (see future research
section: Calibrate Model with Historic Data).
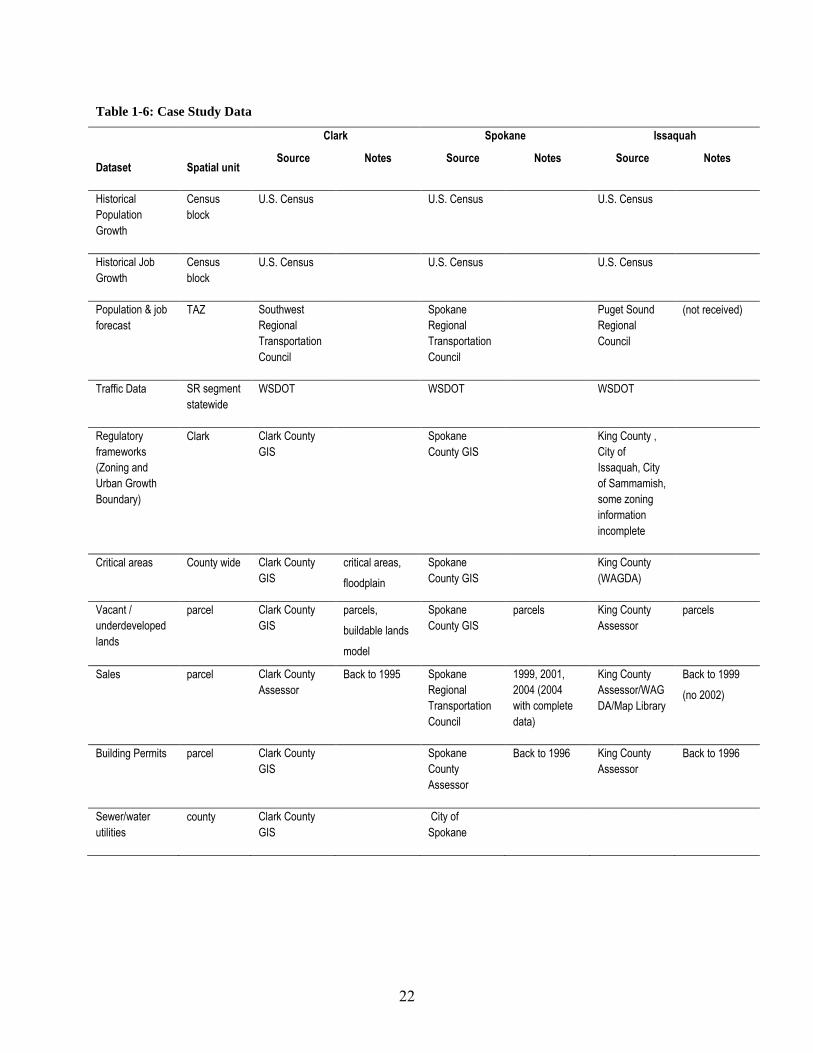
The various data sources are outlined in Table 1-6.
22
Table 1-6: Case Study Data
Dataset Spatial unit
Clark Spokane Issaquah
Source Notes Source Notes Source Notes
Historical
Population
Growth
Census
block
U.S. Census U.S. Census U.S. Census
Historical Job
Growth
Census
block
U.S. Census U.S. Census U.S. Census
Population & job
forecast
TAZ Southwest
Regional
Transportation
Council
Spokane
Regional
Transportation
Council
Puget Sound
Regional
Council
(not received)
Traffic Data SR segment
statewide
WSDOT WSDOT WSDOT
Regulatory
frameworks
(Zoning and
Urban Growth
Boundary)
Clark Clark County
GIS
Spokane
County GIS
King County ,
City of
Issaquah, City
of Sammamish,
some zoning
information
incomplete
Critical areas County wide Clark County
GIS
critical areas,
floodplain
Spokane
County GIS
King County
(WAGDA)
Vacant /
underdeveloped
lands
parcel Clark County
GIS
parcels,
buildable lands
model
Spokane
County GIS
parcels King County
Assessor
parcels
Sales parcel Clark County
Assessor
Back to 1995 Spokane
Regional
Transportation
Council
1999, 2001,
2004 (2004
with complete
data)
King County
Assessor/WAG
DA/Map Library
Back to 1999
(no 2002)
Building Permits parcel Clark County
GIS
Spokane
County
Assessor
Back to 1996 King County
Assessor
Back to 1996
Sewer/water
utilities
county Clark County
GIS
City of
Spokane
23
Data
Historical population and employment data came from the U.S. Census and Census
Bureau’s Longitudinal Employment Household Dynamics (LEHD) Program, available online at
the US census website. Future population and employment forecasts were readily available for
Transportation Analysis Zones (TAZ) from the regional transportation planning authorities
(Note: During the course of this seven month study we were not able to obtain forecast data for
the Issaquah study area. This points out one limitation in this methodology, the data described
are generally available, but sometimes require active cooperation from local agencies that may
be busy with other tasks. Lack of active cooperation can delay the desired analysis.) Zoning data
were gathered from counties and municipalities. Real estate data, which included both property
characteristics information and sales transactions, came from the three counties hosting the case
study areas (see Appendix 2: Real Estate Data Overview, for further discussion on Real Estate
Data). Assessor data, including both property characteristics and transactional information (real
estate sales data) for Spokane and King counties, were downloaded from the respective
assessors’ websites free of charge. These data files are updated weekly and posted to the
websites for dissemination. We purchased the Clark County data directly from the contacts at
the county. Data for all three counties appeared to be up-to-date, high quality, and complete, with
the necessary data fields to conduct development risk analyses.
Data Cleaning/Processing
Most of the data required minimal processing for use in the analyses. The historical
census data required the use of Census block relationship files to account for the change of
geographies between the 2000 and 2010 census. Assessor data, like most secondary data
sources, often require considerable cleaning and transformation to suit the individual purposes of
any empirical research in which they may be used. However, the property characteristics data
required much less cleaning than the sales transaction data.
County sales transactions, a product of the county’s recorder’s office, generally include
all transactions of property, regardless of whether or not it is a true “market transaction.” 1 For
the purposes of analyzing real estate markets, it is necessary to first remove any and all “non-
arm’s length” transactions from the data: those include foreclosure and sheriff’s deeds, easement
1 Meaning a transaction representative of a willing exchange between two market place participants.
24
recordings, and other instruments that change the title to property (such as a quit claim deed).
Fortunately, all three counties provided one or more fields in their sales data to indicate whether
or not the assessor’s (and/or recorder’s) office believed each individual transaction to be a “true”
market-based transaction. For each county, we removed all transactions believed to be non-
arm’s length.
Data Preparation and Development
Data preparation and development is typically time-consuming. This document presents
an overview of the general process used to aggregate the various data from the three counties.
While the specific operations may have varied slightly by county, the general structure of the
preparation and development process was similar for the three counties.2
Clip Parcel, Census Tract Data, and TAZ Layers to Study Area Extent. We began by
limiting the GIS parcel layers gathered from each county to the extent of the study
area by using the GIS clipping function. Since some boundaries may not have lined
up perfectly with the study area boundary, we included any and all parcels, census
blocks, and TAZs that intersected the study area boundary.
Attach Property Characteristic Data to Parcel. Next, we joined the property
characteristics data—specifically property use type, structural year built and structure
size—to the study area parcels. The required level of preparation varied by county.
The Clark County parcel layer had this information already attached, while in
Spokane we had to combine information from the residential and commercial
building tables to append this information. In King County, information from five
different relational database tables was necessary to add these data to the parcel file.
Extract Most Recent Sale. The sale transaction data for each county are stored in a
large file containing all transactions for approximately 15 years. For purposes of this
analysis, we eliminated all sales except the most recent sale of each parcel in the
study area. In addition, we added the three most recent sales to the Spokane parcel to
illustrate how historical sales data could also be applied in this type of analysis.
Attach Sales Information to Parcel. Finally, we attached the most recent, valid sale
from the previous step to the parcels in the study area. Note that many parcels will
2 In counties with vastly different data quality or quantity, a different set of processes may be required.
25
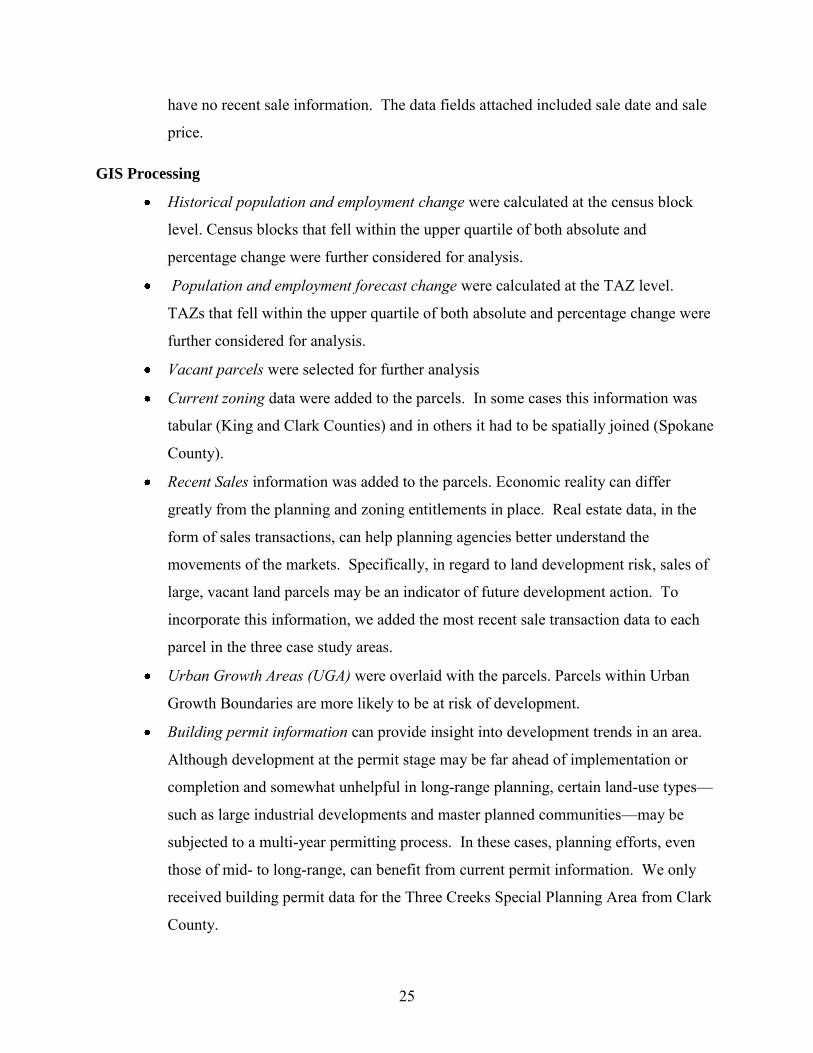
have no recent sale information. The data fields attached included sale date and sale
price.
GIS Processing
Historical population and employment change were calculated at the census block
level. Census blocks that fell within the upper quartile of both absolute and
percentage change were further considered for analysis.
Population and employment forecast change were calculated at the TAZ level.
TAZs that fell within the upper quartile of both absolute and percentage change were
further considered for analysis.
Vacant parcels were selected for further analysis
Current zoning data were added to the parcels. In some cases this information was
tabular (King and Clark Counties) and in others it had to be spatially joined (Spokane
County).
Recent Sales information was added to the parcels. Economic reality can differ
greatly from the planning and zoning entitlements in place. Real estate data, in the
form of sales transactions, can help planning agencies better understand the
movements of the markets. Specifically, in regard to land development risk, sales of
large, vacant land parcels may be an indicator of future development action. To
incorporate this information, we added the most recent sale transaction data to each
parcel in the three case study areas.
Urban Growth Areas (UGA) were overlaid with the parcels. Parcels within Urban
Growth Boundaries are more likely to be at risk of development.
Building permit information can provide insight into development trends in an area.
Although development at the permit stage may be far ahead of implementation or
completion and somewhat unhelpful in long-range planning, certain land-use types—
such as large industrial developments and master planned communities—may be
subjected to a multi-year permitting process. In these cases, planning efforts, even
those of mid- to long-range, can benefit from current permit information. We only
received building permit data for the Three Creeks Special Planning Area from Clark
County.
26
Analyses
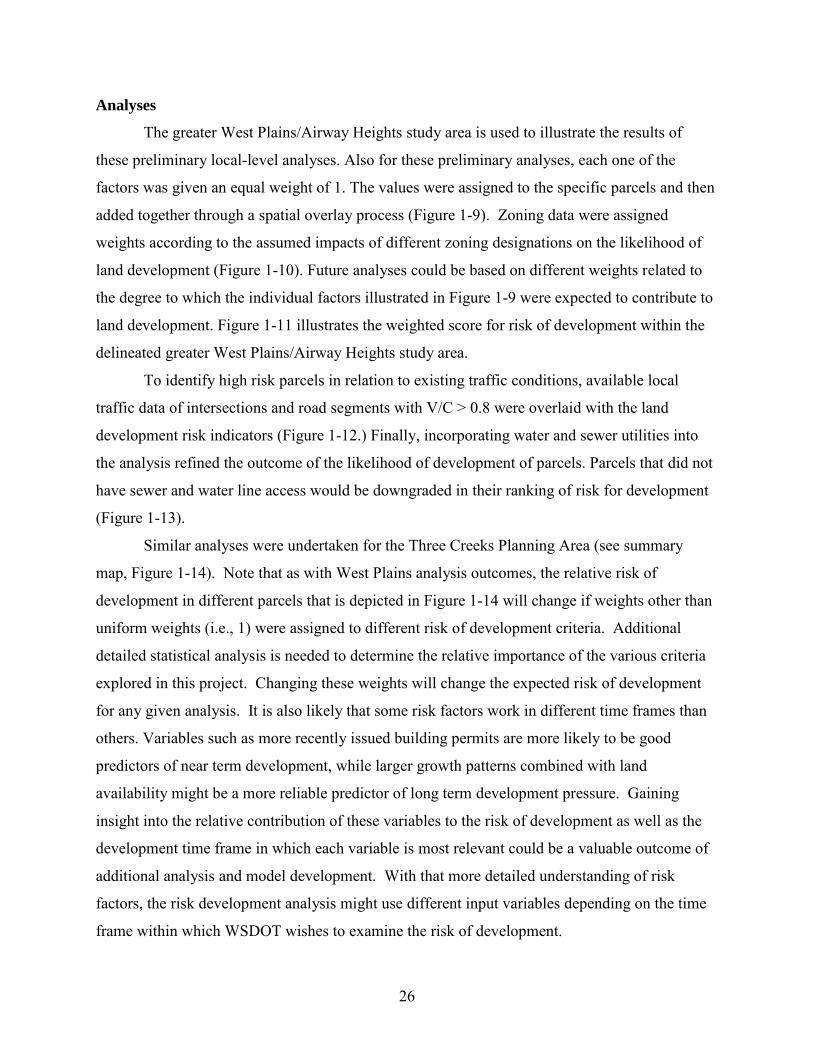
The greater West Plains/Airway Heights study area is used to illustrate the results of
these preliminary local-level analyses. Also for these preliminary analyses, each one of the
factors was given an equal weight of 1. The values were assigned to the specific parcels and then
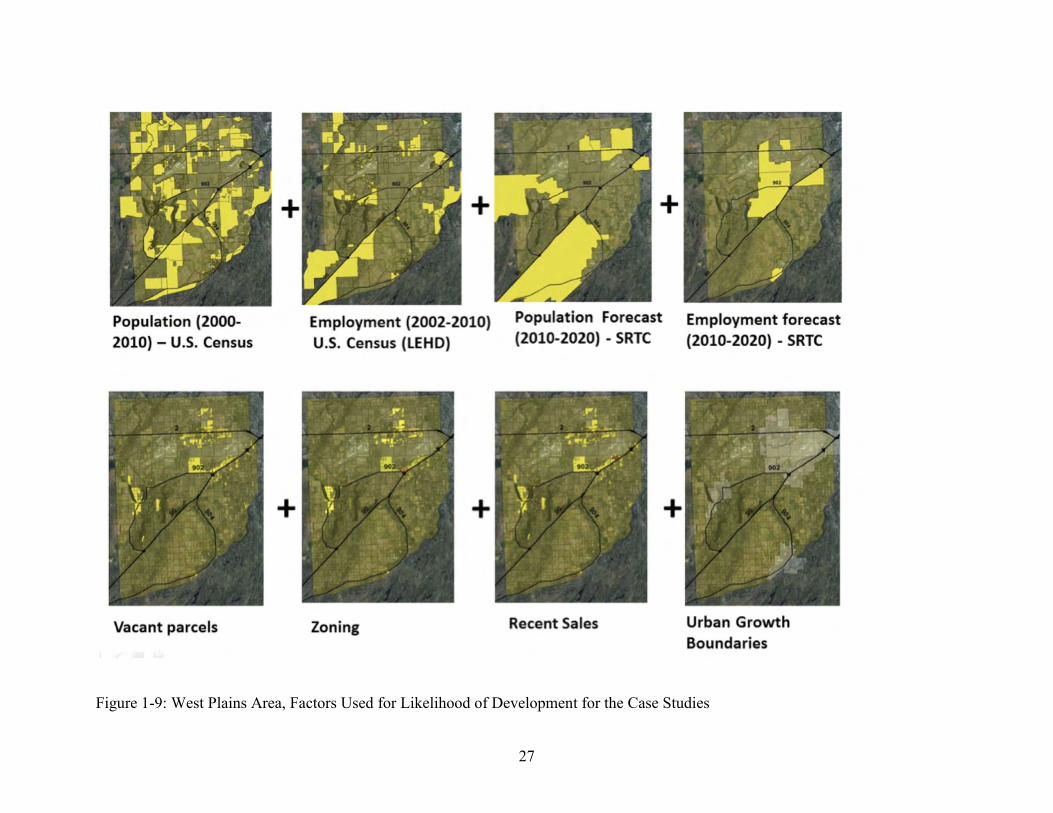
added together through a spatial overlay process (Figure 1-9). Zoning data were assigned
weights according to the assumed impacts of different zoning designations on the likelihood of
land development (Figure 1-10). Future analyses could be based on different weights related to
the degree to which the individual factors illustrated in Figure 1-9 were expected to contribute to
land development. Figure 1-11 illustrates the weighted score for risk of development within the
delineated greater West Plains/Airway Heights study area.
To identify high risk parcels in relation to existing traffic conditions, available local
traffic data of intersections and road segments with V/C > 0.8 were overlaid with the land
development risk indicators (Figure 1-12.) Finally, incorporating water and sewer utilities into
the analysis refined the outcome of the likelihood of development of parcels. Parcels that did not
have sewer and water line access would be downgraded in their ranking of risk for development
(Figure 1-13).
Similar analyses were undertaken for the Three Creeks Planning Area (see summary
map, Figure 1-14). Note that as with West Plains analysis outcomes, the relative risk of
development in different parcels that is depicted in Figure 1-14 will change if weights other than
uniform weights (i.e., 1) were assigned to different risk of development criteria. Additional
detailed statistical analysis is needed to determine the relative importance of the various criteria
explored in this project. Changing these weights will change the expected risk of development
for any given analysis. It is also likely that some risk factors work in different time frames than
others. Variables such as more recently issued building permits are more likely to be good
predictors of near term development, while larger growth patterns combined with land
availability might be a more reliable predictor of long term development pressure. Gaining
insight into the relative contribution of these variables to the risk of development as well as the
development time frame in which each variable is most relevant could be a valuable outcome of
additional analysis and model development. With that more detailed understanding of risk
factors, the risk development analysis might use different input variables depending on the time
frame within which WSDOT wishes to examine the risk of development.
27
Figure 1-9: West Plains Area, Factors Used for Likelihood of Development for the Case Studies
28
Figure 1-10: West Plains Area, Zoning Data with Weights Added According to Specific Zoning Designations for the Likelihood of Land Development
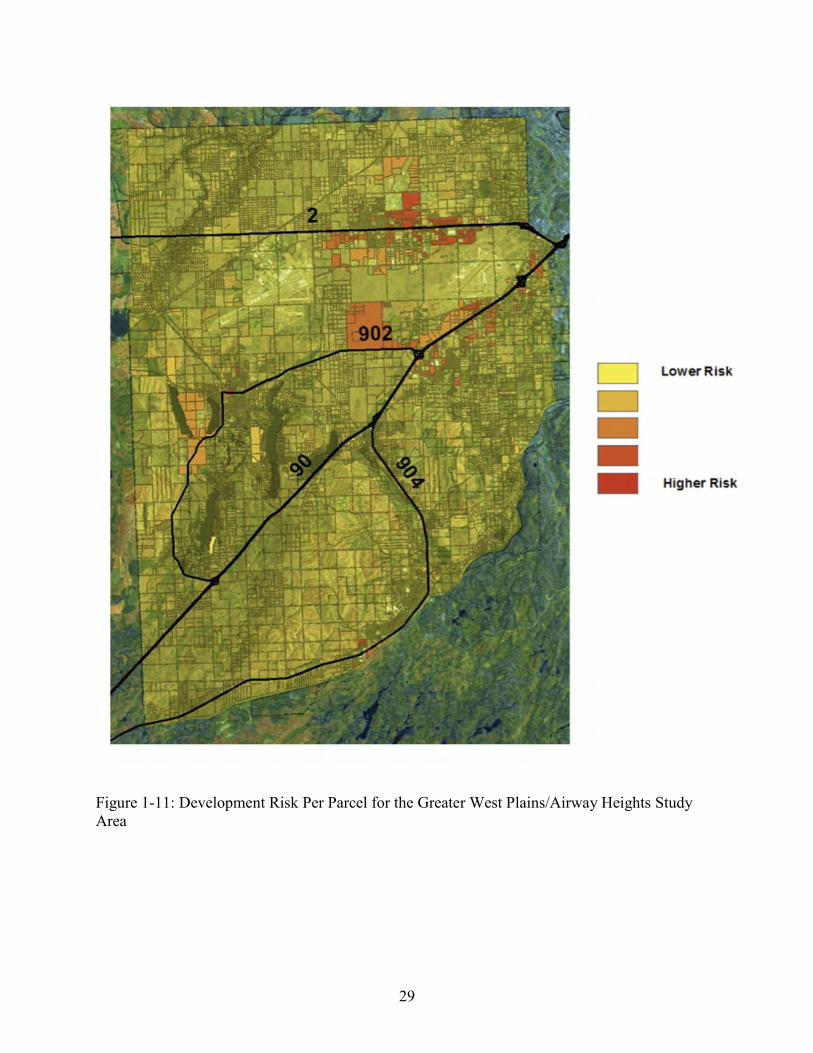
29
Figure 1-11: Development Risk Per Parcel for the Greater West Plains/Airway Heights Study Area
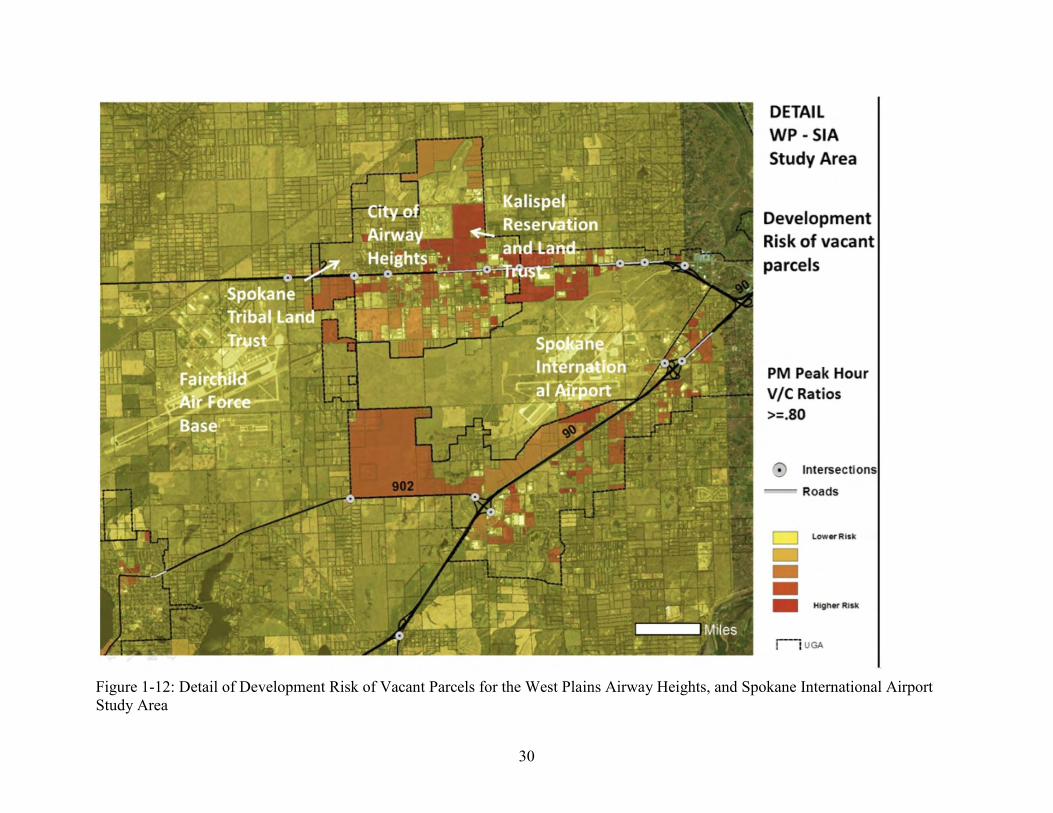
30
Figure 1-12: Detail of Development Risk of Vacant Parcels for the West Plains Airway Heights, and Spokane International Airport Study Area
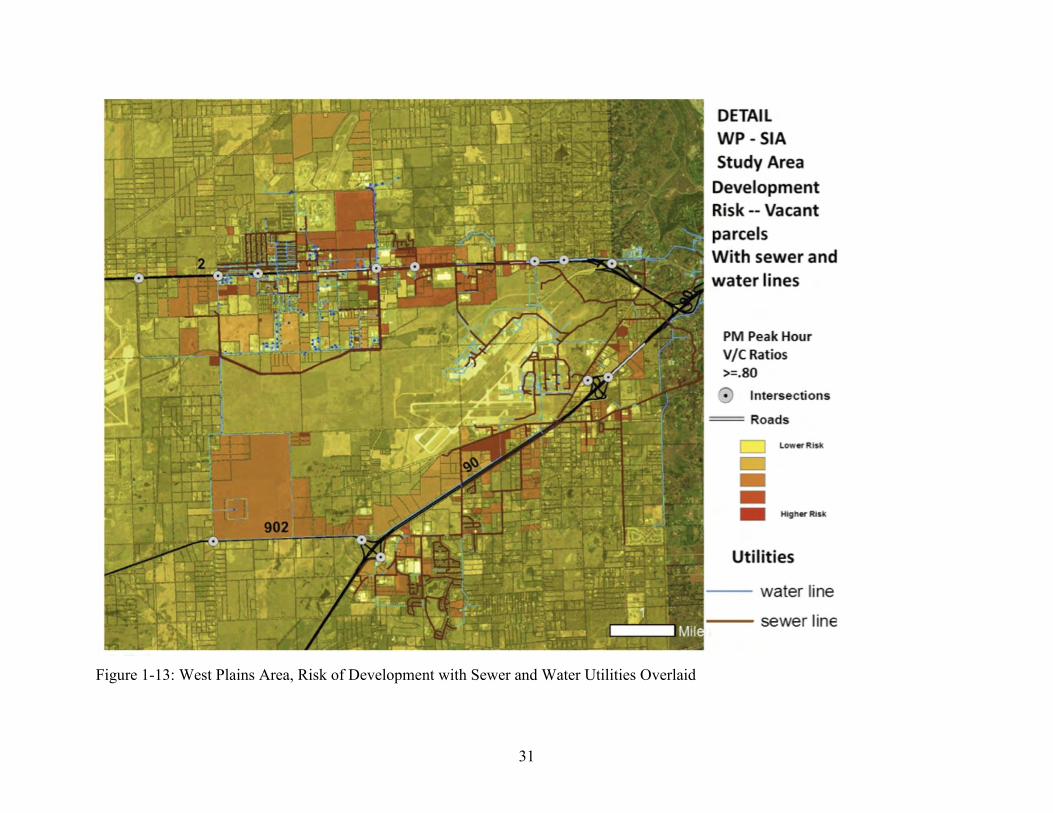
31
Figure 1-13: West Plains Area, Risk of Development with Sewer and Water Utilities Overlaid
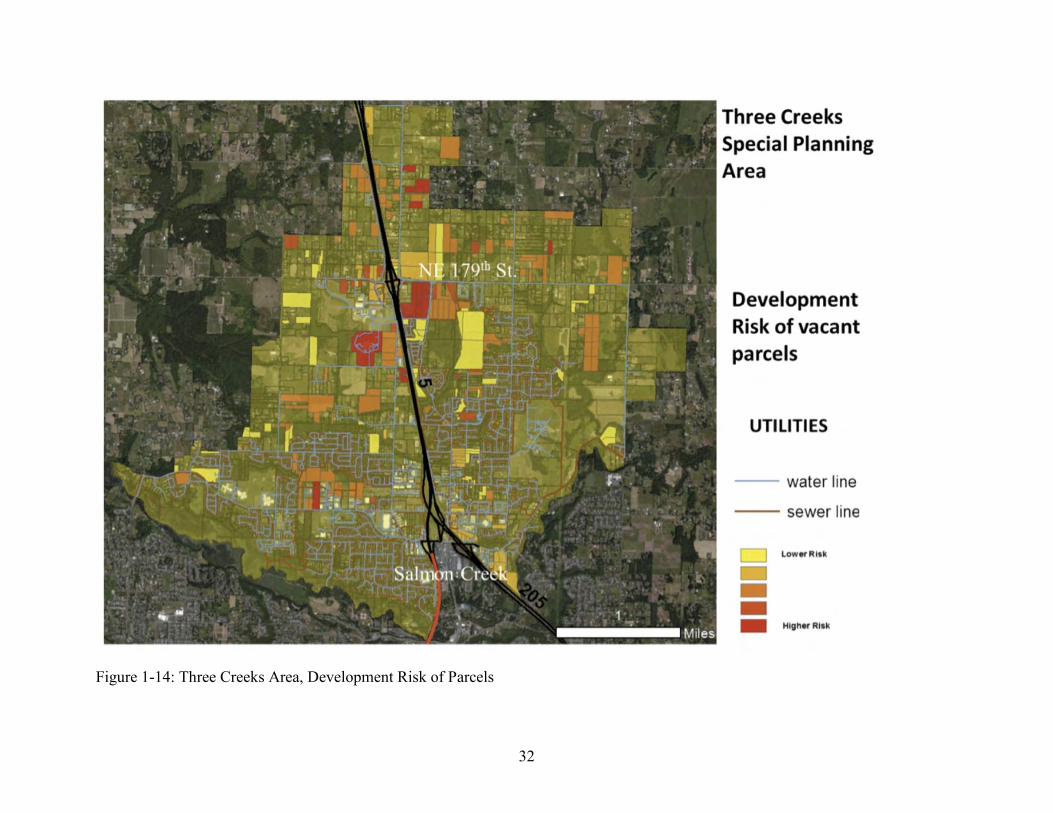
32
Figure 1-14: Three Creeks Area, Development Risk of Parcels

33
For Issaquah, analyses remain incomplete, as we did not obtain population and
employment forecast data, and we lacked consistent zoning information
Further Explorations of Underdeveloped and Re-developable Lands
Underdeveloped land presents challenges in assessing risk of future development. In
many cases, developed properties (i.e., property where the land is not vacant) do not contain
improvements that are the “highest and best use” allowed by zoning, meaning that
redevelopment might be economically desirable. Land monitoring efforts typically use ratios of
assessed improvement values to land value to identify those properties with a ratio below a
defined threshold as “re-developable.” The interpretation of results from such analyses
necessarily takes into account specific locations because the pressure for development can vary
greatly among areas—as they would, for instance, between the area of South Lake Union of
Seattle and that of Medical Lake outside of Spokane.
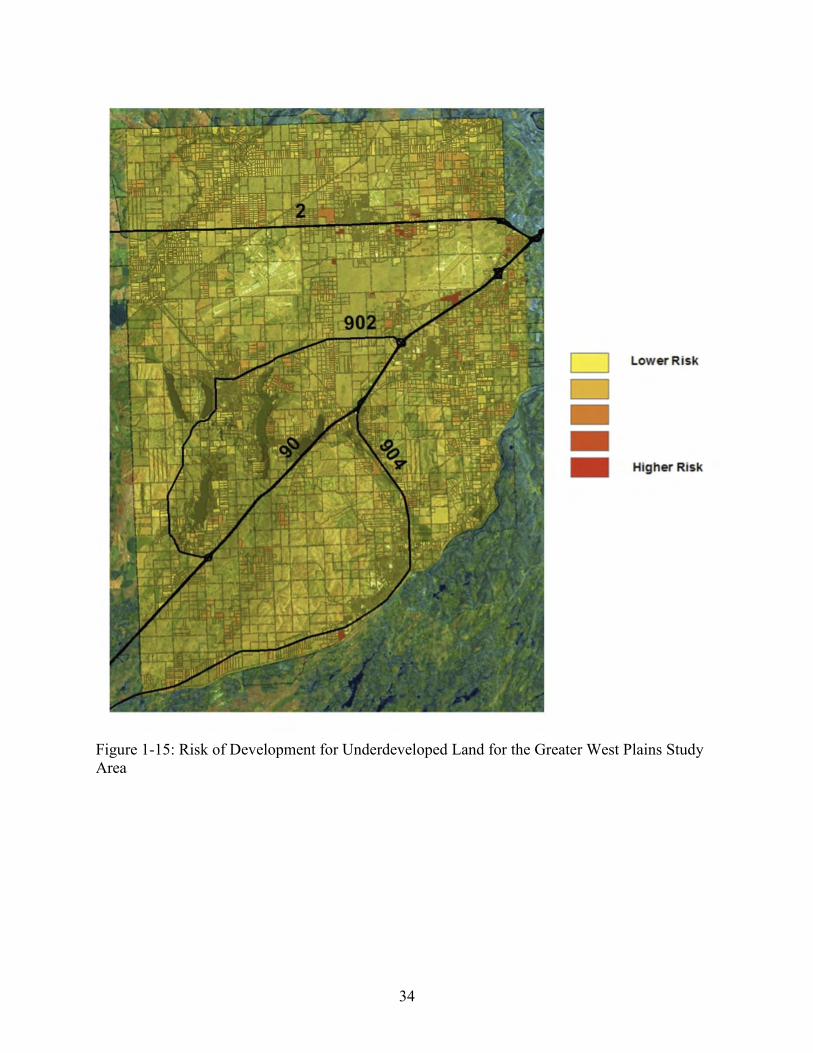
A simple analysis of the West Plains area was undertaken to investigate potentially
underdeveloped land by focusing on parcels that were currently in single family use and greater
than 2 acres. In urbanizing areas, these are parcels that are likely to be subdivided into smaller
lots. The same analysis and weighting process as described above was carried out for these
parcels (Figure 1-15). This quick and simple assessment of underdeveloped land was done for
illustrative purposes. It should be noted that many of the parcels highlighted in Figure 1-15
would be at lower risk because of the lack of utility connections.
Another means for assessing underdeveloped lands is to leverage the Buildable Lands
analyses that urban counties periodically undertake. Buildable Lands assessments have the
benefit of directly addressing the issues of land development potential. We received a buildable
land data set from Clark County but did not have a chance to integrate the data into our risk
analysis.
34
Figure 1-15: Risk of Development for Underdeveloped Land for the Greater West Plains Study Area
35
Summary
As noted in the statewide analysis, this method is flexible and can accommodate
additional data, including those found at other scales where available. Factors can be added or
substituted as deemed appropriate. Discussions with regional WSDOT staff and local
government planning staff indicated that these initial analyses came adequately close to real
world conditions for assessing land development risk. Although, in the West Plains area, local
planning staff noted that land belonging to the airport, the military, and the tribes were not
identified as at risk for development, when in fact they are likely to experience more intensive
uses in the future. This was a result of how those lands were treated within the data sets used to
track historic changes in development and estimate future growth. For example, the areas of
Fairchild Air Force base and Spokane International Airport did not have data readily available
from our sources in Spokane County or the City of Spokane. Thus, these areas need to be treated
as distinct planning entities, and engaged individually for obtaining data and determining future
projections.
Discussion and Conclusions
The exploratory nature of this project produced a wealth of readily available data and an
underlying structure to create a workable land development risk analysis for use by WSDOT
planners. As noted, additional and different factors can be used in future risk analyses. Also, and
perhaps more important, the weights given to the factors used in the Composite Risk Score need
to be assessed and defined. Multivariate analyses with different travel outcomes can help
measure the relative influence of the factors on the desired outcome. Furthermore, land
development prospects can be better understood and eventually measured with more refined
analyses of historical data on land development and sales, along with more precise assessments
of the relationship between zoning regulations and land development. The land development
risk of institutional, military, tribally owned, or other lands where development activity may not
routinely be incorporated into the county/regional assessor and land sale databases, or that
represent jurisdictional entities that may not be fully integrated with the MPO planning process
should also be further explored. The following sections expand on the first two points.
36
Calibrating the Risk Analysis with Historical Data
The relationship between development and the numerous data that we collected varies by
location. In other words, the development process is different in Issaquah than in the Salmon
Creek area of Clark County. If the present analyses were expanded to include more highly
developed urban areas or more sparsely developed rural areas, these differences would be even
greater. To address these spatial heterogeneities, future research could calibrate the relationships
between the variables and development outcomes for each area by using historical data. The
sales information that we collected included transactions for 15 years. We also gathered at least
one historical parcel shapefile from each of the three counties in our case studies. Acquiring
historical data on property characteristics, zoning regulations, etc., could prove more difficult,
though direct cooperation by the county should be helpful.
One of the difficulties in such an approach is the fact that large properties are often
subdivided for development purposes and, therefore, can be difficult to track within historical
databases. By comparing parcel layers over time within a GIS framework, this issue can be
potentially overcome.
Improving Estimates of Development Capacity
The development capacity of any given parcel may be estimated by comparing its legal
entitlements to its physical attributes. A cursory analysis such as this has a number of problems.
First, planning and zoning regulations are not always simple enough to apply a basic
multiplier to the lot size. In the case of single family residential subdivisions, dividing the total
land area by the minimum lot size (minus right-of-ways) may provide an accurate estimate of
development potential. But for commercial zoning and other higher density residential uses, this
exercise becomes more complex and the outcome less certain.
Second, planning and zoning entitlements do not necessarily mean that a given use is
economically viable and likely to be developed. Further complicating the process is the fact that
it is difficult to forecast what may be economically viable 15 to 20 years in the future.
Finally, planning and zoning regulations change, and they do not always do so in
predictable ways. Within Urban Growth Boundaries, vacant lands with large lot zoning today
can become tomorrow’s densely developed Planned Urban Development. Ongoing contact with
local planners and public officials can provide much needed information on the likely changes to
public policy in the near term.

37
For the purposes of this exploratory analysis, we did not attempt to estimate specific
development capacity but rather focused on identifying properties with potential for
development. As noted, determining development capacity is a difficult process. Ideally, future
developers of this risk analysis would solicit input from local planners in the specific areas being
analyzed. Avoiding errors deriving from the inherent uncertainty of future economic conditions
is perhaps the most challenging aspect of forecasting land development risk. We suggest
producing a range of outcome scenarios (rather than a single output), as well as employing a
process that continually updates these models at given points in the future to stay abreast of any
changes to the market.
Determining the Study Areas Is an Incomplete Science
Finally, we suggest that more research into local travel patterns will provide more reliable
estimates of how new growth on any given parcel is likely to influence traffic patterns.
In conclusion, the analyses presented outlines a system to objectively evaluate where land
development risk is likely to occur near state facilities. Based on readily available data, the
analyses are replicable and offer a tool that WSDOT can use to assess future changes in travel on
state routes at a statewide level. Statewide land development risk analyses can help WSDOT to
compare, prioritize, and benchmark high risk areas. The identification of high land development
risk in specific areas of the state can be followed by further analyses at the local level.
Anticipating land development objectively, and over the long term, can help turn adverse risk of
land development into opportunities for route improvements.
38
PART II: COLLABORATIVE STRATEGIES FOR MANAGING ADVERSE
RISK
Once specific corridors and/or road segments have been identified as being at risk from
likely real estate development, WSDOT can allocate resources to those potential problem
locations. Additional planning resources will allow the Department to work collaboratively with
the local jurisdictions to help ensure that the expected new development—and the location’s
current residents, employers, and stores—can be effectively served by available, sustainable
transportation options, and that as development occurs, the collaboratively adopted plans will
describe how those transportation options should expand to meet the new travel demand.
This section of the report describes a variety of ways in which the WSDOT can
contribute to this collaborative process. It also provides advice on when to use each of the
identified techniques. Given the limited scope of this project, and because much has been
written elsewhere on these techniques, this discussion is brief. References are provided to direct
WSDOT staff to more detailed documentation on each of the techniques discussed.
Overview of the Risk Mitigation Approach
The recommended approach for mitigating risk to state transportation facilities
attributable to development is structured in five steps. These steps are as follows:
Step 1: Identify corridors most at risk for development
Step 2: Manage risk through planning and coordination
Step 3: Identify specific non-engineering mitigation strategies
Step 4: Identify specific engineering mitigation strategies
Step 5: Fund and/or enforce mitigation strategies.
The first of these steps is covered in Part 1 of this report. The remaining four steps are
briefly discussed below.
Part II of this document introduces the goals of the activities to be performed in steps 2
through 4, explains the intended results from each activity, and provides a set of strategies
identified in the literature that transportation agencies have successfully undertaken to
39
accomplish those goals. For each step, a summary table of strategies is provided. For each
strategy in each table, the following information is provided:
Strategy name and brief description (“Strategy” column)
Additional details and a brief assessment of the strategy’s usefulness
(“details/assessment” column)
Locations where the strategy has been implemented (“applied” column)
An estimate of the time frame over which the strategy takes effect (“Time frame”
column)
A rough estimate of the ease of implementing the strategy (“Ease” column)
The literature source from which the strategy was identified (“Reference” column)
While these activities are discussed as separate steps, they actually take place in parallel
with considerable interaction. For example, establishing the availability of funding—including
identifying possible funding sources, and determining how the funding will be generated and
when it will become available in the land development cycle—plays a key role in identifying
which engineering and non-engineering mitigation efforts are affordable, can therefore be
implemented, and should therefore be part of a corridor or sub-area plan. Similarly, when no
funding for transportation improvements is available, local jurisdictions need to carefully
consider their permitting process and development code.
Setting up the jurisdictional cooperation needed to select the best/most appropriate
mitigation approaches, identifying and obtaining the funding needed to implement those
solutions, and then actually supplying those transportation services are tasks that must be done
within the context of the region. Thus, while the four steps below can be discussed
independently of each other, the actual risk management effort must treat them holistically.
Step 2: Manage Risk through Planning and Coordination
In many respects, “Planning and Coordination” is the key to mitigating the risk from real
estate development activity. The ideal outcome of the planning and coordination step is for the
affected partners (jurisdictions and transportation agencies) to agree on a practical vision for the
corridor/subarea and to set the stage for implementing that vision as the expected growth occurs.
That vision includes a shared understanding of roughly where the development is going to occur,
40
the characteristics of that development, how the transportation system in the area can most
effectively grow to provide the transportation services needed to meet the expected growth, and
how the funding needed for those improvements can be generated. That shared vision also needs
the flexibility to adjust to changing development interests while maintaining an overriding
connection to the transportation services that can realistically be provided to support that growth.
In this step of the risk mitigation process, knowing the specific details of the size and
timing of new developments is not crucial. What is important is developing a broader agreement
on the overall size of the development expected; the nature, size, and location of the
transportation facilities needed to serve that growth; the funding needed to supply those new
transportation services; and an understanding of—and agreement on—the actions required from
each of the partners to achieve that vision. That is, comprehensive growth plans and
transportation plans need to be effectively synchronized across jurisdictions, with funding for
transportation system expansion being linked to expected growth.
The state of Washington has existing transportation concurrency legislation that requests
just this sort of coordinated response to planning for and implementing growth and transportation
system expansion. The concurrency legislation creates one set of tools that local governments
can use to work together successfully. While the concurrency legislation provides for
considerable flexibility in the design and implementation of transportation concurrency [15], not
all local jurisdictions are comfortable using the state’s concurrency rules as a way to encourage
cooperative, coordinated planning. Additionally, local governments are not required to and
seldom do include state transportation facilities in their concurrency programs. In addition,
many local agencies have adopted concurrency regulations that are not sensitive to the impacts of
those regulations across jurisdictional lines. When developed with a shared jurisdictional vision
of desired outcomes, concurrency can be a useful tool for achieving that shared vision. When
developed independently and without that shared jurisdictional vision, it is far less effective. [15]
Luckily, many other strategies can be successfully used to effectively plan and implement the
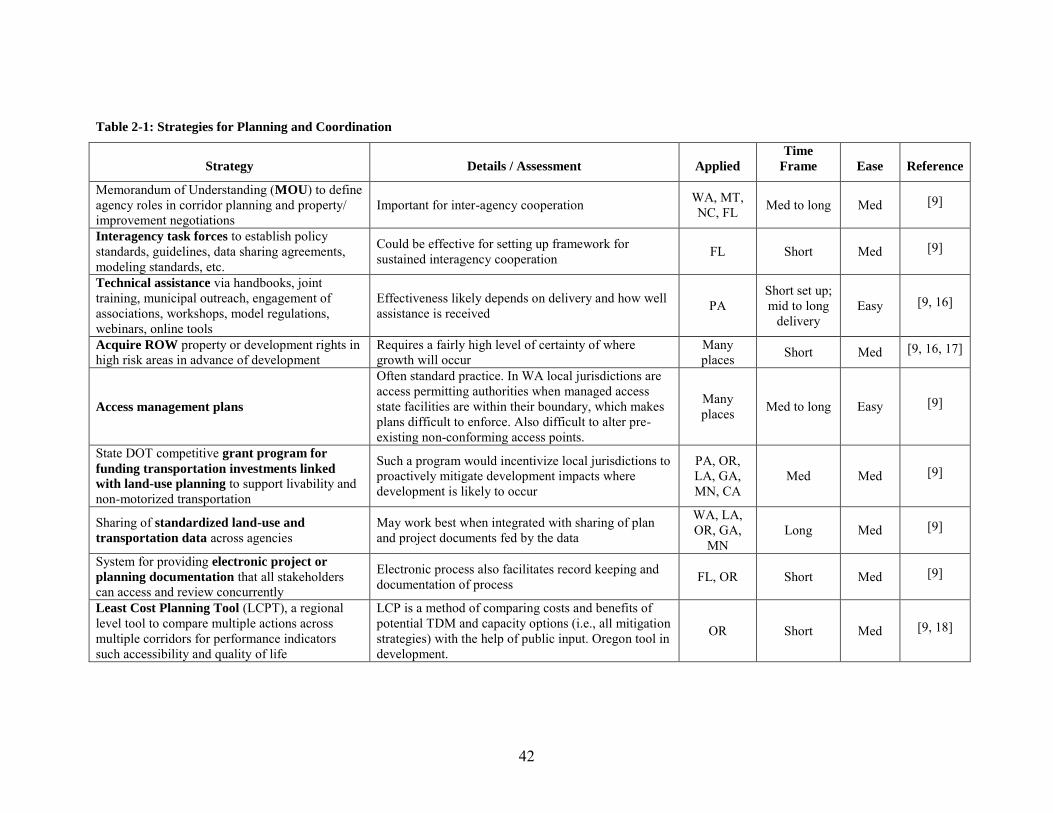
transportation facilities needed to foster and support growth. Table 2-1 lists a number of the
strategies that can help multiple jurisdictions work effectively together to plan for expected
growth.
Ideas like signing a memorandum of understanding (MOU) between jurisdictions with
shared interests can serve many purposes. For example, some Washington jurisdictions have
41
used MOUs to codify agreements with neighboring jurisdictions so that each jurisdiction collects
and shares multi-jurisdictional transportation impact fees for developments whose impacts cross
jurisdictional boundaries. Such MOUs help jurisdictions act for their common good by limiting
the ability of developers to play one jurisdiction off against the other.
While congestion on routes of statewide significance can not be used under the
Concurrency regulations to limit development when local agencies wish to allow that
development, local agencies are allowed to generate funds from both development and local
sources that can be used to help pay for improvements on state routes and they can enter into
agreements with the state with respect to those improvements. The exact nature of the
relationship between the state (WSDOT) and local jurisdictions, as well as the nature and size of
the funds to be generated locally, will change from location to location. The key to all of these
inter-jurisdictional arrangements is the ability for all participating agencies and jurisdictions to
come to a shared vision of the desired outcomes, and agree on the roles and capabilities of each
agency in achieving that vision. Getting to a shared vision, and adopting effective, realistic plans
for achieving that vision are important outcomes of the on-going planning process.
42
Table 2-1: Strategies for Planning and Coordination
Strategy Details / Assessment Applied
Time
Frame Ease Reference
Memorandum of Understanding (MOU) to define agency roles in corridor planning and property/ improvement negotiations
Important for inter-agency cooperation WA, MT, NC, FL Med to long Med [9]
Interagency task forces to establish policy standards, guidelines, data sharing agreements, modeling standards, etc.
Could be effective for setting up framework for sustained interagency cooperation FL Short Med [9]
Technical assistance via handbooks, joint training, municipal outreach, engagement of associations, workshops, model regulations, webinars, online tools
Effectiveness likely depends on delivery and how well assistance is received PA
Short set up; mid to long
delivery Easy [9, 16]
Acquire ROW property or development rights in high risk areas in advance of development
Requires a fairly high level of certainty of where growth will occur
Many places Short Med [9, 16, 17]
Access management plans
Often standard practice. In WA local jurisdictions are access permitting authorities when managed access state facilities are within their boundary, which makes plans difficult to enforce. Also difficult to alter pre-existing non-conforming access points.
Many places Med to long Easy [9]
State DOT competitive grant program for
funding transportation investments linked
with land-use planning to support livability and non-motorized transportation
Such a program would incentivize local jurisdictions to proactively mitigate development impacts where development is likely to occur
PA, OR, LA, GA, MN, CA
Med Med [9]
Sharing of standardized land-use and
transportation data across agencies May work best when integrated with sharing of plan and project documents fed by the data
WA, LA, OR, GA,
MN Long Med [9]
System for providing electronic project or
planning documentation that all stakeholders can access and review concurrently
Electronic process also facilitates record keeping and documentation of process FL, OR Short Med [9]
Least Cost Planning Tool (LCPT), a regional level tool to compare multiple actions across multiple corridors for performance indicators such accessibility and quality of life
LCP is a method of comparing costs and benefits of potential TDM and capacity options (i.e., all mitigation strategies) with the help of public input. Oregon tool in development.
OR Short Med [9, 18]
43
Similarly, actively sharing data and creating task forces to develop mutually beneficial
growth and transportation plans helps neighboring jurisdictions and the state develop plans and
implementation strategies that benefit from the synergy of multiple jurisdictions working
together. These joint planning efforts generally result in better outcomes than when individual
jurisdictions work independently, looking out only for their own benefit.
The timing of these planning efforts is important. Understanding the likely growth
potential for a corridor/subarea and the transportation options needed within a corridor/subarea
as “build-out” of that area continues allows the affected jurisdictions, and often the region as a
whole, to plan for the deployment of the necessary transportation options before growth has
forestalled those options. If effective planning for growth occurs early, it is possible for the local
jurisdictions to either help developers plan for alternative transportation modes as part of the
design for their developments (for example, building infrastructure that makes it easy to provide
transit service, or providing safe, well connected biking and walking paths as ways to make their
developments attractive) or help construct the well-connected roadway systems that are
necessary to provide the mobility that will attract residents, employers, and stores to that new
development.
For example, if it is understood that an existing roadway will need additional lanes as an
area grows, the right-of-way for those lanes can be purchased, reserved, or otherwise maintained
as growth begins in the corridor, even if that capacity is not needed at the time of that early
growth. This can only be done with the cooperation of the jurisdictions through which that road
travels and that control the development rules for parcels along that corridor. By starting well
before expansion becomes a requirement, the affected local jurisdictions can adopt the policies
necessary to minimize the cost, effectively share that cost, and maximize the benefit obtained
from that right of way.
Similarly, if it is clear that key roads cannot, or will not, be expanded to handle
foreseeable traffic volumes, by starting early, the affected jurisdictions can design alternative
routes to carry some of the expected traffic load and/or adopt the policies that help encourage
travel demand to occur in ways that require less road space (e.g., making sure transit can operate
efficiently, or that safe, direct, non-motorized travel paths are constructed as part of the new
development to encourage lower levels of vehicular traffic). If these modes of travel are only
considered “after the fact,” then the adopted land uses and land forms may prohibit their
44
effective use as alternatives to the car, forcing the jurisdiction to accept significant traffic
congestion as the cost of permitting additional development.
Finally, one of the key findings from the case studies for this project was that the act of
having WSDOT participate with local jurisdictions in planning for future growth of areas that the
data suggested were at high risk of development frequently led to valuable discussions about
other potential growth areas. Those additional development concerns were often driven by
specific developers (e.g., military bases or local tribes) that expected to serve the new travel
demand exclusively through expansion of existing state routes. The WSDOT was able to
indicate that the funding needed to build/expand those state routes was unlikely. This, in turn
started a valuable set of planning discussions about good alternatives and the requirements to
implement them.
The resulting discussions highlighted the need for the local jurisdictions to start planning
now for alternatives to serving their planned developments, as the lack of increased state route
capacity was likely to hinder the economic attractiveness of the planned developments without
the availability of alternative capacity. These results are great examples of collaborative planning
at its best.
Step 3: Identify Specific Non-Engineering Mitigation Strategies
As part of the collaborative planning process, it is important for the participating
jurisdictions to consider a variety of strategies for mitigating the increased travel demand
occurring as a result of new development. It is always important for the planning process to start
by considering non-engineering (i.e., “soft” or non-infrastructure) solutions to mitigating the new
demand expected from land development. Many non-engineering solutions not only provide low
cost, sustainable travel alternatives, they can also decrease the need and cost of parking, improve
safety, decrease the amount of stormwater runoff, and improve the overall attractiveness of land.
Finding ways to limit growth in traffic demand and thus avoid the need to expand roadways also
removes the cost of expanding road capacity and is especially critical when expanding the right
of way is infeasible.
Unfortunately, many non-engineering strategies are effective only in specific land-use
conditions or when applied to specific types of land forms. Therefore, to gain the desired
benefits, these “soft” approaches must be selected carefully so that they fit their environment.
45
For example, pricing parking is an excellent way of reducing traffic volumes to an area. But
when the strategy is implemented in a low density area, it simply tends to drive away residents,
employers, and retail stores. Establishing parking pricing, without harming the economic
activity of an area, is possible only when market conditions are correct. This usually means
dense urban settings where land prices make parking spaces expensive to provide, where activity
levels are high enough to attract trips despite the cost of parking, and where the density of
activities allows for other effective and efficient travel services such as transit. Similarly,
ridesharing programs—both as part of or external to Commute Trip Reduction programs—
require sufficient trip making density to be successful.
Other non-engineering strategies need to be part of larger coordinated land-use and
transportation plans. For example, strategies such as Transit Oriented Developments (TOD) are
successful only when a number of factors, such as good transit service and high levels of
accessibility to services and other travel destinations, exist within easy reach of the proposed
TOD. These factors may be already present, but frequently regions need to plan for future TOD
early in the development of the corridor to ensure that other supportive land uses exist near the
TOD, that the early developers within the corridor design their developments in ways that
support later TOD development, and that the early developments also gain from the benefits
associated with the extra activity levels from the TOD development.
Table 2-2 summarizes many of the strategies available for mitigating traffic demand from
new land development without increasing roadway capacity. The strategies presented are
intended to serve as discussion points for the partner jurisdictions responding to development
risk. Working together, these partners can determine which of these strategies are likely to be
effective within the context of the study corridor and the expected development.
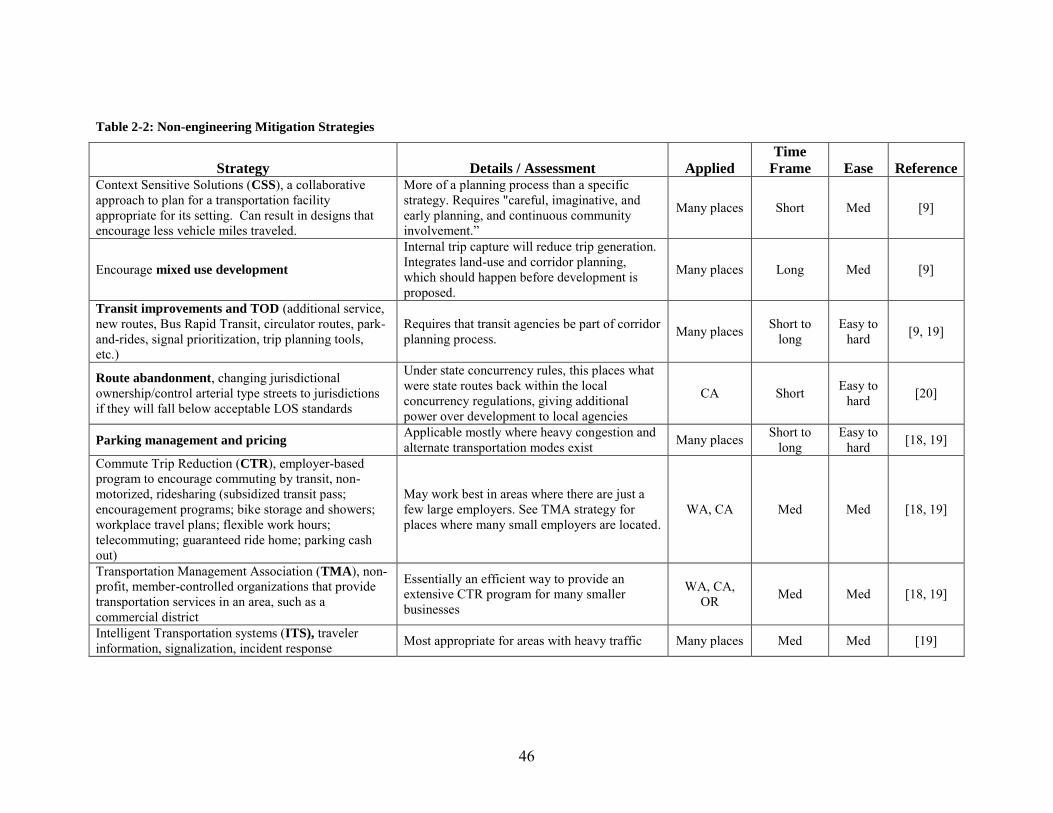
46
Table 2-2: Non-engineering Mitigation Strategies
Strategy Details / Assessment Applied Time
Frame Ease Reference Context Sensitive Solutions (CSS), a collaborative approach to plan for a transportation facility appropriate for its setting. Can result in designs that encourage less vehicle miles traveled.
More of a planning process than a specific strategy. Requires "careful, imaginative, and early planning, and continuous community involvement.”
Many places Short Med [9]
Encourage mixed use development
Internal trip capture will reduce trip generation. Integrates land-use and corridor planning, which should happen before development is proposed.
Many places Long Med [9]
Transit improvements and TOD (additional service, new routes, Bus Rapid Transit, circulator routes, park-and-rides, signal prioritization, trip planning tools, etc.)
Requires that transit agencies be part of corridor planning process. Many places Short to
long Easy to
hard [9, 19]
Route abandonment, changing jurisdictional ownership/control arterial type streets to jurisdictions if they will fall below acceptable LOS standards
Under state concurrency rules, this places what were state routes back within the local concurrency regulations, giving additional power over development to local agencies
CA Short Easy to hard [20]
Parking management and pricing Applicable mostly where heavy congestion and alternate transportation modes exist Many places Short to
long Easy to
hard [18, 19]
Commute Trip Reduction (CTR), employer-based program to encourage commuting by transit, non-motorized, ridesharing (subsidized transit pass; encouragement programs; bike storage and showers; workplace travel plans; flexible work hours; telecommuting; guaranteed ride home; parking cash out)
May work best in areas where there are just a few large employers. See TMA strategy for places where many small employers are located.
WA, CA Med Med [18, 19]
Transportation Management Association (TMA), non-profit, member-controlled organizations that provide transportation services in an area, such as a commercial district
Essentially an efficient way to provide an extensive CTR program for many smaller businesses
WA, CA, OR Med Med [18, 19]
Intelligent Transportation systems (ITS), traveler information, signalization, incident response Most appropriate for areas with heavy traffic Many places Med Med [19]
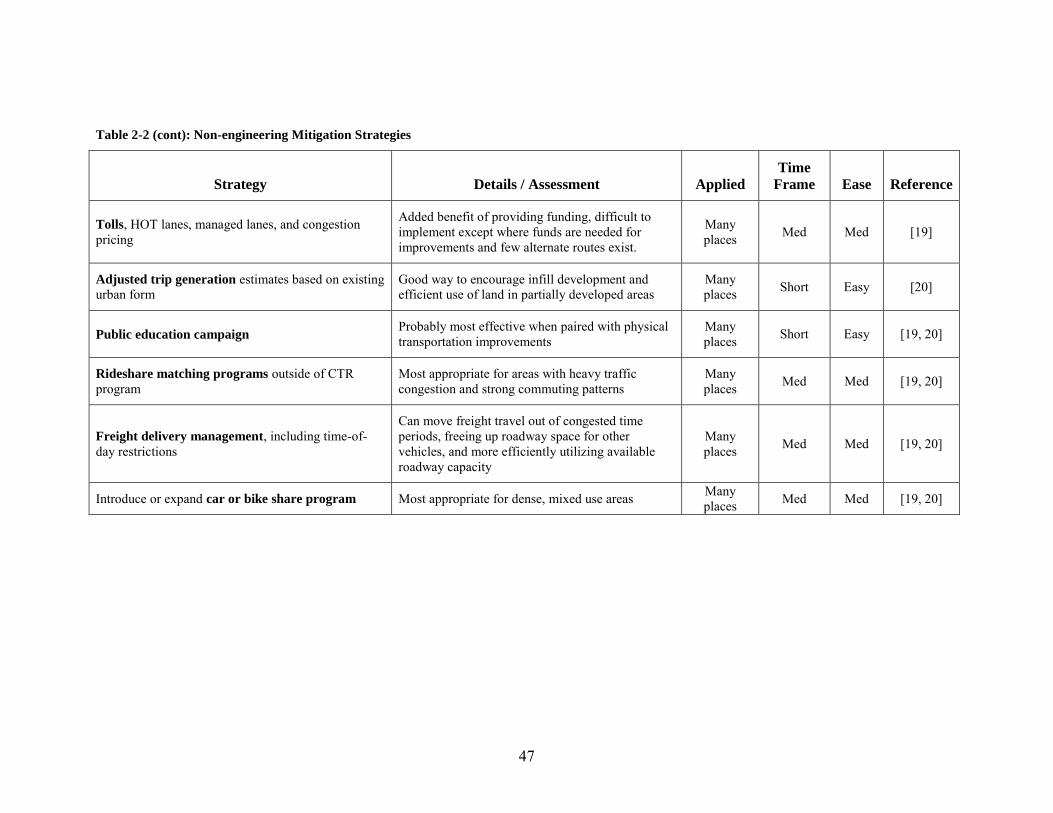
47
Table 2-2 (cont): Non-engineering Mitigation Strategies
Strategy Details / Assessment Applied Time
Frame Ease Reference
Tolls, HOT lanes, managed lanes, and congestion pricing
Added benefit of providing funding, difficult to implement except where funds are needed for improvements and few alternate routes exist.
Many places Med Med [19]
Adjusted trip generation estimates based on existing urban form
Good way to encourage infill development and efficient use of land in partially developed areas
Many places Short Easy [20]
Public education campaign Probably most effective when paired with physical transportation improvements
Many places Short Easy [19, 20]
Rideshare matching programs outside of CTR program
Most appropriate for areas with heavy traffic congestion and strong commuting patterns
Many places Med Med [19, 20]
Freight delivery management, including time-of-day restrictions
Can move freight travel out of congested time periods, freeing up roadway space for other vehicles, and more efficiently utilizing available roadway capacity
Many places Med Med [19, 20]
Introduce or expand car or bike share program Most appropriate for dense, mixed use areas Many places Med Med [19, 20]
48
Step 4: Identify Specific Engineering Mitigation Strategies
The most common development mitigation response is to add roadway capacity or other
new infrastructure to serve the additional traffic demand from new development. “Engineering
improvements” can take many forms, from new travel lanes, to major changes in streetscapes
such as limiting access to neighboring land parcels via more controlled turning movements and
driveways, to a variety of more modest intersection improvements (e.g., new channelization,
better signalization).
Unfortunately, there are difficulties with relying on engineering mitigation. Two of the
most common problems include 1) a lack of funding to pay for that mitigation, and 2) an
inability to physically add the capacity needed to meet the demand expected, either now or in the
future as growth continues in the corridor. Many suburban and exurban cities have built land
forms that rely on roadway capacity for access but lack the funding and/or right-of-way to build
that capacity as the fraction of developed land increases along a corridor. The result is either
limitations in desired development or unwanted levels of congestion. Thus, while engineering
solutions are important, the collaborative planning process needs to consider longer range growth
scenarios and plan ahead for the travel mitigation required for those later stages of development.
Table 2-3 describes many of the more common engineering approaches to mitigating new
travel demand from growing land development.
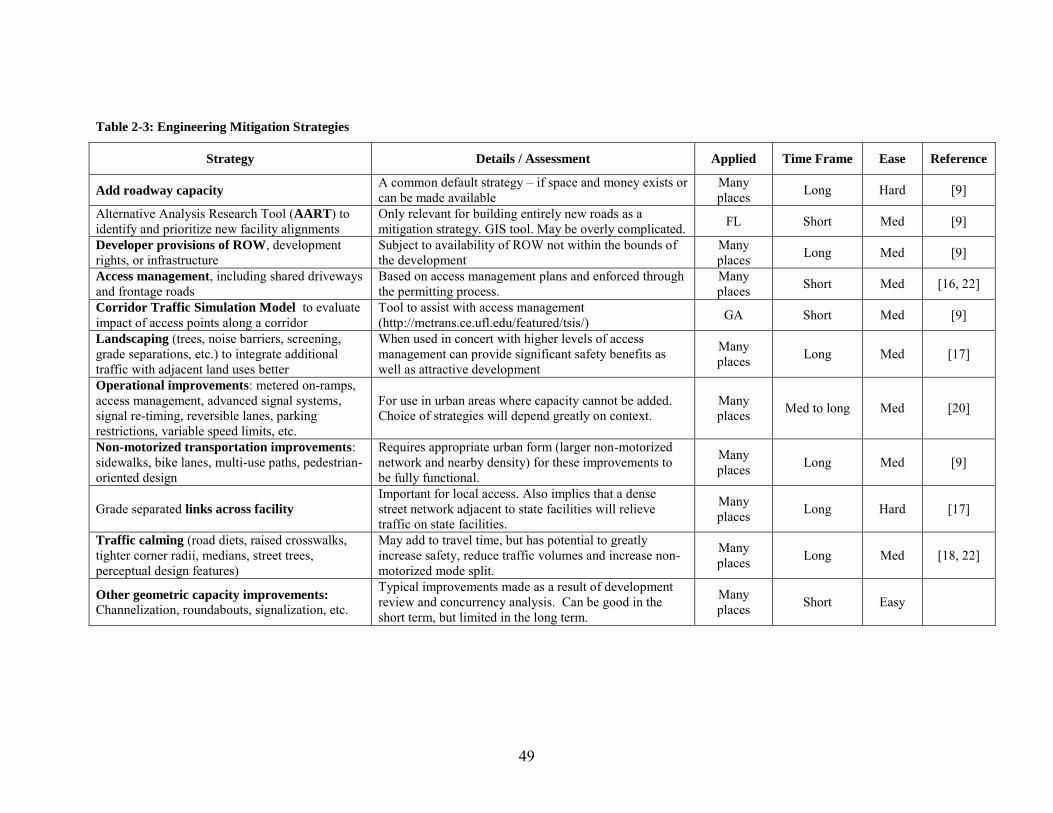
49
Table 2-3: Engineering Mitigation Strategies
Strategy Details / Assessment Applied Time Frame Ease Reference
Add roadway capacity A common default strategy – if space and money exists or can be made available
Many places Long Hard [9]
Alternative Analysis Research Tool (AART) to identify and prioritize new facility alignments
Only relevant for building entirely new roads as a mitigation strategy. GIS tool. May be overly complicated. FL Short Med [9]
Developer provisions of ROW, development rights, or infrastructure
Subject to availability of ROW not within the bounds of the development
Many places Long Med [9]
Access management, including shared driveways and frontage roads
Based on access management plans and enforced through the permitting process.
Many places Short Med [16, 22]
Corridor Traffic Simulation Model to evaluate impact of access points along a corridor
Tool to assist with access management (http://mctrans.ce.ufl.edu/featured/tsis/) GA Short Med [9]
Landscaping (trees, noise barriers, screening, grade separations, etc.) to integrate additional traffic with adjacent land uses better
When used in concert with higher levels of access management can provide significant safety benefits as well as attractive development
Many places Long Med [17]
Operational improvements: metered on-ramps, access management, advanced signal systems, signal re-timing, reversible lanes, parking restrictions, variable speed limits, etc.
For use in urban areas where capacity cannot be added. Choice of strategies will depend greatly on context.
Many places Med to long Med [20]
Non-motorized transportation improvements: sidewalks, bike lanes, multi-use paths, pedestrian-oriented design
Requires appropriate urban form (larger non-motorized network and nearby density) for these improvements to be fully functional.
Many places Long Med [9]
Grade separated links across facility Important for local access. Also implies that a dense street network adjacent to state facilities will relieve traffic on state facilities.
Many places Long Hard [17]
Traffic calming (road diets, raised crosswalks, tighter corner radii, medians, street trees, perceptual design features)
May add to travel time, but has potential to greatly increase safety, reduce traffic volumes and increase non-motorized mode split.
Many places Long Med [18, 22]
Other geometric capacity improvements: Channelization, roundabouts, signalization, etc.
Typical improvements made as a result of development review and concurrency analysis. Can be good in the short term, but limited in the long term.
Many places Short Easy
50
Step 5: Fund and/or Enforce Mitigation Strategies
This final step, in many ways, controls all of the other steps. At one extreme, with
enough money, anything is possible. At the other extreme, with no money, only “free”
alternatives can be implemented. No matter how well made, plans cannot be
implemented without funding. Understanding what funding is available and how it will
be obtained allows for the development of realistic plans. Understanding where funding
shortfalls exist given the transportation needs of expected development tells a region
when it needs to become more creative with its approach to funding or to reevaluate
where and how development will occur. Similarly, a well formed transportation plan
whose implementation is clearly vital to making an area attractive to development is key
in bringing together local officials in order to develop the funding options to deliver those
transportation options. Bringing the elected officials into the planning discussion so that
they understand the value of the selected transportation options, the need for funding to
implement those plans, and the consequences of not funding those plans is a key part of
the collaborative planning process. Table 2-4 lists a number of different mechanisms that
can be considered when additional funding is required to meet increased travel demand.
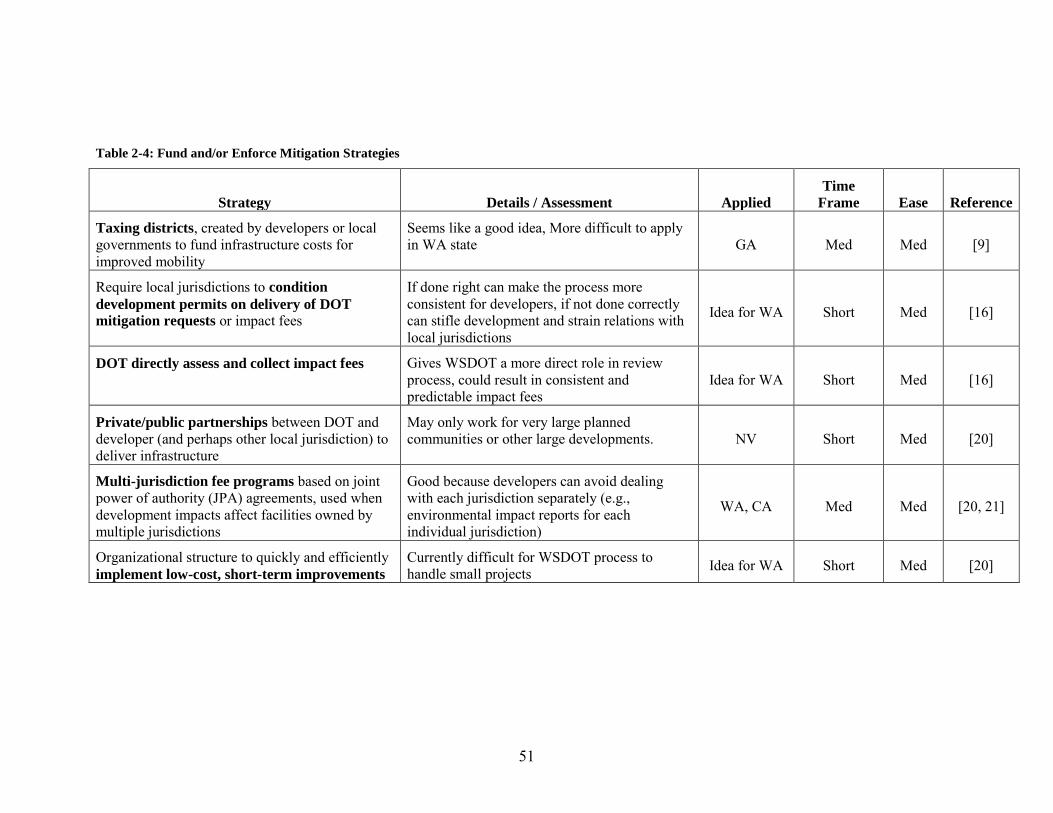
51
Table 2-4: Fund and/or Enforce Mitigation Strategies
Strategy Details / Assessment Applied Time
Frame Ease Reference
Taxing districts, created by developers or local governments to fund infrastructure costs for improved mobility
Seems like a good idea, More difficult to apply in WA state GA Med Med [9]
Require local jurisdictions to condition
development permits on delivery of DOT
mitigation requests or impact fees
If done right can make the process more consistent for developers, if not done correctly can stifle development and strain relations with local jurisdictions
Idea for WA Short Med [16]
DOT directly assess and collect impact fees Gives WSDOT a more direct role in review process, could result in consistent and predictable impact fees
Idea for WA Short Med [16]
Private/public partnerships between DOT and developer (and perhaps other local jurisdiction) to deliver infrastructure
May only work for very large planned communities or other large developments. NV Short Med [20]
Multi-jurisdiction fee programs based on joint power of authority (JPA) agreements, used when development impacts affect facilities owned by multiple jurisdictions
Good because developers can avoid dealing with each jurisdiction separately (e.g., environmental impact reports for each individual jurisdiction)
WA, CA Med Med [20, 21]
Organizational structure to quickly and efficiently implement low-cost, short-term improvements
Currently difficult for WSDOT process to handle small projects Idea for WA Short Med [20]
52
REFERENCES
1. Spokane Regional Transportation Council, West Plains – Spokane International Airport Transportation Study. 2011: Spokane, WA.
2. Landis, J., Characterizing Urban Land Capacity: ALternative Approaches and Methodologies, in Land Market Monitoring for Smart Urban Growth, G. Knaap, Editor. 2002, Lincoln Institute of Land Policy: Cambridge, MA.
3. Pease, J.R. and R.E. Coughlin, Land Evaluation and Site Assessment: A Guidebook for Rating Agricultural Lands. 2nd ed. 1996, Ankeny, IA: Soil and Water Conservation Society.
4. Knaap, G. and T. Moore, Land Supply and Infrastructure Capacity Monitoring for Smart Urban Growth. 2000, Lincoln Institute of Land Policy Working Paper WP00GKI.
5. Moudon, A.V. and M. Hubner, eds. Monitoring Urban Land Supply with GIS: Theory, Practice, and Parcel-based Applications. 2000, John Wiley & Sons, Inc.: New York.
6. Kidd, P. and P. Davidson. An Economic Basis for Projecting Land Use Development. in Australasian Transport Research Forum 2011 Proceedings. 2011. Adelaide, Australia.
7. Peng, Z.-R., L.-Y. Zhao, and F. Yang, Development of a Prototype Land Use Model for Statewide Transportation Planning Activities. 2011, Florida Department of Transportation.
8. Wang, X., K. Kockelman, and J. Lemp, The Dynamic Spatial Multinomial Probit Model: Analysis of Land Use Change Using Parcel-level Data. Journal of Transport Geography, 2012. 24: p. 77-88.
9. Fiol, M., et al., Scan10-01: Best Practices for Risk-based Forecasts of Land Volatility for Corridor Management and Sustainable Communities. 2012.
10. Linthicum, A. and J. Lambert, Risk Managment for Infrastructure Corridors Vulnerable to Adjacent Land Development. Journal of Risk Research, 2010. 13(8): p. 983-1006.
11. Thekdi, S. and J. Lambert, Decision Analysis and Risk Models for Land Development Affecting Infrastructure Systems. Risk Analysis, 2012. 32(7): p. 1253-1269.
12. University of Virginia Center for Risk Management of Engineering Systems. Land Development Risk Analysis for the Statewide Mobility System. 2012 [cited 2013 July 05]; Available from: www.virginia.edu/crmes/corridorprotection.
13. Miller, W., et al., An Approach for Greenway Suitability Analysis. Landscape and Urban Planning, 1998. 42: p. 91-105.
53
14. Washington State Department of Transportation, Identifying and Managing Land Development Risks Along State Transportation Corridors: Potential Pilots/Case Studies – Draft. January 23, 2013.
15. Hallenbeck, M.E., et al., Options for Making Concurrency More Multimodal. Final Report. December 2006, Washington State Transportation Center, University of Washington: Seattle, WA.
16. Washington State Department of Transportation Policy Development and Regional Coordination, The GMA Concurrency Goal and the State Transportation System. 2006.
17. Douglass, M. and J. Dryden, Transportation corridors and community structures. 2012, New Zealand Transport Agency.
18. Victoria Transport Policy Institute. TDM Encyclopedia. 2010 [cited 2013 May 10]; Available from: http://www.vtpi.org/tdm/tdm12.htm.
19. Federal Highway Administration Office of Operations. Traffic Congestion and Reliability: Trends and Advanced Strategies for Congestion Mitigation, Chapter 4.0 Congestion Strategies: What Works? 2005 [cited 2013 May 10]; Available from: http://www.ops.fhwa.dot.gov/congestion_report/chapter4.htm.
20. Washington State Department of Transportation, WSDOT Training Event Summary Notes, Planned Actions Part II: Upfront SEPA and Traffic Impact Mitigation. 2012.
21. Hallenbeck, Mark E., Daniel Carlson, and Jill Simmons. The Possibilities of Transportation Concurrency: Proposal and Evaluation of Measurement Alternatives. Final Report. Executive Summary. Washington State Transportation Center, University of Washington, Seattle. October 2003.
22. Pennsylvania Department of Transportation, Improving Connectivity and System Function through Local Planning. 2012.
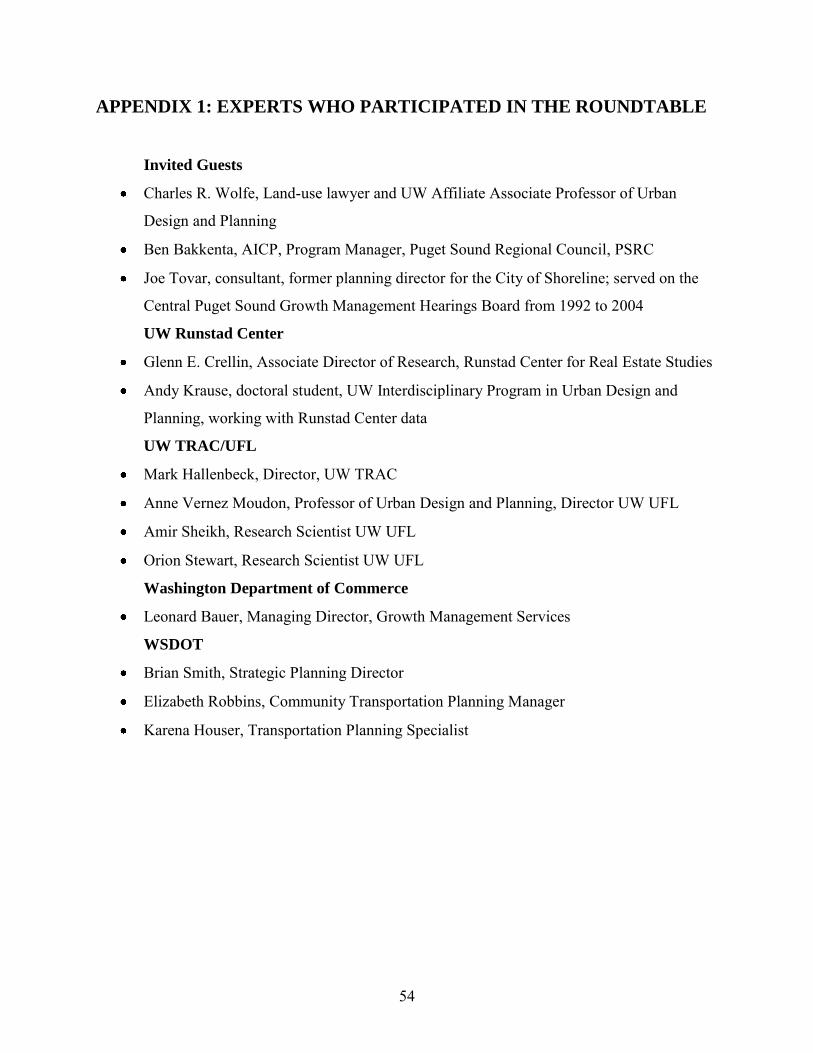
54
APPENDIX 1: EXPERTS WHO PARTICIPATED IN THE ROUNDTABLE
Invited Guests
Charles R. Wolfe, Land-use lawyer and UW Affiliate Associate Professor of Urban
Design and Planning
Ben Bakkenta, AICP, Program Manager, Puget Sound Regional Council, PSRC
Joe Tovar, consultant, former planning director for the City of Shoreline; served on the
Central Puget Sound Growth Management Hearings Board from 1992 to 2004
UW Runstad Center
Glenn E. Crellin, Associate Director of Research, Runstad Center for Real Estate Studies
Andy Krause, doctoral student, UW Interdisciplinary Program in Urban Design and
Planning, working with Runstad Center data
UW TRAC/UFL
Mark Hallenbeck, Director, UW TRAC
Anne Vernez Moudon, Professor of Urban Design and Planning, Director UW UFL
Amir Sheikh, Research Scientist UW UFL
Orion Stewart, Research Scientist UW UFL
Washington Department of Commerce
Leonard Bauer, Managing Director, Growth Management Services
WSDOT
Brian Smith, Strategic Planning Director
Elizabeth Robbins, Community Transportation Planning Manager
Karena Houser, Transportation Planning Specialist
55
APPENDIX 2: REAL ESTATE DATA OVERVIEW
Real estate data can be broken into two subsets. The first subset is information regarding
the current physical state of real property. This includes detailed records of the type, condition,
size and other characteristics of the structure (s) existing on an individual property as well as
information regarding the components of the land portion of the property such as size of lot,
zoning, etc. Data regarding real property characteristics is generally available at the parcel (or
lot) level. The most common source for this type of data is the county assessor’s office. A
number of third party data providers (such as CoStar and LoopNet) and real estate information
services (Zillow, Trulia, etc) may also offer this information, sometimes at significant cost. The
information available from third party providers may be limited to properties currently for sale or
lease or only for properties of a given property use. In many cases, data from these services is
gathered, in large part, from the county assessors themselves.
A second set of real estate data involves information on sales and leasing transactions.
Much like the characteristics data, sales information is often available from county assessors
and/or county recorders offices. Leasing information, on the other hand, is generally only
available from specialized private sector firms.
From a land development perspective, both types of data are important. Property
characteristics data can be used to determine vacant and underdeveloped land that has potential
for development/redevelopment. Market transactions information is useful to pin point particular
parcels that have recently undergone a change of ownership and are more likely to see a future
change in use. When combined with other data, such as planning and zoning information,
topographic maps and transportation network files, etc., real estate data can provide insight into
the market fundamentals that drive private sector development.
An important consideration regarding real estate data is that it is likely to vary by
location. Data is generally collected at the county level. Within the State of Washington, there
is no central data collection agency for real estate data.3 As a result, each individual county is
likely to have data at varying degrees of quantity and quality. More populous counties such as
King, Pierce and Spokane offer historical sales information back at least a decade as well as
sophisticated land-use classification systems and property characteristics data. In less populous
counties, data is often less accurate and less available from a historical context. In developing a
3 See Maryland and Florida for good examples of a statewide data collection efforts

56
land development risk model aimed at operating throughout the entire state, these variations in
real estate data quantity and quality by county need to be considered.