LAND DEVELOPMENT AGENCY – STATEMENT OF INTENTsuburbanland.act.gov.au/uploads/ckfinder/files/Land...
26
2016-17 Budget Statements 247 Land Development Agency LAND DEVELOPMENT AGENCY – STATEMENT OF INTENT The Land Development Agency is a Territory Authority established under the Planning and Development Act 2007. This Statement of Intent for 2016-17 has been prepared in accordance with Section 61 of the Financial Management Act 1996. The responsible Minister, Andrew Barr MLA, was consulted during the preparation of the Statement of Intent. The Statement of Intent, which focuses on the 2016-17 Budget year, has been developed in the context of a four year forward planning horizon to be incorporated, as far as practicable, into the Land Development Agency’s strategic and business planning processes. The Land Development Agency 2016-17 Statement of Intent has been agreed between:
Transcript of LAND DEVELOPMENT AGENCY – STATEMENT OF INTENTsuburbanland.act.gov.au/uploads/ckfinder/files/Land...

2016-17 Budget Statements 247 Land Development Agency
LAND DEVELOPMENT AGENCY –
STATEMENT OF INTENT
The Land Development Agency is a Territory Authority established under the Planning and
Development Act 2007.
This Statement of Intent for 2016-17 has been prepared in accordance with Section 61 of
the Financial Management Act 1996.
The responsible Minister, Andrew Barr MLA, was consulted during the preparation of the
Statement of Intent.
The Statement of Intent, which focuses on the 2016-17 Budget year, has been developed in
the context of a four year forward planning horizon to be incorporated, as far as practicable,
into the Land Development Agency’s strategic and business planning processes.
The Land Development Agency 2016-17 Statement of Intent has been agreed between:

2016-17 Budget Statements 248 Land Development Agency
This page intentionally left blank

2016-17 Budget Statements 249 Land Development Agency
LAND DEVELOPMENT AGENCY
As a result of the 2015 amendments to the Financial Management Act 1996, the budget
statement for Land Development Agency (LDA) is its Statement of Intent.
Purpose
The key outcomes for the LDA are:
• The LDA contributes positively to the economic and social development of the ACT by
building vibrant and sustainable communities through greenfield and urban renewal
projects for the development of residential, commercial, industrial, community and
non-urban land.
• The LDA acts in a commercially responsible, ethical and efficient manner when
developing and selling land on behalf of the ACT Government.
• The LDA balances potentially competing public sector and commercial priorities and
provides opportunities for private sector development to optimise the community
benefit from the ACT’s land assets.
Nature and Scope of Activities
General Activities
The LDA is responsible for the release and development of government owned land for
residential, commercial, industrial and community purposes.
The LDA’s key outputs for 2016-17 are:
• In contributing positively to the economic and social development of the ACT, the LDA
will:
− deliver the Government’s Indicative Land Release Program for residential,
commercial, industrial and community land uses;
− provide advice to Government on property market conditions to inform development
of targets in the Land Release Program and support direct sales of land;
− deliver high quality, sustainable developments, including public realm and community
development;
− deliver an adequate and diverse supply of land for construction and developments in
the Territory that meets market demand and anticipates demographic changes; and

2016-17 Budget Statements 250 Land Development Agency
− contribute to the strategic delivery of Government policies and priorities including
those related to land development, urban and public housing renewal, suburban
sustainability, strategic land acquisitions, the asbestos response, housing affordability
and urban intensification, particularly along the Capital Metro corridor.
• In acting in a commercially responsible, ethical and efficient manner, the LDA will:
− operate efficiently and provide agreed returns to the Territory;
− consider the long-term sustainability of the Territory in all key commercial decisions
on land in the ACT;
− ensure an adequate supply of Government-owned land is in the planning and
development pipeline for future release; and
− deliver meaningful and transparent community engagement about the land
development process and projects.
• In balancing potentially competing public sector and commercial priorities, the LDA will:
cultivate and maintain productive relationships with the private sector and across the
ACT Government.
Statement of Planning Intent
The 2016-17 LDA Statement of Intent has been prepared with due consideration of the
objectives of the Statement of Planning Intent for the Minister for Planning, Minister
Gentleman MLA, which sets out the main principles that are to govern planning and land
development in the ACT over the short term. The Statement of Planning Intent seeks to
achieve a more compact and sustainable city that is inclusive, vibrant, connected,
prosperous and environmentally responsible, while aiming to encourage quality design of
the public realm, innovation and flexibility in the planning system and maintaining an
appropriate level of certainty in planning and design outcomes on the ground.
The LDA will provide support in addressing the community’s desires for compact and
sustainable neighbourhoods, a collaborative approach between the public and private
sectors, housing choice and affordability, improved quality of urban design of the public
realm, showcasing of sustainability and quality design in new developments and precincts,
and improved transport options for the ACT.
Land Supply
The 2016-17 to 2019-20 Indicative Land Release Program includes residential, commercial,
industrial and community releases, which are an important part of the ACT Government’s
economic, social and environmental strategic planning framework.
The Indicative Land Release Program and targets are developed by the Chief Minister,
Treasury and Economic Development Directorate (CMTEDD) in consultation with the LDA
and other directorates. The Indicative Land Release Program is then considered and
approved by the Government.

2016-17 Budget Statements 251 Land Development Agency
The program aims to meet overall market demand and provide a range of land choices while
allowing for a variety of housing types, and different scales of commercial and industrial
development.
The publication of the program provides guidance on the Government’s land release
intentions to property developers, builders, homeowners, investors, community
organisations and the business and industry sectors.
The LDA is responsible for the delivery of the Indicative Land Release Program and manages
the release of land for residential, commercial, industrial and community purposes by:
• releasing serviced sites from its own greenfield estates, urban renewal and infill
locations;
• partnering with others in joint venture developments;
• releasing large parcels of raw land directly to the private sector (englobo releases); and
• facilitating the preparedness of land for consideration by Cabinet as Direct Sales.
Risks
There are a number of risks that may impact the LDA’s ability to achieve its objectives and
key deliverables.
Regulatory Risks
• The availability of an adequate supply of appropriately zoned residential, commercial,
industrial and community land, together with concept plans and timely approvals to
enable development activity to take place within planned timeframes.
• Unforseen delays in approvals and clearances from relevant directorates and
Commonwealth agencies that would result in slippage in the achievement of the
Indicative Land Release Program and associated revenue, including Asset Recycling
Initiative (ARI) releases, which are also subject to a range of dependencies such as
advance delivery of replacement housing stock.
• Changes in Commonwealth or other regulatory requirements may add uncertainty or
increase costs for LDA activities impacting on delivery timeframes.
• Current legislation relating to stratum subdivision/community title may limit some
complex mixed use high quality urban renewal precincts.
• Delays in statutory planning approvals by the Commonwealth relating to projects within
designated land.

2016-17 Budget Statements 252 Land Development Agency
Industry Capacity and Performance Risks
• Inability of the LDA to attract, recruit and retain a sufficient number of skilled staff.
• Delays in the planning and timely delivery by other directorates and utilities providers of
the necessary budget funded capital works infrastructure in order to support the land
release program.
• Increases in costs due to contract performance or extension of time (e.g. from sustained
wet weather) impacting on development schedules and the financial performance of
projects, resulting in lower or delayed forecast returns to the Government.
• Failure to meet the requirements of the Work Health and Safety Act 2011.
• The adequacy or otherwise of industry capacity and skills availability to provide
necessary services to deliver land servicing and broader capital works activities.
Market Risks
• Volatility in market demand for land as a result of the economic environment.
• Whether the Government’s Indicative Land Release Program can be absorbed by the
market at the forecasted revenue.
• Possible increases in land servicing and construction costs.
Stakeholder Risks
• Whether the sales revenue and land release targets can be achieved.
• Addressing diverse and/or conflicting community views on development.
2016-17 Strategies
The key strategies for 2016-17 that the LDA will employ to achieve its outcomes and
effectively manage risks include:
• collaborating with government agencies to establish an inventory of environmentally
cleared, planned, release ready and serviced land;
• undertaking strategic acquisition of land to assist in establishing an inventory of land for
future development purposes;
• providing detailed technical advice to CMTEDD to assist in resolving land development
issues with the Commonwealth;
• working with government agencies and the community to implement strategies for key
government development priorities in the city centre, town centres, major transport
corridors and urban infill areas;

2016-17 Budget Statements 253 Land Development Agency
• effectively engaging with local communities, industry associations, special interest
groups and the broader ACT community to ensure relevant interests are identified and
considered in land release activities;
• pursuing initiatives to deliver affordable housing, consistent with the Affordable Housing
Action Plan;
• pursuing initiatives that make active travel (walking and cycling) part of Canberrans'
daily lives, consistent with the Active Travel Framework;
• encouraging viable and liveable communities by providing a variety of block types and
public spaces to suit the needs of residents and surrounding communities;
• delivering community development programs to encourage involvement and support for
community building; and
• contributing to the redevelopment of the Capital Metro Corridor and the
implementation of the City to the Lake project.

2016-17 Budget Statements 254 Land Development Agency
Estimated Employment Level and Employment Profile
Table 1: Estimated Employment Level
2014-15
Actual Outcome
2015-16
Budget
2015-16
Estimated
Outcome
2016-17
Budget
Staffing (FTE) 87.7 95 97.41 127.0
1
Note(s):
1. The increase of staffing numbers from the 2015-16 Budget to the 2016-17 Budget reflects a combination of factors
including the realignment of the agency’s organisational structure largely due to a number of Administrative
Arrangement changes since 1 July 2014, resulting in an increase in functional responsibilities including urban renewal
projects.
Table 2: 2016-17 Employment Profile
Classification
Male Female Vacant Total1
Executive 7 3 0 10
IM/S 32 1 0 0 1
IO5/42 13 8 9 30
IO32 9 2 0 11
IO22 0 3 1 4
IO12 1 0 0 1
ASO2/3/4 3 5 2 10
ASO52 1 5 5 11
ASO62 3 7 3 13
SOG C2 3 6 5 14
SOG A/B2 5 9 8 22
Total 46 48 333
127
Note(s):
1. The total includes staff that have been seconded to the Asbestos Response Taskforce, Public Housing Renewal
Taskforce and other ACT Government Directorates, and Executives with dual reporting roles, that is, the Deputy Chief
Executive Officer, the Executive Director, Urban Renewal, and the Executive Director, Sales, Marketing and Property
Management.
2. The Classifications listed represent changed classification structure titles. Staffing numbers are for both
Administrative classifications and their equivalent Infrastructure Officer classifications.
3. The realignment of the agency’s organisational structure is expected to be finalised by 30 June 2016. The vacancies
reflect the establishment of an in-house corporate HR and governance function, and new positions resulting from the
realignment of the LDA undertaken due to increased responsibilities.
2016-17 Budget Statements 255 Land Development Agency
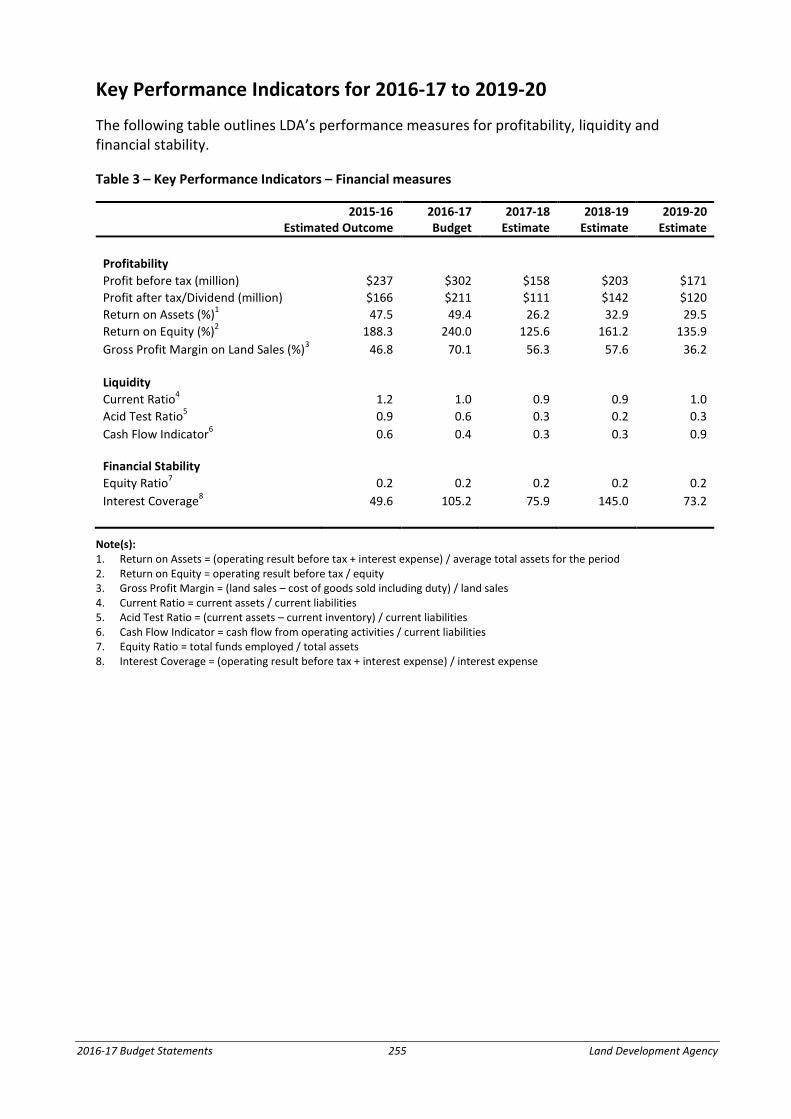
Key Performance Indicators for 2016-17 to 2019-20
The following table outlines LDA’s performance measures for profitability, liquidity and
financial stability.
Table 3 – Key Performance Indicators – Financial measures
2015-16
Estimated Outcome
2016-17
Budget
2017-18
Estimate
2018-19
Estimate
2019-20
Estimate
Profitability
Profit before tax (million) $237 $302 $158 $203 $171
Profit after tax/Dividend (million) $166 $211 $111 $142 $120
Return on Assets (%)1 47.5 49.4 26.2 32.9 29.5
Return on Equity (%)2 188.3 240.0 125.6 161.2 135.9
Gross Profit Margin on Land Sales (%)3 46.8 70.1 56.3 57.6 36.2
Liquidity
Current Ratio4 1.2 1.0 0.9 0.9 1.0
Acid Test Ratio5 0.9 0.6 0.3 0.2 0.3
Cash Flow Indicator6 0.6 0.4 0.3 0.3 0.9
Financial Stability
Equity Ratio7 0.2 0.2 0.2 0.2 0.2
Interest Coverage8 49.6 105.2 75.9 145.0 73.2
Note(s):
1. Return on Assets = (operating result before tax + interest expense) / average total assets for the period
2. Return on Equity = operating result before tax / equity
3. Gross Profit Margin = (land sales – cost of goods sold including duty) / land sales
4. Current Ratio = current assets / current liabilities
5. Acid Test Ratio = (current assets – current inventory) / current liabilities
6. Cash Flow Indicator = cash flow from operating activities / current liabilities
7. Equity Ratio = total funds employed / total assets
8. Interest Coverage = (operating result before tax + interest expense) / interest expense

2016-17 Budget Statements 256 Land Development Agency
The LDA’s non-financial performance will be measured by assessing:
• the level of achievement against the targets for the release of residential, commercial,
industrial and community land specified in the Government’s Indicative Land Release
Program for 2016-17 as set out in Table 4 below; and
• against the targets in Table 5.
Table 4: Key Performance Indicators – Non-financial (Land Release)
Indicative Land Release Programs Target 2016-17
(Dwellings) (m2)
a. Residential:
− Detached 1,060
− Attached 455
− Apartments
o LRP 1,095
o ARI 1,940
Total Residential: 4,550
b. Mixed Use 86,219
c. Commercial 12,811
d. Industrial 30,000
e. Community 131,404
Excluding Asset Recycling Initiative (ARI) releases, the four-year Residential Program will
deliver approximately 13,000 dwellings, with targets of approximately 2,600 dwellings in
each of the first two years, rising to 3,700 dwellings in 2018-19 and 4,100 in 2019-20.
Including ARI releases, the Residential Release Program will deliver in excess of 4,000
dwellings per year for each of the first three years of the program. This level of supply is
above the estimated demand for new housing, will accommodate the Government’s
affordable housing initiatives and will establish an inventory of serviced land.

2016-17 Budget Statements 257 Land Development Agency
Table 5: Key Performance Indicators – Non-financial (Other)
Indicator Descriptor Indicator Target 2016-17
Urban Water Cycle
Management
Percentage of LDA estates with specific Water Sensitive Urban
Design Strategies, ensuring the strategies are appropriate to
the size and location of the project.
100%
Sustainable Community
Programs
Percentage of LDA estates that are larger than 500 dwellings
that have a community development program.
100%
Housing Affordability Percentage of englobo (greenfield) estates to have 20 per cent
of dwelling sites released for the purpose of providing
affordable housing.
Percentage of LDA greenfield estates to have 20 per cent of
dwelling sites released for the purpose of providing affordable
housing.
100%
100%
Biodiversity and
Landscape
Area protected for conservation in compliance with
Commonwealth and ACT legislative requirements.
100%
Design Excellence Percentage of key projects that will be reviewed by the Design
Review Panel prior to the Board’s consideration of Project
Business Plans.
100%
Work Health and Safety Compliance with Work Health and Safety Policy. 100%
Active Travel Percentage of LDA estates which include initiatives that
support the Active Travel Framework.
100%
Assessment of Performance Against 2015-16 Objectives
2015-16 Objective 1: Ensure that an adequate supply of land is maintained to meet market
demand and to stimulate economic activity in the residential, commercial, industrial and
community land development sectors.
The 2015-2019 four-year Residential Release Program is planned to deliver land for
approximately 17,190 dwellings with a target of 3,513 in 2015-16, increasing steadily to
3,713, 4,566, and 5,398 in the following three years. This level of supply is above the
estimated level of demand for new housing.
The LDA is on track to release circa 4,000 dwelling sites in 2015-16, which exceeds the
published target of 3,513. Public housing renewal is driving urban renewal in key parts of
the city, including along the Capital Metro Corridor and in the City with the disposal of
ageing public housing properties.

2016-17 Budget Statements 258 Land Development Agency
The achieved residential dwelling releases include some changes from those forecast in the
2015-16 Statement of Intent:
• 210 additional dwelling sites have been released in Moncrieff and 90 additional dwelling
sites in Throsby to offset a delay in the release of 300 sites in Taylor due to
infrastructure issues;
• sites for an additional 514 dwellings have been released in Coombs to offset other
delays including sites for 250 dwellings in West Belconnen, and 168 dwelling sites in
Forrest held up due to delays in obtaining planning approvals, and a site for
259 dwellings in Parkes that has been deferred to be integrated into a future larger
development that will form part of the City to the Lake initiative;
• the release of 2,001 dwellings in stages 1a and 1b of Denman Prospect has increased the
available land by 300 dwellings, as sites for 1,700 dwellings had already been released to
the market in previous years; and
• the release of the Kingston Foreshore Arts Precinct, together with Block 1 Section 67 at
Kingston is anticipated to deliver a total of 510 additional dwellings.
The Commercial Land Release Program includes a supply of mixed use commercial sites
predominantly to support demand for residential uses in urban renewal areas and infill
development in Inner Canberra and the Tuggeranong town centre. The release of mixed use
sites is an important part of delivering the ACT Planning Strategy target of achieving
50 per cent of new housing to be delivered as urban intensification. The release of the
Coombs local centre will see the development of the first shopping centre in the Molonglo
district.
The LDA is forecast to release over 88,000 m2 of commercial land to the market in 2015-16,
against a target of 57,194 m2. Approximately 31,000 m2 of additional commercial land was
delivered comprising additional sites brought forward to offset the anticipated delay in the
release of some 45,000 m2 of programmed sites. Significant changes to the forecast
program include:
• the inclusion of a 40,295 m2 mixed use site in the Kingston Foreshore Arts Precinct
release;
• 8,367 m2 as part of the Government Office Accommodation project in the City; and
• 14,700 m2 as part of the ARI redevelopments of the Allawah public housing site at
Braddon.
The demand for general industrial land (IZ1) zoned land is being met from inventory of land
established in previous years. Demand continues to exist for mixed use industrial land (IZ2)
with work continuing to obtain the necessary environmental and planning clearances for
future IZ2 land releases in Majura/Pialligo and Fyshwick and Symonston.

2016-17 Budget Statements 259 Land Development Agency
The Community and Non-Urban land release program continues to supply a large volume of
land required to support community needs arising from Canberra’s urban growth. The LDA
is on track to release 147,229 m2 in 2015-16 against a target of 57,154 m2. The additional
supply reflects the inclusion of 91,428 m2 site to the Education Directorate for the
development of a second school in the Molonglo suburb of Denman Prospect. Notable
releases in 2015-16 include the release of the former Higgins school site for redevelopment
for 100 independent living units and a 4,575 m2 site for a child care centre.
Asset Recycling Initiative (ARI):
The ACT Government signed the National Partnership Agreement on Asset Recycling with
the Commonwealth Government in February 2015. Under this program, 17 land based
assets are to be sold before the end of 2018-19. The Office of the Coordinator-General,
Urban Renewal in CMTEDD is responsible for the implementation of this agreement, with
the LDA supporting the sale of these assets through assistance with due diligence,
demolition of buildings, sales and marketing and other works. The sale proceeds from these
assets are delivered through the LDA as a special dividend payment to Government.
The sites contained under the ARI are Public Housing and ACT Government commercial
buildings which are delivering urban renewal opportunities across Canberra including in the
City and particularly in Dickson and along the Capital Metro Corridor.
2015-16 Objective 2: Contribute to the provision of advice to Government on the ACT
property market to support the development of its land release targets.
The LDA has continued to provide advice to Government on the state of the ACT property
market.
This has been undertaken through regular briefings on the state of the housing market,
turnover and prices through the Government’s Residential and Commercial Advisory Group
meetings held quarterly over 2015-16.
In addition, reports on economic trends and residential land and building activity are
regularly produced. An updated version of these reports relating to 2015-16 is in
development.
In 2014-15, an Aged Care Dwelling demand model was developed to forecast the demand
for residential aged care facilities and retirement village dwellings in order to inform the
number and location of sites that are required to meet the needs of an ageing population.
Updates to the Aged Care Dwelling demand model were undertaken to forecast the demand
for residential aged care facilities and retirement village dwellings to inform the number and
location of sites required to meet the needs of an ageing population.
Updates to the Child Care Demand model were undertaken to track supply and forecast
demand for child care facilities to inform the number of location of sites required to meet
the needs in Greenfield areas and areas of urban intensification.
2015-16 Objective 3: Contribute to the delivery of the Government’s policies and priorities
as they relate to land development, urban renewal and urban sustainability.

2016-17 Budget Statements 260 Land Development Agency
The LDA supports key strategic priorities such as Public Housing Renewal and other Urban
Infill projects such as City to the Lake, the Kingston Arts Precinct, Asset Recycling Initiative
and the Capital Metro Corridor.
The ACT Planning Strategy has set a target to deliver 50 per cent or more of new housing
through urban intensification. Of the 17,190 dwelling sites in the 2015-19 Indicative Land
Release Program, 61 per cent are within the existing urban boundary. In 2015-16, the LDA
has delivered 1,956 out of an estimated total of 4,000 dwelling sites in the urban area across
Braddon, Dickson, Downer, Greenway, Higgins, Holt, Kingston, and the City.
The LDA has contributed to improving sustainability by increasing urban density and green
infrastructure. Increasing urban density reduces car dependence and increases
opportunities for active travel, promoting greater lifestyle choices. In all estates, the LDA
provides for pedestrian and cycle connections within the estate as well as connecting to
existing networks outside the estate, enhancing opportunities for pedestrian activity. All
housing is located within 400 metres safe walking distance to a bus route.
The LDA has initiated a number of measures which deliver a more sustainable Canberra.
These include seeking Green Star Community accreditation for Lawson and West Belconnen,
compulsory solar hot water in Lawson and Coombs, LED street light trials in Lawson and
community gardens in a number of estates.
2015-16 Objective 4: Cultivate and maintain productive relationships across the
ACT Government.
The LDA works closely with Economic Development and other relevant parts of Government
to provide technical input to various forums that assist in coordinating land delivery. This
includes the Capital Works Coordinators Working Group to improve the integration of
design management and delivery of capital works with estate works; the Residential and
Commercial Advisory Committees; and other informal management level discussion groups.
The LDA also provided detailed technical advice to assist in resolving land development
issues with the Commonwealth, especially in relation to obtaining environmental clearances
under the Commonwealth’s Environment Protection and Biodiversity Conservation Act 1999.
2015-16 Objective 5: Cultivate and maintain productive working relationships and linkages
with the private sector.
The LDA works closely with and undertakes regular engagement activities with the private
sector through pre-tender briefings, post-sale developer meetings, sponsorships,
engagement of specialist consultants, and representation at roundtables with industry
advocates.
2015-16 Objective 6: Operate efficiently in the markets in which it operates and provide
agreed returns to the Territory.
As at 31 March 2016, the LDA received land sales revenue totalling $235.6 million in the
period since 1 July 2015. The LDA has forecast that it will achieve its SOI target of
$557.8 million.

2016-17 Budget Statements 261 Land Development Agency
2015-16 Objective 7: Ensure that key commercial decisions on land in the ACT are
consistent with the long-term sustainability of the Territory.
The LDA ensures its key commercial decisions on land are made with due consideration to
the sustainability of the Territory by identifying and integrating economic, social and
environmental factors into decision making. These elements are transferred into the
business cases that are considered by the LDA Board for all major developments.
2015-16 Objective 8: Engage the community in a timely manner in the land development
process and continue to improve community engagement processes for high profile
redevelopments.
The LDA Community Engagement team continuously reviews and improves its strategies
and practices to ensure open, proactive and meaningful community engagement.
Comprehensive communications strategies are prepared for all urban renewal projects and
these are tailored to specific target audiences and project goals.
Community engagement was undertaken for all LDA estates during 2015-16.
The Canberra Brickworks development, in particular, involved a range of community
engagement processes aimed at ensuring close involvement by the community in the
proposed development.
Following extensive community engagement, in August 2015 the Chief Minister announced
the development proposal for the Brickworks precinct. The proposal took account of
feedback from the community which resulted in broad support for the proposal.
To prepare for the sale process for the Canberra Brickworks Precinct, the LDA convened a
‘community panel’ to contribute to the Request for Proposal. This new engagement
approach generated strong collaboration between the LDA and the community in defining
the precinct objectives. As a result of the effectiveness of this approach, planning is
underway to apply a similar approach to future urban renewal projects.
Monitoring and Reporting
The LDA shall satisfy the requirements of the Chief Minister’s Annual Reports Directions.
The LDA Annual Report will, amongst other things, report against the requirements of this
Statement of Intent.
The Financial Management Act 1996 authorises the Treasurer to obtain financial and other
statements from the LDA for a stated period including annual, quarterly and monthly
reporting.
2016-17 Budget Statements 262 Land Development Agency
Quarterly Reporting
To enable consolidated whole of government reporting requirements to be met on a
quarterly basis, the LDA will ensure the availability to the Treasurer, through the Chief
Minister, Treasury and Economic Development Directorate (CMTEDD) (by the eighth
working day of each quarter, unless otherwise indicated), information, in the prescribed
form and detail, in respect of the previous quarter:
• Operating Statement;
• Balance Sheet;
• Statement of Changes in Equity;
• Cash Flow Statement;
• Operating Statement material variance explanations against seasonal budget provided
by the LDA;
• Status Report to supplement performance reporting to the Assembly and provide
stakeholders with a summary on progress against budget highlights, significant
initiatives and major projects (by the tenth working day of each quarter); and
• Management Discussion and Analysis of results to date, forecast results and related
issues that may impact on the financial condition of the LDA (by the tenth working day
of each quarter).
Monthly Reporting
In addition to the quarterly information required as identified above, on a monthly basis the
LDA will ensure the availability to the Treasurer through CMTEDD (by the eighth working
day of each month) the financial statements, in the prescribed form and required detail, in
respect of the previous calendar month.
Annual Reporting
As part of preparations for end of year reporting, CMTEDD will advise the dates when the
following documents are required at the CMTEDD and at the Auditor-General's Office:
• Certified financial statements.
• Management discussion and analysis.
• A full and accurate set of audited financial records for the preceding financial year in the
form requested.
• Consolidation packs relating to the annual financial statements, draft and final.

2016-17 Budget Statements 263 Land Development Agency
Financial Arrangements
Budgeted financial statements for the 2016-17 Budget year, as well as forward estimates for
the three financial years commencing 2016-17 appear below.
• Operating Statement.
• Balance Sheet.
• Statement of Changes in Equity.
• Cash Flow Statement.
• Notes to the Financial Statements as appropriate.

2016-17 Budget Statements 264 Land Development Agency
Financial Statements
Table 6: Land Development Agency: Operating Statement
2015-16
Budget
$'000
2015-16
Est. Outcome
$'000
2016-17
Budget
$'000
Var
%
2017-18
Estimate
$'000
2018-19
Estimate
$'000
2019-20
Estimate
$'000
Revenue
92 User Charges - Non ACT 74 76 3 78 80 82
Government
1,129 User Charges -
ACT Government
539 552 2 556 580 595
3,800 Interest 3,690 6,101 65 7,067 6,771 6,575
557,802 Land Revenue 597,164 629,801 5 535,403 516,523 574,793
185 Other Revenue 515 145 -72 147 149 151
0 Resources Received
Free of Charge
864 0 -100 0 0 0
563,008 Total Revenue 602,846 636,675 6 543,251 524,103 582,196
Expenses
12,267 Employee Expenses 12,490 17,142 37 17,366 17,594 17,824
1,522 Superannuation
Expenses
1,685 2,067 23 2,094 2,121 2,149
16,016 Supplies and Services 17,720 23,265 31 22,795 24,756 23,951
75 Depreciation and
Amortisation
137 72 -47 0 0 0
4,232 Borrowing Costs 4,873 2,897 -41 2,108 1,408 2,366
297,125 Cost of Goods Sold 317,540 188,593 -41 233,884 218,857 366,945
3,357 Grants and Purchased
Services
4,694 4,081 -13 4,184 4,290 4,399
4,387 Other Expenses 13,222 96,719 632 109,626 58,707 1,882
338,981 Total Expenses 372,361 334,836 -10 392,057 327,733 419,516
0 Share of Operating
Result from Joint
Venture accounted
for using the Equity
Method
6,300 0 -100 6,729 6,392 8,218
224,027 Operating Result from
Ordinary Activities
236,785 301,839 27 157,923 202,762 170,898
67,209 Income Tax Equivalent 71,036 90,552 27 47,377 60,829 51,270
156,818 Operating Result 165,749 211,287 27 110,546 141,933 119,628
156,818 Total Comprehensive
Income
165,749 211,287 27 110,546 141,933 119,628

2016-17 Budget Statements 265 Land Development Agency
Table 7: Land Development Agency: Balance Sheet
Budget
as at
30/6/16
$'000
Est. Outcome
as at
30/6/16
$'000
Budget
as at
30/6/17
$'000
Var
%
Estimate
as at
30/6/18
$'000
Estimate
as at
30/6/19
$'000
Estimate
as at
30/6/20
$'000
Current Assets
100,678 Cash and Cash
Equivalents
308,501 199,278 -35 75,097 55,564 54,820
39,655 Receivables 30,372 11,590 -62 22,725 17,482 27,472
0 Investments 0 32,011 100 0 33,025 0
153,625 Inventories 118,511 204,422 72 232,518 300,953 198,300
293,958 Total Current Assets 457,384 447,301 -2 330,340 407,024 280,592
Non Current Assets
7,919 Receivables 10,592 10,590 - 10,588 10,586 10,584
16,266 Investments 0 12,245 100 32,331 14,411 32,247
137,516 Inventories 116,338 172,073 48 199,574 228,161 183,380
0 Property, Plant and
Equipment
3,185 3,181 - 3,181 3,181 3,181
47 Intangibles 68 0 -100 0 0 0
161,748 Total Non Current
Assets
130,183 198,089 52 245,674 256,339 229,392
455,706 TOTAL ASSETS 587,567 645,390 10 576,014 663,363 509,984
Current Liabilities
43,796 Payables 42,480 28,288 -33 28,288 48,288 28,288
53 Finance Leases 0 0 - 0 0 0
5,242 Employee Benefits 3,889 3,890 - 3,891 3,891 3,891
73,256 Other Provisions 65,363 65,979 -1 66,878 68,138 89,541
22,209 Income Tax Payable 56,248 72,441 29 37,903 48,662 41,016
122,283 Other Liabilities 202,894 262,695 29 226,367 280,870 119,702
266,839 Total Current Liabilities 370,874 433,293 17 363,327 449,849 282,438
Non Current Liabilities
77 Finance Leases 0 0 - 0 0 0
217 Employee Benefits 222 222 - 222 222 222
34,104 Other Non Current
Provisions
47,842 48,246 1 48,836 49,663 63,695
28,688 Income Tax Payable 42,848 37,848 -12 37,848 37,848 37,848
63,086 Total Non Current
Liabilities
90,912 86,316 -5 86,906 87,733 101,765
329,925 TOTAL LIABILITIES 461,786 519,609 13 450,233 537,582 384,203
125,781 NET ASSETS 125,781 125,781 - 125,781 125,781 125,781
REPRESENTED BY FUNDS EMPLOYED
125,781 Accumulated Funds 125,781 125,781 - 125,781 125,781 125,781
125,781 TOTAL FUNDS
EMPLOYED
125,781 125,781 - 125,781 125,781 125,781

2016-17 Budget Statements 266 Land Development Agency
Table 8: Land Development Agency: Statement of Changes in Equity
Budget
as at
30/6/16
$'000
Est. Outcome
as at
30/6/16
$'000
Budget
as at
30/6/17
$'000
Var
%
Estimate
as at
30/6/18
$'000
Estimate
as at
30/6/19
$'000
Estimate
as at
30/6/20
$'000
Opening Equity
125,781 Opening Accumulated
Funds
125,781 125,781 - 125,781 125,781 125,781
125,781 Balance at the Start of
the Reporting
Period
125,781 125,781 - 125,781 125,781 125,781
Comprehensive Income
156,818 Operating Result for
the Period
165,749 211,287 27 110,546 141,933 119,628
156,818 Total Comprehensive
Income
165,749 211,287 27 110,546 141,933 119,628
0 Total Movement in
Reserves
0 0 - 0 0 0
Transactions Involving Owners Affecting Accumulated Funds
0 Capital Distributions to
Government
-5,335 -78,367 1,369 -98,366 -57,587 0
0 Inc/Dec in Net Assets
due to Admin
Restructure
5,335 78,367 1,369 98,366 57,587 0
-156,818 Dividend Approved -165,749 -211,287 27 -110,546 -141,933 -119,628
-156,818 Total Transactions
Involving Owners
Affecting
Accumulated Funds
-165,749 -211,287 27 -110,546 -141,933 -119,628
Closing Equity
125,781 Closing Accumulated
Funds
125,781 125,781 - 125,781 125,781 125,781
125,781 Balance at the End of
the Reporting
Period
125,781 125,781 - 125,781 125,781 125,781

2016-17 Budget Statements 267 Land Development Agency
Table 9: Land Development Agency: Cash Flow Statement
2015-16
Budget
$'000
2015-16
Est. Outcome
$'000
2016-17
Budget
$'000
Var
%
2017-18
Estimate
$'000
2018-19
Estimate
$'000
2019-20
Estimate
$'000
CASH FLOWS FROM OPERATING ACTIVITIES
Receipts
981 User Charges 632 628 -1 634 660 677
3,500 Interest Received 4,200 5,461 30 5,210 5,210 5,210
572,157 Other Receipts 595,615 661,867 11 547,298 541,833 582,012
576,638 Operating Receipts 600,447 667,956 11 553,142 547,703 587,899
Payments
12,267 Related to Employees 12,312 17,142 39 17,366 17,594 17,824
1,522 Related to
Superannuation
1,685 2,067 23 2,094 2,121 2,149
16,012 Related to Supplies and
Services
17,865 23,265 30 22,795 24,755 23,950
4,225 Borrowing Costs 4,873 2,897 -41 2,108 1,408 2,366
3,357 Grants and Purchased
Services
4,694 4,081 -13 4,184 4,290 4,399
399,799 Other 332,143 427,033 29 399,832 374,502 277,728
437,182 Operating Payments 373,572 476,485 28 448,379 424,670 328,416
139,456 NET CASH INFLOW
FROM OPERATING
ACTIVITIES
226,875 191,471 -16 104,763 123,033 259,483
CASH FLOWS FROM INVESTING ACTIVITIES
Receipts
0 Proceeds from
Sale/Maturity of
Investments
8,541 0 -100 32,011 0 33,023
0 Investing Receipts 8,541 0 -100 32,011 0 33,023
Payments
3,500 Purchase of
Investments
0 43,616 100 11,500 7,152 8,250
0 Purchase of Land and
Intangibles
2,781 0 -100 0 0 0
3,500 Investing Payments 2,781 43,616 1,468 11,500 7,152 8,250
-3,500 NET CASH INFLOW /
(OUTFLOW) FROM
INVESTING
ACTIVITIES
5,760 -43,616 -857 20,511 -7,152 24,773

2016-17 Budget Statements 268 Land Development Agency
2015-16
Budget
$'000
2015-16
Est. Outcome
$'000
2016-17
Budget
$'000
Var
%
2017-18
Estimate
$'000
2018-19
Estimate
$'000
2019-20
Estimate
$'000
CASH FLOWS FROM FINANCING ACTIVITIES
Payments
0 Distributions to
Government
0 83,702 100 98,366 37,587 20,000
110,374 Dividends to
Government
48,116 173,376 260 151,089 97,827 265,000
110,374 Financing Payments 48,116 257,078 434 249,455 135,414 285,000
-110,374 NET CASH (OUTFLOW)
FROM FINANCING
ACTIVITIES
-48,116 -257,078 434 -249,455 -135,414 -285,000
25,582 NET INCREASE /
(DECREASE) IN CASH
HELD
184,519 -109,223 -159 -124,181 -19,533 -744
75,096 CASH AT THE
BEGINNING OF
REPORTING PERIOD
123,982 308,501 149 199,278 75,097 55,564
100,678 CASH AT THE END OF
REPORTING PERIOD
308,501 199,278 -35 75,097 55,564 54,820
Notes to the Controlled Budget Statements
Significant variations are as follows:
Operating Statement
• interest: the increase of $2.411 million in the 2016-17 Budget from the
2015-16 estimated outcome is due to higher than budgeted cash reserves available to
invest in the Treasury Bank Account.
• land revenue:
− the increase of $39.362 million in the 2015-16 estimated outcome from the original
budget is mainly due to the settlement of the first part of Denman Prospect stage 1,
partially offset by the deferral of Asset Recycling Initiative (ARI) sites to future years;
and
− the increase of $32.637 million in the 2016-17 Budget from the 2015-16 estimated
outcome is mainly due to the re-phasing of ARI sites from 2015-16.
• employee expenses: the increase of $4.652 million in the 2016-17 Budget from the
2015-16 estimated outcome is due to an increase in staffing numbers largely resulting
from an increase in functional responsibilities including urban renewal projects.

2016-17 Budget Statements 269 Land Development Agency
• supplies and services: the increase of $1.704 million in the 2015-16 estimated outcome
from the original budget and the increase of $5.545 million in the 2016-17 Budget from
the 2015-16 estimated outcome are mainly due to an increase in consultant and
contractor expenses resulting from an increase in development activity.
• borrowing costs: the decrease of $1.976 million in 2016-17 Budget from the
2015-16 estimated outcome is due to a decrease in expected land payments to the
Territory and Municipal Services Directorate as a result of the change in product mix
from greenfield development to urban renewal developments.
• cost of goods sold: the decrease of $128.947 million in the 2016-17 Budget from the
2015-16 estimated outcome is primarily due to the finalisation of two major projects
being; Lawson and Moncrieff. In addition the sale of Denman Prospect stage 1 was
brought forward from future years.
• grants and purchased services: the increase of $1.337 million in the 2015-16 estimated
outcome from the original budget is mainly due to the reclassification of payments to
Shared Services from supplies and services.
• other expenses:
− the increase of $8.835 million in the 2015-16 estimated outcome from the original
budget is mainly due to the transfer of ARI assets from other government agencies
free of charge and subsequent inventory write downs in accordance with accounting
standard AASB 102 Inventories; and
− the increase of $83.497 million in the 2016-17 Budget from the 2015-16 estimated
outcome is due to the transfer of ARI assets from other government agencies free of
charge and subsequent write down of the inventory.
• share of operating result from Joint Venture: the increase of $6.3 million in the
2015-16 estimated outcome from the original budget and the decrease of $6.3 million in
the 2016-17 Budget from the 2015-16 estimated outcome is mainly due to the receipt of
refunds from the Australian Taxation Office for Crace Joint Venture.
• income tax equivalent: the increase of $19.516 million in the 2016-17 Budget from the
2015-16 estimated outcome is due to increased profits.
Balance Sheet
• cash and cash equivalents:
− the increase of $207.823 million in the 2015-16 estimated outcome from the original
budget is largely due to the increase in land sales in Coombs, Moncrieff, Hume and
the City, the decrease in development cost payments and deferral of income tax and
dividend payments; and
− the decrease of $109.223 million in the 2016-17 Budget from the 2015-16 estimated
outcome is largely due to the payment of interim dividends associated with ARI sales
expected in 2016-17.

2016-17 Budget Statements 270 Land Development Agency
• current and non current receivables:
− the decrease of $6.610 million in the 2015-16 estimated outcome from the original
budget is largely due to lower infrastructure receivables related to the transfer of
infrastructure assets to the Territory and Municipal Services Directorate and
Icon Water Limited; partially offset by increased receivables for land rent sales; and
− the decrease of $18.784 million in the 2016-17 Budget from the 2015-16 estimated
outcome is due to decreased receivables for land rent sales.
• current and non current investments:
− the decrease of $16.266 million in the 2015-16 estimated outcome from the original
budget is largely due to the re-phasing of the West Belconnen project; and
− the increase of $44.256 million in the 2016-17 Budget from the 2015-16 estimated
outcome is due to the investment in the West Belconnen project.
• current and non current inventories:
− the decrease of $56.292 million in the 2015-16 estimated outcome from the original
budget is mainly due to lower development costs in Throsby, Wright and the
Flemington road corridor as well as the re-phasing of Kingston and Greenway to later
years; and
− the increase of $141.646 million in the 2016-17 Budget from the 2015-16 estimated
outcome is due to the anticipated increase in development activity relating to the
new suburb of Taylor, the re-phasing of Kingston, Greenway and Lawson; and lower
cost of goods sold due to the change of development mix between greenfield and
urban renewal.
• land, property, plant and equipment: the increase of $3.185 million in the
2015-16 estimated outcome from the original budget is due to the purchase of land as
part of the City to the Lake project.
• current payables: the decrease of $14.192 million in the 2016-17 Budget from the
2015-16 estimated outcome is due to a decrease in payables relating to the payment of
ARI transfers for Owen and Currong flats to Government.
• current and non current other provisions: the increase of $5.845 million in the
2015-16 estimated outcome from the original budget is due to higher than budgeted
balance of provisions for project completion; partially offset by a decrease of
infrastructure payable as the result of the transfer of completed infrastructure assets to
the Territory and Municipal Services Directorate and Icon Water Limited.
• current and non current income tax payable: the increase of $48.199 million in the
2015-16 estimated outcome from the original budget and the increase of
$11.193 million in the 2016-17 Budget from the 2015-16 estimated outcome is due to
an increase in operating surplus and timing differences in income tax payments under
tax effect accounting principles.

2016-17 Budget Statements 271 Land Development Agency
• current other liabilities: the increase of $80.611 million in the 2015-16 estimated
outcome from the original budget is due to the timing of payment of dividends. The
increase of $59.801 million in the 2016-17 Budget from the 2015-16 estimated outcome
is mainly due to the timing of payment of dividends associated with ARI settlements.
Statement of Changes in Equity and Cash Flow Statement
Variations in these statements are explained in the notes above.
Indicative 2016-17 to 2019-20 Land Release Program
Table 10: Indicative Residential Land Release
Location Number of Dwelling Sites
2016-2017 2017-2018 2018-2019 2019-2020
Gungahlin 908 650 1,043 635
Belconnen 300 1,300 500 850
Central Canberra 648 350 460 1,135
Molonglo 230 180 1,540 1,230
Woden and Weston 0 60 150 250
Tuggeranong 524 0 25 0
ARI 1,940 1,890 982 0
Other 0 0 0 0
Total 4,550 4,430 4,700 4,100
Table 11: Indicative Mixed Use Land Release Program (site area)
Location 2016-2017 2017-2018 2018-2019 2019-2020
(m2) (m
2) (m
2) (m
2)
Gungahlin 0 10,000 0 5,000
Belconnen 0 8,304 13,612 9,465
Central Canberra 16,000 12,968 0 35,282
Molonglo 8,714 0 0 0
Woden and Weston 0 0 0 0
Tuggeranong 0 0 0 0
ARI 61,505 54,715 13,633 0
Other 0 0 0 0
Total 86,219 85,987 27,245 49,747

2016-17 Budget Statements 272 Land Development Agency
Table 12: Indicative Commercial Land Release Program (site area)
Location 2016-2017 2017-2018 2018-2019 2019-2020
(m2) (m
2) (m
2) (m
2)
Gungahlin 0 15,476 10,170 16,985
Belconnen 1,070 0 0 0
Central Canberra 3,024 0 20,599 8,622
Molonglo 0 0 0 0
Woden and Weston 5,202 0 0 0
Tuggeranong 0 7,668 0 0
ARI 3,515 3,446 0 0
Other 0 0 0 0
Total 12,811 26,590 30,769 25,607
Table 13: Indicative Industrial Land Release Program (site area)
Location 2016-2017 2017-2018 2018-2019 2019-2020
(m2) (m
2) (m
2) (m
2)
Gungahlin 0 0 0 0
Belconnen 0 0 0 0
Central Canberra 0 0 0 0
Molonglo 0 0 0 0
Woden and Weston 0 0 0 0
Tuggeranong 0 0 0 0
ARI 0 0 0 0
Other 30,000 55,000 42,000 39,000
Total 30,000 55,000 42,000 39,000
Table 14: Indicative Community and Non-Urban Land Release Program (site area)
Location 2016-2017 2017-2018 2018-2019 2019-2020
(m2) (m
2) (m
2) (m
2)
Gungahlin 80,000 47,751 40,156 440
Belconnen 3,638 3,503 0 100,000
Central Canberra 1,996 0 0 0
Molonglo 0 0 0 34,500
Woden and Weston 3,873 18,143 0 0
Tuggeranong 41,897 0 8,000 0
ARI 0 0 0 0
Other 0 0 0 0
Total 131,404 69,397 48,156 134,940