Land Degradation Monitoring in the Nile Delta of Egypt ... · Remote sensing has long been used to...
12
International Journal of Basic and Applied Sciences Shalaby et al., Vo. 1 No. 4 ISSN: 2277-1921 Online version is available at: www.crdeep.com International Journal of Basic and Applied Sciences Vol. 1 No.4. 2012. Pp. 292-303 ©Copyright by CRDEEP. All Rights Reserved. Full Length Research Paper Land Degradation Monitoring in the Nile Delta of Egypt, using Remote Sensing and GIS Shalaby, A 1 ., R. R. Ali 2 and A.Gad 3 1. Researcher, head of land use department, NARSS, National Authority for Remote Sensing and Space Sciences (NARSS), 23 Joseph Tito Street, El-Nozha El-Gedida, P.O. Box : 1564 Alf Maskan, Cairo, Egypt. 2. Assistant Professor National Research Centre (NRC), El-Bohouth Street, Dokki, P.O.Box 12622, Cairo, Egypt 3. Professor, Head of Environmental Studies and Land Use Division, NARSS, Address: National Authority for Remote Sensing and Space Sciences (NARSS), 23 Joseph Tito Street, El-Nozha El-Gedida, P.O. Box : 1564 Alf Maskan, Cairo, Egypt *Corresponding Author: Shalaby Adel ABSTRACT Land degradation is one of the main problems that threaten the limited highly fertile land in the Nile Delta of Egypt. In this research, Landsat TM satellite images of 1984 and 1992, and ETM + of 2006 have been used to study the impact of urban sprawl on agricultural land in the Nile Delta. Visual interpretation using on screen digitizing and change detection techniques were applied for monitoring the urban sprawl. 42 soil profiles have been collected, morphologically described and analyzed for the study of their chemical and physical properties. The rate of salinization, and water logging were estimated following the FAO methodology for assessing land degradation. As urban sprawl is a significant degradation process, multi-temporal satellite images were used for its detection. The annual rate of salt accumulation in the soils is 0.10 dS/m, where an area of 3103.2 km 2 (or 10.8 %) has a high salinity risk. The water table is decreased by a rate of 1.85 cm per year in the Typic Aquisalids soils and 0.37 cm per year in the Typic Calcigypsids soils. The water logged areas cover 7461.3 Km 2 (or 25.9 %) concentrated in the Northern part of the Delta. The results show that a total expansion of urban area was 202.6 Km 2 between 1992 and 2006 of which 37.41 km 2 were converted from the alluvial fertile soils and 165.2 km 2 from cultivated desert fringes. It can be concluded that salinization and the urban sprawl are the dominant degradation process in the Nile Delta. Keywords: land degradation, urbanization, GIS, soil mapping, Nile delta, Egypt. INTRODUCTION Land degradation is the process which lowers the current and / or the potential capability of soil to produce goods or services (FAO/UNEP, 1978). It can also be defined as "the decline in soil quality caused through its misuse by human" (Lal and Stewart, 1990) or "a process that describes human induced phenomena, which reduce the current and/ or future soil capability" (Ayoub, 1991). It implies long term decline in soil productivity and its environment-moderating capacity (Lal, 2001). The concept of soil degradation according to the Global Assessment of Soil Degradation (GLASOD) focuses on a human-induced process (UNEP, 1992). Dryland environments comprise about 6.1 billion ha, or about 47% of all land area. Approximately 84% of this area falls within the arid, semiarid, and dry sub-humid climates which are inherently susceptible to desertification (UNEP, 1997). Estimates vary widely, but about 10-20% of the susceptible drylands is believed to have already undergone land degradation (Millenium Ecosystem Assessment, 2005). (Dudal, 1982; Rozanov, 1994) Estimated that about 70% of potentially productive dry lands, are currently threatened by various forms of land degradation. Soil degradation is a severe global problem of modern times (Lal, 1998). (Steiner, 1996) noted that every year 5 to 7 million hectares of agricultural land worldwide become unproductive due to physical and chemical degradation. The problem is much more serious in arid and semi-arid regions than in tropical And in temperate areas since arid soils are more prone to degradation because of their properties and the prevalent climatic conditions. The World Bank (1992, p. 57), states that salinization caused by inappropriate irrigation practices affects about 60 million ha, or 24% of all irrigated land. Severe declines in productivity are observed on about 24 million ha, or 10% of irrigated land. (Coote et al., 1982) reported that the processes which contribute to land degradation can be differentiated in two broad groups, those which can be observed over a wide area and are the result of regional soil management and climatic factors, and those which are localized in extent and are functions of local soil management conditions. Many of these processes are natural and some would proceed even without man's intervention. The water logging and subsequent salinization and/or alkalinization are the major land 292
Transcript of Land Degradation Monitoring in the Nile Delta of Egypt ... · Remote sensing has long been used to...
International Journal of Basic and Applied Sciences Shalaby et al., Vo. 1 No. 4 ISSN: 2277-1921
Online version is available at: www.crdeep.com
International Journal of Basic and Applied Sciences Vol. 1 No.4. 2012. Pp. 292-303 ©Copyright by CRDEEP. All Rights Reserved.
Full Length Research Paper
Land Degradation Monitoring in the Nile Delta of Egypt, using Remote Sensing and GIS Shalaby, A1., R. R. Ali2 and A.Gad3
1. Researcher, head of land use department, NARSS, National Authority for Remote Sensing and Space Sciences (NARSS), 23 Joseph Tito Street, El-Nozha El-Gedida, P.O. Box : 1564 Alf Maskan, Cairo, Egypt.
2. Assistant Professor National Research Centre (NRC), El-Bohouth Street, Dokki, P.O.Box 12622, Cairo, Egypt 3. Professor, Head of Environmental Studies and Land Use Division, NARSS, Address: National Authority for
Remote Sensing and Space Sciences (NARSS), 23 Joseph Tito Street, El-Nozha El-Gedida, P.O. Box : 1564 Alf Maskan, Cairo, Egypt
*Corresponding Author: Shalaby Adel
ABSTRACT Land degradation is one of the main problems that threaten the limited highly fertile land in the Nile Delta of Egypt. In this research, Landsat TM satellite images of 1984 and 1992, and ETM+ of 2006 have been used to study the impact of urban sprawl on agricultural land in the Nile Delta. Visual interpretation using on screen digitizing and change detection techniques were applied for monitoring the urban sprawl. 42 soil profiles have been collected, morphologically described and analyzed for the study of their chemical and physical properties. The rate of salinization, and water logging were estimated following the FAO methodology for assessing land degradation. As urban sprawl is a significant degradation process, multi-temporal satellite images were used for its detection. The annual rate of salt accumulation in the soils is 0.10 dS/m, where an area of 3103.2 km2 (or 10.8 %) has a high salinity risk. The water table is decreased by a rate of 1.85 cm per year in the Typic Aquisalids soils and 0.37 cm per year in the Typic Calcigypsids soils. The water logged areas cover 7461.3 Km2 (or 25.9 %) concentrated in the Northern part of the Delta. The results show that a total expansion of urban area was 202.6 Km2 between 1992 and 2006 of which 37.41 km2 were converted from the alluvial fertile soils and 165.2 km2 from cultivated desert fringes. It can be concluded that salinization and the urban sprawl are the dominant degradation process in the Nile Delta. Keywords: land degradation, urbanization, GIS, soil mapping, Nile delta, Egypt. INTRODUCTION Land degradation is the process which lowers the current and / or the potential capability of soil to produce goods or services (FAO/UNEP, 1978). It can also be defined as "the decline in soil quality caused through its misuse by human" (Lal and Stewart, 1990) or "a process that describes human induced phenomena, which reduce the current and/ or future soil capability" (Ayoub, 1991). It implies long term decline in soil productivity and its environment-moderating capacity (Lal, 2001). The concept of soil degradation according to the Global Assessment of Soil Degradation (GLASOD) focuses on a human-induced process (UNEP, 1992). Dryland environments comprise about 6.1 billion ha, or about 47% of all land area. Approximately 84% of this area falls within the arid, semiarid, and dry sub-humid climates which are inherently susceptible to desertification (UNEP, 1997). Estimates vary widely, but about 10-20% of the susceptible drylands is believed to have already undergone land degradation (Millenium Ecosystem Assessment, 2005). (Dudal, 1982; Rozanov, 1994) Estimated that about 70% of potentially productive dry lands, are currently threatened by various forms of land degradation.
Soil degradation is a severe global problem of modern times (Lal, 1998). (Steiner, 1996) noted that every year 5 to 7 million hectares of agricultural land worldwide become unproductive due to physical and chemical degradation. The problem is much more serious in arid and semi-arid regions than in tropical And in temperate areas since arid soils are more prone to degradation because of their properties and the prevalent climatic conditions. The World Bank (1992, p. 57), states that salinization caused by inappropriate irrigation practices affects about 60 million ha, or 24% of all irrigated land. Severe declines in productivity are observed on about 24 million ha, or 10% of irrigated land. (Coote et al., 1982) reported that the processes which contribute to land degradation can be differentiated in two broad groups, those which can be observed over a wide area and are the result of regional soil management and climatic factors, and those which are localized in extent and are functions of local soil management conditions. Many of these processes are natural and some would proceed even without man's intervention. The water logging and subsequent salinization and/or alkalinization are the major land
292

International Journal of Basic and Applied Sciences Shalaby et al., Vo. 1 No. 4 ISSN: 2277-1921
Online version is available at: www.crdeep.com
degradation processes in irrigated agriculture lands of arid and semi-arid conditions (Dwivedi et al., 1999). These processes can often be accelerated by the shifting of natural equilibrium, or by the inhabitation of natural soil-building processes. Two categories of soil degradation were recognized by (Oldeman, 1994). The first category is soil degradation due to displacement of soil material such as soil erosion by wind and water. The second category is in situ soil degradation due to chemical processes like loss of nutrients and organic matter, salinization, acidification, and pollution and due to physical processes such as compaction, waterlogging and subsidence. Egypt's Nile Valley and Delta, one of the oldest agricultural areas in the world, has been under continuous cultivation for at least 7000 years. The total cultivated area of the Nile Delta is 1,828,840 hectares, representing 56.49% of the cultivated area of Egypt. The deltaic lands, worldwide, could be considered as problematic lands regarding their fine texture, poor drainage, as well as the intrusion of sea water to the ground water table. Therefore, these soils are threatened by land degradation processes more than any other alluvial soils. Land degradation processes are clearly observed also in different regions under the arid and semi-arid climatic conditions. The Nile Delta is one of these regions which are threatened by water logging, soil compaction, salinization and alkalinization. In Egypt, construction of the Aswan High Dam in the 1960s enabled farmers in the Nile Valley and Delta to convert from basin to perennial irrigation, causing a rapid rise in shallow water tables and increasing soil salinity (Abul-Ata, 1977; Kinawy, 1977; Kishk, 1986; White, 1988; Scott, 1993). Within 20 years of the start of Aswan operations, waterlogging and salinization had affected 28% of farmland in Egypt and average yields in those areas had fallen by 30% (Speece and Wilkinson, 1982). Urbanization is an inevitable process due economic development and rapid population growth. Encroachment of urban settlements on agricultural lands may pose dire consequences. The continuous increase of population density causes an increasing pressure on areas already inhabited and caused a decrease in area per capita from 0.12 ha in 1950 to 0.06 ha in 1990 (Suliman, 1991) and to 0.04 ha in 2009 (CAPMAS, 2009). Therefore, determining the trend and the rate of land cover conversion are necessary for the development planner in order to establish rational land use policy (Shalaby and Tateishi, 2007).
Remote sensing has long been used to study and map land degradation. (Lantieri, 2006) indicated that salinization patterns in irrigation schemes can be detected as salt appears as white patches. It is possible to detect bare surfaces and land use changes (through multi-temporal analysis) that may help to assess land degradation problems in an area. When vegetation cover maps are created for different years, it is possible to determine the changes in land cover, which may indicate vegetation degradation (Shalaby and Tateishi, 2007). This straightforward method of using vegetation cover maps
to assess desertification is robust and rather accurate, but remains restricted to a physical state assessment of desertification. It does not look at driving forces, and therefore it identifies the problem, may assess its intensity, but does not provide guidance to its solution (Lantieri, 2006). Usually studies of land degradation combine satellite remote sensing information with other spatial data, like topography, soils, and land use, into a GIS. A GIS enables analysis of combinations of different data layers, which may result in a better understanding of land degradation problems, causes and consequences. Also, within a GIS modeling with relatively simple empirical and semi-empirical models can be done to determine the risk of land degradation in an area. For instance, (Okoth, 2003) used a simple logit regression equation that combines the parameters slope and ground cover to determine water erosion risk in Kiambu District of Kenya. The ground cover and slope data were derived from remote sensing imagery, while the erosion data for the regression analysis came from field studies. In the GIS, the regression model was used to determine the erosion risk in the entire area. A similar approach was used by (Vrieling et al., 2002) to determine water erosion risk in the Colombian Eastern Plains. Instead of a simple erosion model, they used a decision tree for erosion classification. The decision tree combined relevant information on soils, slopes and vegetation cover, and was derived from expert knowledge
The main objective of this study is to evaluate the hazard of salinization, water logging and urban sprawl over the Nile Delta using remote sensing and soils database. MATERIALS Soil maps: The soil maps of Egypt (ASRT, 1982) are the main materials collected and converted to the digital format. The collected soil maps cover the alluvial arable land and their interference with Desert fringes. These maps include a number of 12 map sheets at scale of 1: 100,000 in analogue format, covering the whole of Nile Delta region. Topographic maps: Topographic maps at scale 1: 50,000 covering the Nile Delta, produced by the Egyptian General Survey Authority (EGSA) were converted to a digital format. Satellite data: A number of 21 Landsat satellite images were used in this study to cover the study area in three different dates (1984, 1992 and 2006) to study the urban sprawl in the Nile delta. METHODS Geometric correction Accurate per-pixel registration of multi-temporal satellite data is essential for change detection because registration errors could be inferred as land use/cover changes, leading to an overestimation of actual change (Stow, 1999). Change detection analysis is performed on a pixel-by-pixel basis;
293

International Journal of Basic and Applied Sciences Shalaby et al., Vo. 1 No. 4 ISSN: 2277-1921
Online version is available at: www.crdeep.com
therefore any misregistration greater than one pixel will provide an anomalous result for that pixel. To overcome this problem, the root mean square error (RMSE) between any two dates should not exceed 0.5 pixel (Lunetta and Elvidge, 1998). In this study, geometric correction was carried out using ground control points from digital topographic maps (UTM,WGS84) to geocode the image of 1992, then this image was used to register all the other images; the RMSE between different images was less that 0.4 pixel, which is acceptable. Image enhancement and visual interpretation The goal of image enhancement is to improve the visual interpretability of an image by increasing the apparent distinction between the features. The process of visually interpreting digitally enhanced imagery attempts to optimize the complementary abilities of the human mind and the computer. The mind is excellent at interpreting spatial attributes on an image and is capable of identifying obscure or subtle features (Lillesand and Kiefer, 1994). Contrast stretching was applied on all images and the false colour composites (FCC) were produced. These FCC are visually interpreted using on-screen digitizing to delineate urban areas in the three different dates. Digital soil mapping The soil map of the study area was extracted from the available soil map of Egypt produced by the Academy of Scientific Research and Technology (ASRT 1982); the original nomenclature of soil order, suborders and great groups has been updated according to the latest American Soil Taxonomy of USDA (2010). The transformation of the soil map (produced in 1982) into a digital format was done. The study area is covered by 12 soil map sheets. These sheets were scanned and geometrically corrected using UTM coordinate system and WGS84 projection. On-screen digitizing was used to convert the 12 sheets into vector formats and then edge matching was performed using ArcGIS 9.2. It was noticed, after edge matching, that there was a deviation (constant in many places in its direction and magnitude) between the produced map and the well-registered landmarks, driven out of
the survey maps and satellite images of the study area. After investigating this deviation, it has been attributed to two reasons: lack of a coordinate and the rubber-sheeting that accompanied the edge-matching task (Boullie 1978). To overcome this problem another spatial adjustment (transformation) has been performed.Well-registered topographic maps and accurately geo-referenced satellite images have been used to perform the transformation process. The transformation tools of ArcGIS 9.2 system were found to be effective in performing the spatial adjustment of the thematic map (Burrough 1986). A semi-detailed survey was done throughout the investigated area to gain an appreciation on the soil patterns, the land forms and landscape characteristics. The laboratory analysis of the study area reported by ASRT (1982) has been compiled in the database and incorporated into the attribute table of the soil map (Pavasovic 1993; Nguyen 2001). Urban land cover class was overlaid on the soil map, and then the areas lost from different soil due to urban sprawl were calculated. Field work and laboratory analyses Field missions were carried out to represent the different soil units. A number of 42 soil profiles were studied in the field according to FAO guidelines, (FAO, 2006). Soil color was defined by Munssel Color Charts (Soil Survey Staff, 1975). The soil laboratory analyses (i.e. soil texture, CaCO3 content, CEC, EC, ESP, pH, soluble cations and anions and organic matter content) were carried out for 95 disturbed soil samples, representing different soil profile horizons, using the soil survey laboratory methods manual (USDA , 2004). The results of these analyses have been compiled in the database and then incorporated into the attribute tables of the digital GIS soil maps (Nguyen Quec Dinh, 2001 and Pavasovic, 1993). Land degradation hazard assessment Salinity and water logging hazard over the Nile Delta region was assessed using FAO/UNEP (1979) methodology for assessing soil degradation. The results were evaluated and confirmed with the soil units. The ratings used are present in Tables (1&2).
Table (1) Soil degradation classes and rates.
Adapted from FAO (1979)
Chemical degradation Salinization (Cs) increase in (EC) per dS/m/year Non to slight <0.5 Moderate 0.5-3 High 3-5 Very high >5 Physical degradation Water logging/increase in water table in cm/year Non to slight <1 Moderate 1-3 High 3-5 Very high >5
294

International Journal of Basic and Applied Sciences Shalaby et al., Vo. 1 No. 4 ISSN: 2277-1921
Online version is available at: www.crdeep.com
Table (2) Criteria used to determine the degree of the land degradation.
Urban sprawl detection Regardless of the technique used, the success of change detection from imagery will depend on both the nature of the change involved and the success of the image preprocessing and the classification procedures. If the nature of the change within a particular scene is either abrupt or at a scale appropriate to the imagery collected then change should be relatively easy to detect; problems occur only if spatial change is subtly distributed and hence not obvious within any image pixel (Milne 1988). In the case of the study area chosen, field observation and measurements have showed that the change in land cover between the three dates was both marked and abrupt. In this study post-classification change detection technique was applied. Post-classification is the most obvious method of change detection, which requires the comparison of independently produced classified images. Post-classification comparison proved to be the most effective technique, because data from two dates are separately classified, thereby minimizing the problem of normalizing for atmospheric and sensor differences between different dates. Urban land cover class was extracted from the visual interpretation of the satellite images, and then cross-tabulation analysis was carried out to study the spatial distribution and areas of urban sprawl (of 1984, 1992 and 2006) on different soil types, ArcGIS 9.2 software was used for this function. RESULTS AND DISCUSSION Soils of the Nile Delta The soil map of the Nile Delta was extracted from the soil map of Egypt (ASRT, 1982), which was classified using the American Soil Taxonomy (USDA, 1975). The produced map (Fig. 1) has been updated according to the latest edition
(USDA, 2010). The obtained results indicate that the Vertic Torrifluvents is the major sub great group in the alluvial Nile Delta, covering 12,940.3 km2, representing 41.2% of the total area. Patches of sub-great groups Typic Torrifluvents are included in the alluvial soils. The sub-great group Typic Quartizpsamments dominates the eastern and western desert fringes, covering an area of 4,082 km2 (12.9% of total area) in addition to an area of 375.2 km2 interfered with the Typic Torriorthents sub-great group. The Typic Torripsamments/Typic Torriorthents sub-great groups association exhibits an area of 399.1 km2, representing 1.3% of total area, adjacent to the previous one. The sub-great groups Typic Torrifluvents, Typic Torriorthents and Typic Torripsamments exhibit significant coverage in delta borders, as their areas are 2,514.9, 2,390.9 and 1,385.0 km2 representing 8%, 7.6% and 4.4% of total area respectively. The sub-great groups Typic Aquisalids, Typic Haplosalids and Aquic Torrifluvents exist in the northern Delta region influenced by the northern Delta lakes. They cover areas of 1,928.8, 166.9 and 437.9 km2, representing 6.1%, 0.5% and 1.4% of the total Nile Delta area respectively. Minor areas of Typic Haplocalcids, Typic Haplogypsids, Typic Petrogypsids and Typic Calcigypsids are distributed in the eastern and western Delta regions covering areas of 1,012.6, 1,007.5, 145.9 and 4.1 km2 representing 3.2%, 3.2%, 0.5% and 0.01% respectively. Limited Hill and Rockland areas exist in the southern Delta region, covering areas of 1,223.2 and 1,426.9 km2 respectively. Table (3) illustrates areas and representative soil profiles of the different soils in the mapped area.
Hazard type Indicator Unit Hazard class Low Moderate High Very high
Salinization EC dS/m 4 4-8 8-16 >16 Water Logging Water table Cm 150 150-100 100-50 <50
295

International Journal of Basic and Applied Sciences Shalaby et al., Vo. 1 No. 4 ISSN: 2277-1921
Online version is available at: www.crdeep.com
Figure (1) Soils of the Nile Delta overlaid by the representative soil profiles Table (3) Areas, frequency and representative sol profiles of Sub great groups of the Nile Delta region
Type (Sub great group) Area (Km2) % Representative soil profiles Aquic Torrifluvents 437.94 1.39 7 Typic Aquisalids 1928.75 6.13 1, 4, 8, 26 Typic Calcigypsids 4.09 0.01 35 Typic Haplocalcids 1012.60 3.22 31, 32 Typic Haplogypsids 1007.53 3.20 25 Typic Haplosalids 166.91 0.53 3, 9, 37 Typic Petrogypsids 145.85 0.46 24 Typic Quartizipsamments 4082.00 12.98 2, 5, 11, 19, 22 and 42 Typic Quartizipsamments/ Typic Torriorthents 375.18 1.19 33
Typic Torripsamments/ Typic Torriorthents 399.06 1.27 34
Typic Torrifluvents 2514.98 8.00 16, 13, 18, 29, 27 and 38 Typic Torriorthents 2390.99 7.60 21, 30, Typic Torripsamments 1385.04 4.41 23, 40 and 41 Vertic Torrifluvents 12940.34 41.16 6, 10, 12,14, 15, 17, 20, 28 and 39 Hilland 1223.24 3.89 -- Rock land 1426.88 4.54 36 (observation point) Total 28791.26 100.00
Note: Bold numbers are the typical soil profiles considered in assessing soil degradation rate and hazard
296

International Journal of Basic and Applied Sciences Shalaby et al., Vo. 1 No. 4 ISSN: 2277-1921
Online version is available at: www.crdeep.com
Degradation rate and risk assessment Thirteen soil profiles were selected out of a total 42 studied profiles representing different soils of the Nile Delta. Soil
laboratory analyses (Table 4) were used to assess land degradation rate and hazard for each soil sub-great groups.
Table (4) Laboratory analyses of the typical representative soil profiles
Taxonomic unit Representativ
e profile Depth Texture
class pH EC CaC
O3 OM ESP CEC
in cm 1:02.5 dS/m % % meq/100 g. soil
Aquic Torrifluvents
7 0 - 10 C 7.73 3.68 2.51 1.39 12.5 46.5 25-10 C 7.81 2.83 2.31 1.7 11.7 48.8 25 - 40 CL 7.88 2.56 1.62 0.31 14.3 40.3 40 - 60 CL 7.91 1.78 1.12 0.38 14.3 39.4
Typic Aquisalids 8 0-25 C 7.81 13.3 1.33 1.7 13.2 52.6 25-50 C 7.88 11.04 2.05 0.3 12.6 43.2
Typic Haplosalids
37 0 - 30 SL 7.95 11.7 5.55 0.39 16.2 14.5 30 - 50 SL 7.87 18.9 4.41 0.64 14.8 17.4 50 - 80 SCL 8.05 30.6 7.22 0.41 15.6 32.4
80 - 110 CL 7.64 16.2 9.71 0.42 13.4 38.2 Typic Torrifluvents
13 0-20 CL 8.15 3.2 3.15 2.86 16.5 40.6 20-45 CL 8.4 1.32 2.11 1.35 13.7 39.3 45-80 C 8.01 1.8 1.6 1.91 14.5 44.3 80-110 C 8.13 3.57 1.2 2.12 12.8 45.8
Vertic Torrifluvents
10 0-10 SiC 8.4 0.92 2.11 2.01 12.3 42.3 10-35 SiC 8.5 0.79 1.03 0.7 14.5 47.6 35-70 SiC 8.25 0.62 0.92 1.42 13.2 49.8 70-120 C 8.34 0.8 0.88 1.77 15.8 45.1
Typic Calcigypsids
35 0 - 15 C 7.57 10.9 7.52 0.51 11.3 45.6 15 - 40 CL 7.74 6.1 8.61 0.57 14.7 37.4 40 - 60 SCL 7.7 5.8 6.92 0.45 14.9 27.8 60 - 90 LS 7.86 2.52 9.52 0.23 15.7 14.8
Typic Haplocalcids
31 0-25 SL 7.92 3.65 13.52 0.12 25.6 12.8 25-70 LS 8.1 4.22 14.23 0.15 26.4 8.6
Typic Haplogypsids
25 0 - 15 SL 8.21 14.23 10.22 1.65 22.6 19.6 15 - 50 SCL 8.41 11.65 8.65 1.11 24.2 30.5 50 - 85 SCL 7.96 14.71 7.33 0.42 26.4 28.6
Typic Petrogypsids
24 0-20 CL 8.21 7.51 9.12 0.51 16.84 28.3 20-75 CL 8.05 8.11 11.23 0.12 21.61 46.1
Typic Torriorthents
30 0-15 L 8.23 3.15 4.86 1.13 13.7 23.6 15-35 L 8.41 4.33 5.19 1.52 11.9 25.4 35-75 C 8.11 5.62 6.73 0.41 12.7 45.3 75-130 C 8.05 7.11 7.12 0.1 18.6 39.5
Typic Torripsamments
41 0 - 15 S 7.6 7.62 1.51 0.41 14.8 8.9 15 - 40 S 7.93 3.49 1.95 0.21 12.6 9.5
40 - 130 S 8 3.51 2.03 0.02 13.5 9.3 Typic Quartizipsamments
42 0-25 S 8.1 0.77 8.33 0.3 11.2 7.2 25-100 S 8.57 0.2 10.23 0.32 10.3 8.3
Typic Quartizipsamments/ Typic Torriorthents
33 0 - 15 LS 7.72 5.03 7.74 0.36 12.5 12.3 15 - 50 S 7.73 7.08 9.15 0.32 14.3 10.6
50 - 120 S 7.61 5.92 3.65 0.05 9.8 11.4
297

International Journal of Basic and Applied Sciences Shalaby et al., Vo. 1 No. 4 ISSN: 2277-1921
Online version is available at: www.crdeep.com
The rate of dominant land degradation processes (i.e. water logging and salinity) was estimated by the comparison between the main land characteristics of (1982) and (2009). Consequently the rates of land degradation, for each type, were classified to slight, moderate or high. The risk of water logging and salinity was estimated from the present value of electric conductivity, and the depth of water table. The rate and risk of water logging and salinity of the Nile Delta soils are presented in table (5). The obtained data were attached to the attribute table of the digital soil map of Nile Delta for mapping the water logging and salinity hazard. Figures (2 & 3) and table (6) represent the spatial distribution and areas of water logging and salinity hazard classes over the Nile Delta region. The obtained data reveals the following: Water logging: The results show that the soils depth of the studied area varies from 50 cm to 130 cm. The soils of Aquic Torrifluvents, Typic Aquisalids, Typic Calcigypsids, Typic Haplocalcids, Typic Haplogypsids, Typic Petrogypsids, are characterized by a soil depth differ from 50 to 90 cm, these soils are threatened by a moderate to high water logging risk. The rest of the soils have
a depth ranging from 100 to 130 cm, accordingly characterized by slight risk of water logging. The annual decrease of water table reach its maximum in the Typic Aquisalids and Typic Quartizipsamments (1.85 cm/year), while recording 1.48 cm/year in the Aquic Torrifluvents and 1.11 cm/year in Vertic Torrifluvents, Typic Haplocalcids and Typic Quartizipsamments/ Typic Torriorthents soils. The soils of moderate rate and very high risk of water logging (M, 4) occupy an area of 1,928.7 km2 (i. e. 6.70 %) represented by Typic Aquisalids soils in the north of the Nile Delta. The soils of Aquic Torrifluvents, Typic Haplocalcids and Typic Quartizipsamments are characterized by moderate rate and high risk of water logging (M, 3) covering an area of 5,532.5 km2 (i. e. 19.2 %). These soils are found mainly at the western and eastern parts of the Delta, also a small strip is found at the north of the Nile Delta near to El Borlolus Lake. Most of the alluvial deposits of the Delta are characterized by moderate rate and risk of water logging associating the Vertic Torrifluvents, Typic Quartizipsamments/Typic Torriorthents and Typic Torripsamments/ Typic Torriorthents soils, representing 47.6 % of the total area.
Table (5) Water logging and salinity (rate & risk) of the different soils
Taxonomic
unit Representativ
e profiles
Water logging (depth in cm)
Salinity average (dS/m)
1982 2009 Rate Class Risk 1982 2009 Rate Class Risk Aquic Torrifluvents 7 100 60 1.48 M 3 0.8 2.71 0.07 S 1
Typic Aquisalids 8 100 50 1.85 M 4 8.5 12.17 0.14 S 3
Typic Haplosalids 37 130 110 0.74 S 2 10.5 19.35 0.33 S 4
Typic Torrifluvents 13 130 110 0.74 S 2 1.4 2.47 0.04 S 1
Vertic Torrifluvents 10 150 120 1.11 M 2 0.5 0.78 0.01 S 1
Typic Calcigypsids 35 100 90 0.37 S 3 2.3 6.33 0.15 S 2
Typic Haplocalcids 31 100 70 1.11 M 3 1.5 3.93 0.09 S 1
Typic Haplogypsids 25 100 85 0.56 S 3 7.6 13.53 0.22 S 3
Typic Petrogypsids 24 100 75 0.93 S 3 4.6 7.81 0.12 S 2
Typic Torriorthents 30 150 130 0.74 S 2 4.2 5.05 0.03 S 2
Typic Torripsamments
41 150 130 0.74 S 2 1.6 4.87 0.12 S 2
Typic Quartizipsamments
42 150 100
1.85 M 3 1.2 0.49 0.00 I 1
298

International Journal of Basic and Applied Sciences Shalaby et al., Vo. 1 No. 4 ISSN: 2277-1921
Online version is available at: www.crdeep.com
Typic Quartizipsamments/ Typic Torriorthents
33 150 120 1.11 M 2 4.5 6.01 0.05 S 2
Typic Torripsamments/ Typic Torriorthents
34 150 110 1.48 M 2 15.1 15.23 0.00 N 3
Note: the data of 1982 was extracted from “soil map of Egypt” after ASRT, 1982 Degradation Rate: I= improved, N= non, S= slight, M=moderate Degradation risk:1= low, 2= moderate, 3= high, 4= very high
The slight rates of water logging are found associated with the Typic Haplosalids, Typic Torrifluvents, Typic Torriorthents, and Typic Torripsamments soils, they also have a moderate risk (S, 2) of water logging, exhibiting an area of 6,457.9 km2 (i. e. 22.4 %). On the other hand, the soils of Typic Haplogypsids and Typic Petrogypsids have a slight rate of water logging but with a high risk (S, 3) found only in the eastern and western desert fringes of the Nile Delta, covering an area of 1,157.5 km2 (i. e. 4.0 %). Soil Salinity: The values of electric conductivity (EC) vary widely in the study area, where the EC values range between 0.46 – 19.35 dS/m. that indicates variable levels of salinity risk. On the other hand, the rate of EC increase in different soils is generally slight (i.e. less than 0.5 dS/m per year), attributed to the existence of network of effective drains. This indicates that the salinity hazard in the Nile Delta is related mainly to its
current state. The very high risk of salinization (S, 4) is found in the northern parts of Nile Delta, associated with the marine and lacustrine deposits. This class occupies the Typic Haplosalids soils covering only 166.9 km2 (i. e. 0.6 %). The soils of high salinity risk (S, 3) cover an area of 2,936.3 km2 (i. e. 10.2 %) found associated with Typic Aquisalids, Typic Haplogypsids and Typic Torripsamments/Typic Torriorthents soils. The soils of Typic Calcigypsids, Typic Petrogypsids, Typic Torriorthents, and Typic Torripsamments are characterized by moderate risk of salinity. They cover an area of 4,301.1 km2 (i. e 14.9 %) situated in the eastern and western desert fringes and the lacustrine deposits at the north of the Nile Delta. The soils of low risk dominate the whole alluvial deposits in the Nile Delta, covering an area of 16,905.9 km2 (i.e. 58.7%). These classes of salinity risk are found associated with the Aquic Torrifluvents, Typic Torrifluvents, Vertic Torrifluvents, Typic Haplocalcids, and Typic Quartizipsamments soils.
Figure (2) Water logging rate and risk over the Nile Delta
299
International Journal of Basic and Applied Sciences Shalaby et al., Vo. 1 No. 4 ISSN: 2277-1921
Online version is available at: www.crdeep.com
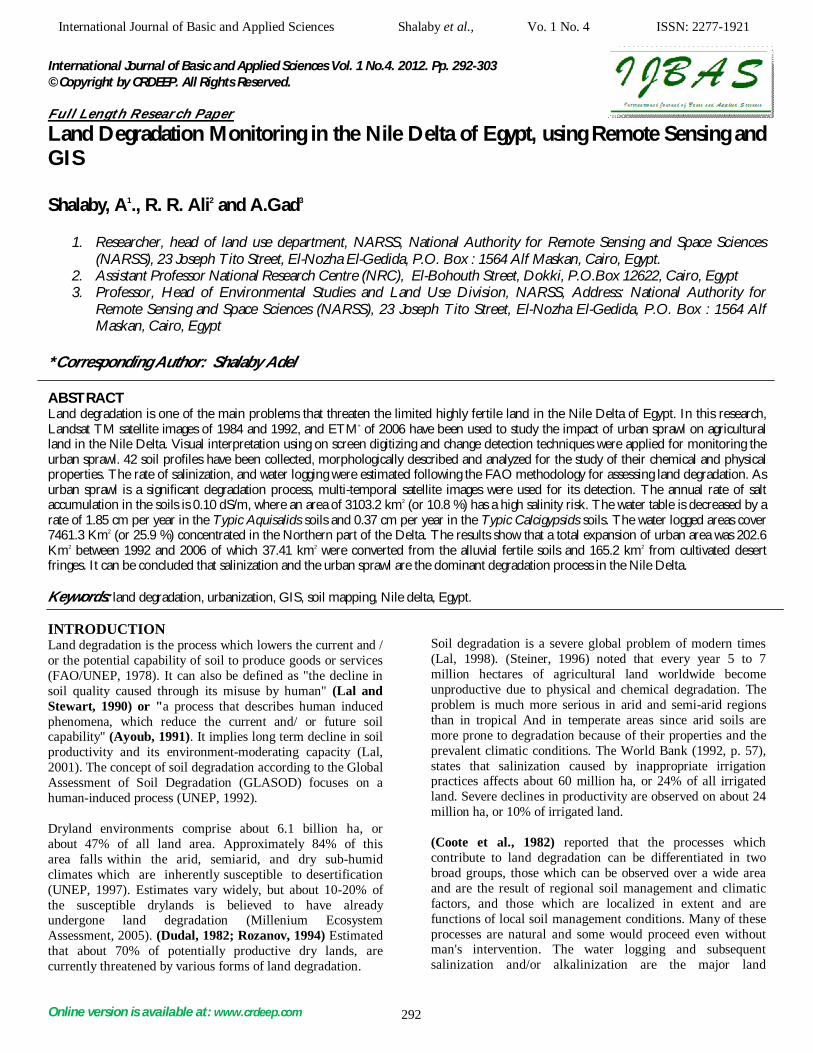
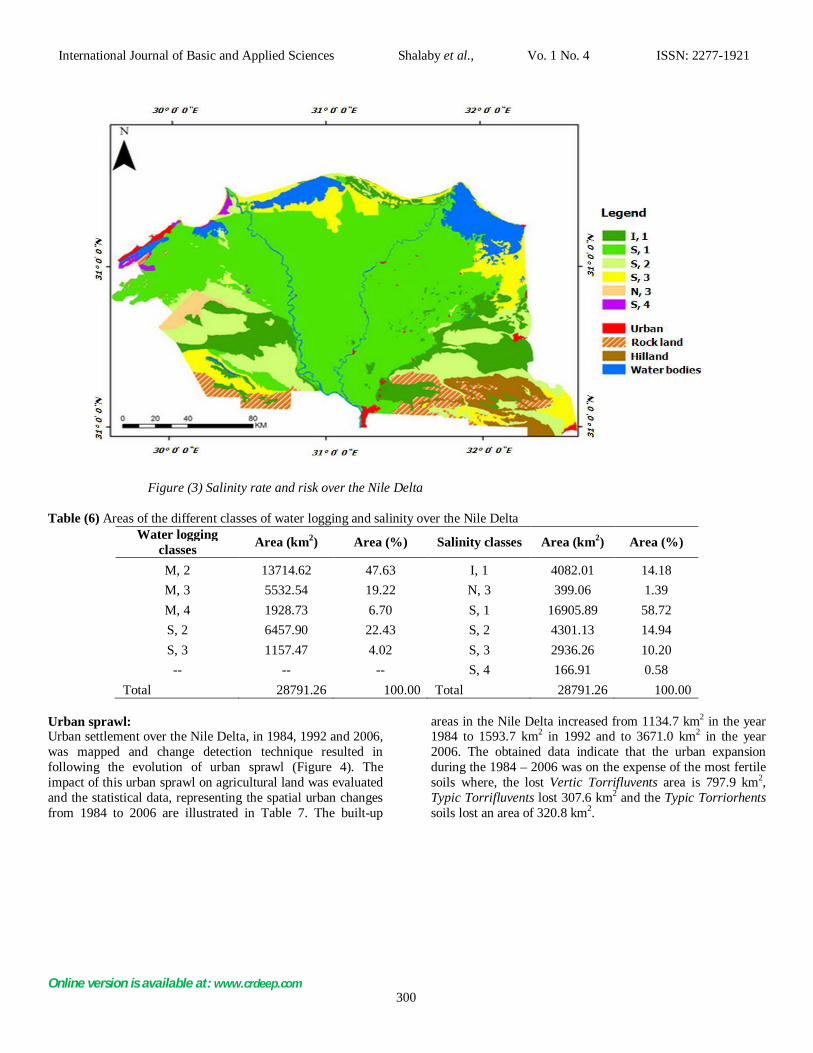
Figure (3) Salinity rate and risk over the Nile Delta
Table (6) Areas of the different classes of water logging and salinity over the Nile Delta Water logging
classes Area (km2) Area (%) Salinity classes Area (km2) Area (%)
M, 2 13714.62 47.63 I, 1 4082.01 14.18 M, 3 5532.54 19.22 N, 3 399.06 1.39 M, 4 1928.73 6.70 S, 1 16905.89 58.72 S, 2 6457.90 22.43 S, 2 4301.13 14.94 S, 3 1157.47 4.02 S, 3 2936.26 10.20 -- -- -- S, 4 166.91 0.58
Total 28791.26 100.00 Total 28791.26 100.00
Urban sprawl: Urban settlement over the Nile Delta, in 1984, 1992 and 2006, was mapped and change detection technique resulted in following the evolution of urban sprawl (Figure 4). The impact of this urban sprawl on agricultural land was evaluated and the statistical data, representing the spatial urban changes from 1984 to 2006 are illustrated in Table 7. The built-up
areas in the Nile Delta increased from 1134.7 km2 in the year 1984 to 1593.7 km2 in 1992 and to 3671.0 km2 in the year 2006. The obtained data indicate that the urban expansion during the 1984 – 2006 was on the expense of the most fertile soils where, the lost Vertic Torrifluvents area is 797.9 km2, Typic Torrifluvents lost 307.6 km2 and the Typic Torriorhents soils lost an area of 320.8 km2.
300

International Journal of Basic and Applied Sciences Shalaby et al., Vo. 1 No. 4 ISSN: 2277-1921
Online version is available at: www.crdeep.com
Figure (4) Urban settlements in the Nile Delta in 1984, 1992 and 2006
Table (7) Changes in the areas of different soils and urban in the Nile Delta region in 1984, 1992 and
2006
Note: A= the difference between 1984 and 1992, B= the difference between 1992 and 2006 and C= the difference between 1984 and 2006.
Mapping unit 1984 1992 2006 A B C Aquic Torrifluvents 426.76 421.63 402.77 -5.14 -18.85 -23.99 Hilland 441.00 441.00 427.99 -0.00 -13.01 -13.01 Rock land 2315.20 2291.49 1931.24 -23.71 -360.24 -383.95 Typic Aquisalids 1921.48 1910.18 1806.93 -11.30 -103.26 -114.56 Typic Calcigypsids 4.09 3.99 3.61 -0.09 -0.38 -0.47 Typic Haplocalcids 1064.22 1055.80 945.71 -8.42 -110.09 -118.51 Typic Haplogypsids 1034.21 1007.53 997.58 -26.69 -9.94 -36.63 Typic Haplosalids 166.73 162.99 126.91 -3.74 -36.07 -39.82 Typic Petrogypsids 145.85 145.85 145.85 0.00 0.00 0.00 Typic Quartizipsamments 5051.77 5009.45 4786.59 -42.32 -222.86 -265.18 Typic Quartizipsamments/ Typic Torriorthents 374.93 374.36 366.52 -0.57 -7.83 -8.41
Typic Torrifluvents 1368.04 1128.16 1060.69 -239.88 -67.46 -307.35 Typic Torriorthents 2951.55 2933.25 2630.79 -18.30 -302.47 -320.76 Typic Torripsamments 809.81 775.31 749.63 -34.50 -25.68 -60.18 Vertic Torrifluvents 14122.12 14075.93 13324.17 -46.18 -751.76 -797.94 Urban 1132.85 1593.69 3623.59 460.83 2029.90 2490.74 Total 33330.60 33330.60 33330.60
301

International Journal of Basic and Applied Sciences Shalaby et al., Vo. 1 No. 4 ISSN: 2277-1921
Online version is available at: www.crdeep.com
Most of the urban expansion over the fertile soils happened during the 1992 to 2006 period. From 1984 to 1992 the Vertic Torrifluvents, soils lost a relatively small areas (i.e. 46.2 km2) compared with 751.8 km2 during 1992 – 2006 period. The areas of Rockland and hilland was stable during 1984 – 1992 period, where the lost area amounted only 23.7 km2 compared with 383.9 km2 during 1992 – 2006. The latest urban expansion in the desert fringes of the Nile Delta between 1992
and 2006 is planned on the contrary of the urban sprawl between 1984 and 1992. The recent legalization aiming to control construction on agricultural land did not prevent the unplanned urban invasion over the fertile land. This kind of unplanned urban expansion has severe environmental consequences causing many social and health problems. This is caused by inappropriate infrastructure including roads and sewage systems as well as clean water unavailability.
CONCLUSION The objective of this study was to to evaluate the hazard of salinization, water logging and urban sprawl over the Nile Delta using remote sensing and soils database. It can be concluded that the salinization and urban sprawl are the dominant land degradation processes in the Nile Delta. Application of GIS and analyzing multi-temporal satellite images are found as elaborative techniques for assessing the current status and land degradation hazard indices.
The study area has undergone a very severe land cover change as a result of urbanization resulting from rapid population growth. A considerable increase in urban settlements has taken place at the expense of the most fertile land in the Nile Delta. The main causes of urbanization are the rapid population growth and the internal migration. This problem needs to be seriously studied, through multidimensional fields including socioeconomic, to preserve the precious and limited agricultural land and increase food production.
REFERENCES 1. Abul-Ata, A.A. 1977. The conversion of basin irrigation to perennial systems in Egypt. In: Worthington, E.B. (Ed.), Arid Land Irrigation in Developing Countries: environmental Problems and Effects. Pergamon Press, Oxford. 2. ASRT. 1982. Soil Map of Egypt. Final report, Academy of Scientific Research and Technology (ASRT) Cairo, Egypt. 3. Ayoub, A. T. 1991. “An assessment of human induced soil degradation in Africa. “ U. N. environmental program, Nairobi, Kenya. Second soil Sci. conf. Cairo Egypt. 4. Bonham-Carter, G.F. (1994). Geographic Information Systems for Geoscientists: Modelling with GIS. Geological Survey of Canada, Love Printing Service Ltd, Ontario, Canada. 5. Boullie, F. 1978. Structuring cartographic data and spatial processes with the hypergraph-based data structure. In: First International Advanced study symposium on Topological Data Structures for Geographic Information Systems (ed. G. Dutton) Vol. 5. Laboratory for Computer Graphics and Spatial Analysis, Harvard. 6. Burrough, P.A. 1986. Principals of geographic Information Systems for land resources assessment. Clarendon, Oxford. 7. CAPMAS (2009), “Statistical Year Book,” Annual Report July 2009, Cairo, Egypt: Central Agency for Public Mobilization and Statistics (CAPMAS). 8. Condom, N., Kuper, M., Marlet, S.; Valles, V.; Kijne, J. 1999. “Salinization, alkalinization and sodification in Punjab (Pakistan).: characterization of the geochemical and physical processes of degradation” in land degradation and development 1999, 10: 2 123140, 36 ref.
9. Coote, D. R.; Dumanski, J. and Ramsey, J. F. 1982. “An assessment of the degradation of agricultural land in Canada” L. R. R. I. Contribution No. 118 Ottawa, Ontario. 10. Dudal, R. 1982. “Paddy soils” Int. Rice Comm. Newsl. 7(2). 1927. 11. Dwivedi, R. S.; Sreenivas, K.; and Ramana, K. V. 1999. “Inventory of saltaffected soils and water logged areas: a remote sensing approach “Intern. Journal of remote sensing 20: 8, 15891599, 14 ref. 12. Eswaran, H. E.; Reich, P. E. and Binroth, F. 2001. “Global desertification tension zones” USDA, Natural Resources Service Washington DC. 13. FAO/UNEP 1978. “Methodology for assessing soil degradation” Rome, 2527 January 1978 Italy. 14. http://lada.virtualcentre.org/eims/approver/pub_dett.asp?pub_id=92920&app=0§ion=method). 15. ITT. 2009. “ITT corporation ENVI 4.7 software”, 1133 Westchester Avenue, White Plains, NY 10604, USA. 16. Kinawy, I.Z. 1977. The efficiency of water use in irrigation in Egypt. In: Worthington, E.B. (Ed.), Arid Land Irrigation in Developing Countries: Environmental Problems and 17. Kishk, M.A. 1986. Land degradation in the Nile Valley. Ambio 15 (4), 226–230 18. Lal, R. 1998. Soil quality and sustainability. In: Lal R, Blum WEH (eds) Methods for Assessment of Soil Degradation Advances in Soil Science. CRC Press, Boca Raton.Pp. 17-30. 19. Lal, R. 2001. Soil degradation by erosion. Land Degradation and Development 12: 519-539. 20. Lal, R. and Stewart, B.A. 1990. “Advances in soil science, soil degradation” New York: Springer Verlag, 349 P. 21. Lantieri, D. 2006: Potential use of satellite remote sensing for land degradation assessment in drylands. Application to the LADA project. FAO Environment and Natural Resources Service. (available at:
302

International Journal of Basic and Applied Sciences Shalaby et al., Vo. 1 No. 4 ISSN: 2277-1921
Online version is available at: www.crdeep.com
22. Lillesand, T.M., and Kiefer, R.W. (1994), Remote Sensing and Image Interpretation (4th ed.), New York: John Wiley and Sons. 23. Lunetta, R.S., and Elvidge, C.D. (1998), Remote Sensing Change Detection (Chapter 7), Ann Arbor, MI: Ann Arbor Press, pp. 123–135. 24. Millennium Ecosystem Assessment. 2005: Ecosystems and Human Well-being: Desertification Synthesis. World Resources Institute, Washington, DC. 25. Milne, A.K. (1988), “Change Detection Analysis Using Landsat Imagery a Review of Methodology,” in Proceedings of IGARSS 88 Symposiums, Edinburgh, Scotland, 13–16 September 1988, pp. 541–544. 26. Nguyen Quec Dinh. 2001. Cave database development, spatial analysis and 3D visualization with GIS – Case study in Son La (Vietnam). VUBrussels, Master dissertation (unpubl.). 27. Okoth, P.F. 2003: A Hierarchical Method for Soil Erosion Assessment and Spatial Risk Modelling: A Case Study of Kiambu District in Kenya. Doctoral Thesis, Wageningen University, Wageningen, the Netherlands. 28. Oldeman, L.R. 1994. “The global extent of soil degradation in Greenland” Soil resilience and sustainable land use , CAB International PP. 99-118. 29. Oldeman, L.R. 1994. Global extent of soil degradation. In: Oldeman LR (ed) Soil resilience and sustainable use. CAB International, UK.Pp. 99-118. 30. Pavasovic, k. 1993. Land suitability models. Workshop on Geographical Information Systems in Integrated Coastal Management, Alexandria, Egypt. 31. Rozanov, B.G. 1994. “Constraints in managing soils for sustainable land use in dry lands” Soil resilience and sustainable land use ,CAB , international PP.145-153 . 32. Scott, S.F. 1993. Water and sustainable agricultural development. In: Ecologically Sound Resources Management
in Irrigation. German Association for Water Resources and Land Improvement. Verlag Paul Parey, Hamburg, Germany 33. Soil survey staff. 1975. “Soil munssel color charts” U.S.D.A., soil conserve Washington , D.C. 34. Speece, M., Wilkinson, M.J. 1982. Environmental degradation and development of arid lands. Desertif. Control Bull. 7, 2–9. 35. Steiner , K.G. 1996. Causes of soil degradation and development approaches to sustainable soil management. Margraf Verlag, Weikersheim. 36. Stow, D.A. (1999), “Reducing Mis-Registration Effects for Pixel-Level Analysis of Land-Cover Change,” International Journal of Remote Sensing, 20, 2477–2483. 37. Tomlin, C. D. 1990. Geographic Information Systems and Cartographic Modeling. Prentice Hall, Englewood Cliffs, N.J. 38. UNEP. 1992. “World atlas of desertification” Publ. E. Arnold , London , 69 pp. 39. United Nations Environment Programme. 1997. World Atlas of Desertification, 2 ed. United Nations Environment Programme, Nairobi. 40. USDA. 2004. "Soil Survey Laboratory Methods Manual" Soil Survey Investigation Report No. 42 Version 4.0 November 2004. 41. USDA. 2010. Keys to Soil Taxonomy. United State Department of Agriculture, Natural Resources, Conservation Service (NRCS), Eleventh Edition. 42. Vrieling, A. 2006: Satellite remote sensing for water erosion assessment: A review. Catena, Volume 65, pp. 2-18. 43. White, G.F. 1988. The environmental effects of the High Dam at Aswan, Environment 30(7) 411, 34–40. 44. World Bank. 1992. Development and the Environment. World Development Report 1992. World Bank, Washington, DC.
303