Lake Sakakawea 10110101 - USDAthe basis of race, color, national origin, age, disability, and where...
16
Produced by the Natural Resources Planning Staff Bismarck, ND The U.S. Department of Agriculture (USDA) prohibits discrimination in all its programs and activities on the basis of race, color, national origin, age, disability, and where applicable, sex, marital status, familial status, parental status, religion, sexual orientation, genetic information, political beliefs, reprisal, or because all or a part of an individual's income is derived from any public assistance program. (Not all prohibited bases apply to all programs.) Persons with disabilities who require alternative means for communication of program information (Braille, large print, audiotape, etc.) should contact USDA's TARGET Center at (202) 720-2600 (voice and TDD). To file a complaint of discrimination write to USDA, Director, Office of Civil Rights, 1400 Independence Avenue, S.W., Washington, D.C. 20250-9410 or call (800) 795-3272 (voice) or (202) 720-6382 (TDD). USDA is an equal opportunity provider and employer. Lake Sakakawea 10110101 August 2008 8-Digit Hydrologic Unit Profile Introduction The Lake Sakakawea 8-Digit Hydrologic Unit Code (HUC) (10110101) sub-basin has approximately 4,184,000 acres in the entire sub-basin. This sub-basin is located within the Missouri Region and the Missouri-Little Missouri Sub-Region. The Lake Sakakawea sub- basin is covering parts of nine counties (Burke, Divide, Dunn, McKenzie, McLean, Mercer, Mountrail, Ward and Williams) in North Dakota. Of the 4,184,000 acres, Mountrail County contains 29%, McLean 19%, McKenzie 16%, Williams 16%, Ward 9%, Mercer 4%, Burke 3%, Divide 2%, and Dunn 2%. There are approximately 2,396 farms in the sub-basin. The following map shows how the sub-basin is located within North Dakota.
Transcript of Lake Sakakawea 10110101 - USDAthe basis of race, color, national origin, age, disability, and where...

Produced by the Natural Resources Planning Staff Bismarck, ND
The U.S. Department of Agriculture (USDA) prohibits discrimination in all its programs and activities on the basis of race, color, national origin, age, disability, and where applicable, sex, marital status, familial status, parental status, religion, sexual orientation, genetic information, political beliefs, reprisal, or because all or a part of an individual's income is derived from any public assistance program. (Not all prohibited bases apply to all programs.) Persons with disabilities who require alternative means for communication of program information (Braille, large print, audiotape, etc.) should contact USDA's TARGET Center at (202) 720-2600 (voice and TDD). To file a complaint of discrimination write to USDA, Director, Office of Civil Rights, 1400 Independence Avenue, S.W., Washington, D.C. 20250-9410 or call (800) 795-3272 (voice) or (202) 720-6382 (TDD). USDA is an equal opportunity provider and employer.
Lake Sakakawea 10110101
August 2008 8-Digit Hydrologic Unit Profile
Introduction The Lake Sakakawea 8-Digit Hydrologic Unit Code (HUC) (10110101) sub-basin has approximately 4,184,000 acres in the entire sub-basin. This sub-basin is located within the Missouri Region and the Missouri-Little Missouri Sub-Region. The Lake Sakakawea sub-basin is covering parts of nine counties (Burke, Divide, Dunn, McKenzie, McLean, Mercer, Mountrail, Ward and Williams) in North Dakota. Of the 4,184,000 acres, Mountrail County contains 29%, McLean 19%, McKenzie 16%, Williams 16%, Ward 9%, Mercer 4%, Burke 3%, Divide 2%, and Dunn 2%.
There are approximately 2,396 farms in the sub-basin. The following map shows how the sub-basin is located within North Dakota.

Lake Sakakawea 10110101
August 2008 8-Digit Hydrologic Unit Profile
Page 2 of 16
Physical Description The following table and map show land use / land cover within the sub-basin.
Land Use/ Land Cover (National Resources Inventory [NRI])1
Acres Percent of HUC
Forestland 21,000 1%
Cropland 1,690,900 40%
Conservation Reserve Program (CRP) Land 2 a
228,100 5%
Tame Grass/Hayland 134,300 3%
Pastureland 54,300 1%
Rangeland 1,355,300 32%
Urban/Farmstead/ Transportation Land 195,100 5%
Water/Wetlands 353,200 9%
Federal Lands 151,800 4%
North Dakota HUC Totals b 4,184,000 100%
* Less than one percent of total acres. See below for special considerations. a: Estimate from Farm Service Agency records and include CRP/CREP. b: Totals may not add due to rounding and small unknown acreages.//22
Irrigated Land (Farm Services Agency)3
24,000 <1%

Lake Sakakawea 10110101
August 2008 8-Digit Hydrologic Unit Profile
Page 3 of 16
Physical Description – Continued
Land Use/Land Cover Map The map below was developed from U.S. Geologic Survey’s (USGS) ND Gap Analysis
4Program data.

Lake Sakakawea 10110101
August 2008 8-Digit Hydrologic Unit Profile
Page 4 of 16
Physical Description – Continued The sub-basin is part of the Missouri Region. All drainage patterns flow towards and into Lake Sakakawea ending at the Garrison Dam. Once released from the dam it flows south into the Missouri river. The following map shows the relief for the sub-basin.5
Lake Sakakawea 10110101
August 2008 8-Digit Hydrologic Unit Profile
Page 5 of 16
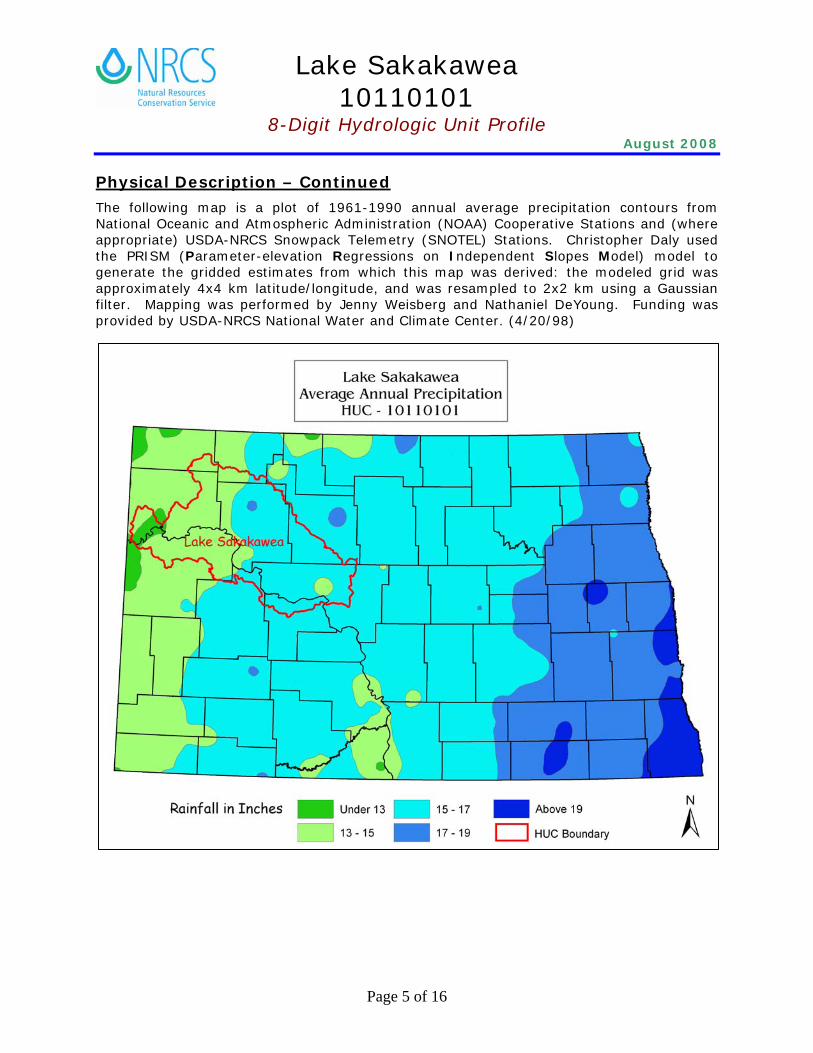
Physical Description – Continued The following map is a plot of 1961-1990 annual average precipitation contours from National Oceanic and Atmospheric Administration (NOAA) Cooperative Stations and (where appropriate) USDA-NRCS Snowpack Telemetry (SNOTEL) Stations. Christopher Daly used the PRISM (Parameter-elevation Regressions on Independent Slopes Model) model to generate the gridded estimates from which this map was derived: the modeled grid was approximately 4x4 km latitude/longitude, and was resampled to 2x2 km using a Gaussian filter. Mapping was performed by Jenny Weisberg and Nathaniel DeYoung. Funding was provided by USDA-NRCS National Water and Climate Center. (4/20/98)

Lake Sakakawea 10110101
August 2008 8-Digit Hydrologic Unit Profile
Page 6 of 16
Physical Description – Continued The North Dakota Department of Health collects water quality data on major water bodies. The following table shows the total miles of streams and acres of lakes/reservoirs within the sub-basin and also the miles and acres with a water quality limitation. A map showing the Total Maximum Daily Load (TMDL) waters within the watershed follows the table. TMDL is the amount of a particular pollutant a stream, lake, estuary, or other waterbody can "handle" without violating State water quality standards.
Units
Lake Sakakawea Sub-basin6
Lake SakakaweaImpaired Water Quality (303d)7
Percent Impaired*
Lake Sakakawea
Total – Major Water Bodies No. 21 3 14.3
Rivers/Streams Miles 4,407.3 87.9 2.8
Water Quality Data *Percent of Total Miles and acres in HUC
Lakes/Reservoirs Acres 391,469 369,236 99.7

Lake Sakakawea 10110101
August 2008 8-Digit Hydrologic Unit Profile
Page 7 of 16
Physical Description – Continued
rations, permitted operations, and livestock
Animal Feeding Facilities – North Dakota Department of Health Permit8
The following two tables show feeding openumbers. The first table lists the number of animal feeding operations and animals as tracked by the North Dakota Department of Health. The second table shows livestock numbers for all cattle, beef cows, dairy cows, swine, and sheep and lambs. These livestock numbers were extrapolated from 2002 Agricultural Census county data to 8-digit HUC’s.
Animal Type Dairy Beef Swine Other Total
Number of Animal Feeding Operations
5 16 1 5 27
Number of Animals 2,259 5,462 640 2,603 10,964
Number of State Permitted Operations 19
Livestock Numbers (rounded to nearest 100)9
Cattle and Calves Beef Cows Dairy Cows Hogs and
Pigs Sheep and
Lambs
North Dakota 1,873,200 982,300 34,500 138,800 114,000
Lake Sakakawea 141,000 81,900 1,100 6,300 5,200
Lake Sakakawea as a percent of North Dakota
7.5% 8.3% 3.2% 4.5% 4.6%

Lake Sakakawea 10110101
August 2008 8-Digit Hydrologic Unit Profile
Page 8 of 16
Physical Description – Continued Common Resource Areas (CRAs) ographical areas where resource concerns, problems, or treatm lar. Landscape conditions, soil, climat man co and atural resource inform were u det the geographic boundaries. CRAs are subsets of Major Land Resource Areas. The following m the C Lake Sakakawea sub-ba Descrip of each are in d.
5 thern rk Brown
are geents are simi e, hu
nsiderations, other n ation sed to ermine
ap10 shows RAs for sin. tions CRAclude
3A.1 - Nor Da G ins: laciated Pla The Northern Dark rown Glaciated Plains are gently ndulating low relief till plains with
many knobs and temporary and seasonal wetlands. The soils are mainly medium textured, well drained, and have a frigid temperature regime. Most of this area is in farms and ranches. Average annual precipitation is 11.8 to 13.7 in. Average annual temperatures is 37.4 to 41 degrees F. Average freeze free period is 90 to 120 days.
53B.1 - Central Dark Brown
Bu
Glaciated Plains: The Central Dark Brown Glaciated Plains are nearly level to rolling with steeper areas along rivers. Land use is a mosaic of cropland and rangeland. Soil textures are dominantly loamy in glacial till, sandy in outwash areas, and clayey in lacustrine areas. Most soils are moderately deep or deep, well drained or moderately well drained, and have a frigid temperature regime.
53B.2 - Central Dark Brown Dry Glaciated Plains: The Central Dark Brown Dry Glaciated Plains are nearly level to steep. This region marks a transition to drier conditions than the glaciated plains to the south. Land use is a mosaic of cropland and rangeland. Soil textures are dominantly loamy in glacial till, sandy in outwash areas, and clayey in lacustrine areas. Most soils are moderately deep or deep, well drained or moderately well drained, and have a frigid temperature regime.
54.1 - Rolling Soft Shale Plain: The Rolling Soft Shale Plain is a semiarid rolling plain with soils formed from shale, siltstone, and sandstone. Native grasses cover areas of steep or broken topography, while cultivated and forage crops dominate other parts of the landscape. Most soils are moderately deep and deep, well drained and moderately well drained, loamy and clayey and have a frigid temperature regime. The area was largely unaffected by glaciation and retains a moderately dissected stream drainage pattern.
55A.1 - Northern Black Glaciated Drift Plain: The Northern Black Glaciated Drift Plain is a nearly level to undulating landscape composed of glacial till and lacustrine sediments. Temporary and seasonal wetlands are numerous throughout the area. Agriculture is limited by a very short growing season and the coldest January temperatures in Northern Plains.
Lake Sakakawea 10110101
August 2008 8-Digit Hydrologic Unit Profile
Page 9 of 16
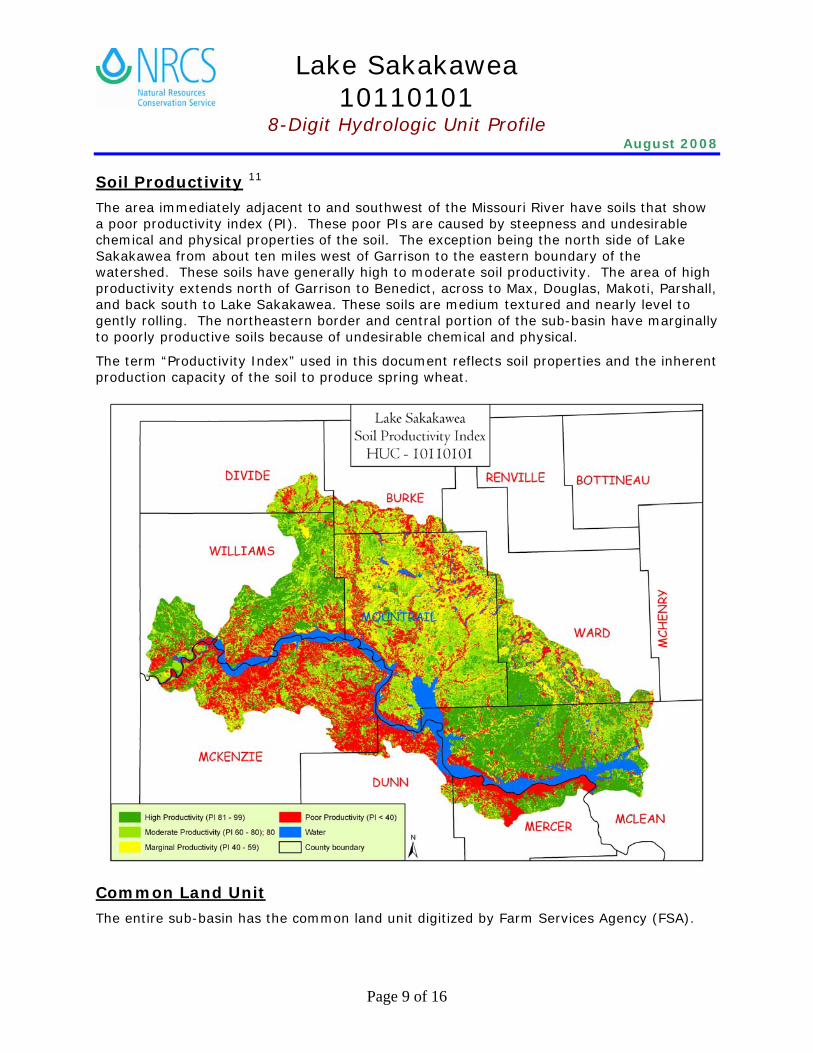
Soil Productivity 11 The area immediately adjacent to and southwest of the Missouri River have soils that show a poor productivity index (PI). These poor PIs are caused by steepness and undesirable chemical and physical properties of the soil. The exception being the north side of Lake Sakakawea from about ten miles west of Garrison to the eastern boundary of the watershed. These soils have generally high to moderate soil productivity. The area of high productivity extends north of Garrison to Benedict, across to Max, Douglas, Makoti, Parshall,
soils are medium textured and nearly level to d central portion of the sub-basin have marginally sirable chemical and physical.
document reflects soil properties and the inherent spring wheat.
and back south to Lake Sakakawea. Thesegently rolling. The northeastern border anto poorly productive soils because of unde
The term “Productivity Index” used in thisproduction capacity of the soil to produce
Common Land Unit The entire sub-basin has the common land unit digitized by Farm Services Agency (FSA).

Lake Sakakawea 10110101
August 2008 8-Digit Hydrologic Unit Profile
Page 10 of 16
Resource Concerns One of the goals of NRCS is to help quantify the types and amounts of resources that may be of concern in an area. This helps identify priority areas for the types and amounts of assistance provided to a particular watershed.
The following table shows the different projects, plans, studies, and assessments conducted within the sub-basin.
Watershed Projects, Plans, Studies and Assessments
NRCS Watershed Projects NRCS Watershed Plans, Studies & Assessments
Name Status Name Status
Shell Lake Plan completed – no East Fork Shell Creek Flood Completed Watershed implementation Plain Management Study
Muskrat Lake Watershed
Completed 2006 McGregor Watershed and Stream Assessment
Completed 2004
NDDH TMDLs Soil Conservation District Assessments and Studies
Number Listed Name Status
Lakes/Reservoirs - 3 Streams – 2 McGregor Dam TMDL Assessment Completed
Powers Lake Watershed Restoration Action Strategy Completed
EPA 319 Watershed Projects
Name Status
Powers Lake Watershed Active
The most common resource concerns are associated with the Soil, Water, Air, Plants, Animals (SWAPA).
Soil
• The HEL cropland acreage experiencing erosion rates above sustainable levels decreased to 377,100 acres in 1997, as compared to 512,100 acres in 1972.
• Controlling erosion not only sustains the long-term productivity of the land, but also affects the amount of soil, pesticides, fertilizer, and other organic material that move into the basin’s waters.
• NRI estimates indicate that there was a 26 percent reduction from 1987 to 1997 in the amount of Highly Erodible Land (HEL) being farmed.

Lake Sakakawea 10110101
August 2008 8-Digit Hydrologic Unit Profile
Page 11 of 16
Lake Sakakawea
194,700
104,800
277,900
316,800
0
50,000
100,000
150,000
200,000
250,000
300,000
350,000
1997 1992 1987 1982
NRI
Acr
es A
bove
Sust
ainab
le L
evel
Resource Concerns - Continued Soil
• Through NRCS programs many farmers and ranchers have applied conservation practices to reduce the effects of erosion. From 1982 to 1997, the average wind erosion rate reduced from 5.7 tons/acre/year to 2.8 tons/acre/year on all cultivated cropland. The average water erosion rate reduced from 2.9 tons/acre/year to 1.8 tons/acre/year on cultivated cropland.
• NRI estimates indicate 253,400 acres of the subbasin agricultural lands had wind erosion rates above a sustainable level in 1997.
• NRI also estimates indicate 105,500 acres of the subbasin agricultural lands had water erosion rates above a sustainable level in 1997.
• Conservation practices that can be used to address these soil erosion issues include grazing management, erosion control, nutrient and ag waste management, and riparian buffers.
• Sandy soils and irrigated soils still require conservation practices to control excessive soil erosion.
• Soil health, especially compaction on silty and clayey soils and organic matter on sandy soils.
• Soil erosion and low organic matter remain resource concerns.
• Windbreak plantings, reduced tillage systems, and improved cropping systems are still needed.
Lake Sakakawea 10110101
August 2008 8-Digit Hydrologic Unit Profile
Page 12 of 16
Resource Concerns - Continued
hell ke Nettie Aquifer System, Little Knife River
Lake, Vang, White Earth River Valley, Wildrose, Wolf Creek, Yellowstone-Missou
• re located in the sub-basin. They are designated to protect the municipal water supply for the cities of Benedict, Powers Lake, Ross, Plaza, New Town, Ray/Tioga, Wildrose, Makoti, and Ryder.
• There are seven Surface Water – Dependent Public Water Systems within the HUC. All seven systems obtain their water from intake systems located on Lake Sakakawea.
Water
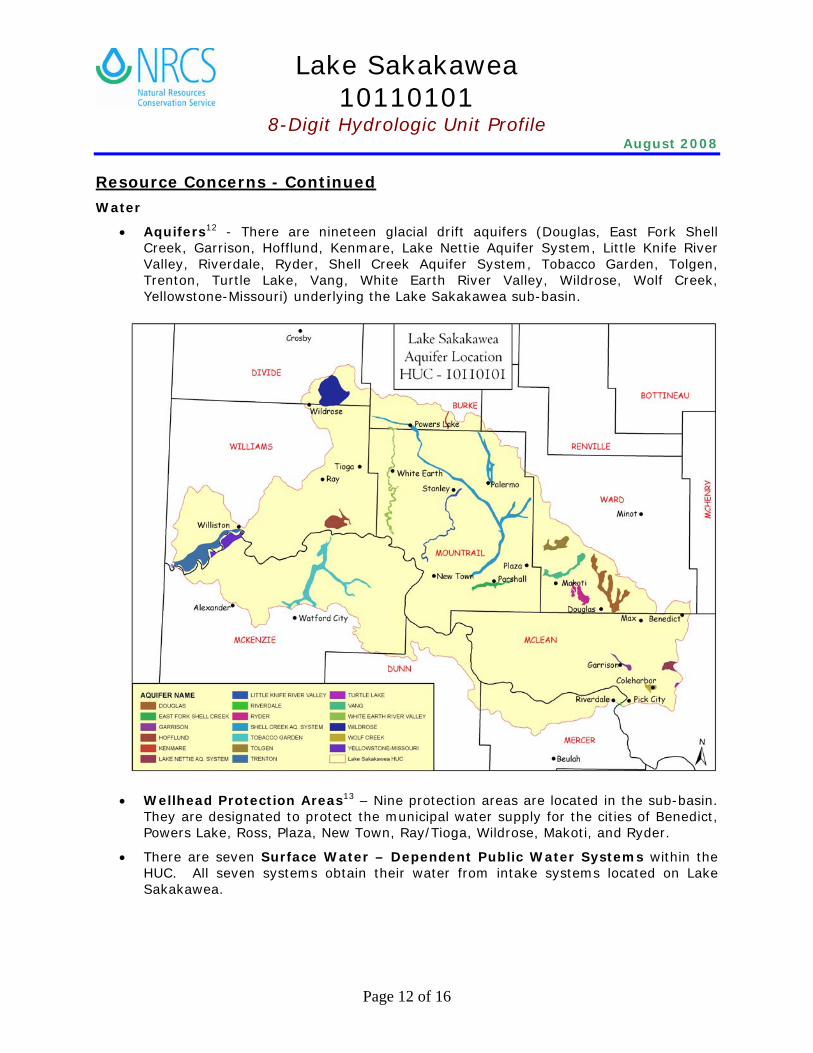
• Aquifers12 - There are nineteen glacial drift aquifers (Douglas, East Fork SCreek, Garrison, Hofflund, Kenmare, LaValley, Riverdale, Ryder, Shell Creek Aquifer System, Tobacco Garden, Tolgen, Trenton, Turtle
ri) underlying the Lake Sakakawea sub-basin.
Wellhead Protection Areas13 – Nine protection areas a

Lake Sakakawea 10110101
August 2008 8-Digit Hydrologic Unit Profile
Page 13 of 16
Resource Concerns - Continued Water - Continued
summary of the major glacial-drift (GPM) yield as described in the county nsidered to have the greatest potential r municipal, industrial, and agricultural
• Two reservoirs on the 303(d) listed in hydrologic unit code 010110101 are listed for dissolved oxygen, two are listed for nutrient/eutrophication biological indicators, and two listed for sedimentation/siltation.
• Conservation practices that can be used to address these water quality issues include grazing management, erosion control, nutrient and Ag waste management, and riparian buffers.
• Lack of adequate riparian buffer width and health are impacting water quality and stream health.
• Spring flooding happening nearly every year effects transportation, infrastructure and crop seeding dates.
• Aquifers–Surficial – The map below is aaquifers and their potential Gallon Per Minuteground water reports. These aquifers are cofor yielding significant quantities of water fopurposes.
Lake Sakakawea 10110101
August 2008 8-Digit Hydrologic Unit Profile
Page 14 of 16
Resource Concerns - Continued Water - Continued
•
Air
• Visibility is reduced during winter months from blowing snow.
• Increased wind speeds due to tree/shelterbelt removal.
• Several coal fired electrical generating plants and one coal gasification plant are located within or within near proximity of the sub basin.
Plants
• Major concerns are with controlling invasive weeds and maintaining good rangeland and hayland condition.
• Direct seeding of corn and soybeans has been successful in some locations.
• Conventional tillage systems are still utilized, especially with canola, corn, dry beans, and sun flowers.
• Noxious weeds and poor range condition are reducing productivity for livestock and wildlife.
• Season long grazing on or near water courses are a concern.
• The private, non-industrial forestland is associated with small woodlots or rural home sites and forested riparian areas which are not actively managed for timber production.
Animals
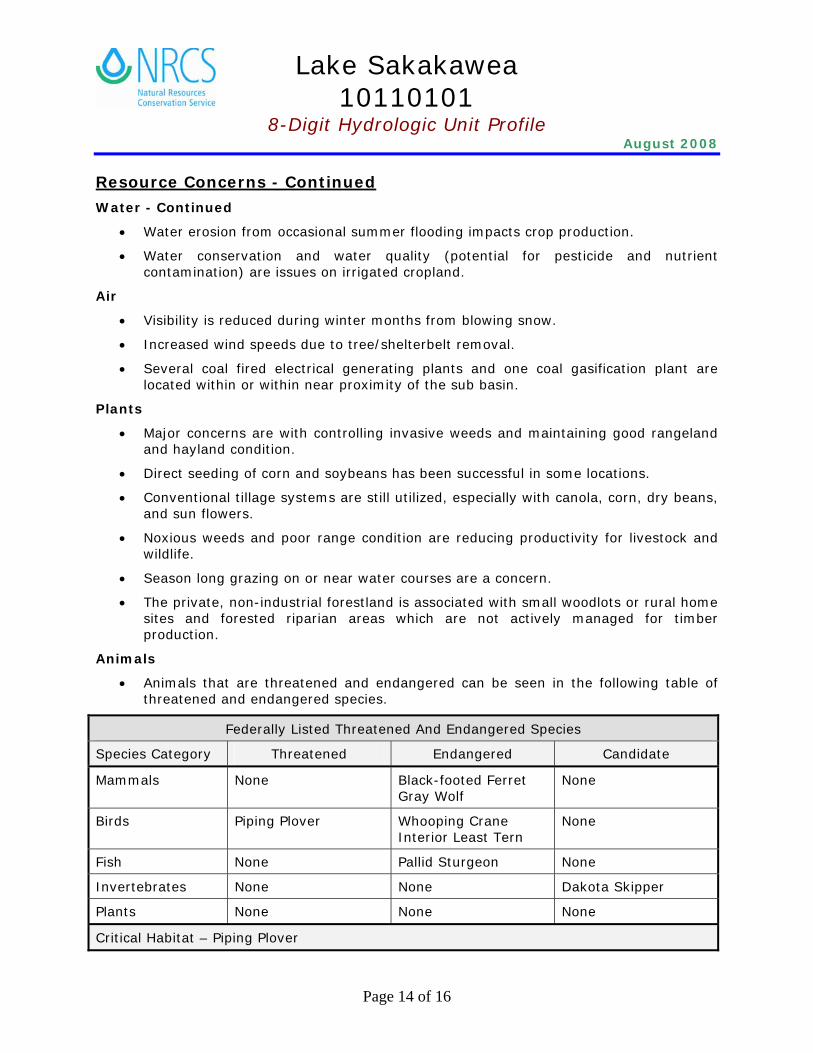
• Animals that are threatened and endangered can be seen in the following table of threatened and endangered species.
• Water erosion from occasional summer flooding impacts crop production.
Water conservation and water quality (potential for pesticide and nutrient contamination) are issues on irrigated cropland.
Federally Listed Threatened And Endangered Species
Species Category Threatened Endangered Candidate
Mammals None Black-footed Ferret None Gray Wolf
Birds Piping Plover Whooping Crane Interior Least Tern
None
Fish None Pallid Sturgeon None
Inv eert brates None None Dakota Skipper
Plants None None None
Critical Habitat – Piping Plover
Lake Sakakawea 10110101
August 2008 8-Digit Hydrologic Unit Profile
Page 15 of 16
Age of Farmers
0100200300400500600700800
Under25
25 to34
35 to44
45 to54
55 to59
60 to64
65 to69
70andover
Age
Num
ber
Census and Social Data14 Number of Farms: 2
Size of Farms
1,000
1,200
0
200
400
600
800
1 to 9 10 to49
50 to179
180 to499
500 to999
1,000 +
Acres
Num
ber
,396
Numb
•
•
• Part-Time Operators: 27%
Limited Resource and Beginning Farmer
Approximately 8.0 percent of the operators are minority producers. Limited Resource Farmers are also estimated at 8.8 percent. Although rather low percentages, these facts point to the potential need for special technical assistance targeted to reach people who (1) may lack experience with government farm programs, (2) have good stewardship intentions but lack management skills, and (3) lack the time to visit an NRCS field office and seek assistance.
er of Operators:
Average Age: 54
Full-Time Operators: 73%
Al ded “as is.” There are no warranties, express or implied, including warranty of fitness l data is provi for a particular purpose, accompanying this document. Use for general planning purposes only.
Lake Sakakawea 10110101
August 2008 8-Digit Hydrologic Unit Profile
Page 16 of 16
References
. 2 U A3 U A4 US I5 USDA-NR Relief Data GIS data layer, 2002.
Department of Health, Environmental Health Section, Water Quality Division, National
7 ND lity Division, List of Dakota, 2006.
8 Ne
9 2002 Volume 1, Geographic Series Part 34, U.S. Department of Agriculture, National Agricultural Statistics
c u10 USDA- anning Staff, Common Resource Area GIS data layer,
11 U12 ND D
ter Monitoring Program data, 1997. 13 N D
Wa tion Program data, 2003. 14 2 2 Volume 1, Geographic
Area Series
cou
1 USDA-NRCS, NRI dataSD -Farm Services Agency, Common Land Unit GIS data layer, 2005. SD -Farm Services Agency, Common Land Unit GIS data layer, 2005. D -US Geologic Services, ND GAP analysis data, 2005.
CS, Natural Resources Planning Staff, 30 meter 6 ND
Hydrography GIS layers, June 2006. Department of Health, Environmental Health Section, Water Qua
Section 303(d) TMDL Waters for the Red River Basin in NorthD Department of Health, Environmental Health Section, Water Quality Division, Animal Fe ding Operations Program data, 2006.
Census of Agriculture, North Dakota, State and County DataAreaService, June 2004. (County data was prorated to HUC by the percent of a HUC in a o nty.)
NRCS, Natural Resources Pl2004. SDA-NRCS, Natural Resources Planning Staff, Soils Productivity GIS data layer, 2006.
epartment of Health, Environmental Health Section, Water Quality Division, Ambient Ground WaD epartment of Health, Environmental Health Section, Water Quality Division, Source
ter Protec00 Census of Agriculture, North Dakota, State and County Data
Part 34, U.S. Department of Agriculture, National Agricultural Statistics Service, June 2004. (County data was prorated to HUC by the percent of a HUC in a
nty.)