Lake Pepin Site Specific Eutrophication Criteria
37
Lake Pepin Site Specific Eutrophication Criteria March 2011 wq-s6-10
Transcript of Lake Pepin Site Specific Eutrophication Criteria

Lake Pepin Site Specific Eutrophication Criteria
March 2011 wq-s6-10

2

Lake Pepin Site Specific Eutrophication Criteria
Prepared by: Steve Heiskary and Dennis Wasley, Environmental Analysis and Outcomes Division, MPCA Internal Review: Mark Tomasek and Howard Markus, Environmental Analysis and Outcomes Division Norm Senjem, Regional Division, This document incorporates minor revisions to the LTI UMR-LP model used to predict future conditions in Lake Pepin under varying reduction scenarios (as reported in Heiskary and Wasley 2010). There was no change to the site-specific criteria because of the model revision. The previous site-specific standard document was an update to a previously published report: Wasley, D and S. Heiskary. 2009. Site Specific Eutrophication Criteria for Lake Pepin. pp. 186-211 in Proceedings of TMDL 2009 Conference, Water Environment Federation specialty conference, Minneapolis, MN August 9-12, 2009 Background information and draft criteria, as noted in Wasley and Heiskary (2009) and previous draft reports, were shared with the Lake Pepin TMDL Science Advisory Panel (SAP) in meetings during 2008 through 2009. The 2010 revision, which included final draft eutrophication criteria for Lake Pepin, was presented to the Pepin SAP in spring 2010. SAP membership includes technical staff and representatives from Minnesota Department of Natural Resources, Wisconsin Department of Natural Resources, Metropolitan Council Environmental Services, and University of Minnesota (U of M). The U of M Water Resources Center coordinates the activities of the SAP. The purpose of the SAP is to provide technical review for the Lake Pepin TMDL. The SAP did not provide a comprehensive written review of the revised document; however, comments from individual SAP members were considered in drafting the site-specific standards.
3

Lake Pepin Site Specific Eutrophication Criteria Prepared by: Steve Heiskary and Dennis Wasley Environmental Analysis and Outcomes Division
Executive Summary Lake Pepin was assessed for “nutrient impairment” as a part of the 2002 303(d) assessment. Since numeric lake eutrophication criteria were not available at that time, ecoregion-based numeric translators were used to interpret the narrative standards that referred to excess algal growth and associated impairment. Lake Pepin was assessed based on the following data collected between June through September from 1991-2000: total phosphorus (TP) =198 (±4) µg/L (n=160), chlorophyll-a (Chl-a) = 25 (±1) µg/L (n=158), and Secchi= 1.0 (±0.3) m (n= 240). Since there were no specific translators for the ecoregion where Lake Pepin was located (Driftless Area), translators from the adjacent two ecoregions that comprise much of Pepin’s watershed were used in the assessment. Based on the assessment Lake Pepin’s TP was well above the North Central Hardwoods Forest (CHF) and Western Corn Belt Plains (WCP) thresholds, while chlorophyll-a and Secchi exceeded CHF thresholds. As a result, Pepin was placed on Minnesota’s 2002 303(d) list. Though Lake Pepin is a natural lake, its characteristics are reservoir-like and as such, it is presumed to require site-specific criteria, as noted in guidance. A central task of the Lake Pepin Total Maximum Daily Load (TMDL) is development of site-specific criteria for chlorophyll a (Chl-a), transparency and phosphorus concentration that provides adequate protection of aquatic recreational use. This task has evolved over time as more knowledge has been gained on Lake Pepin and its interrelationship with upstream navigation pools and the major tributaries that drive the overall system. Recognizing the complexities and linkages of Pepin, upstream navigational pools and major tributaries the Lake Pepin TMDL Science Advisory Panel (SAP) recommended that MPCA develop eutrophication standards for Lake Pepin and Pools1-8. The SAP further acknowledged that these waterbodies differ sufficiently from typical lakes and rivers to warrant site specific standards. They recommended that Lake Pepin eutrophication standards should be integrated into the statewide river eutrophication criteria development. A detailed analysis of river and navigational pool data was conducted in support of this request (Heiskary and Wasley 2010b) and that effort complements and builds on analysis presented in this current report, which will focus on Lake Pepin. Likewise, detailed analysis, conducted as a part of the South Metro Mississippi turbidity TMDL (which includes upper Lake Pepin), demonstrated that suspended sediment is a primary limiter of Secchi transparency in Pepin and that TMDL was selected as the primary basis for addressing Secchi transparency. The recently promulgated lake eutrophication standards allow for the development of site specific criteria for reservoirs as noted in Minnesota Rules Chapter 7050 (2008) (https://www.revisor.leg.state.mn.us/rules/?id=7050.0222 ). Minnesota’s “Lake Nutrient TMDL Protocols and Submittal Requirements” (MPCA 2007) provides a framework for establishing a site-specific water quality standard and pertinent information that should be considered (e.g. pp 79-83; http://www.pca.state.mn.us/publications/wq-iw1-10.pdf ). This current report was prepared in support of the development of site-specific eutrophication criteria for Lake Pepin. The report includes:
• Basic background information on Lake Pepin and previous efforts to establish goals for the lake;
• An up-to-date analysis of data for the lake, which focuses on the 22 years of data (1985-2006) used in the development of the Upper Mississippi River-Lake Pepin (UMR-LP) model and recent data that has been collected by the Long Term Resource Monitoring Program (LTRMP) for the period 2006-2009;
4

• Analysis of data from recent low-average flow years to further describe relationships between the Mississippi River and upper and lower segments of Lake Pepin;
• Review of model predictions for various years and reduction scenarios that contribute to criteria development; and
• Summary of proposed site specific criteria for Lake Pepin.
This report and two reports that describe criteria setting for the navigation pools and major river inflows to the Mississippi river above Lake Pepin (Heiskary and Wasley 2010) and statewide river eutrophication criteria development (Heiskary et al. 2010) provide the technical basis for Lake Pepin’s site specific criteria. Based on all three reports TP and Chl-a criteria of 100 µg/L and 28 µg/L, respectively, are proposed for Lake Pepin. These criteria provide protection of aquatic recreational uses for Lake Pepin and the downstream pools and should be applicable over the range of flows for which the criteria were developed. The Lake Pepin criteria need to be considered in a Mississippi River context in the following manner: it is through phosphorus and chlorophyll reductions upstream of Lake Pepin, in specific watersheds (Lower Minnesota River, Crow River, Sauk, etc) that the Lake Pepin criteria are most likely to be achieved. The proposed Lake Pepin criteria should not be used in isolation to imply that P reductions anywhere upstream of the lake will have the desired impact. The main biological activity affecting Lake Pepin trophic status is not taking place in the lake, but upstream of it. In particular, reductions upstream of the MCES’s WWTPs will be needed to achieve the desired standards. The Lake Pepin criteria are not stand-alone goals to be pursued in isolation. Rather, they belong to a set of goals (criteria) for the Mississippi River system, which, if pursued systematically in unison, will achieve the desired results.
5

Background Lake Pepin is a natural lake on the Mississippi River. The lake formed about 10,000 years ago behind an alluvial fan of the Chippewa River, which dammed the Mississippi after outflow from Glacial Lake Agassiz was diverted northward and ceased to scour sediments deposited by the Mississippi’s tributaries (Wright et al. 1998). It has a surface area of about 40 square miles and a mean depth of 18 feet (Table 1). Pepin is characterized by two somewhat distinct segments (Figure 1). The upper (inflow) segment accounts for about 40% of the lake by area (~10,700 acres) but only about 28% by volume because it is very shallow (mean depth ~12 feet) and is more “river-like” in nature. The lower segment is somewhat deeper (mean depth ~22 feet) and accounts for about 72% of the lake by volume and is more “lake-like” as compared to the upper segment. Lake Pepin’s watershed is about 48,634 square miles and includes the Upper Mississippi, St. Croix and Minnesota Rivers and drains about 48 percent of Minnesota and a portion of Wisconsin (Figure 3a). This results in a watershed-to-lake ratio of about 1,225:1. This large watershed area promotes short water residence times that range from six to 47 days, with an average of 16 days. Because of its shallowness, residence time in the upper segment is very short, often less than 2-3 days, which limits its ability to process (sediment) phosphorus from the river. The ecoregion reference lakes provide a basis for placing Lake Pepin’s morphometric and watershed characteristics in perspective (Table 1). With a surface area of almost 40 mi2 it is over 40 times larger than the typical lake in the CHF and WCP ecoregions and is over twice as large as the largest reference lake (16 mi2). Lake Pepin’s mean and maximum depth are similar to the typical range for the CHF lakes but because of its large surface area, its volume is much greater. The most significant factor that differentiates it from the reference lakes is its huge watershed and subsequently large watershed-to-lake ratio (Table 1), which is much larger than the mean and maximum watershed-to-lake ratios for all reference lakes (8:1 and 56:1 respectively; Heiskary and Wilson 2008). Pepin’s large watershed: lake ratio results in extremely short water residence times (measured in days) as compared to the reference lakes (and other glacial lakes in Minnesota), which are measured in years. Extremely large watershed: lake ratios and short water residence time result in high water and nutrient loading rates, rapid flushing, and reduced sedimentation – all of which influence algal growth and the processing of phosphorus. The relatively large surface area, fetch, and moderate depth of Pepin (Table 1) often prevent stratification throughout the summer. High flows in May and June effectively “flush out” any cool water in the hypolimnion that could allow for stronger stratification. For example, a series of dissolved oxygen and temperature profiles in summers 1990 and 1991 indicated no distinct thermal stratification and minimal difference in surface and bottom water temperature on all monitoring dates (Heiskary and Vavricka 1993). The net result of the limited to ephemeral stratification of Pepin is a deeper mixed layer, which suppresses algal growth. Thus Pepin mixes like a shallow lake yet has the depth of what we consider a deep lake. This is another reason that Pepin requires a site specific standard. Lake Pepin’s watershed drains from several ecoregions (Figure 2b). Water quantity and quality vary among these regions (Table 2). This indicates that a single ecoregion cannot be used to characterize Lake Pepin or its watershed, since the water it receives is essentially a “blending” of water from these very diverse watersheds.
6

Figure 1. Lake Pepin map. Upper and lower segments and LTRMP sites noted.
#
#
#
#
Lake PepinM781.2O
M775.6Q
M771.2P
M766.0I
Figure 2. Lake Pepin watershed: percent composition by a) basin and b) ecoregion. a) b)
Northern Lakes and Forests
North-Central Hardwood Forests
Western Corn Belt Plains
Northern Glaciated
Plains
Driftless Area
Northern Minnesota Wetlands
Minnesota Pollution Control Agency
Ecoregions of the Lake Pepin Watershed
Ecological Regions
Minnesota River Basin
Upper Mississippi River Basin
St. Croix River Basin
Cannon River Basin
MINNESOTA
WISCONSIN
IOWA
NORTH DAKOTA
SOUTH DAKOTA
2.0% Driftless Area
32.0% North Central Hardwood Forests
13.4% Northern Glaciated Plains
30.8% Northern Lakes and Forests
<0.1% Northern Minnesota Wetlands
21.7% Western Corn Belt Plains
Lake Pepin
¯Lake Pepin
Lake Pepin BasinsBASIN
Cannon River Basin
Minnesota River Basin
St. Croix River Basin
Upper Mississippi River Basin
HUC 07040001Major RiversMetro Area
Feature Area ( Kilometers )Lake Pepin Watershed 122,575 Minnesota 218,480Lake Pepin Watershed 105,368with in Minnesota
2
Lake Pepin Watershed
Minnesota Pollution Controal Agency
7

Table 1. Lake Pepin morphometric and watershed characteristics as compared to interquartile range r CHF (n=38) & WCP (n=12) ecoregion reference lakes.
aramete
fo P r Pepin CHF (25th-75th) WCP (25th-75th)S 2urface area (mi ) 39.7 0.62 – 1.38 0.43 – 0.59 Mean depth (ft) 17.7 21 - 26 8 – 11
aximum depth (ft) 56 43 - 73 10 – 27 ixing depth (ft) ~8-9 aximum width (mi) 1-2 -- -- aximum fetch (mi) ~11.8 -- -- ngth (mi) 20.8 -- --
olume (acre-ft) 448,340 49,027 – 142,090 7,547 – 22,152 atershed Area (mi
MMMMLeVW 2) 48,634 4 - 12 2 – 3
atershed: lake surface area 1,225:1 6 - 9 4 – 7 ean Hydraulic Retention Time 0.04 year
(16 days) 9.3 years (mean)
4.8 years (mean)
(Heiskary & Vavricka 1993)
(Heiskary & Wilson 2008)
WM
Table 2. Lake Pepin watershed ecoregion composition. Estimated areal composition, flow ontribution, and 25th percentile stream TP based on typical, minimally-impacted streams for each coregion (streams without major upstream point sources; McCollor and Heiskary, 1993). Estimated modern-day background” TP for Lake Pepin based on simplified ecoregion area and flow-based stimates.
Region Area % Flow % TP µg/L
area-based
flow-based
ce“e
NLF 31% 42% 30 9 13 CHF 32% 38% 70 WCP 22% 16% 210
22 27 46 34
NGP 13% 4% 160 21 6 Mean 99 79
There have been several efforts to develop site specific goals for Lake Pepin (e.g. Heiskary and Walker 1995) as a part of a long-term effort to address eutrophication concerns in Lake Pepin and to provide targets for modeling. Central to these efforts was characterizing the relative role of nutrients, water residence time, and elevated turbidity upon chlorophyll-a production and transparency. A chlorophyll-a summer mean goal of 30 μg/L was proposed in the mid-1990s by the Phosphorus Cooperators Group as part of an extensive interagency collaborative effort to address eutrophication concerns in Lake Pepin (Heiskary 1993 and Metropolitan Council 2002). The summer-mean goal was designed to minimize the frequency of “nuisance algal conditions (>40 μg/L)” and “severe nuisance algal conditions (>60 μg/L)” in Lake Pepin. Because water residence time partially controls the production of algal biomass and composition in Lake Pepin, it was also important to associate the chlorophyll-a goal with a particular flow range (Heiskary and Walker 1995). A summer-mean flow of 4,578 cfs corresponding to the 120-day, 50 year low flow was recommended as the lower flow limit and a flow of 20,000 cfs as the upper flow limit for applying the goal. A summer-mean flow of 20,000 cfs provides a residence time of about 11 days that is within the 8-14 days, which is often cited as the minimum needed to allow for full algal response to nutrients in lakes. At shorter water residence times, phytoplankton is removed from the system before a standing crop reaches the level determined by the concentration of the limiting nutrient (Pridmore and McBride 1984). Based on flow records compiled since 1928, flows below 4,578 cfs have less than a two percent frequency of occurrence. A compilation of the various work conducted by the Phosphorus Cooperators Group may be found in Metropolitan Council (2002).
8

Empirical Data Analysis Flow and Water Residence Time
e watershed to surface are able 1) wat is high relting in very short water residence time (T e 3a). Based m
ow duration curve can be cr t describes the frequency of specific ow ummary of specific intervals and the rcent of time these are
a from the long-term r; 1928-2007) re and the recent (30-year; rd is presented in Table 4a uration per )
n be combined to desc percent n is more “river-like” ased on Figur is “lake-like” t 25% of the su of
% of the s ith the in-b mmers bes as “reservoir-like.” Summer 2006, a relativel summer, co o ~75th % ration
terval (implies 75% of summers have a nce lo g-term record and th percentile (~1-in-ten-year low flo d o cent record.
4-day residence time. In this instance, Lake Pepin is a lake regardless of the period of record that is considered; however d is nt for de g th e of f ver which the lake exhibits “lake or reservoir-like” characteristics (Figure d t tha s one-in-ten year low flow. Both factor mpor develop the TM . For th ke Pepin nutrient-impairment TMDL there a id arg ts for usi her p d of rec xample, the recent record ign e “histo the lo rm reco d pote ly embodies a smaller range in flows. How follow ggests the recent record m be a more appropriate one for developing the TMDL:
1. The recent 30-year record is routinely used by climatologists to represent “current average.”
rgBecause of its la a ratio (T er loading la he tive to t
volume of the lake resu w; Figur on long-terflow records a fl eated tha flintervals (Figure 3b). A s flow pe flows exceeded based on dat (80-yea cord1978-2007) reco . Flow d interval (inverse of
of tim Pepicent exceedance
and residence time ca ribe the e Lakethan “lake-like” (Figure 4). B e 4 Pepin abou mmersrecord and “river-like” about 40 ummers, w etween su t described
y low flow rresponds t flow duin shorter reside
w summer) basetime) based on the
n the ren
~90 Water residence time is a primary basis for differentiating rivers from reservoirs (MPCA 2007). This is generally assessed based on the one-in-ten-year low flow summer of record; however neither MPCA guidance nor rule language specifies the actual length of record that should be used. In most instances, the entire period of record is used to determine if the water body of concern has the required 1
the perio of record importa finin e ranghe flow
lows ot define 4) an
of these s are i tant in ing DL e Lare val umen ng eit erio ord. For e
ores th ry” in ng-te rd an ntialever the ing su that ay
2. There is a distinct indication that there has been a step change in river flows in recent decades both in Minnesota and elsewhere in the U.S. (McCabe and Wolock, 2002). For the Lake Pepin TMDL the most pronounced change is increased spring/early summer (May-July) flows in the Minnesota River, which have increased the relative flow contribution of the Minnesota River during low flow summers (Table 4b).
3. Severe drought years that were common in the 1930’s occurred only once in the recent 30-year period (i.e. 1988).
4. The recent record is more sensitive to climate shifts that may occur (as compared to the long-term record).
5. NPDES permits for nutrients increasingly focus on the recent record. Table 3. Summer-mean flow statistics based on long-term (80-year) and recent (30-year) record (based on USGS June-Sept. readings at Prescott). Most recent year in that flow range noted.
Percent exceedance 95th
90th
75th
50th
25th
10th
Long (1928-2007)
5,296 7,610 10,600 17,595 24,700 31,109
Example year 1932 1961 2006 1967 1997 1984 Recent (1978-2007) 9,330 10,145 16,411 22,358 25,886 31,374Example year 1989 2006 1982 1994 1995 1984
9
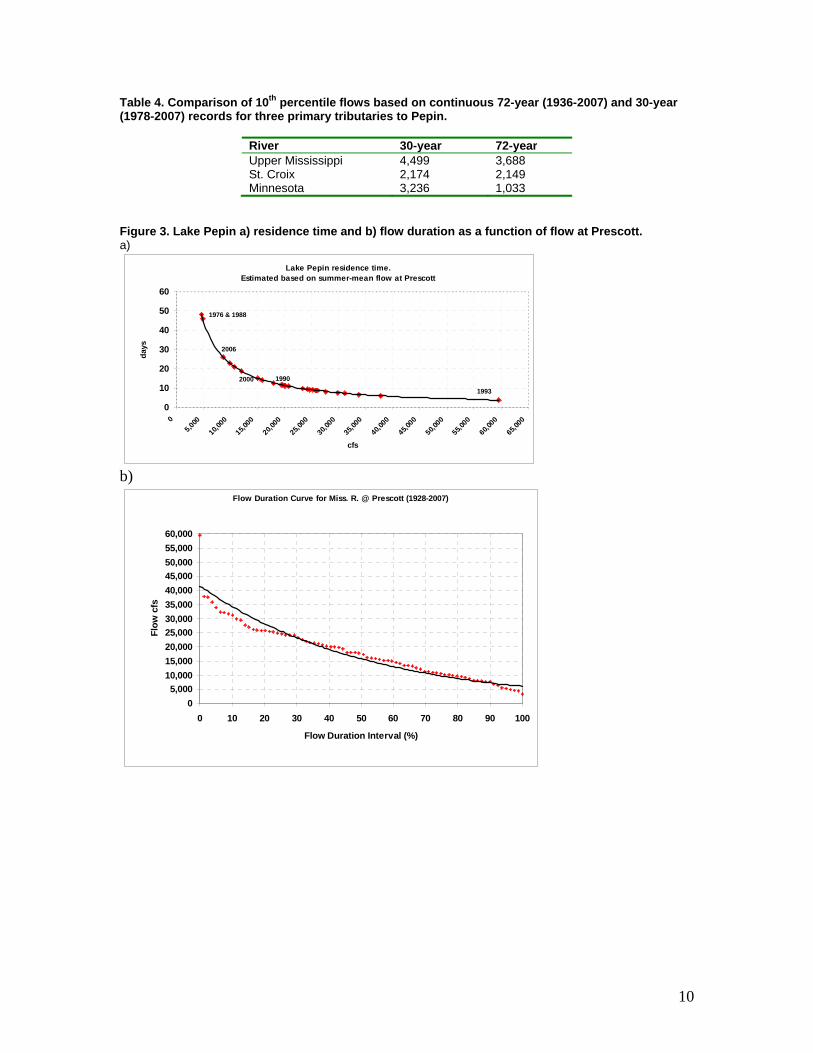
Table 4. Comparison of 10th percentile 978-2007) records for three primary trib
flows based on continuous 72-year (1936-2007) and 30-year utaries to Pepin. (1
River 30-year 72-yearUpper Mississippi 4,499 3,688 St. Croix 2,174 2,149 Minnesota 3,236 1,033
Figure 3. Lake Pepin a) residence time and b) flow duration as a function of flow at Prescott. a)
b)
Lake Pepin residence time. Estimated based on summer-mean flow at Prescott
30
40
50
60
days
0
10
05,0
20
00
10,000
15,000
20,000
25,00
0
30,00
0
35,00
0
40,00
0
45,000
50,000
55,000
60,000
65,00
0
cfs
1976 & 1988
2006
1990
1993
2000
Flow Duration Curve for Miss. R. @ Prescott (1928-2007)
50,00055,00060,000
45,000
15,00020,00025,00030,00035,00040,000
Flow
cfs
5,00010,000
00 10 20 30 40 50 60 70 80 90 100
Flow Duration Interval (%)
10

Figure 4. Lake Pepin water residence time as a function of flow duration frequency based on total record (1928-2007). Recent 30-year record noted.
Flow Duration Frequency vs. Pepin Reside
0
10
20
30
40
60
70
80
0 10 20 30 40 50 60 70 80 90 100
Flow Duration Frequency (%)
Res
. tim
nce Time
Total phosphorus, chlorophyll-a and Secchi: trends and interrelati hips
Modern-day water quality data sets for Lake Pepin date back to the mid 1970s based on data collected by Metropolitan Council Environmental Services (MCES), Long Term Resource Monitoring Program (LTRMP is collected by MDNR at Lake City) and MPCA. Since the mid 1990s LTRMP has been the principal source of data for the lake. These three sources of data, as collected from1985-2005, were used in the development and testing of the UMR-LP model and are used here for purposes of describing long-term trends in TP, chl-a, and Secchi, interrelationships of these variables, and relationship to flow. In addition, recent 2006-2009 LTRMP data were used to extend this record. For this portion of our empirical analysis we will focus on temporal and flow-related trends and variability in TP, soluble reactive phosphorus (SRP), chlorophyll-a, turbidity and Secchi based on whole lake summer-mean data.
The summers of 1985-2009 included among the wettest summer of record (1993) and driest summer of record (1988; Figures 5a, b). The overall summer-mean flow for this 25-year period was 21,749 cfs and there is a weak trend toward declining flows for this timeframe (Figure 5a). The transition from river-like to reservoir-like conditions is near 20,000 cfs, which has a recurrence frequency of 40% based on the recent 30-year record (Figure 5b). There are several recent summers at or below 20,000 cfs: 1998, 2000, and 2006-2009 (Figure 5a) that will be the focus of more d iled analysis later in this
port.
ons
etare
50se
day
1928 1976
FlowTarget
1988
Lake-likeRiver-like
2006
~Reservoir-like~
11

Figure 5. Summer-mean flow at Prescott for 1985-2009. Flow duration frequency based on 30-year record (1978-2007). Summer-mean flow <~20,000 cfs yields Tw of 10-11 days or more.
a.
b.
6a). TP ranged from 0.150-0.250 mg/L in the mid 1980s-early 1990’s; whereas easures (2003-2009, excluding 2007) are about 0.150-0.160 mg/L in most summers. This is
ecause of recent temporal declines (Figure 6a) and previous analysis have indicated no lationship between TP and flow.
Summer-mean TP averaged 0.178 mg/L over this 25-year period and a subtle decline in TP is evident
recent years (Figure inrecent mmost likely a reflection of TP reductions at the MCES Metro WWTF and a few other facilities that have reduced TP loading in recent years. In addition declines in TSS and TP have been observed in the Minnesota River in this past decade. Improvement in land use practices and/or less precipitation may be driving this trend. TP exhibits a very slight relationship with flow (Figure 6b); however this is confounded to some degree bre
12
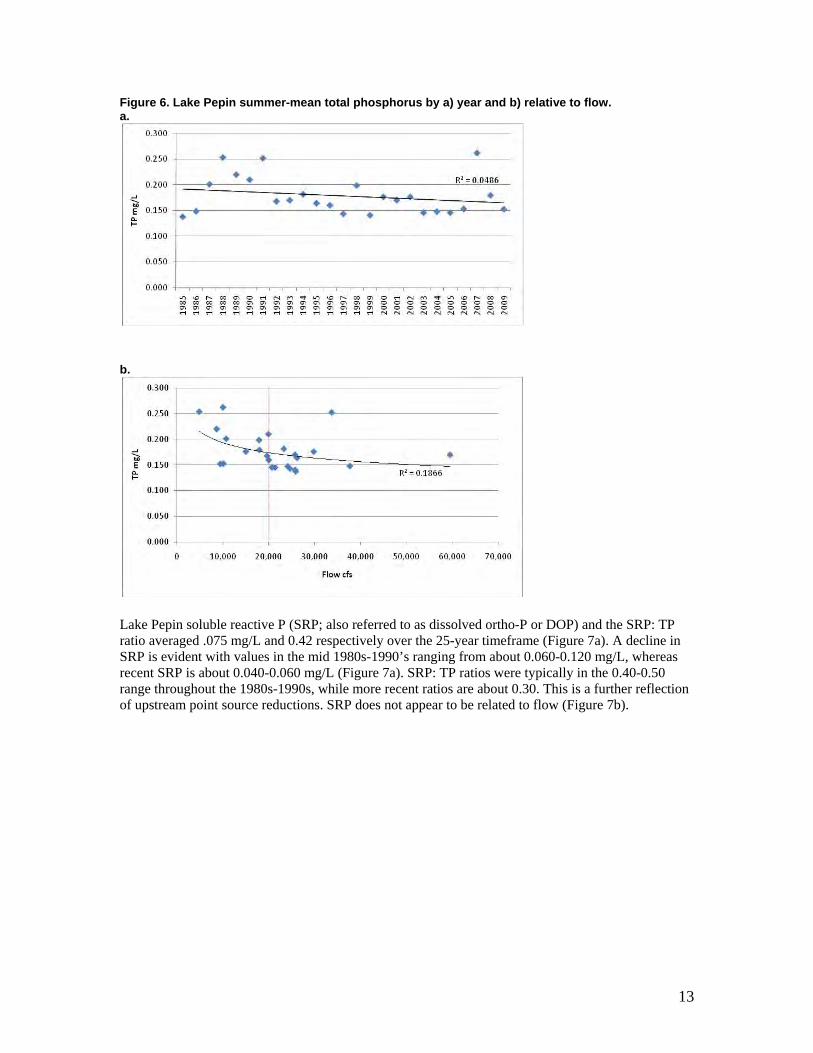
Figure 6. Lake Pepin summer-mean total phosphorus by a) year and b) relative to flow. a.
b.
Lake Pepin soluble reactive P (SRP; also referred to as dissolved ortho-P or DOP) and the SRP: TP ratio averaged .075 mg/L and 0.42 respectively over the 25-year timeframe (Figure 7a). A decline in SRP is evident with values in the mid 1980s-1990’s ranging from about 0.060-0.120 mg/L, whereas recent SRP is about 0.040-0.060 mg/L (Figure 7a). SRP: TP ratios were typically in the 0.40-0.50 range throughout the 1980s-1990s, while more recent ratios are about 0.30. This is a further reflection of upstream point source reductions. SRP does not appear to be related to flow (Figure 7b).
13

Figure 7. Lake Pepin summer-mean soluble reactive phosphorus (SRP) by a) year and b) flow.
n
organic) omponents (VSS), such as algae and incompletely dissolved plant matter (e.g. grass, leaves, etc.) erve to limit light and has a direct influence on Secchi transparency and algal productivity. Megard 000 and 2006) has addressed the role of TSS and dissolved organic carbon (DOC) as it limits light
nd algal productivity in the Mississippi River and Lake Pepin.
urbidity, a measure of light scattering from these constituents, is highly correlated with TSS and is a ommonly used measure for estimating the amount of suspended matter and DOC in water. Turbidity veraged 15.0 NTU, ranged from a low of 5.0 NTU (1988, low flow) to 25.0 NTU (1993, high flow) nd did not exhibit a trend over time for this period of record (Figure 9a). Turbidity in Lake Pepin is ositively correlated with flow (Figure 9b), which is the inverse of the Chl-a and flow relationship
TU. On a lake-wide basis turbidity remained <25 NTU (statewide standard) over this period of record. Flow (via effect of residence time and turbulence) and turbidity (via light limitation) have a direct impact on algal productivity in Lake Pepin and its tributaries and this impact is most pronounced at flows above ~20,000-25,000 cfs (Figure 8b).
a.
b.
Long-term mean chlorophyll-a (Chl-a) is 24 µg/L, with no trend over time (Figure 8a). Summer-meaChl-a ranges from about 10 ug/L in 1993 and 1999 to about 45 ug/L in 1988, 2005 and 2006. Chl-a ishighly related to flow (Figure 8b). At flows <20,000-25,000 cfs Chl-a is generally >20 ug/L; whereasat flows above this range Chl-a remains <20 ug/L. With the exception of 2005 summer-mean Chl-adid not exceed 30 ug/L when flow was >20,000 cfs (Figure 8b).
uspended solids (TSS), comprised of inorganic matter (~soil particles) and various volatile (Scs(2a
Tcaap(Figure 8b). At flows <20,000 cfs turbidity remains at or below 15.0 N
14
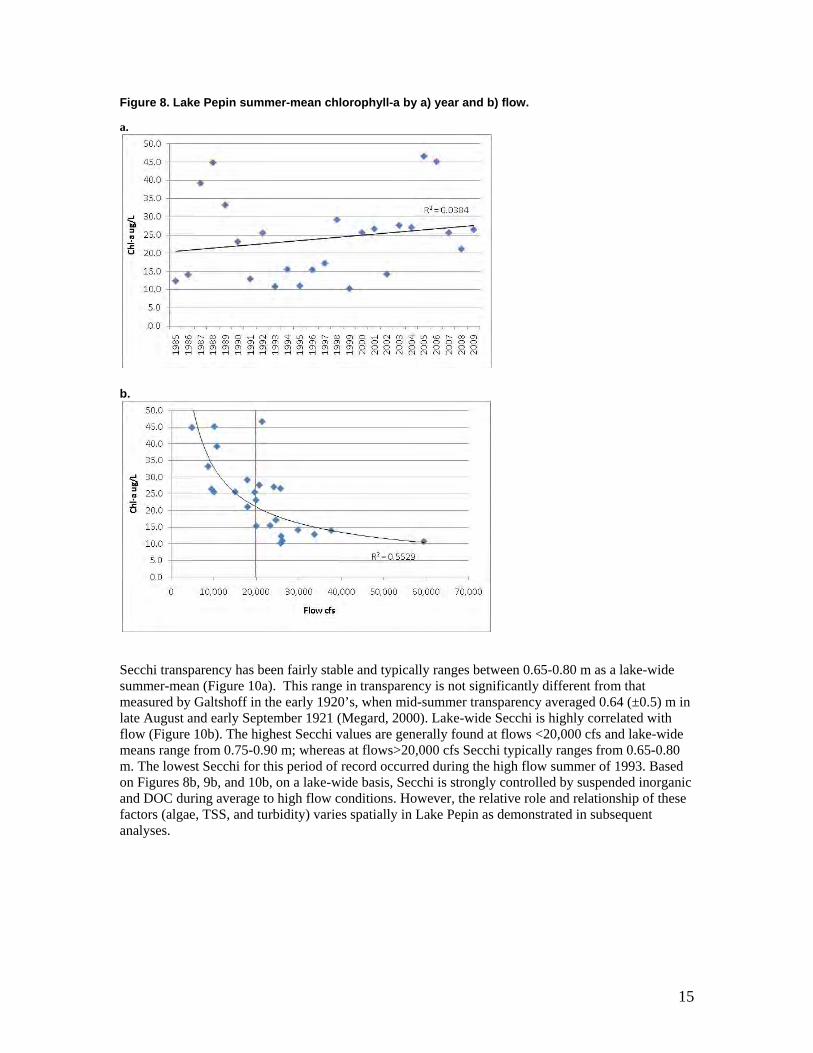
Figure 8. Lake Pepin summer-mean chlorophyll-a by a) year and b) flow.
a.
b.
icantly different from that
ly controlled by suspended inorganic
Secchi transparency has been fairly stable and typically ranges between 0.65-0.80 m as a lake-wide summer-mean (Figure 10a). This range in transparency is not signifmeasured by Galtshoff in the early 1920’s, when mid-summer transparency averaged 0.64 (±0.5) m in late August and early September 1921 (Megard, 2000). Lake-wide Secchi is highly correlated with flow (Figure 10b). The highest Secchi values are generally found at flows <20,000 cfs and lake-widemeans range from 0.75-0.90 m; whereas at flows>20,000 cfs Secchi typically ranges from 0.65-0.80 m. The lowest Secchi for this period of record occurred during the high flow summer of 1993. Based on Figures 8b, 9b, and 10b, on a lake-wide basis, Secchi is strongand DOC during average to high flow conditions. However, the relative role and relationship of these factors (algae, TSS, and turbidity) varies spatially in Lake Pepin as demonstrated in subsequent analyses.
15
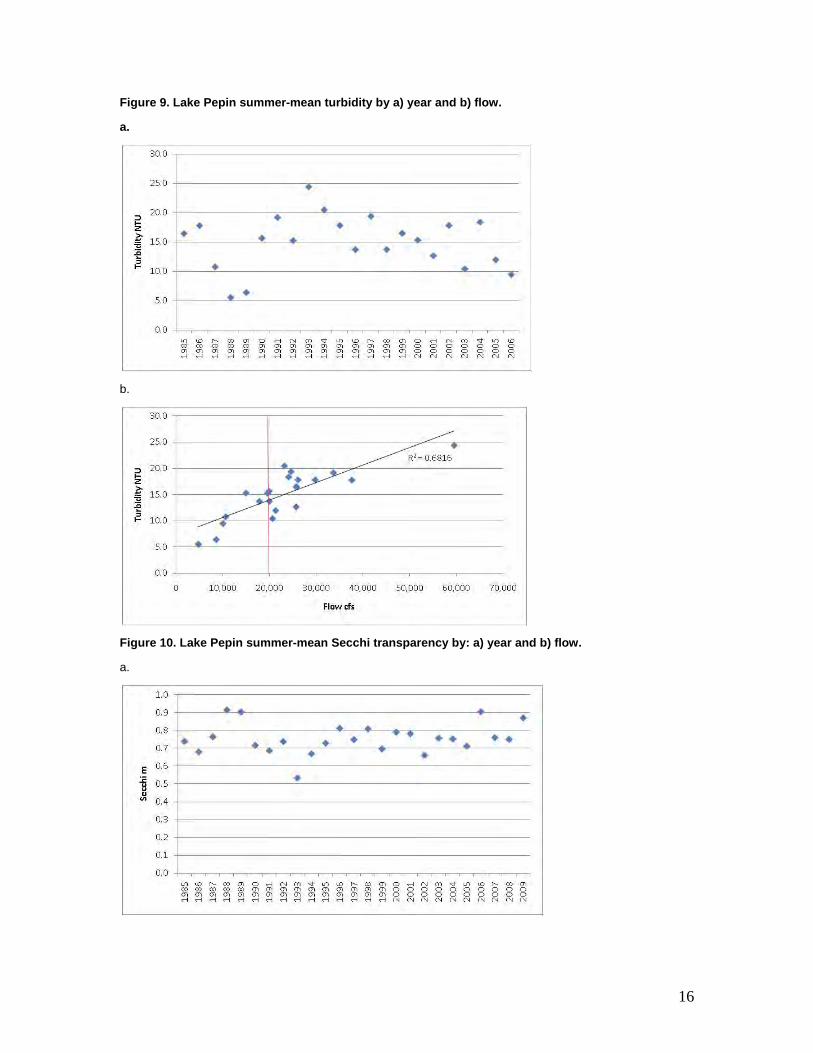
Figure 9. Lake Pepin summer-mean turbidity by a) year and b) flow.
a.
b.
igure 10. Lake Pepin summer-mean Secchi transparency by: a) year and b) flow. F
a.
16

b.
Spatial patterns: Mississippi River, Upper and Lower Lake Pepin
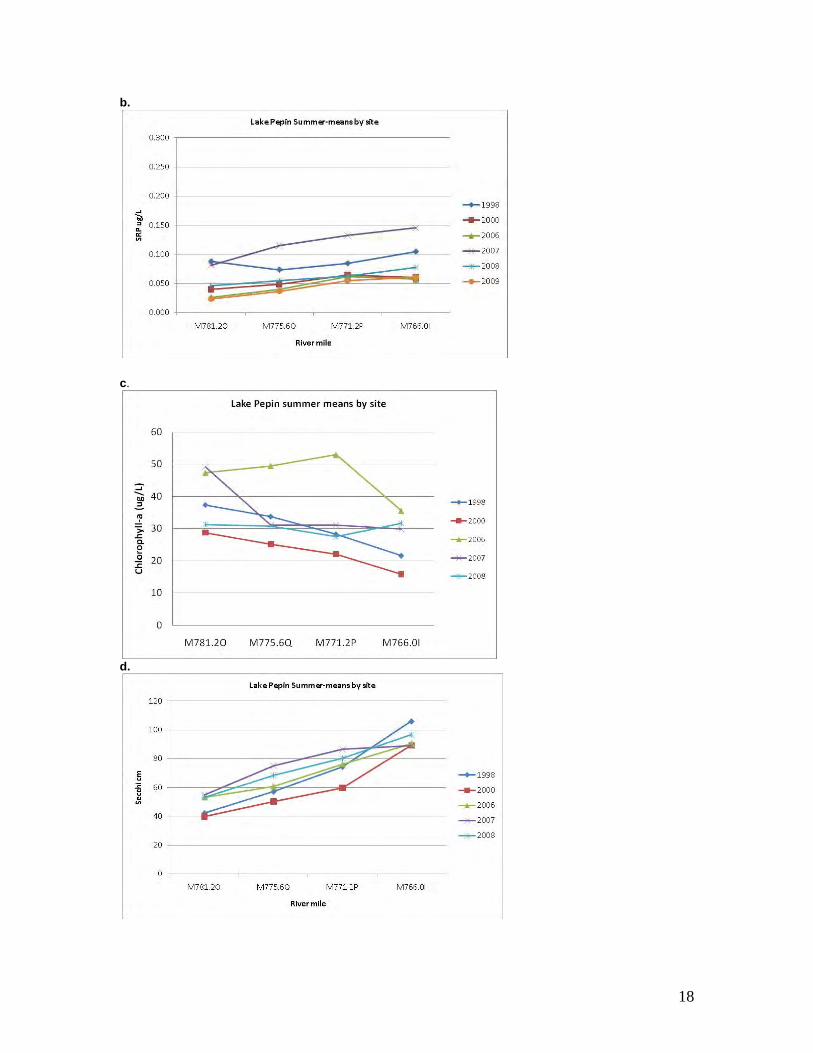
While we have emphasized trends based on lake-wide means, there are distinct patterns in the trophic status variables between the upper and lower segment of Lake Pepin and these patterns are generally more pronounced in low to average flow years (e.g. Heiskary and Vavricka, 1993). Over the recent 10-11 years there have been several summers with flows at or below the 20,000 cfs threshold (1998, 2000, 2006, 2007, 2008 and 2009; Figure 5a). LTRMP data for these summers are useful for describing changes in phosphorus, chlorophyll-a, and Secchi among the inflow (Mississippi River at RM 786) and upper, lower and outlet of Lake Pepin (Figures 11a-d). Figure 11. Summer-mean water quality data for recent low flow summers based on LTRMP fixed site data for inlet (RM 781), upper Lake Pepin (RM 775), lower Lake Pepin (RM 771) and Lake Pepin outlet (RM 766). a.
17
b.
.
d.
c
18

TP concentrations show minimal change from the inflow to the outlet of Lake Pepin, even though Pepin is quite efficient at sedimenting soil and algal particles (Figure 11a). The minimal change in TP longitudinally is the net result of the sedimentation of particulate P and internal recycling, which results in increased SRP (Figure 11b). As previously noted, SRP in recent years is much lower than earlier years (1998), with the exception of 2007. Chlorophyll-a is quite similar between RM 781 and the shallow upper segment of Lake Pepin, which implies that much of the algae (chlorophyll-a) measured in upper Pepin is a reflection of algae transported in from Pool 3. Any increases in chlorophyll-a in upper Pepin can be attributed to increased light (Figure 11d) as the water spreads across the upper segment (in contrast to being confined in channel). Chlorophyll-a declines as water passes through the deeper, lower segment. A deeper mixed layer, increased sedimentation, and light limitation all contribute to this decline, with depth being the most important factor in the lower segment. Chlorophyll-a declines further as waters reach the outlet of the lake. Secchi transparency increases markedly from the river through the lake (Figure 11d). Physical sedimentation of soil and algae is the principal mechanism for this increase. Lake Pepin produces less chlorophyll-a per unit TP as compared to ty ical glacial lakes in Minnesota
igure 12). Pepin’s extremely short water residence time (Table 1), deeper mixed layer, and high idity, as compared to the reference lakes, are primary reasons. A regression equation developed medium to large rivers (based on data from 1999 and 2000), as described in Heiskary and Markus
(2001) actually provides a better fit for the Lake Pepin data; however even that regression exhibits higher chlorophyll-a per unit TP as compared to observed data for most Lake Pepin summer-means. Paired TP and Chl-a data from recent low-average flow (<20,000 cfs) summer, where TP is on the order of 150-160 ug/L, shift closer to the river regression and in some summers fall among the reference lake data (Figure 12). It should be noted there is no significant relationship between TP and Chl-a over the range of reported data for Lake Pepin (Figure 12); however recent TP measures are beginning to approach levels that can lead to P limitation (Heiskary and Wasley 2010). Figure 12. Total phosphorus vs. chlorophyll-a regressions for lakes and rivers as compared to Lake Pepin UMR-LP & LTRMP data (1985-2009). Lake regression as noted in Heiskary and Wilson (2008) and river regression based on 1999 and 2000 river data in Heiskary and Markus (2001).
Algal composition and user perception
p(Fturbfor
19

Lake user perception is strongly influenced by the magnitude or intensity of algal blooms (as measured by chlorophyll-a) and algal forms that comprise the blooms. Blue-green blooms, which are common in eutrophic glacial lakes throughout Minnesota, evoke strong negative responses from lausers. In contrast, diatoms, a dominant algal form in rivers (Heiskary and Markus 2001) and in Lake Pepin (Figure 13), limit transparency but often will not evoke strong negative responses relative to the‘physical appearance” or “recreational suitability.” User perception data collected by volunteers MCES and Boundary Area Commission-sponsored effort from 1994-1998 (Force and Macbetand data from 1990 and 1991 provide some insights on lake user responses for Lake Pepin (Heiskaand Walker 1995). Figure 13. Summer average algal composition for: a) upper and b) lower Lake Pepin. Reflects available data used to calibrate RCS model. Flow duration percentile noted. a)
ke
in a
h, 2002) ry
Based on the 1994-1998 data, when river flows were in the 18,000-26,000 cfs (Tw=9-12 days) range, volunteers generally rated algal levels as moderate (2.7 on a scale of 1[“crystal clear”] - 5 [“severely high algal levels”]) for the upper lake and slightly less (2.3) in the lower lake (Force and Macbeth, 2002). These observations corresponded to chlorophyll-a ≤30 µg/L (upper) and ≤23 µg/L (lower). Mean physical condition and recreational suitability ratings peaked at chlorophyll-a of 50-55 µg/L (Force and Macbeth, 2002) and provide context for defining a “severe nuisance” bloom for Lake Pepin. Algal composition data for these summers (Figure 15) indicated diatoms were dominant most summers, which is not surprising given the large influx of diatoms from the river and short water residence time in Pepin. Blue-greens were more prominent in the lower segment of the lake; however
Upper L.P. - yes - Average of % BG Upper L.P. - yes - Average of % Greens
Upper L.P. - yes - Average of %Diatoms
0%
10%
20%
30%
40%
50%
60%
70%
80%
90%
100%
1992 (47%) 1994 (70%) 1995 (83%) 1996 (59%) 1997 (75%) 1998 (53%) 2006 (24%)
b)
0%
10%
20%
30%
40%
50%
60%
70%
80%
90%
100%
1992(47%)
1994(70%)
1995(83%)
1996(59%)
1997(75%)
1998(53%)
2005(65%)
2006(24%)
Lower L.P. - yes - Average of % BG Lower L.P. - yes - Average of % Greens
Lower L.P. - yes - Average of %Diatoms
20

chlorophyll-a concentrations were lower in that segment as well, which likely contributed to thperception of “lower” algal levels in the lower segment of Pepin. Lake Pepin goal setting efforts in the early 1990’s focused on Chl-a exceedance frequencies (>30 µg/L, >40 µg/L, and >60 µg/L) as related to summer-mean Chl-a and flow (Heiskary 1993; Heiskary and Walker 1995). This effort used available data from 1976-1981, 1998, and 1990-1991 and a log-normal frequency model (Walker 1985) to relate summer-mean Chl-a to nuisance frequencies. Pepin data corresponded quite well to this model and it provided a useful tool for helping to identify a summer-mean Chl-a
e
value that would minimize the frequency of extreme events.
90, a median flow year of ~11 days), was characterized by mean chlorophyll-a of 33 µg/L with 20% of the measures >50
µg/L (Heiskary and Walker, 1995). Blue-green algae were prominent in July and August (typically 30% or more of the algal population). User perceptions were typically “high algae” (4) and “no swimming” (4) during that period. In 1991, a high flow summer (Tw= 6 days), chlorophyll-a averaged 19 µg/L and blue-green algae were a minor component (<20%) of the algal community on most dates. User perception during summer 1991 was routinely “algal green” (3) and “swimming impaired” (3). No responses of “high algae” or “no swimming” were recorded that summer (Heiskary 1993). Citizen interviews conducted by the Boundary Area Commission in 1992 provided further insights. In these interviews residents were asked to make comparisons among conditions in 1988, 1990 and 1991. Respondents indicated much more recreational usage in 1990 and 1991 as compared to 1988 and 1989. Further, 52% of 26 respondents indicated 1991 water quality was improved over previous years. Based on all of the above it was determined that an appropriate Chl-a goal for Pepin should yield an
ptably low frequency of “nuisance algal conditions” throughout the majority of the summer and perceptions of “no swimming” to a minimum (Heiskary 1993). Chl-a levels of >40 µg/L was
deemed appropriate to describe “nuisance algal conditions” and >60 µg/L as “severe nuisance algal condition” and “no swimming” thresholds for Pepin. The combined information presented in Force and Macbeth (2002), Heiskary (1993), Heiskary and Walker (1995) and the recent algal composition data for Pepin (Figure 13) suggests that thresholds for defining severe nuisance algal conditions in Pepin are likely higher than what we typically see in Minnesota’s glacial lakes. Chl-a>30 µg/L is often deemed “severe nuisance” conditions for glacial lakes, while for Pepin it is more often associated with “algal green.” A primary reason is that algae in Pepin is most often dominated by diatoms, while typical glacial lakes (with Chl-a >30 µg/) in Minnesota are often dominated by blue-green algae. The highest level we use, >60 µg/L, as an indication of “very severe nuisance” and “no swimming” conditions likely applies across all lake types. Given the previous data analysis, user perceptions and citizen surveys it seems appropriate to define “severe nuisance algal blooms” as >50 µg/L. This level is more conservative than the >60 µg/L, represents a midpoint between the >40 and >60 µg/L leve eviously examined (Heiskary
993), and would seem to have some support from the work of Force and Macbeth (2002).
User perception data from 1990 and 1991 and algal composition were used to provide further perspective on what constitutes severe nuisance blooms for Pepin. Summer 19(Tw
accekeep
ls pr1 Long-term trends in phosphorus based on sediment diatom reconstruction Another valuable tool for assessing long-term trends is the reconstruction of TP based on fossil diatoms in the sediments of the lake. Background on this approach may be found in Heiskary et al. (2004) (http://www.pca.state.mn.us/publications/environmentalbulletin/index.html ) and an overvof Lake Pepin project results may be found in MCES (2002). The Science Museum of Minnesota (Engstrom and Almendinger 2000 and Engstrom et al. 2009) collected and analyzed sediment coreLake Pepin for the purpose of reconstructing historical P concentrations and loads. This work
iew
s on
provided a basis for estimating pre-European TP, similar to MPCA studies noted in Table 3, as well as
21
a detailed record for evaluating changes over time as a function of major changes in the watershe(Figure 14). Based on comparisons with data from other Minnesota
d lakes (Table 3) the estimated pre-
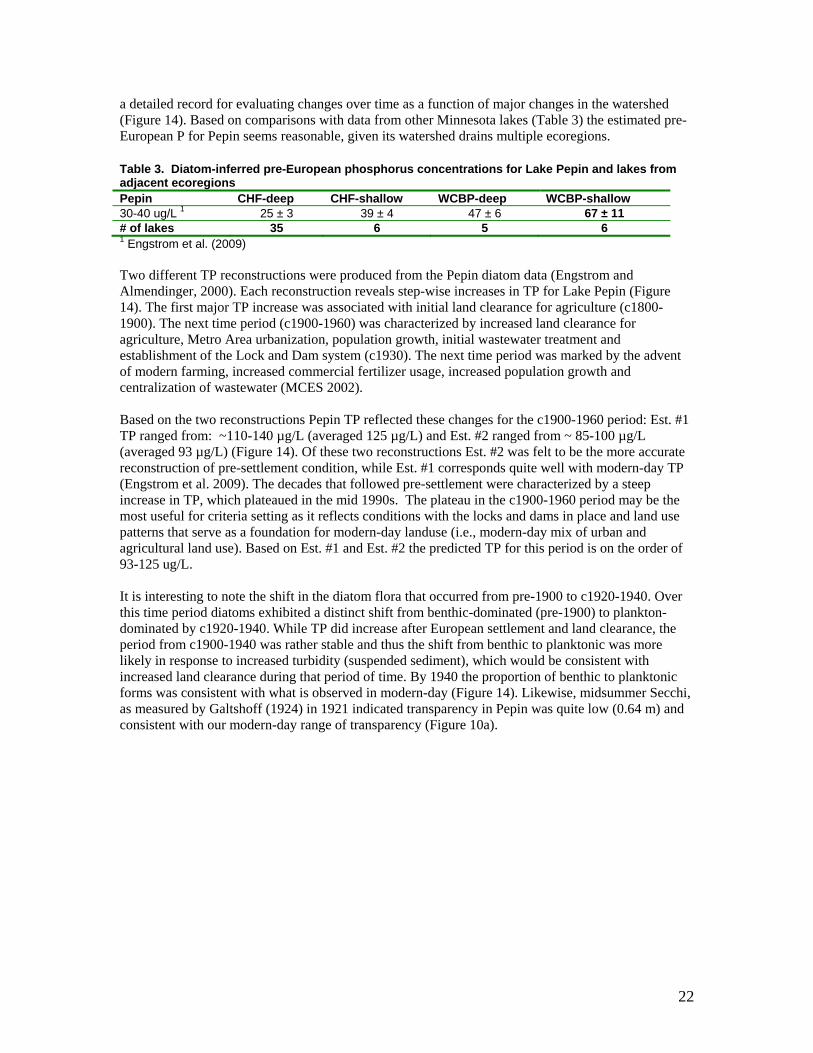
uropean P for Pepin seems reasonable, given its watershed drains multiple ecoregions. E Table 3. Diatom-inferred pre-European phosphorus concentrations for Lake Pepin and lakes from adjacent ecoregions Pepin CHF-deep CHF-shallow WCBP-deep WCBP-shallow 30-40 ug/L 1 25 ± 3 39 ± 4 47 ± 6 67 ± 11 # of lakes 35 6 5 6 1 Engstrom et al. (2009) Two different TP reconstructions were produced from the Pepin diatom data (Engstrom and Almendinger, 2000). Each reconstruction reveals step-wise increases in TP for Lake Pepin (Figure 14). The first major TP increase was associated with initial land clearance for agriculture (c1800-1900). The next time period (c1900-1960) was characterized by increased land clearance for agriculture, Metro Area urbanization, population growth, initial wastewater treatment and establishment of the Lock and Dam system (c1930). The next time period was marked by the advent of modern farming, increased commercial fertilizer usage, increased population growth and centralization of wastewater (MCES 2002). Based on the two reconstructions Pepin TP reflected these changes for the c1900-1960 period: Est. #1 TP ranged from: ~110-140 µg/L (averaged 125 µg/L) and Est. #2 ranged from ~ 85-100 µg/L (averaged 93 µg/L) (Figure 14). Of these two reconstructions Est. #2 was felt to be the more accurate reconstruction of pre-settlement condition, while Est. #1 corresponds quite well with modern-day TP
ngstrom et al. 2009). The decades that followed pre-settlement were characterized by a steep (Eincrease in TP, which plateaued in the mid 1990s. The plateau in the c1900-1960 period may be the most useful for criteria setting as it reflects conditions with the locks and dams in place and land use patterns that serve as a foundation for modern-day landuse (i.e., modern-day mix of urban and agricultural land use). Based on Est. #1 and Est. #2 the predicted TP for this period is on the order of93-125 ug/L.
r
ecchi, d
It is interesting to note the shift in the diatom flora that occurred from pre-1900 to c1920-1940. Ovethis time period diatoms exhibited a distinct shift from benthic-dominated (pre-1900) to plankton-dominated by c1920-1940. While TP did increase after European settlement and land clearance, the period from c1900-1940 was rather stable and thus the shift from benthic to planktonic was more likely in response to increased turbidity (suspended sediment), which would be consistent with increased land clearance during that period of time. By 1940 the proportion of benthic to planktonic forms was consistent with what is observed in modern-day (Figure 14). Likewise, midsummer Sas measured by Galtshoff (1924) in 1921 indicated transparency in Pepin was quite low (0.64 m) anconsistent with our modern-day range of transparency (Figure 10a).
22

Figure 14. Major diatoms groups and diatom-inferred total phosphorus in Lake Pepin: 1762 – 1996(Engstrom and Almendinger, 2000). Redrawn from MCES (2002).
to various pollutant reduction scenarios for the Lake Pepin TMDL. The model is based
P
In
go on to explain two model amework factors that may contribute to the under-prediction of TP in Lake Pepin.
he difference between observed vs. modeled chlorophyll-a averaged 2.1 µg/L (Figure 15b), which is % of the mean observed chlorophyll-a for that period. This is about equal to the mean standard error f the observed data (2.0 µg/L; Figure 6b). There was no apparent relationship (modeled vs. observed) lative to flow or year of data. The mean difference between observed and modeled Secchi was 0.09 , which on a percentage basis is similar to TP (14% of the observed mean). In most summers
bserved Secchi was less than modeled (Figure 15c) but the mean difference is less than 0.1 m.
0
100 0.25
80
20
40
60
Perc
ent o
f Dia
to
0.05
0.10
0.15
Tota
l Pho
spho
r
0.20
us (m
g/L)
ms
1762 1800 1860 1904 1921 1940 1964 1976 1988 1996
Year
0.00
RCA Upper Mississippi River-Lake Pepin (UMR-LP) Model Analysis
Model prediction versus observed data Limno Tech Inc.’s (LTI) RCA UMR-LP model serves as the primary mechanism for estimating in-ake response
Planktonic Diatoms Benthic Diatoms TP Estimate #1 TP Estimate #2
lon 22 years of in-lake and watershed data for the period from 1985-2006. A comparison of observed vs. model-predicted TP, chlorophyll-a and Secchi is useful prior to evaluating results from various scenarios (Figure 15a & b). Relatively good agreement is obtained between observed and modeled Twith a mean difference of 0.025 mg/L, which is 14% of the observed mean for the years compared. This is about double the mean standard error of 0.012 mg/L (6% of the observed mean; Figure 5). most summers observed TP is higher than modeled TP, with the exception of 1991 a very high flow summer (33,753 cfs). Observed dissolved ortho phosphorus is higher than modeled as well with a mean difference of .027 mg/L (29% of observed mean). Redder and DePinto (2009) acknowledge some model bias, but note that the “goodness of fit” between model results and data is still very easonable (e.g. relative error of 10-20% on a lake-wide basis). Theyr
fr T8oremo
23

Figure 15. Lake Pepin summer-mean observed vs. modeled a) TP b) chlorophyll-a and c) Secchi for 1991-2006.
Summer-mean observed vs. modeled TP: 1991-2006. 1:1 line noted.
0.000
0.050
0.100
0.150
0.200
0.250
0.300
0.000 0.050 0.100 0.150 0.200 0.250 0.300
Observed mg/L
Mod
eled
mg/
L
Model-predicted minus observed Total P
-0.06-0.05-0.04-0.03-0.02-0.010.000.010.020.030.040.050.06
1991
1992
1993
1994
1995
1996
1997
1998
1999
2000
2001
2002
2003
2004
2005
2006
TP m
g/L
Summer-mean observed vs. modeled Chlorophyll-a: 1991-2006. 1:1 line noted
0
5
10
15
20
25
30
35
40
45
50
0 5
Mod
eled
ug/
L
24
10 15 20 25 30 35 40 45 50
Observed ug/L
Model-predicted minus observed C rophyll
-2
02
0520
06
a ug
/L
hlo
46
-10
-8
-6
-4
1991
1992
1993
1994
1995
1996
1997
1998
1999
2000
2001
2002
2003
2004
20
Chl
-
Summer
0.00
0.10
0.20
0.30
0.40
0.50
0.60
0.70
0.80
0.90
1.00
0.00 0.10 0.20 0.30 0.40 0.50 0.60 0.70 0.80 0.90 1.00
Observed mg/L
Mod
eled
m
-mean observed vs. modeled Secchi: 1991-2006. 1:1 line noted.
Model-predicted minus observed Secchi
-0.06
1991
1992
1993
1994
1995
1996
1997
1998
1999
2000
2001
2002
2003
2004
2005
2006
-0.05-0.04-0.03-0.02-0.010.000.010.020.030.040.050.06
Secc
hi m
a)
b)
c)

The RCA model does a reasonable job of simulating % blue-greens (Figure 16). Based on comparisons
RCA model predicted & observed % blue-greens: upper segment
0%
10%
20%
30%
40%
50%
60%
1985
1986
1987
1988
1989
1990
1991
1992
1993
1994
1995
1996
1997
1998
1999
2000
2001
2002
2003
2004
2005
2006
% b
lue-
gree
ns
Upper-pred. Upper-obs.
RCA model predicted & observed % blue-greens: lower segment
0%
10%
20%
30%
40%
50%
60%
1985
1986
1987
1988
1989
1990
1991
1992
1993
1994
1995
1996
1997
1998
1999
2000
2001
2002
2003
2004
2005
2006
% b
lue-
gree
ns
Lower -pred. Lower obs.
of observed vs. predicted for the upper segment the model simulates % blue-greens, hin 10% of observed in 8 of 9 summers in the upper segment and 6 of 9 summers in the lower
segment (Figure 16). In the lower segment predicted is less than or equal to observed with the exception of 1992 where observed is much higher than predicted (Figure 16a). However, this was based on only a single sample (as was 2005 lower segment) and thus these two summers do not allow for adequate comparison of observed vs. predicted blue-greens (Figure 16a). Monthly comparisons provide a more valid assessment of model vs. observed and in general suggest reasonable agreement between model-predicted and observed (Figure 16b). Based on Figures 5 and 16 the relative percentage of blue-greens does not appear to be strongly influenced by flow (residence time). Figure 16. Blue-green composition model-predicted vs. observed: a) summer-mean and b) monthly mean for example years. a)
wit
25

b.
26

Model scenarios The UMR-LP model has a scenario-viewer that allows for comparison of 21 scenarios across 22 y(1985-2006) and a range of flows (Table 4). Projections from these 21 scenarios provide an opportunity to evaluate the response of Lake Pepin and various control points upstream to variations in TP, Chl-a and TSS reductions from major tributaries and MCES dischargers to the Mississippi River. For purposes of bracketing the response of Pepin to varying load reductions model scenarios:#1 (~current conditions), #11 (~ecoregion-based reduction: 20% reduction in Mississippi, St. Croix, and Cannon and 50% reduction in Minnesota River TP and TSS), and #15 (~“pre-1900s” red50% in Mississippi and St. Croix and 80% Minnesota and Cannon Rivers) were used. In each i
ears
uction of nstance
ata from three years that represent a range in flow conditions (percentiles based on the 22-year data th rd th
ides a basis for evaluating in-lake responses to reductions in TP, TSS and Chl-a. Relative to nutrient over-enrichment, important response variables include: summer-mean chlorophyll-a, nuisance bloom frequency, blue-green algal biomass and Secchi transparency. For this purpose 21 reduction scenarios were tested across one median flow year (1998) and three low flow years (1987,1989, and 2006) to demonstrate the range in response anticipated as TP, Chl-a and TSS loads are reduced. Summer-mean chlorophyll-a response, expressed as a function of TP, varies among years (Figure 17). In addition to TP, residence time (flushing rate), turbidity (light), and chlorophyll-a loads from the rivers are important factors and contribute to the observed variability. TP reductions over a range from ~200 – 100 µg/L (0.2 – 0.1 mg/L) elicit minimal response in chlorophyll-a. As TP falls below 100 µg/L reductions in chlorophyll-a are evident, with the most marked reductions as TP falls below 70-80 µg/L (0.7-0.8 mg/L; Figure 17). Nuisance bloom frequency is a much more responsive metric by comparison. For the Lake Pepin TMDL nuisance blooms are defined as the frequency of chlorophyll-a >50 µg/L. Relatively steady
eclines occur over the range from ~200-100 µg/L TP (0.2 – 0.1 mg/L; Figure 18). In the initial (7 - 25% of summer) dependant
nce bloom frequency falls below 10 days (<10% of summer) in most scenarios tested. Nuisance bloom frequency and summer-mean chlorophyll-a are closely linked. As summer-mean falls below 35 µg/L nuisance bloom frequency falls below 15 days and by 28 µg/L falls to 0 days (Figure 19). As TP and chlorophyll-a are reduced the percentage of blue-green algae, as a portion of the overall algal population, is predicted to decline as well (Figure 20) and measurable reductions are noted over the range from ~200 – 100 µg/L (0.2 – 0.1 mg/L).
dset): 2006 (24 percentile), 1998 (53 percentile) and 2002 (89 percentile) were reviewed.
scenario viewer provThe
dscenarios (case 1) nuisance blooms may range from about 8 - 30 dayson the particular year (summer). At a TP of 100 µg/L or lower, nuisa
27

Table 4. RCA Scenario viewer. Overview of load reduction scenarios, variables, draft targets, temporal approach, and applicable locations.
igure 17. Change in summer-mean chlorophyll-a as function of summer-mean total phosphorus. esponse based on 19 TP and TSS reduction scenarios for one median (1998) and three low flow 987, 1989, 2006) years. Flow percentile noted is relative to the 22 year data set.
Hist 20% 50% 90% Hist 20% 50
% 80% 90% Hist 20% Hist 50% Hist 20% Hist Permit Red. Rem.
1Historical Tributary &
WWTP Loads (none) x x x x x x
2 (none) x x x x x x3 20% / 20% x x x x x x4 20% / 50% x x x x x x5 20% / 80% x x x x x x6 50% / 20% x x x x x x7 50% / 50% x x x x x x8 50% / 80% x x x x x x
9 (none) x x x x x x
10 20% / 20% x x x x x x11 20% / 50% x x x x x x12 20% / 80% x x x x x x13 50% / 20% x x x x x x14 50% / 50% x x x x x x15 50% / 80% x x x x x x
16 "Natural Background" Case 90% / 90% x x x x x x
17 20% / 50% x x x x x x
18 50% / 80% x x x x x x
19 90% / 90% x x x x x x
20 20% / ~50% x x x x x
21 20% / ~50% x x x x x
Scenario No.
Load Reduction Scenario
UMR / MR Load Reductions
Upper Miss. River Minn ta River St. Croix
Minnesota River TSS Reductions Based on HSPF "Scenario 4"
HSPF " enario 4" + CE- AL-W2
Cannon Other Tribs WWTPs
Tributary Load Reductions with
Permitted WWTP Loads
Tributary Load Reductions with
Reduced WWTP Loads
Tributary Load Reductions with Reduced Pool 2 Resuspension
eso
ScQU
F aR(1
28
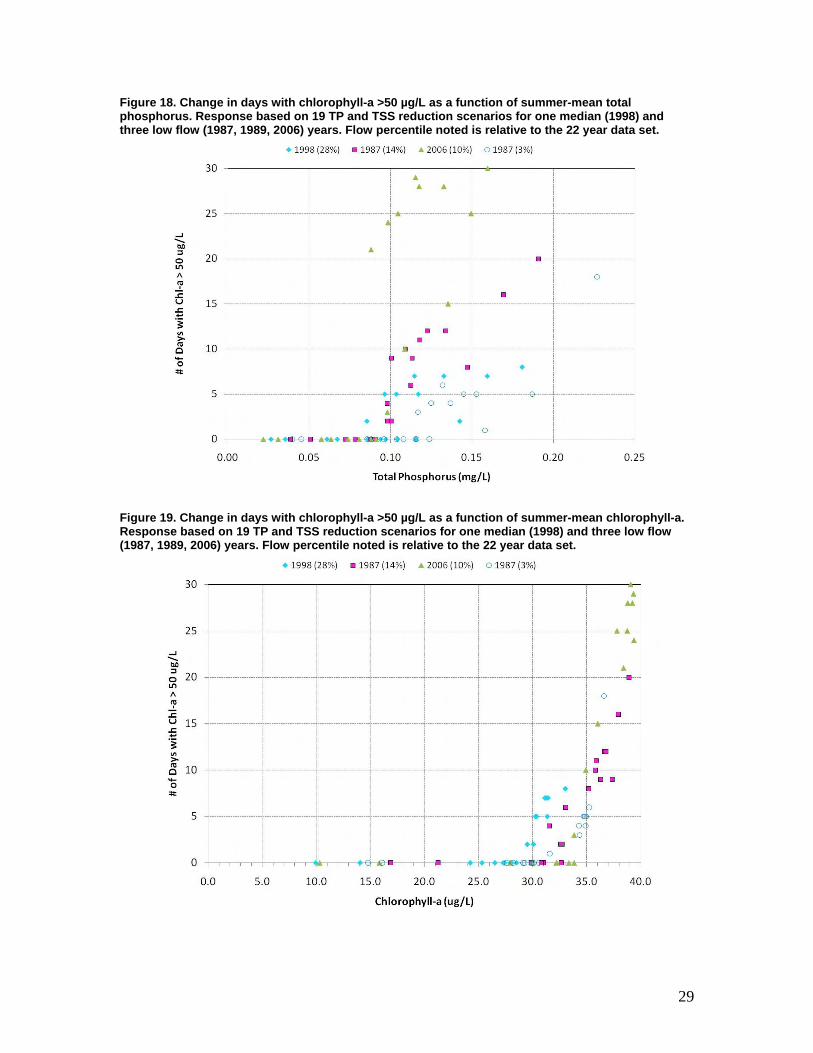
F 8. Change in days igure 1 with chlorophyll-a >50 µg/L as a function of summer-mean total hosphorus. Response based on 19 TP and TSS reduction scenarios for one median (1998) and
rophyll-a >50 µg/L as a function of summer-mean chlorophyll-a.
pthree low flow (1987, 1989, 2006) years. Flow percentile noted is relative to the 22 year data set.
igure 19. Change in days with chloFResponse based on 19 TP and TSS reduction scenarios for one median (1998) and three low flow(1987, 1989, 2006) years. Flow percentile noted is relative to the 22 year data set.
29

Figure 20. Blue-green algal biomass as a function of summer-mean TP. Response based on 1and TSS reduction scenarios for one median (1
9 TP 998) and three low flow (1987, 1989, 2006) years. Flow
ercentile noted is for the 22 year data set.
Site Specific Criteria for Lake Pepin Development of water quality goals for Lake Pepin date to the early 1990’s when the Phosphorus Cooperators Group conducted extensive research on Lake Pepin and actively pursued this question. That work and recent efforts, in support of the Lake Pepin TMDL and development of the UMR-LP model, has resulted in a range of goals being discussed and/or adopted (as was the case with the Phosphorus Cooperators Group and Chl-a goal of 30 µg/L; Heiskary 1993). Table 6 summarizes those goals and related data for Lake Pepin. Considerations used in previous efforts provide a general framework for our current need to adopt site specific criteria for the lake. Since that time we have the benefit of over 15 more years of data collection, sediment diatom reconstruction, and numerous other projects (MCES 2002) that advance our knowledge of Lake Pepin. Various modeling efforts ranging from simple empirical models (BATHTUB; Heiskary and Walker, 1995), mechanistic models (Advanced Eutrophication Model of the Upper Mississippi River; MCES, 2002) and now LTI’s UMR-LP model have further advanced our knowledge on how Lake Pepin responds to changes in flow, turbidity and nutrient loading. Ecoregion-based lake eutrophication criteria promulgated in 2008 provide some context for Lake Pepin site specific criteria (Table 7). More important than the actual criteria is the approach used in their derivation, given the unique nature of Lake Pepin. Heiskary and Wilson (2008) describe the weight-of-evidence approach that considers user perceptions, nuisance bloom frequency, ecological endpoints and interrelationships among TP, chlorophyll-a and Secchi. Pepin can also benefit from recent efforts to draft eutrophication criteria for Minnesota’s rivers (Heiskary et al. 2010). Recognizing the complexities and linkages of Pepin, upstream navigational pools and major tri taries
p
bu
30

the Lake Pepin TMDL Science Advisory Panel recommended that MPCA develop eutrophicstandards for Lake Pepin and Pools1-8, further acknowledging these waterbodies differ sufficientlyfrom typical lakes and rivers to warrant site specific standards. The SAP recommended further that
ation
Lake Pepin eutrophication standards should be integrated into the statewide river eutrophication criteria development. Table 6. Lake Pepin 303(d) listing, current and historical values and draft criteria ranges. 2002 303(d)
listing 1 Recent 10-year mean 2
2009 means Criteria & goal ranges 3
Diatom-inferred P from c1900-
1960 4 TP µg/L 198 171 152 80-120 ~110-140 Chl-a µg/L 25 30 32 28-32 -- 1. 1991-2000 2. 2000-2009 3. Represents draft values discussed or proposed at various points in overall process. 4. Estimate #1 (Engstrom and Almendinger 2000) Table 7. Minnesota’s lake eutrophication criteria and related metrics for adjacent ecoregions and Lake Pepin site specific criteria. Ecoregion – lake type (use classification1) TP (µg/L) Chl-a % nuisance
blooms2 %blue-green biomass &
impact
CHF – Aquatic Rec. Use – Deep (Class 2B) 40 14 0-5% moderate
WCP&NGP – Aquatic Rec. Use - Shallow lass 2B)
90 30 30-45% moderate-high
te
(C
Lake Pepin 100 28 0-8% 8-16% low-modera
1 Aquatic life and recreation use class as defined in Minn. R. 7050.0140, subp. 3 and Minn. R. 7050.0222 (Minnesota Rules Chapter 7050 2008). Class 2A is used for waters supporting a cold water fishery and refers specifically to lakes that support natural populations of lake trout. Stream trout refers to all other designated (managed) trout lakes. Class 2B is designation for waters supporting cool or warm water fishery and is the default classification for the majority of Minnesota’s lakes. 2 Defined as >30 µg/L for CHF and WCP ecoregions and >50 µg/L for Pepin; % of summer based on Heiskary and Wilson (2005) & Figures 18 & 19 and Table 8 this document. The LTI UMR-LP model for Lake Pepin provides a basis for predicting in-lake response that result from current and future loading scenarios as demonstrated in Figures 17-20 and can help guide establishment of criteria for Pepin and upstream waters. For this purpose two model runs were used to evaluate potential in-lake endpoints and required upstream conditions under low-average flow (Table 8a) and all summers (Table 8b). These model runs, as they inform criteria selection for Pepin, are addressed in this report while implications for upstream pools and tributaries are addressed in Heiskary and Wasley (2010).
31
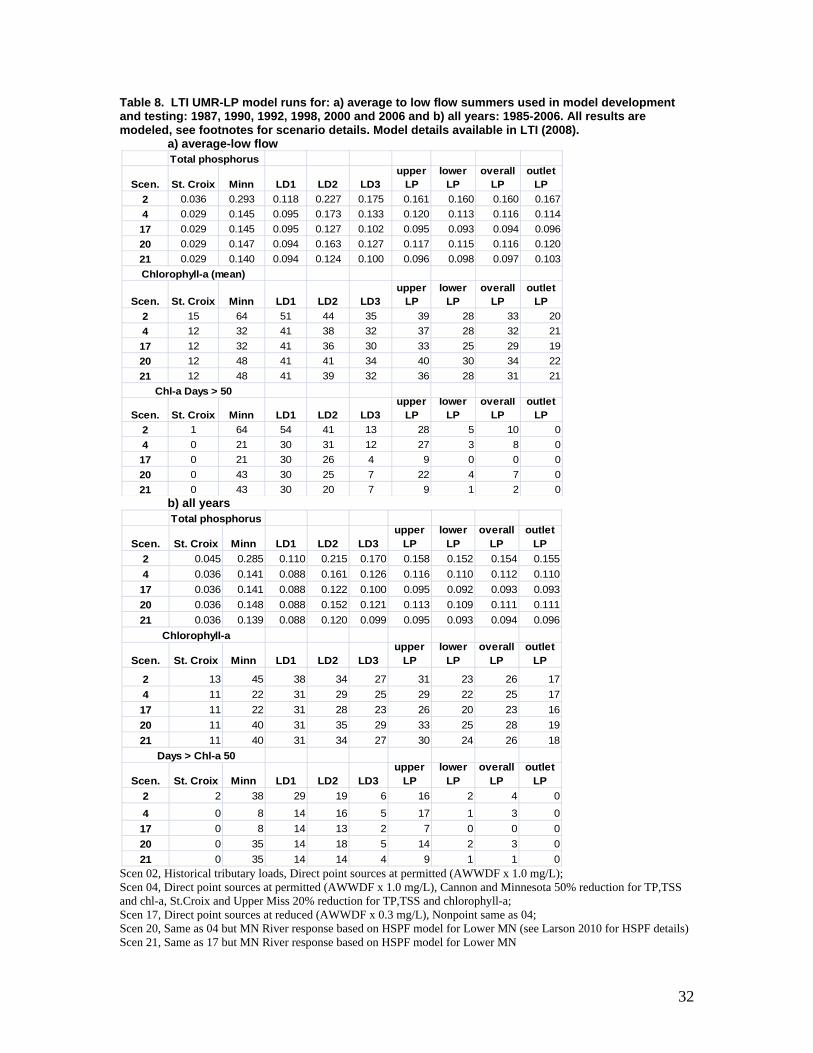
Table 8. LTI UMR-LP model runs for: a) average to low flow summers used in model development and testing: 1987, 1990, 1992, 1998, 2000 and 2006 and b) all years: 1985-2006. All results are modeled, see footnotes for scenario details. Model details available in LTI (2008).
a) average-low flow
b) all years
Total phosphorus
Scen. St. Croix Minn LD1 LD2 LD3upper
LPlower
LPoverall
LPoutlet
LP2 0.036 0.293 0.118 0.227 0.175 0.161 0.160 0.160 0.1674 0.029 0.145 0.095 0.173 0.133 0.120 0.113 0.116 0.11417 0.029 0.145 0.095 0.127 0.102 0.095 0.093 0.094 0.09620 0.029 0.147 0.094 0.163 0.127 0.117 0.115 0.116 0.12021 0.029 0.140 0.094 0.124 0.100 0.096 0.098 0.097 0.103Chlorophyll-a (mean)
Scen. St. Croix Minn LD1 LD2 LD3upper
LPlower
LPoverall
LPoutlet
LP2 15 64 51 44 35 39 28 33 204 12 32 41 38 32 37 28 32 2117 12 32 41 36 30 33 25 29 1920 12 48 41 41 34 40 30 34 2221 12 48 41 39 32 36 28 31 21
Chl-a Days > 50
Scen. St. Croix Minn LD1 LD2 LD3upper
LPlower
LPoverall
LPoutlet
LP2 1 64 54 41 13 28 5 104 0 21 30 31 12 27 3 817 0 21 30 26 4 9 0 020 0 43 30 25 7 22 4 721 0 43 30 20 7 9 1 2
00000
Total phosphorus
Scen. St. Croix Minn LD1 LD2 LD3upper
LPlower
LPoverall
LPoutlet
LP2 0.045 0.285 0.110 0.215 0.170 0 58 0.152 0.154 0.155
26 0.116 0.110 0.112 0.11000 0.095 0.092 0.093 0.093
16 5 17 1 3 017 0 8 14 13 2 7 0 0
.14 0.036 0.141 0.088 0.161 0.117 0.036 0.141 0.088 0.122 0.120 0.036 0.148 0.088 0.152 0.121 0.113 0.109 0.111 0.11121 0.036 0.139 0.088 0.120 0.099 0.095 0.093 0.094 0.096
Chlorophyll-a
Scen. St. Croix Minn LD1 LD2 LD3upper
LPlower
LPoverall
LPoutlet
LP
2 13 45 38 34 27 31 23 26 174 11 22 31 29 25 29 22 25 1717 11 22 31 28 23 26 20 23 1620 11 40 31 35 29 33 25 28 1921 11 40 31 34 27 30 24 26 18
Days > Chl-a 50
Scen. St. Croix Minn LD1 LD2 LD3upper
LPlower
LPoverall
LPoutlet
LP2 2 38 29 19 6 16 2 4 0
4 0 8 14
Scen 02, Historical tributary loads, Direct point sources at permitted (AWWDF x 1.0 mg/L); Scen 04, Direct point sources at permitted (AWWDF x 1.0 mg/L), Cannon and Minnesota 50% reduction for TP,TSS and chl-a, St.Croix and Upper Miss 20% reduction for TP,TSS and chlorophyll-a; Scen 17, Direct point sources at reduced (AWWDF x 0.3 mg/L), Nonpoint same as 04; Scen 20, Same as 04 but MN River response based on HSPF model for Lower MN (see Larson 2010 for HSPF details) Scen 21, Same as 17 but MN River response based on HSPF model for Lower MN
020 0 35 14 18 5 14 2 3 021 0 35 14 14 4 9 1 1 0
32

Flow range for application of criteria – Flow directly influences residence time (Figure 3) and playsignificant role in Chl-a production in Pepin (Figure 8) and the overall system (Heiskary and Wasley2010). Previous efforts to establish Chl-a goals emphasized summers of low-average when Pepin exhibited more “lake-like” conditions (Figure 4). While low-average flow summers remain an important focus in our
s a
modeling and data analysis (e.g. Figures 17-20 and Table 8) criteria should be pplicable across all summers to ensure aquatic recreational uses are protected in all years. This issue
criteria ill be applicable across all summers and assessed data from both low flow and high flow summers ill be used to m sessm iskary W , cr
will be applied acro ers with assessments focusing on sum s baseds, as is the case in othe assessme
orus – A on of 100 µg is proposed Pepin. Se factors sugg that ile a very aggressive goal for Lake Pepin, may be a realistic target to use as a site
1. Based on sediment-diatom inferred TP (Figure14) 100 µg/L is above pre-European TP;
bles 3 A value of 100 µg/L is well within Pepin’s range of , Fi 4). T rt
period as it included: establishment of the lock and dam system, m clearagriculture, initial urbanization of the seven ounty metropolitan area tralizatio
e as som hat of odern-day hmark. i ine during is time period; howev be ar clearance organ aterial fr ated
e the primary factors impairing water quality and aquatic life uses during this era based on unts by Anfinson (2003). A similar t ame was used by the oix Basin
Resources Planning Team when proposing water quality goals for Lake St. Cro
for contributing ecoregions (Table 2), 100 µg/L is in the range of an ecoregion-based
ated within the context of the ecoregions drained by the lake.
es days
s to
/L as compared to current levels (Table 6). However, the likelihood of reduced summer-mean C -a increases at 100 µg/L as compared to TP in the 150-200 µg/L range (Figure 17).
4. A summer-mean of 100 µg/L should be protective of downstream navigational pools 5-8 as well (Heiskary and Wasley 2010).
5. The State of Wisconsin promulgated TP standards for rivers and lakes. EPA approved the standards in December 2010. The Wisconsin standard for medium to large rivers, which would include the Mississippi River, is 100 µg/L (State of Wisconsin Natural Resources Board 2010). Sullivan (WDNR 2010, personal communication) and Baumann (WDNR 2010, personal communication) indicate this is Wisconsin’s intended criteria for Pepin as well.
abecomes even more acute as we seek to harmonize river, pool and Pepin standards, since river ww ake 303(d) as
ss all summents (He et al. 2010). ith this in mind
mer-meaniteria for Pepin
on the most recent 10 year r 303(d) nts. Total phosph criteri /L for Lake veral est100 µg/L, whspecific criterion. A summary follows.
however pre-European P has not been the primary basis for establishing Minnesota’s lake eutrophication criteria (Ta and 7).diatom-inferred TP for c1900-1960 (Est. #1 & #2 gure 1 his is an impo
ajor landant time
ance for n of c , cen
municipal wastewater and can serv ew a “m ” benc MississippRiver water-quality was not prist
ess sediment loads from land th and
er it can om untre
gued that wastewater exc
weric m
acco imefr St. Cr Waterix “….The
subcommittee determined that the third management option (c1940s) would be a reasonable goal in improving the water-resource conditions in Lake St. Croix (Davis 2004).”
2. In a short residence time system, like Pepin, inflow TP strongly influences in-lake TP (e.g. Figure 11a and Table 8). Based on data from typical streams (without major point sources)each of theestimate of inflow TP (80-100 µg/L), which further suggests that while it is an aggressive goal it is in the range of what might be anticip
3. Limiting the frequency of nuisance blooms is important to achieving aquatic recreational usin lakes. Summer-mean TP of 100 µg/L limits the frequency of blooms >50µg/L to <10per summer under most scenarios (equates to <10% of summer; Figure 18). Model runs for scenarios with overall Pepin TP near 100 µg/L indicate frequencies <2 days based on low-average flow and all summers (Table 8). A TP of 100 µg/L also should keep % blue-green15% or less over most years/scenarios (Figure 20). Summer-mean Chl-a will not decrease substantially at 100 µg
hl
33

Chlorophyll-a – A criterion of 28 µg/L, measured as a lake-wide summer average for all years, is proposed for Lake Pepin. Lake Pepin chlorophyll-a concentrations vary as a function of river flo(flushing t limitation via inorganic suspended solids and dissolv
w ed organic
carbon), ri yll-a (algae), and TP. This is in contrast to typical glacial lakes in Minnesota where chlorophyll-a can be routinely predicted based on in-lake TP (Figure 12) and where river-borne algae is considered an insignificant source. During high flow summers flushing rate and turbidity are the primary limiters of the amount of chlorophyll-a (algae) produced in Pepin and upstream. During average to low flow summers flushing rate and turbidity decline in significance, while river-borne algae and TP increase in significance. All of these factors can contribute in some degree to the variability in chlorophyll-a response even when years of somewhat similar flow are considered (Figure 19).
1. The 28 µg/L summer-mean goal was proposed at the onset of the Pepin TMDL model development as a desirable target (LTI 2007). It relates back to the 30 µg/L goal proposed by the Phosphorus Cooperators Group, which was to be applied between a flow range of 4,578 cfs (as measured at Prescott) to 20,000 cfs and desire to minimize nuisance blooms. Achieving 28 µg/L or lower across the range of all flows (years) should help assure that 30 µg/L is achieved in low to average flow years (Table 8).
2. The UMR-LP model predicts that nuisance blooms (Chl-a >50 µg/L) are unlikely to occur when summer-mean Chl-a is at or below 28 µg/L based on four summers and flow ranges tested (Table 8 and Figure 19).
3. Force and Macbeth (2002) in their conclusion of their user perception study note … “With a mean concentration of 34.1 ug/L for samples taken when recreational suitability was rated as 3 (swimming and aesthetic enjoyment slightly impaired because of algae levels), it appears that the water quality goal of less than 30 µg/L was a good approximation of acceptable water
ke Pepin based on volunteers’ ratings of recreational suitability.” 4. Achieving 28 ug/L as a whole-lake average in Pepin ensures low Chl-a at the outlet of Pepin
(Table 8) and should be protective of aquatic recreational uses in downstream Pools 5-8. Evaluating Lake Pepin for attainment of site specific criteria - Since the LTRMP fixed site network was the primary data set used to support the listing of Lake Pepin and site specific criteria development it is anticipated this sampling program will be the primary mechanism for assessing progress on the TMDL. This implies data collection will continue at the four fixed sites, with one in the upper segment and three in lower segment along the thalweg of the lake (Figure 1). The lake will be assessed for compliance with the site specific criteria as a part of the 303(d) assessment process. Consistent with that process the most recent 10 years of data will be averaged and compared to the site specific criteria. One exception to the use of the complete 10 year record would be if a significant trend (e.g. Pepin TP falls below criterion) was noted that could be associated with specific point and nonpoint source reductions that were conducted as a part of TMDL implementation. In that instance, a shorter record (a minimum of two-three summers) could be used to assess compliance with the criteria. This exception is consistent with the 303(d) assessment guidance and TMDL (MPCA 2007). MPCA would not delist due to consecutive drought years in the Minnesota River Basin. Additional considerations for assessing Lake Pepin are river flow and residence time. Site specific eutrophication standards for reservoirs are intended to be protective over the range of flows where the reservoir exhibits adequate residence time to be considered “lake or reservoir-like” but above critical
critical to determine
confirmed that Tw >11-14
rate), turbidity (lighver-borne chloroph
quality in La
low flow periods (defined as the one-in ten year 122 day Q10). This calculation isif a riverine lake is indeed a lake (>14 day residence time) or more a river (<14 day residence time). The empirical data (e.g. Figures 4, 9 and 13) and LimnoTech modeling has days is indeed a reasonable threshold where Lake Pepin begins to exhibit more “reservoir or lake-like”
be met in all years and characteristics. However, because aquatic recreation uses are required to
34

criteria for Pepin should also be protective of downstream waters (Pools 5-8 in this instance) the proposed criteria are intended to be applied over all summers, rather than specifically low-average flow summers. As such, the TP (100 µg/L) and Chl-a criteria (28 µg/L) are established to provide protection of aquatic recreational uses for Lake Pepin and the downstream pools and should be applicable over the range of flows from which the criteria were developed. While emphasis has been placed on meeting aquatic recreational uses these criteria should be protective of aquatic life uses as well. Recent MDNR fishery assessments for Pepin and Pool 4 indicate a healthy and robust fishery (Dietermann 2009). Meerbeek (2009) notes … “They have found submerged aquatic vegetation to be scarce in and above Lake Pepin and along the main and secondary channels; however since 2004 LTRMP biologists have documented increasing trends of
ercent frequency of occurrence of submersed floating-leaf and emergent vegetation in upper and
rve to atic life uses.
plower Pool 4. The isolated and contiguous backwaters below Pepin are generally rich in submerged species.” Achieving the TP and Chl-a criteria and reductions in TSS (turbidity TMDL) should sefurther improve habitat and support aqu
35

References Anfinson, J. 2003. The River We Have Wrought: A History of the Upper Mississippi. UniversityMinn. Press, Minneapolis MN 365 p. Baumann, J. 2010. Personal communication to Special Assistant to Director, Bureau of Watershed Management, WDNR. Davis, P. 2004. St. Croix Basin Phosphorus-Based Water Quality Goals Report on the recommendedwater quality goals of the St. Croix Basin. St. Croix Basin Water Resources Planning Team.
of
ietermann, D. 2009. Major River and Stream Survey Report: Survey of Mississippi River Pools
Lake a,
ppi River: mass-balance reconstructions from the sediments
e:
isheries. Vol. 39. Doc. 958.
3. Mississippi iver Phosphorus Study. MPCA, St. Paul Minnesota
and
., E.B. Swain and M.B. Edlund. 2004. Reconstructing historical water quality in innesota lakes from fossil diatoms. MPCA Environ. Bulletin. September (Number 4) 8 pp.
D3,4,5,5a,7, upper 9 and Lower Vermilion River. Section of Fisheries. MDNR Engstrom, D.R., and J.E. Almendinger. 2000. “Historical Changes in Sediment and Phosphorus Loading to the Upper Mississippi River: Mass-balance Reconstructions from the Sediments ofPepin.” Final Report to MCES. St. Croix Watershed Research Station, Science Museum of MinnesotMarine on St. Croix, Minnesota. Engstrom, D.R., J.E. Almendinger and J.A. Wolin. 2009. Historical changes in sediment and phosphorus loading to the upper Mississiof Lake Pepin. Jour. of Paleolimnology 41:563-588. Force, G. and E. Macbeth. 2002. Volunteer Water Quality Monitoring of Lake Pepin and Spring Laka Citizen Monitoring Network on the Mississippi River. 1994-1998 Five Year Summary. Minnesota Boundary Area Commission report to Metropolitan Council Environmental Services. Galtshoff, P.S. 1924. Limnological observations in the Upper Mississippi. Bulletin of Bureau of F Heiskary, S. A. 1993. Lake Pepin Water Quality Goal Setting. Section 9. Mississippi RiverPhosphorus Study. MPCA, St. Paul MN Heiskary, S.A. and M. Vavricka. 1993. Lake Pepin Water Quality: 1976 – 1991 Section R Heiskary, Steven. A and William W. Walker, Jr. 1995. “Establishing a Chlorophyll a Goal for a Run-of-the-river Reservoir.” Lake and Reservoir Management 11(1): 67-76. Heiskary, S. and H. Markus. 2001. Establishing relationships among nutrient concentrations, phytoplankton abundance, and biochemical oxygen demand in Minnesota, USA, rivers. LakeReserv. Manage. 17(4):251-262 Heiskary, S.AMhttp://www.pca.state.mn.us/publications/environmentalbulletin/tdr-eb04-04.pdf Heiskary, S. and C.B. Wilson. 2008. Minnesota’s approach to lake nutrient criteria development. Lakeand Reserv. Manage. 24:282-297 Heiskary, S. and D. Wasley. 2010. Mississippi River Pools 1 through 8: Developing River, Pool and Lake Pepin Eutrophication Criteria. MPCA, St. Paul MN.
36

37
l
cCabe, G.J. and D.M. Wolock. 2002. A step increase in streamflow in the conterminous United
ul
of
Secchi disks. Arch. Hydrobiol. Spec. Issues
Megard, R.O. 2006. Controls of Secchi transparency in Lake Pepin and its major tributaries. Metropolitan Council Environmental Services (MCES). 2002. Lake Pepin Phosphorus Study: effects of Phosphorus Loads on the Water Quality of the Mississippi River, Lock & Dam 1 through Lake Pepin. Final Report by Metropolitan Council Environmental Services, St Paul, MN Minnesota Pollution Control Agency. 2005. Lake Pepin Watershed TMDL Project for Eutrophication and Turbidity Impairments: Work Plan. St. Paul, MN. Minnesota Pollution Control Agency. 2007. Lake Nutrient TMDL Protocols and Submittal Requirements. http://www.pca.state.mn.us/publications/wq-iw1-10.pdf
LTI. 2007. Upper Mississippi River –Lake Pepin Water Quality Model: Development, ProvisionaCalibration, and Preliminary Application. Prepared for MPCA by LimnoTech, Ann Arbor MI. LTI. 2008. Upper Mississippi River-Lake Pepin water quality model: development, calibration andapplication. Prepared for MPCA by LimnoTech, Ann Arbor MI. MStates. Geophysical Res. Letters. Vol. 29 #24 (38):1-4 McCollor, S. and S. Heiskary. 1993. Attainable stream water quality by ecoregion. MPCA, St. PaMN Meerbeek, J. 2008. Large Lake Monitoring Annual Completion Report: Lake Pepin: 2008. SectionFisheries, MDNR. Megard, R.O. 2000. Diagnosis of light attenuance withAdvanc. Limnol.55: 169-178.
Minnesota Rules Chapter 7050. 2008. Standards for the protection of the quality and purity of the waters of the state. Revisor of Statutes and Minnesota Pollution Control Agency. St. Paul, MN. https://www.revisor.leg.state.mn.us/rules/?id=7050.0222 Pridmore, R. and G. McBride. 1984. Prediction of chlorophyll-a concentrations in impoundments of short hydraulic residence time. J. Environ. Manage. 19:343-350. Redder, T. and J. DePinto. 2009. Response to comments regarding Lake Pepin TP calibration. Memorandum to MPCA staff. State of Wisconsin Natural Resources Board. 2010. Proposed order to amend ch. 217 (various sections) relating to various phosphorus water quality standards criteria and effluent limits. WT-25-08 Analysis prepared by Department of Natural Resources. March 1, 2010 version. Sullivan, J. 2010. Personal communication to Mississippi River Water Quality Specialist, WDNR. Wasley, D and S. Heiskary. 2009. Site Specific Eutrophication Criteria for Lake Pepin. pp. 186-211 in Proceedings of TMDL 2009 Conference, Water Environment Federation specialty conference, Minneapolis, MN August 9-12, 2009 Wright, H. E., K. Lease and S. Johnson, 1998. Glacial River Warren, Lake Pepin, and the environmental history of southeastern Minnesota. In C.J. Patterson (Ed), Contributions to Quaternary Studies in Minnesota. Minnesota Geological Survey Report of Investigations 49, Minneapolis, MN: 131-140.