
Lake Michigan’s Green Bay: Why the Dead Zone? What is...
34
Lake Michigan’s Green Bay: Why the Dead Zone? What is Needed to Prevent It? Kevin Fermanich, Paul Baumgart, UW – Green Bay 2015 Science-Policy Confluence Conference: Great Lakes Nutrient Management and Water Quality Northwestern University, Chicago March 26-27, 2015
Transcript of Lake Michigan’s Green Bay: Why the Dead Zone? What is...

Lake Michigan’s Green Bay: Why the Dead Zone? What is Needed to Prevent It?
Kevin Fermanich, Paul Baumgart, UW – Green Bay
2015 Science-Policy Confluence Conference: Great Lakes Nutrient Management and Water Quality Northwestern University, Chicago March 26-27, 2015

nlcd_2011_landcover_2011_edition_2014_03_31.img
Land_Cover
Barren Land
Cultivated Crops
Deciduous Forest
Developed, High Intensity
Developed, Low Intensity
Developed, Medium Intensity
Developed, Open Space
Emergent Herbaceuous Wetlands
Evergreen Forest
Hay/Pasture
Herbaceuous
Mixed Forest
Open Water
Perennial Snow/Ice
Shrub/Scrub
Unclassified
Woody WetlandsLower
Fox
Upper Fox
Wolf R.
(NLCD 2011)
Veins of Green Bay are fed by
these landscapes and land-uses
*
*

RECENT VIEW OF THE GREEN BAY WATERSHED
the Bay

• Dairy has
significant role
in the
Green Bay
Watershed

LOADS NOT DECREASING • Fox River Export of Total P :
– ~ 575,000 kg/yr (1989-2014)
– ~ 615,000 kg/yr (Dolan, Chapra, 2012)
• Lower Fox Basin (LFB) (10% of area)
– ~42% of total P load
• Fox-Wolf Basin ~ 58% of TP load
New
London
Berli
n
Oshkos
h
Neenah/Menasha
Appleton
Wrightstown
DePere
Mouth
(Data Source: D. Robertson, USGS)

Wisconsin
Phosphorus
Rule
• Dec. 2010
• Set Criteria
• WPDES
permits
• Ag
performance
• LFR TMDL (2006-2012)
• Adaptive
Mgmt & P
Trading

27 Impaired Water Body Segments by
Phosphorus and/or Sediment
Approved TMDL 2006-2012
Water Quality criteria:
Lower Fox River: 0.10 mg/L TP
Tributary Streams: 0.075 mg/L TP
Map of Lower Fox River Basin and Green Bay
Source: TMDL Plan, WDNR 6/2010; 12/2011
The Mouth of the Fox River. April 12, 2011 Credit: Steve Seilo

LOWER FOX BASIN P SOURCES
• SWAT model developed from robust monitoring
• Reduction target of 59% overall (LFB)
• Note magnitude of Loads
~114,000 kg
<91,000 kg
~40,000 kg
(from 2012 TMDL report)

TRENDS IN FOX RIVER TP EXPORT TO GREEN BAY
AND WWTP DISCHARGES
0
100
200
300
400
500
600
700
800
900
1,000
1,100
1,200
19
89
19
90
19
91
19
92
19
93
19
94
19
95
19
96
19
97
19
98
19
99
20
00
20
01
20
02
20
03
20
04
20
05
20
06
20
07
20
08
20
09
20
10
20
11
20
12
20
13
20
14
Ph
osp
ho
rus
(1,0
00
kg)
Total Load at Fox River MouthLower Fox MunicipalLower Fox IndustrialUpper Fox Munic. + Indus.Wolf Munic. + Indus.
(Data Sources: Fox R. Loads: D. Robertson, USGS; Discharge data: WDNR; graph by UWGB)
TMDL
Target

May 2012
Fox River
to Green Bay What about landscape sources?
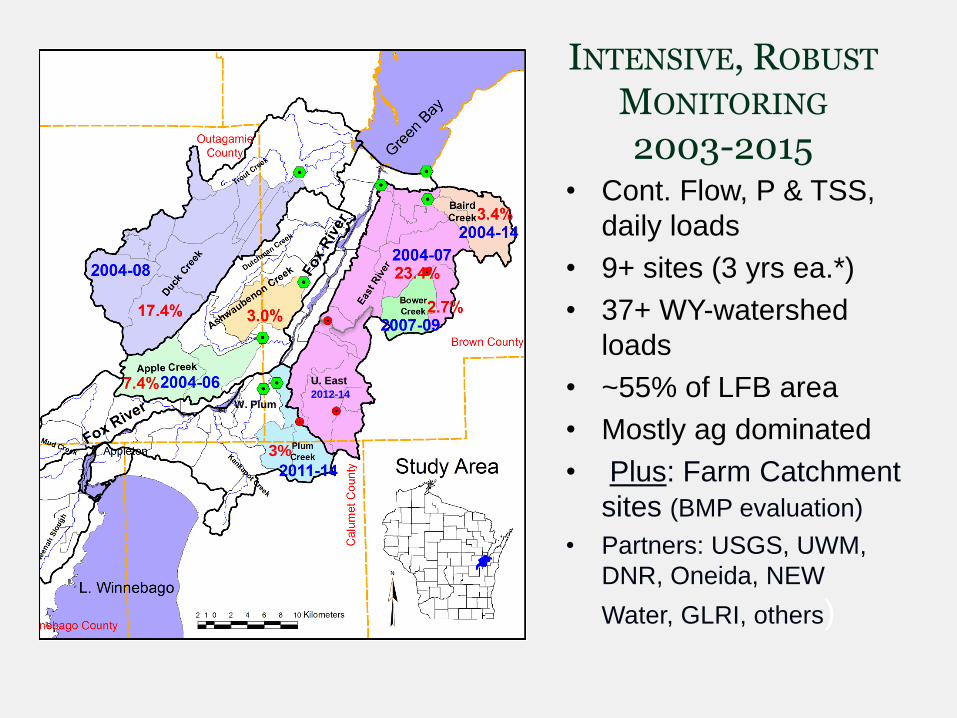
INTENSIVE, ROBUST MONITORING 2003-2015
• Cont. Flow, P & TSS,
daily loads
• 9+ sites (3 yrs ea.*)
• 37+ WY-watershed
loads
• ~55% of LFB area
• Mostly ag dominated
• Plus: Farm Catchment
sites (BMP evaluation)
• Partners: USGS, UWM,
DNR, Oneida, NEW
Water, GLRI, others)
3%
U. East
2012-14 W. Plum

CONCENTRATION DISTRIBUTIONS 2004-2014
• Most tributary
watersheds much
above targets
• Smaller, Ag-dominated
largest values
• High conc. observed
in 2014
0.075
Median TP concentrations for
Storm/Event and Base flow samples:
Approximate
Target
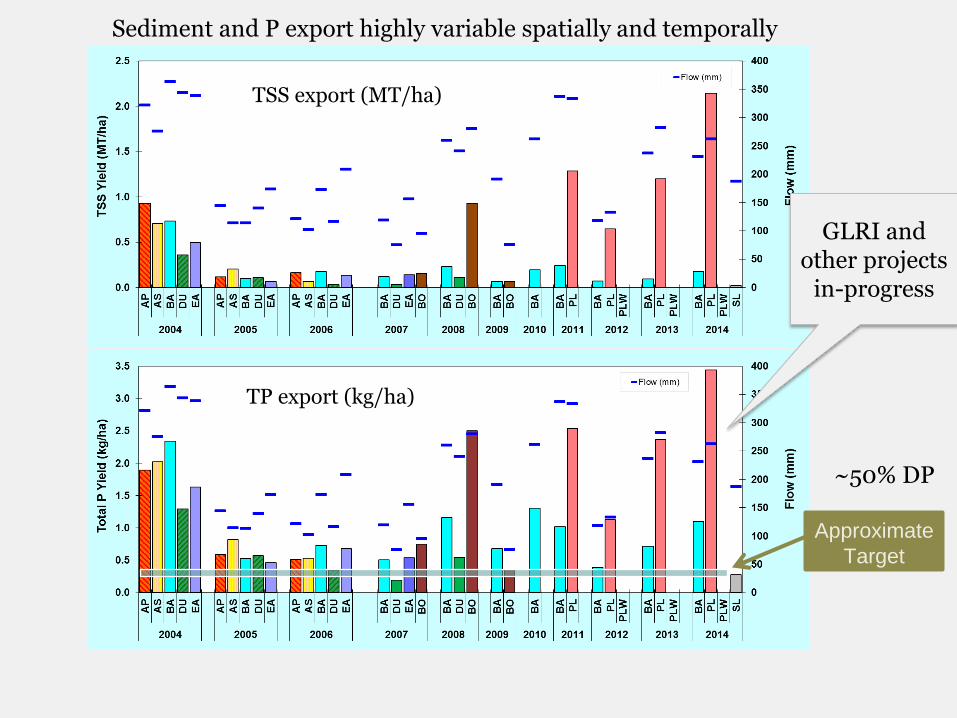
~50% DP
GLRI and other projects
in-progress
Sediment and P export highly variable spatially and temporally
TSS export (MT/ha)
TP export (kg/ha)

TRIBUTARY EVENT DRIVEN LOADS
5 LFR Tribs, WY04-06:
• 65% of the annual P load
• 80% of the annual TSS load
…exported to the Fox River in only
14 days per year on average
Lower Fox Watersheds- P
0%
10%
20%
30%
40%
50%
60%
70%
80%
90%
100%
0% 1% 10% 100%
Cumulative time percentage
Cu
mu
lati
ve
% o
f P
ho
sp
ho
rus
Lo
ad
P%-Apple
P%-Ash
P%-Baird
P%-Duck
P%-East
U.S. Geological Survey
Scientific Investigations
Report 2011–5111, 28

MFC 5 May 6, 2012
Field level Observations

0
0.5
1
1.5
2
2.5
3
3.5
4
1 2 3 4 5 6 7 8 9 10 11 12 13 14 15 20 21 Main
Source area P Concentrations
Site
Tota
l Ph
osp
ho
rus
(mg/
l) Dissolved Phosphorus
Particulate Phosphorus
• Variation among sites and events (n= 67) • TP Median = 1.03 mg/L • Only 2 samples < 0.5 mg/L TP

Influence of Management
MFC 15

Runoff Dissolved P linked to
Soil P levels
0.00
0.20
0.40
0.60
0.80
1.00
1.20
1.40
1a 1b 2a 2b 3 4 5a 5b 8a 8b 8c INT-3 INT-4 INT-6 INT-7 Main
Monitoring Sites
Dis
so
lve
d P
ho
sp
ho
rus
(m
g/L
)
Low
Excessive
2a
2b
3
4
5a5b
8a
8b
8c
1a
y = 0.005x + 0.0085
R2 = 0.8293
0
0.1
0.2
0.3
0.4
0.5
0.6
0 20 40 60 80 100 120
Weighted Ave. Soil Test P (Bray P1 - mg/kg)
To
tal D
iss
olv
ed
Ph
os
ph
oru
s (
mg
/L)

TSS Total P % reduced Sed-P
BMP Scenarios (ton) (kg) TSS Total P (kg)
Baseline 2004 Conditions 9,700 25,800 0 0 12,400
1. Nutrient Management: Dairy P Feed Ration: Reduce by 25%
(implement 90%) 9,700 24,500 0.0% 4.7% $13,600
2. Nutrient Management: incorporate 85% of manure (from 50%) 9,700 24,200 0.1% 6.2% $13,300
3. Nutrient Management: Stabilize Soil P (implement 90%) 9,700 22,700 0.0% 11.9% $12,400
4. Conservation Tillage - CT40%, MT45%, RT15% 7,700 23,400 20.5% 9.0% $10,600
5. Cover Crops on corn silage and some soybean fields 9,400 25,400 2.5% 1.2% $10,100
6. Buffer Strips installed on 100% of 1:24k hydrology streams 9,200 24,400 5.1% 5.1% $9,400
7. Reduce Soil P to 25 ppm (implement 35%) 9,700 20,800 0.0% 19.4% $8,600
8. Biofuel Switchgrass crop; 7% of total crop acres 9,200 24,800 4.9% 3.6% $8,200
9. Combination - ALL BMP's 6,699 16,257 30.8% 36.9% $7,593
IMPACT OF ALTERNATIVE SCENARIOS ON TSS AND PHOSPHORUS NON-POINT LOADS TO
GREEN BAY FROM PLUM-KANKAPOT CREEK WATERSHED
(MOSTLY AG: LF-03 = 218 KM2 OR ~ 13% OF LFR AREA)
From: Lower Fox River and Green Bay TMDL, unpublished values from P. Baumgart, UWGB

0
1
2
3
4
5
6
7
8
9
10
0 0.5 1 1.5
Watershed Phosphorus Yields (kg/ha)
P-
Ind
ex
PI after 590 compliance
PI to meet water quality goals
PI before 590 compliance
ACHIEVING WATER QUALITY GOALS WITH THE
WISCONSIN P-INDEX
• Will compliance with nutrient mgmt. standards meet
water quality goals?
(Hypothetical graph created by P. Baumgart 2006)
Continued Improvements:
• Model functionality
• Data inputs and implementation
• Auditing
However, area-weighted PIs show general
compliance but water quality goals a long
way off…

IMPROVING SOIL HEALTH FOR
WATER QUALITY AND
PRODUCTIVITY: LFR DEMO FARMS
Field-Scale Baseline Assessment • 800 acres on 4+ farms • ~200 samples from a 2.5 ac “grid”
sampling (n=400 samples) • 10 core composite (7”) • 4-5 yr follow-up

Late Fall 2014: “..field conditions…parallel last year [Fall 2013]”
What is the combined impact of poor weather on net watershed P export? (short-
term and long term)
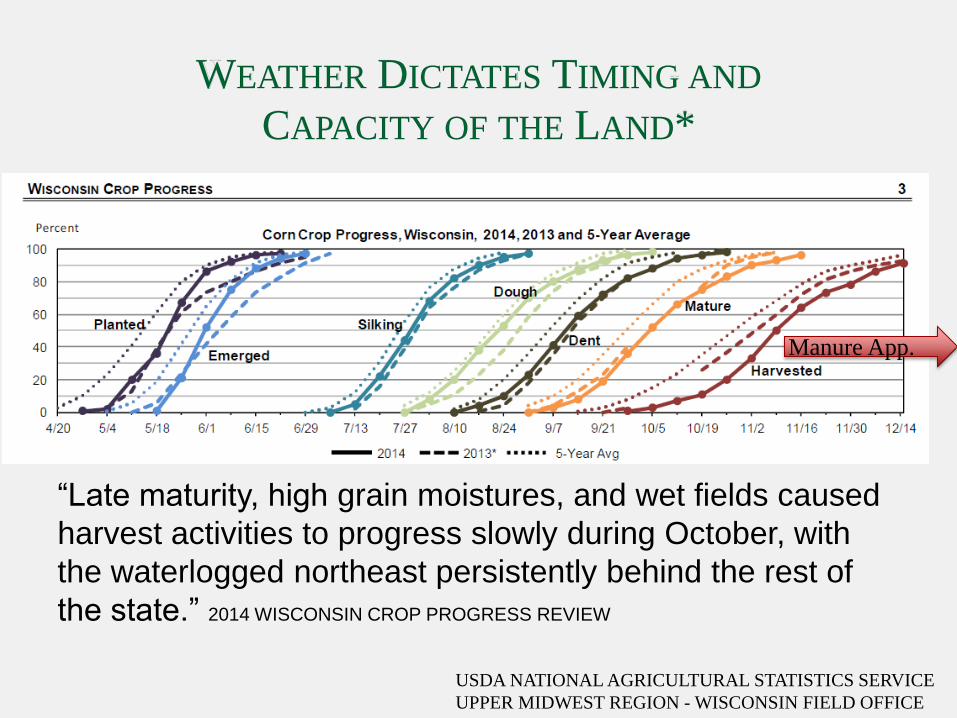
WEATHER DICTATES TIMING AND
CAPACITY OF THE LAND*
“Late maturity, high grain moistures, and wet fields caused
harvest activities to progress slowly during October, with
the waterlogged northeast persistently behind the rest of
the state.” 2014 WISCONSIN CROP PROGRESS REVIEW
Manure App.
USDA NATIONAL AGRICULTURAL STATISTICS SERVICE
UPPER MIDWEST REGION - WISCONSIN FIELD OFFICE
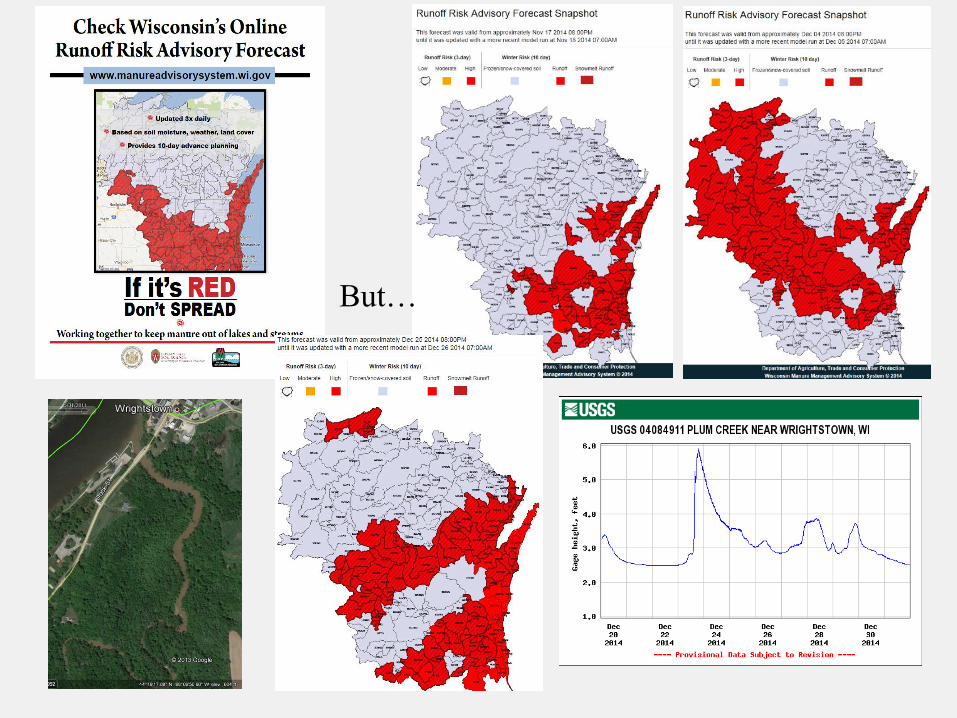
But…
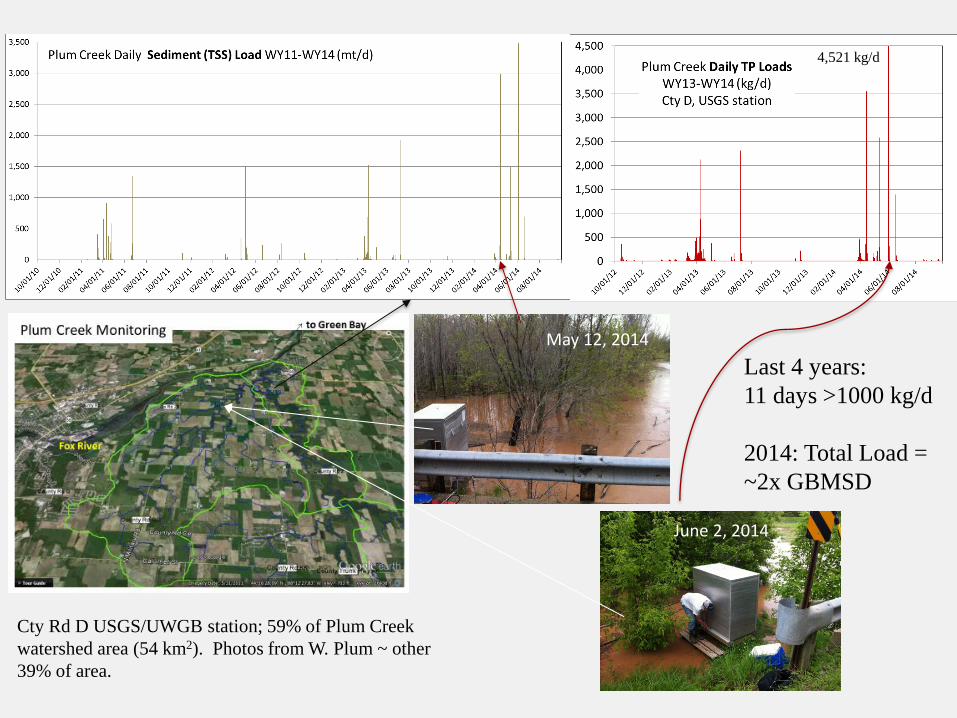
June 2, 2014
May 12, 2014
Cty Rd D USGS/UWGB station; 59% of Plum Creek
watershed area (54 km2). Photos from W. Plum ~ other
39% of area.
4,521 kg/d
Last 4 years:
11 days >1000 kg/d
2014: Total Load =
~2x GBMSD

CHALLENGES NOW & AHEAD
• Concentrations and loads from ag watersheds well
above targets
• Landscape is vulnerable to loss and export
– Especially during suboptimum (risky) conditions for manure
applications
– Events: reduce risks
• Dissolved P is significant
• Ag sources significant contributors
– Current nutrient management approaches will not get us to WQ goals
(PI = 6)
– Known practices can reduce losses and vulnerability
– lower soil P levels, cover crops, grass, etc.,
– Soil Health initiatives?
– Farmer engagement increasing
– Cows (manure P) vs. cropland acreage
– Tile drainage inputs and management (?)

CHALLENGES NOW & AHEAD • U. Fox and Wolf modeling and TMDL (40% GB load)
• It’s critical that watershed managers and
stakeholders devise comprehensive programs and
implementation strategies that reduce vulnerabilities
and minimize risks, not only during high runoff times
of the year, but also during years with significant
weather constraints for dairy agriculture operations.
• Climate change build resiliency
• Models that link Watershed & Bay – watershed P export WQ endpoints in the bay
• Adaptive Mgmt., Fox P-Trade….
• Can we change to meet the challenge?
Brinkley in
“Green” Bay
July 4, 2014 Stephen Deadman
4/12/2011
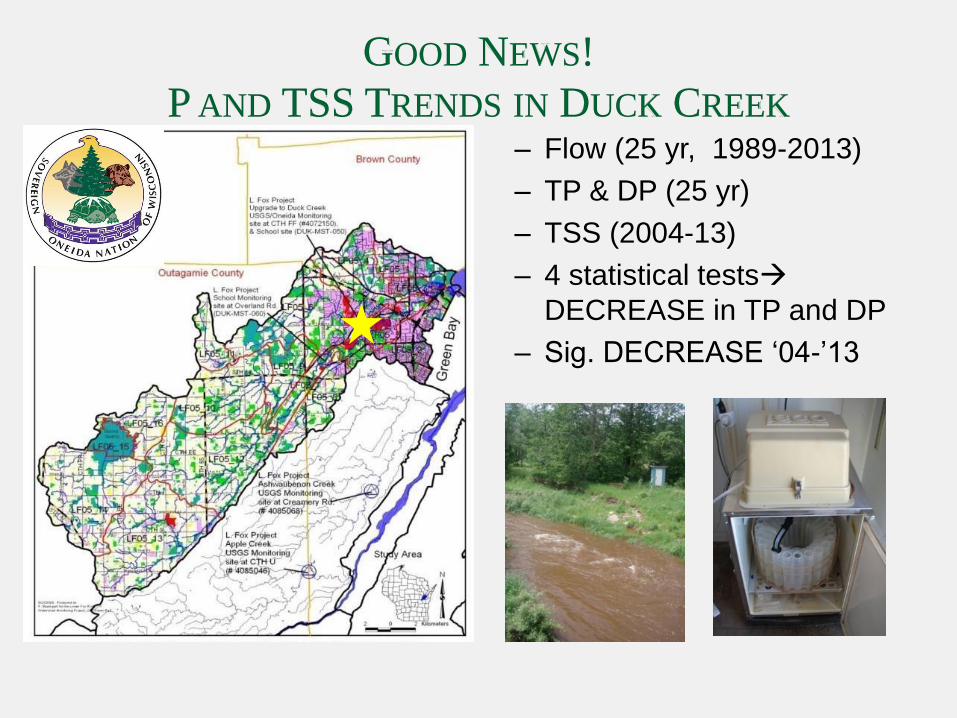
GOOD NEWS!
P AND TSS TRENDS IN DUCK CREEK – Flow (25 yr, 1989-2013)
– TP & DP (25 yr)
– TSS (2004-13)
– 4 statistical tests
DECREASE in TP and DP
– Sig. DECREASE ‘04-’13
29
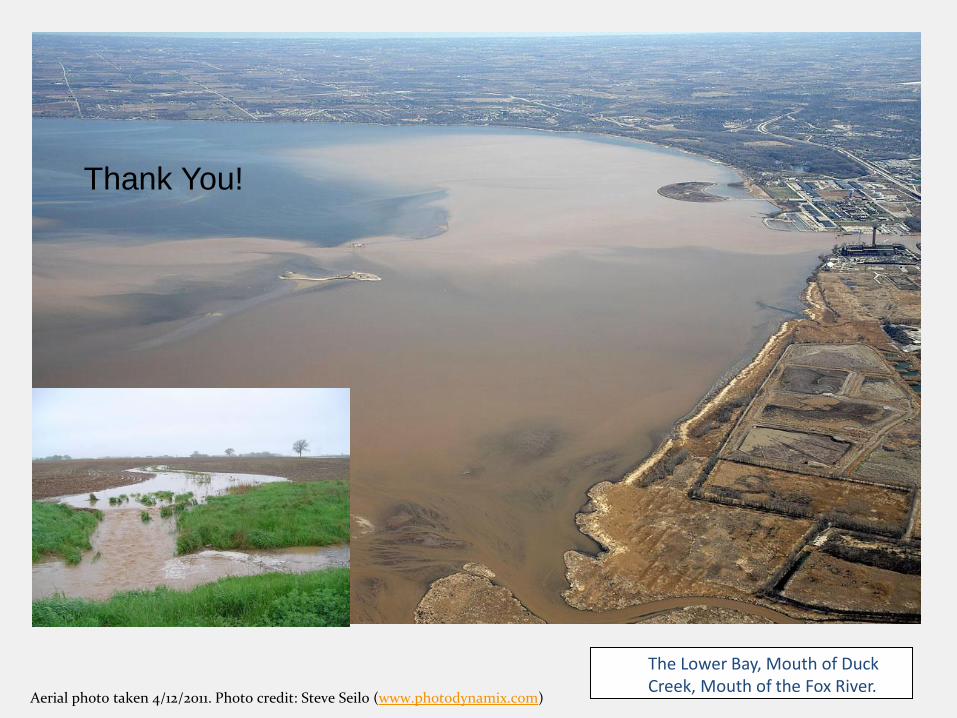
The Lower Bay, Mouth of Duck Creek, Mouth of the Fox River.
Aerial photo taken 4/12/2011. Photo credit: Steve Seilo (www.photodynamix.com)
Thank You!

PARTNERS: Cooperators
• UW-Green Bay, UW-Milwaukee
• NOAA; US Geological Survey
• U. Mich Water Center, WDNR
• Arjo Wiggins Appleton Ltd
• GBMSD, Oneida Tribe of Indians
• 11 High Schools
• US Environmental Protection Agency
Environmental Science and Policy Graduate Program Students: Alexis Heim, Andrew Docter (soil health poster later) Marty Jacobson, Dan Cibulka, Nick Reckinger many other students Lower Fox River Watershed Monitoring Program (www.uwgb.edu/WATERSHED) Natural & Applied Sciences Dept. University of Wisconsin-Green Bay

0
10
20
30
40
50
60
0
200
400
600
800
1000
1200
19
89
19
90
19
91
19
92
19
93
19
94
19
95
19
96
19
97
19
98
19
99
20
00
20
01
20
02
20
03
20
04
20
05
20
06
20
07
20
08
20
09
20
10
20
11
20
12
20
13
20
14
% O
rth
o-P
10
00
kg/
yr
Phosphorus Load at Mouth of Fox River, Green Bay
Particulate P
Ortho-P
% Ortho-P
(Data Source: D. Robertson, USGS)

LOWER FOX RIVER TARGETS LINKED TO
BIOLOGICAL RESPONSES
• Lower Fox River TMDL (Cadmus (WDNR/EPA/Oneida) 2011, 2012)

PLUM Creek at USGS Station
Flow (mm) Sed (ton) P (kg)
WY2011 333 6,979 13,811
WY2012 133 3,509 6,122
WY2013 282 6,504 12,868
WY2014 262 11,651 18,691
average 253 7,161 12,873
yields 333 1.32 2.37
May 12, 2014


![[Solution] numerical methods for engineers chapra](https://static.fdocuments.us/doc/165x107/5579f361d8b42abc2e8b4a30/solution-numerical-methods-for-engineers-chapra-558492b1d741a.jpg)