LAKE LIVINGSTON - University of Texas at Austin
47
LAKE LIVINGSTON 1991 SEDIMENTATION SURVEY Owned and Operated by the Trinity River Authority of Texas Lake Livingston Project US. Department of the Interior Bureau of Reclamation
Transcript of LAKE LIVINGSTON - University of Texas at Austin

LAKE LIVINGSTON1991 SEDIMENTATION SURVEY
Owned and Operated by the Trinity River Authority of TexasLake Livingston Project
US. Department of the InteriorBureau of Reclamation

7-2090 14-81)Bureau of Reciamation TECHNICAL REPORT STANDARD TITLE PAGE
1. REPORT NO. 3. RECIPIENTS CATALOG NO.
4. TITLE AND SUBTITLE 5. REPORT DATE
LAKE LiVINGSTON SEDIME TAMay 1993
- 1991 N TIONSURVEY
6. PERFORANG ORGANIZATION CODE
D-57537. AUTHOR(S) 8. PERFORMING ORGANIZATION
Ronald L. FerrariREPORT NO.
9. PERFORMING ORGANIZATION NAME AND ADDRESS 10. WORK UNIT NO.
B f R l iureau o ec amat onDenver Office
11. CONTRACT OR GRANT NO.
D CO 802enver 25 13. TYPE OF REPORT AND PERIOD COVERED12. SPONSORING AGENCY NAME AND ADDRESS
DIBRSame
14. SPONSORING AGENCY CODE
______________________________________________________D-5753
15. SUPPLEMENTARY NOTES
Microfiche and hard copy available at the Denver Office, Denver, Colorado. Ed: TH
16. ABSTRACT
The Bureau of Reclamation Sedimentation Section surveyed Lake Livingston in 1991 to gatherdata needed to compute the capacity of the lake for reservoir operation. The data were also usedto calculate the volume of sediment that has accumulated in the lake since water storage beganin June 1969. Reclamation's large vessel system was used to collect range line data. Theremaining data were collected by Reclamation's small boat bathymetric system. The 1991reservoir surface areas were computed by the Width Adjustment Method. The storage-elevationrelationships based on the 1991 underwater survey data were developed using Reclamation'sarea-capacity computer porgram ACAP85.
The 1991 survey determined that the reservoir has a storage capacity of 1,741,867 acre-feet anda surface area of 83,277 acres at the top of conservation storage elevation 131.0. Since closure in1969, the reservoir has accumulated a volume of 64,227 acre-feet of sediment below elevation131.0. This volume represents a 3.56-percent loss in total capacity and an average annual loss of2,854 acre-feet for the operation period of June 1969 through December 1991.
17. KEY WORDS AND DOCUMENT ANALYSISa. DESCRIPTORS- reservoir area and capacity! sedimentationl reservoir surveys! sonar!sediment distribution! contour area! reservoir area! sedimentation survey!
b. IDENTIFIERS- Lake Livingston! Trinity River Authority!
c. COSATI Field/Group 13/B COWRR: 1302.66 SHIM:18. DISTRIBUTION STATEMENT 19. SECURITY CLASS 21. NO. OF PAGES
(THIS REPOF)T) 45UNCLASSIFIED
20. SECURITY CLASS 22. PRiCE(THIS PAGE)UNCLASSIFIED

LAKE LIVINGSTON
1991 SEDIMENTATION SURVEY
Lake Livingston Project Owned and Operated byTrinity River Authority of Texas
1991 Sedimentation Survey Report prepared by
RONALD L. FERRARI
BUREAU OF RECLAMATIONEARTH SCIENCES DIVISIONSURFACE WATER BRANCHSEDIMENTATION SECTION
DENVER OFFICE
DENVER, COLORADO
1992
ACKNOWLEDGMENTS
The Bureau of Reclamation prepared and published this reportunder the supervision of Robert I. Strand, Head, SedimentationSection, Earth Sciences Division. The hydrographic survey wassupervised by Ronald Ferrari, Hydraulic Engineer, and assistedby Steven Hughes, Engineer Technician, of the Denver Office.Personnel from the Trinity River Authority at Livingston,Texas, assisted in the hydrographic survey. A private contractorfor the river authority performed the land survey required forthe hydrographic survey. Ronald Ferrari completed the dataprocessing, sediment computations, area-capacity tables, andthe report. Robert I. Strand and James 0. Blanton ifi,Hydraulic Engineer, consulted in the sediment computationsand report preparation.
Missiorn As the Nation's principal conservation agency, theDepartment of the Interior has responsibility for most of ournationally owned public lands and natural and culturalresources. This includes fostering wise use of our land andwater resources, protecting our fish and wildlife, preservingthe environmental and cultural values of our national parksand historical places, and providing for the enjoyment of lifethrough outdoor recreation. The Department assesses ourenergy and mineral resources and works to assure that theirdevelopment is in the best interests of all our people. TheDepartment also promotes the goals of the Take Pride inAmerica campaign by encouraging stewardship and citizenresponsibility for the public lands and promoting citizenparticipation in their care. The Department also has a majorresponsibility for American Indian reservation communitiesand for people who live in Island Territories underU.S. Administration.
The information contained in this report regarding commercialproducts or firms may not be used for advertising orpromotional purposes and is not to be construed as anendorsement of any product or firm by the Bureau ofReclamation.
ii

Co NTENTS
............................................
....................................
........................................
.......................................................................................
................................
....................................................................
......................................
...............................................................................
........................................................
.............................................
.......................................................
.................................................................
...................................................
............................
............................
....................................................
................................................................................
..................................................
......................................................................................................................................
.........................................
Page
1Introduction
2Summary and conclusions
2Description of basin
Surveys 3Survey history 3Survey methods and equipment 4
Reservoir sediment distribution 5Longitudinal distribution 5Lateral distribution 5
Sediment analyses 61991 surface areas 61991 revised storage capacity 6Reservoir sediment accumulation and summary 7
8References
TABLESTable
91 Reservoir sediment data summary112 Summary of 1991 survey results
FIGURESFigure
1 Lake Livingston vicinity and drainage area map 132 Lake Livingston range location map (1 of 2) 153 Lake Livingston range location map (2 of 2) 174 Longitudinal profile - Trinity River 195 Sediment Range 101 (1A) - Trinity River 206 Sediment Range 1 - Trinity River 217 Sediment Range 2 - Trinity River 228 Sediment Range 3 - Trinity River 239 Sediment Range 301 (3A) - Trinity River 24
10 Sediment Range 4- Trinity River 2511 Sediment Range 5- Kickapoo Creek 2612 Sediment Range 6 - Kickapoo Creek 2713 Sediment Range 601 (6A) - Kickapoo Creek 2814 Sediment Range 7 - Trinity River 2915 Sediment Range 701 (7A) - Trinity River 3016 Sediment Range 8 - Trinity River 3117 Sediment Range 9 - Trinity River 3218 Sediment Range 10 - Trinity River 3319 Sediment Range 11 - Trinity River 3420 Sediment Range 12 - White Rock and Caney Creeks 3521 Sediment Range 121 (12A) - Caney Creek 36
ill
.........................................................................................................................................................................................
.......................................
CONTENTS- ContinuedFIGURES- Continued
Figure Page
22 Sediment Range 122 (12B) - White Creek 3723 Sediment Range 13- Trinity River 3824 Sediment Range 14- Trinity River 3925 Sediment Range 15- Trinity River 4026 Sediment Range 16- Trinity River 4127 Sediment Range 17- Trinity River 4228 Sediment Range 18- Trinity River 4329 Width adjustment method for revising contour areas 4430 Area and capacity curves - Lake Livingston 45
iv

INTRODUCTION
Livingston Dam was a major step taken by the City of Houston, in cooperation with the ThA (TrinityRiver Authority), to develop a source of water primarily for the expanding industry in the HoustonIndustrial Complex. TRA built, owns, manages, and operates the dam, reservoir, and recreationalfacilities associated with the project. Construction of the dam was completed in September 1968. Waterstorage operations began in June 1969. The dam, located on the Trinity River, is about 7 milessouthwest of Livingston and 75 miles north of Houston (fig. 1). The reservoir impounded by the dam liesin Polk, San Jacinto, Walker, and Trinity Counties, and extends upstream about 36 air miles. Thereservoir provides a multi-purpose project with the developed municipal and industrial water supply,fish and wildlife resources, and recreational uses.
TRA is a political subdivision charged by Texas legislative mandate with three functions:
• Maintaining a master plan for basin wide development.
• Serving as local sponsor for Federal water projects.
• Providing authorized services such as water and wastewater treatment, flood control, andrecreational, hydroelectric, navigational, and reservoir facilities.
TRA operates as a governmental utility receiving no direct tax revenues or revenue sharing and iscompensated for services rendered by each facility which is financed independently. These facilities arelocated throughout the basin from Dallas-Fort Worth to Houston.
The dam axis extends across the Trinity River about 11 river miles upstream from the U.S. Highway 59Trinity River crossing. The dam is a rolled earthfill embankment structure consisting of an imperviouscenter core section with an average structural height of 55 feet. The dam crest has a maximum elevationof 145 feet, mean sea level, which is 90 feet above the original streambed. The dam has a crest length,including spillway, of 13,480 feet, with an average base width of 310 feet and crest width of 24 feet. Thespillway, located near the left end of the dam, is a 646-foot reinforced concrete gravity structurecontrolled by twelve 40- by 32-foot tainter gates with a discharge capacity of 313,000 ft3/s (cubic feet persecond) at maximum design water surface elevation 135.0. The outlet works for low-flow releases arelocated in a vertical concrete multi-gated inlet tower. Five gated openings are located at variouselevations, minimum elevation 58.0, in the tower. All openings discharge into a 10-foot-diameterconcrete conduit constructed through the dam.
Lake Livingston has a length of 55 miles and an average width of 0.42 miles at the normal poolelevation of 131.0. The average width is determined by dividing the surface area by the reservoir lengthat elevation 131.0. The total Trinity River drainage area above Livingston dam, which is 360 miles inlength, is 16,583 square miles, of which 8,423 square miles contribute sediment inflow.

At the beginning of operations in 1969, the reservoir at maximum elevation 135.0 had a calculatedsurface area of 91,000 acres with a capacity of 2,135,324 acre-feet. This capacity included347,200 acre-feet of flood surcharge between elevation 131.0 and 135.0, 1,787,773 acre-feet of
conservation between elevation 58.0 and 131.0, and 351 acre-feet of inactive storage below elevation
58.0. At elevation 131.0, top of conservation, the calculated surface area was 82,600 acres with a
capacity of 1,788,125 acre-feet.
SUMMARY AND CONCLUSIONS
This report presents the results of an investigation to monitor changes caused by sedimentaccumulations in Lake Livingston after 22.5 years of reservoir operations. It also describes the fieldsurveying procedures and equipment used in the 1991 investigation, and provides some data needed for
future surveys. The primary purpose of running the 1991 survey was to gather data needed to compute
the capacity of Lake Livingston for reservoir operation.
Standard land surveying methods were used to augment previously established horizontal control for
the survey. The hydrographic survey was completed using sonic depth recording equipment interfaced
with both an automated positioning system and a land based distance meter. The systems continuouslyrecorded reservoir depths and horizontal distances from fixed points as the boat was steered across therange line. Reservoir water surface elevations were used as control in converting the depthmeasurements to true bottom elevations.
Table 1 contains a summary of reservoir sediment data for the 1991 survey. The 1991 survey
determined that the reservoir has a storage capacity of 1,741,867 acre-feet and a surface area of83,277 acres at the top of conservation storage elevation 131.0. Since closure in 1969, the reservoir hasaccumulated a volume of 64,227 acre-feet of sediment below elevation 131.0. This volume represents a3.56-percent loss in total capacity and an average annual loss of 2,854 acre-feet for the operation period
of June 1969 through December 1991.
DESCRIPTiON OF BASIN
The Trinity River drainage basin is only 360 miles long, but the river, because of its meandering course,
is almost twice that length - 715 miles. The basin drops some 1,250 feet from North Central Texas to
its mouth at the Gulf of Mexico (fig. 1). The mean annual runoff of the drainage basin above Livingston
Reservoir is 4,925,000 acre-feet. The runoff was calculated using the average flow at the USGS (U.S.Geological Survey) gauge Trinity River at Riverside, Texas, which accounted for 94 percent of all
reservoir area inflow. The average at this gauge was 4,630,00 acre-feet for the measured 48 years ofrecord (January 1903 to December 1906 and October 1923 to September 1968). The gauge wasdiscontinued in 1968 because of the backwater affect of Lake Livingston. The total Trinity Riverdrainage area above Livingston dam is 16,583 square miles, of which 8,423 square miles contributesediment inflow. Several reservoirs are located on the river system within the basin above Lake
2

Livingston Dam as seen on the map. The net contributing area includes removal of the area of LakeLivingston and all areas above the upstream developed reservoirs that are assumed to trap all sedimentinflow. A listing of the reservoirs and their drainage areas, which were removed as nonsedimentcontributing, are listed in table 1 under item 47, Remarks and References.
SURVEYS
Survey History
The original sediment ranges were surveyed by a contractor for TRA prior to inundation of water behind
Livingston Dam. These data were stored in field books and were not processed and plotted until the
1991 study. The present survey contractor processed the data from the original notes for range lines 1
through 18. The range lines were plotted by Reclamation (Bureau of Reclamation) from left to rightbank looking downstream. For purposes of sediment computations, six additional range lines werelocated and surveyed in 1991. These range lines included and were labeled IA or 101, 3A or 301, 6A or
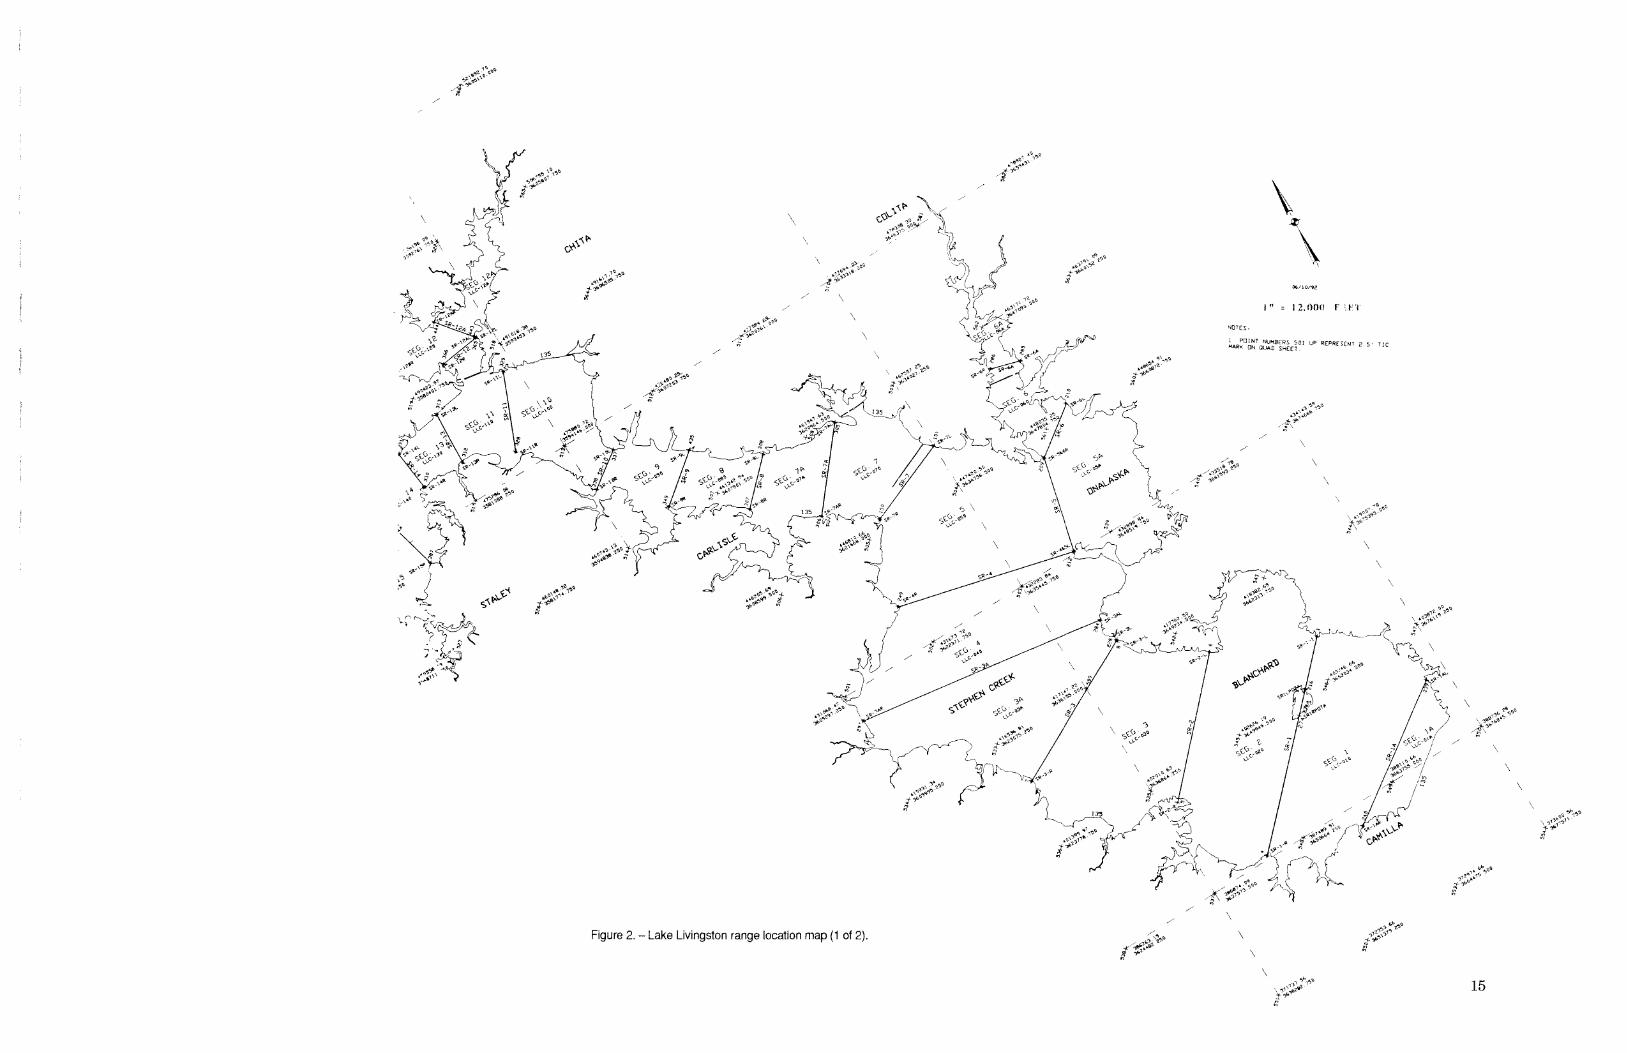
601, 7A or 701, 12A or 121, and 12B or 122 and 123. A layout of the reservoir sediment range system isshown on figures 2 and 3. The original distance versus elevation data for these added range lines wasdetermine from the 1972 photorevised USGS 7-1/2 quad maps of the reservoir area. The interpolateddata were smoothed using the 1991 collected data.
The total original surface areas for the 10-foot increments of Lake Livingston, elevation 60.0 through140.0, were obtained from the 1960 U.S. Geological Survey 7-1/2 minute quadrangle maps developedfrom photographic data obtained in 1958. For the purposes of the 1991 sedimentation analysis and tobetter represent storage changes, the reservoir was subdivided into segments using the rare lines todelineate the limit of each segmental boundary. The total original contour areas for all segments of therange-line network system were needed as input. These areas were obtained by a TRA contractor usinga computer digitizing program and the 1960 USGS 7-112 minute quad maps that were photorevised in
1972. The revised quads were used because a copy of the original 1960 maps was not located and it wasassumed that the uiiderwater contours on the revised maps were unchanged from the original. Thephotorevised maps have the reservoir area shaded in purple, which covered the original contours andmade interpretation of the contours difficult. The photorevised maps also had contours drawn for
reservoir elevations 131.0 and 135.0.
The contractor digitized the segmented areas of the 10-foot contours for elevations 60.0 through 130.0and the upper reservoir contour elevation 135.0. A listing of these digitized segmented surface areas wasmade available to Reclamation for analysis. A comparison of the total segmented areas with the originalareas found some disparities. The total segment areas for elevations 90.0 through 130.0 compared wellwith the original areas, but significant difference existed among the total areas at elevations 60.0, 70.0,and 135.0. A slight difference existed at elevation 80.0. Further investigation into these disparitiesconcluded that in addition to the problem of distinguishing the contours on the photorevised shadedmaps, the interpretation of the contour crossings at elevations 60.0, 70.0, and 80.0 was made moredifficult because they were located within the original river channel area. These problems were resolved
3

by using the original range line survey data. The cross section width at elevations 60.0, 70.0, and 80.0was calculated for the segments where the contours were located within the river channel. The contoursurface areas for the segments meeting these conditions were recalculated using the average width andriver channel length for each segment. A summation of these calculated areas compared well with the
total original areas and was used for the 1991 sedimentation analysis.
The summation of the digitized segmented areas for elevation 135.0 was found to be 3.8 percent higher(94,547 acres compared to 91,000 acres) than the original area at this elevation. This area was originallycalculated using measured surface area data at contour elevations 130.0 and 140.0 from the USGS quadmaps. For the 1991 sedimentation study, it was assumed that the digitized area at this elevation was
more accurate than the original calculated area and should be used to develop the new area capacitytables. This assumption has no bearing on the total sediment calculation because the collected datafound all measured changes to be below elevation 130. Because the original capacity data had to berecomputed for sediment computation purposes, it was decided to use this digitized area for elevation135.0.
Survey Methods and Equipment
The preliminary field work for the 1991 survey began in October and consisted of locating and flaggingthe existing sediment range end markers, relocating the destroyed ones, and establishing additionalpoints needed for the hydrographic survey. The hydrographic survey was completed from November 11through November 15, 1991 (reservoir elevation 131.34 through 132.42), using the large vessel system,and from December 16 through December 18, 1991 (reservoir elevation 131.35 through 131.56), usingthe small boat system.
Following are descriptions of the Reclamation systems used to collect the hydrographic survey data:
1. Reclamation's large vessel system was used to collect the data for the range lines starting at IA,near the dam, upstream to range line 8 (excluding 6A). Range line 6A was surveyed using the smallboat system as described in the following paragraph. The large vessel bathymetric collection systemconsisted of electronic positioning equipment interfaced with a sonic depth recorder. The positioningsystem transmitted line-of-sight microwave signals to known shore stations and converted the replytime to range distances, which were used by the system data logger to compute the coordinateposition of the survey vessel. The survey system continuously recorded reservoir depth and horizontalcoordinates as the survey vessel moved across the reservoir. The system gave directions to the vesseloperator to assist in maintaining course along the prescribed range line alignment. During each run,the depth and position data were recorded at two second intervals, by a lap-top computer, forsubsequent processing by Denver Office personnel. Water surface elevations recorded during the timeof collection were used to convert the sonic depth measurements to true lake bottom elevations.
2. The remaining data were collected by Reclamation's small boat bathymetric system. This systemconsisted of a sonic depth recorder and reflector prism mounted on a small boat. It was decided to usethe Livingston Office's air boat even though it was harder to keep on-line because of its steering
4

limitation and boat noise, which made it difficult to hear directional communication from theshorepositioned personnel. Because the reservoir was nearly full, this type of boat was the only wayto collect data for the majority of the upper reservoir range lines because of the shallow water andhazard conditions that covered large portions of the ranges. The hazards included downed trees,stumps, and shallow areas with tall grass. The distance from a known point to the small boat wasdetermined as it proceeded along the range line by an EDM (electronic distance measuring)instrument set up on shore and aimed at the reflector target mounted on the survey boat. Rangedistances were communicated, by radio, from shore to the boat at preselected intervals and markedon the sonar charts as the boat proceeded across the reservoir. The boat was held on course as closelyas possible by radio communication from the EDM operator to the survey boat.
RESERVOIR SEDIMENT DISTRIBUTION
ILongitudinal Distribution
The distribution of sediment throughout the length of the reservoir is illustrated by a plot of the thalwegprofile representing the original and 1991 resurveyed profiles as shown on figure 4. The thalweg is theline connecting the lowest or deepest point along the streambed. Thalweg elevations representingoriginal and 1991 reservoir conditions were taken from the survey notes. Except for the possibility ofsome missed low point soundings during the original survey, the plotted profile should closely resemblethe deepest channel bottom conditions during the original range line survey completed prior toinundation of the reservoir. Except for some minor inaccuracies in sounding and being slightly off line,the bottom of the 1991 proffle should closely represent the deepest channel bottom conditions at thetime of the resurvey. The channel distance used for range line location is the original river channeldistance from the dam to each range line as you proceed upstream.
Lateral Distribution
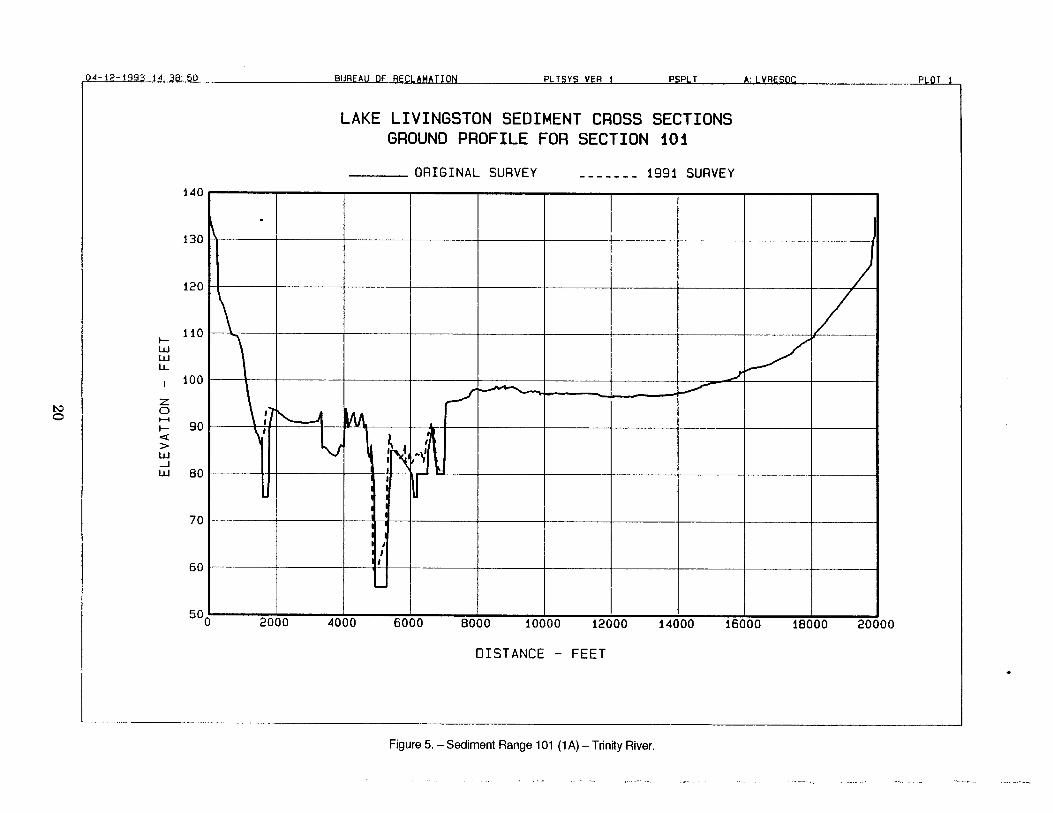
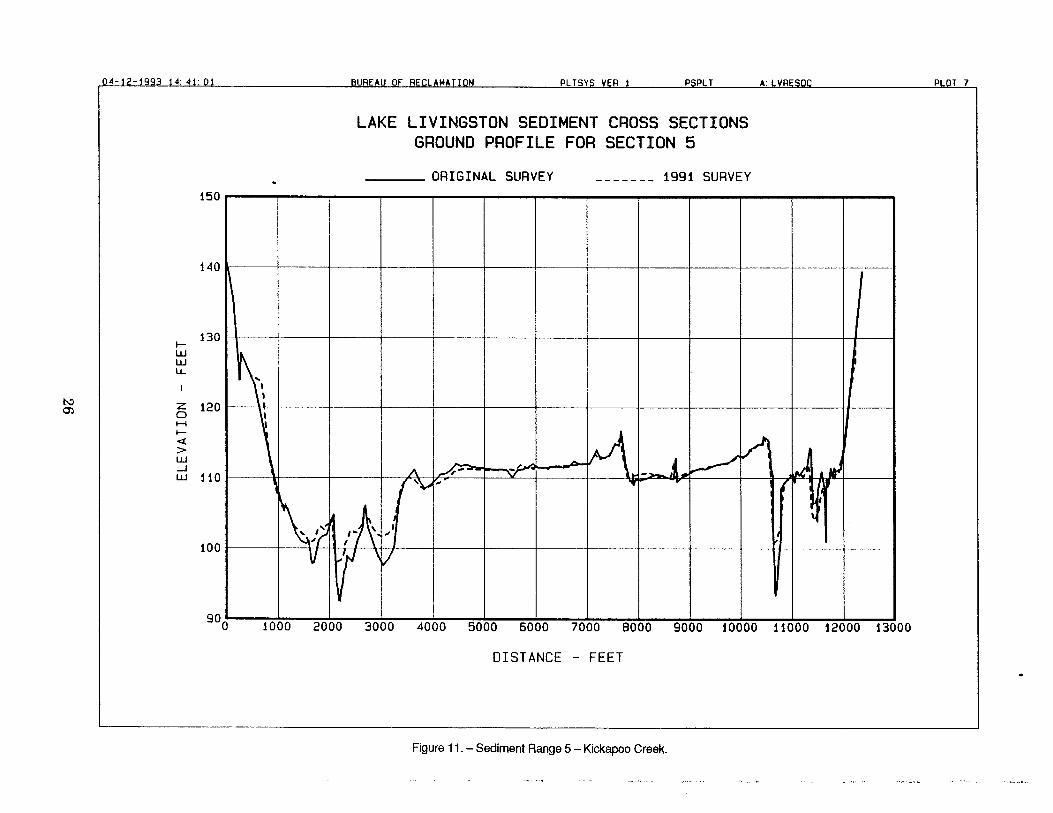
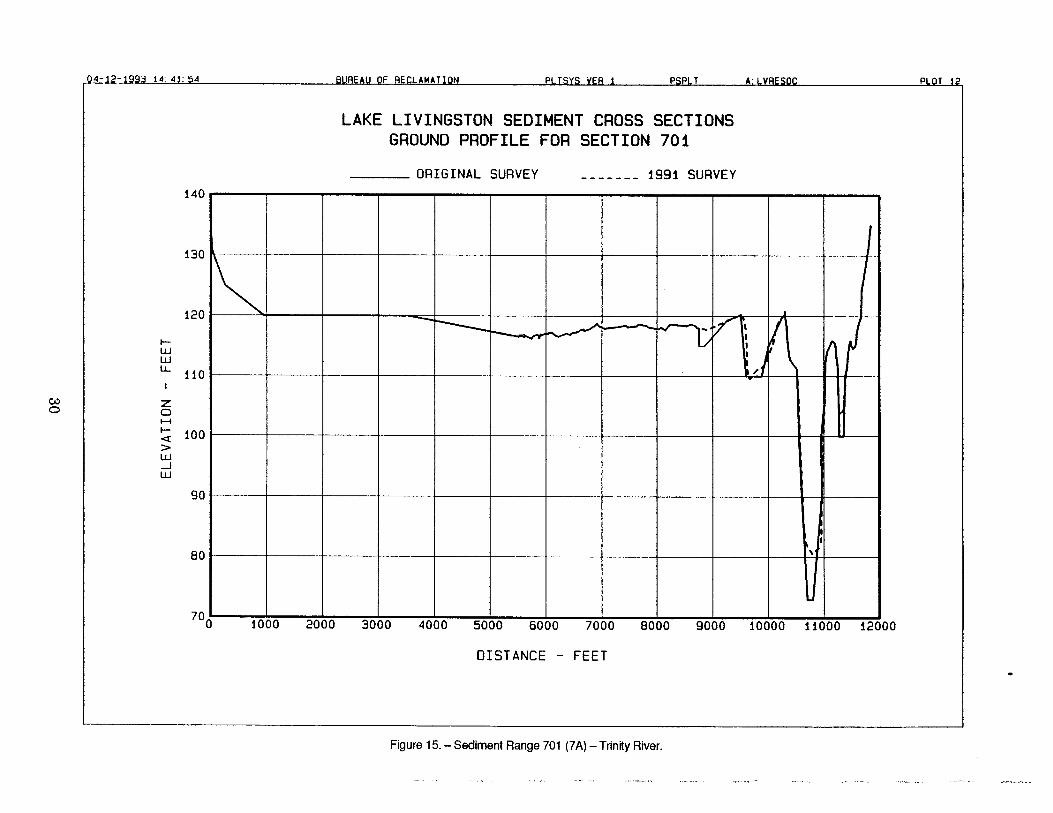
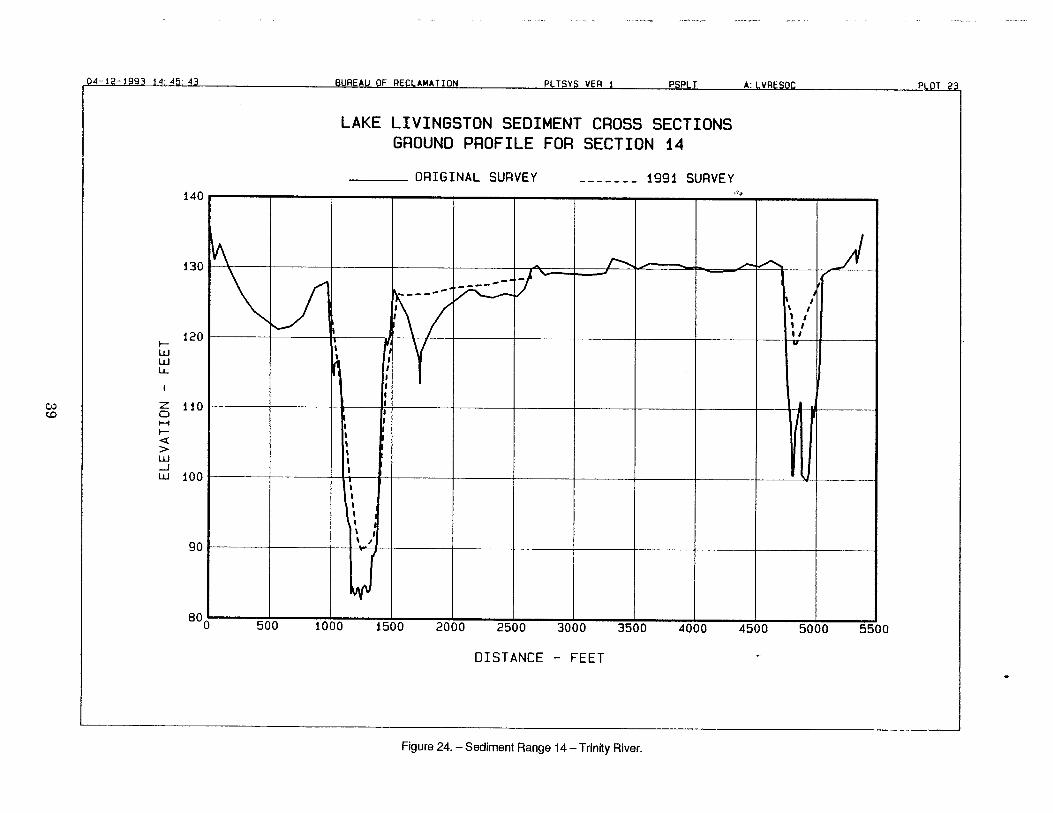
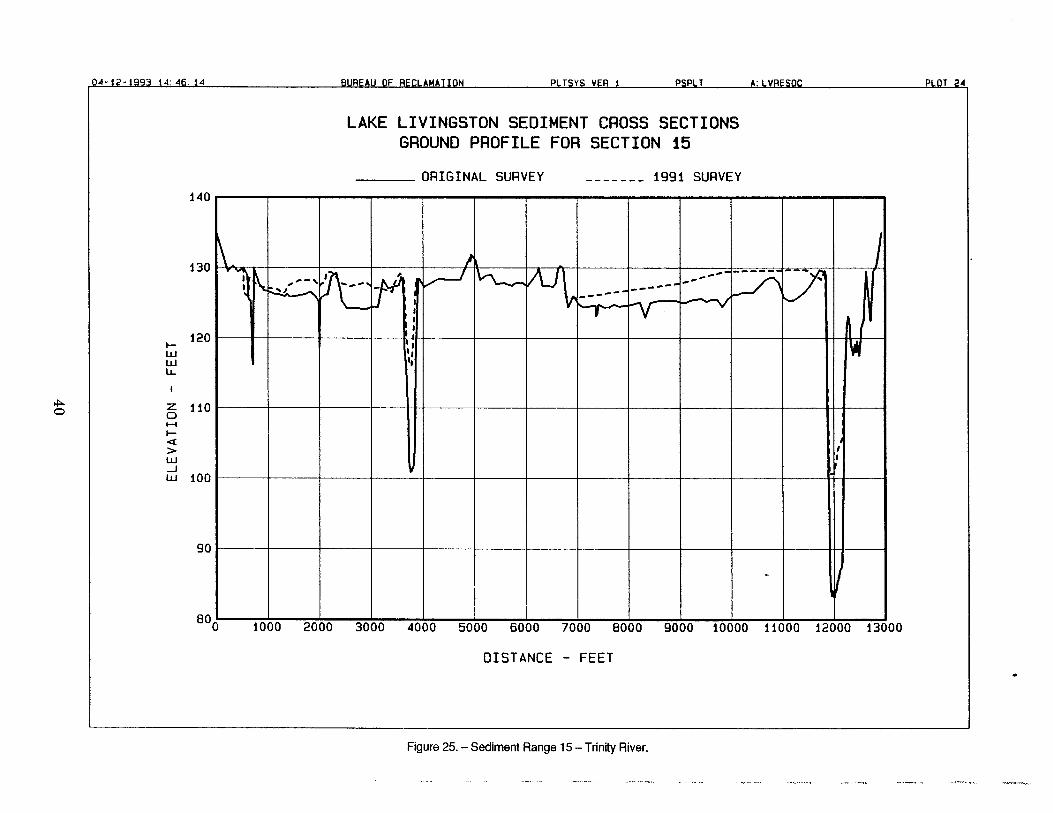
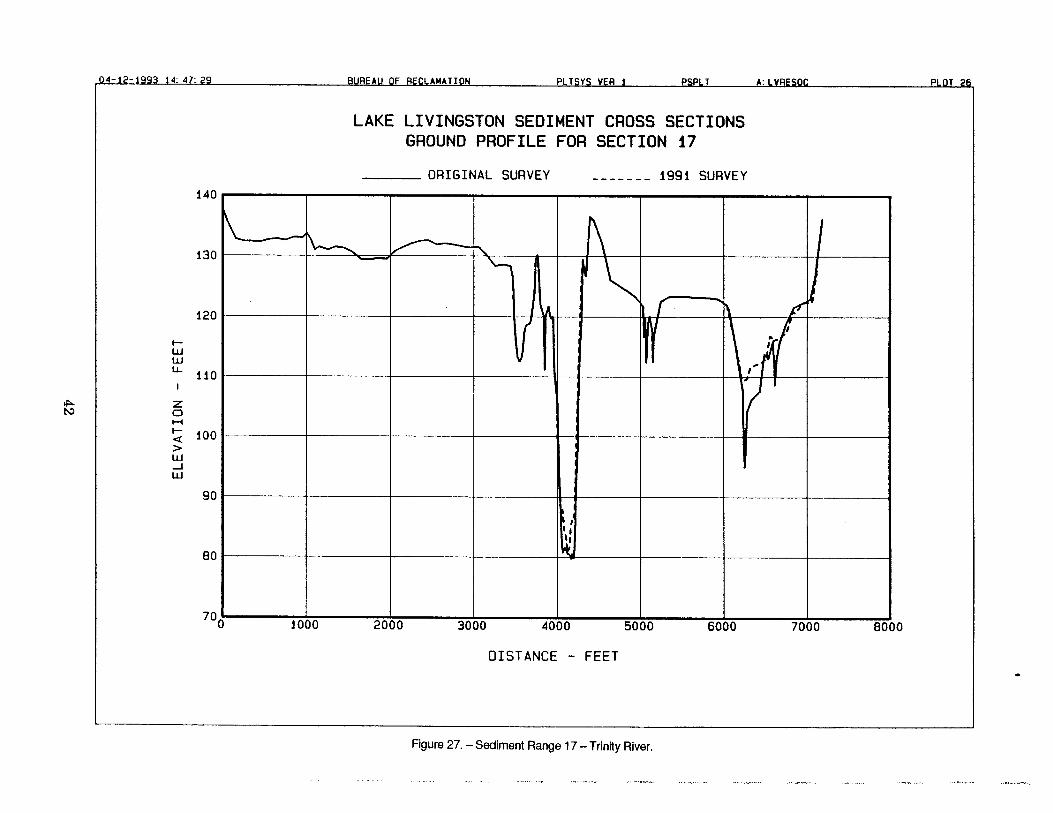
Ground profiles for the 24 original sediment ranges are shown on figures 5 through 28. The 1991 rangeprofile data are superimposed on these plots to indicate the changes which have occurred and torepresent in general the lateral distribution of sediment within the reservoir. A 1991 survey was notaccomplished for range line 19 because of location and weather conditions. This omission had nosignificant impact on storage capacity computations because this range is located and represents onlythe river channel of the extreme upstream part of the reservoir where little sediment deposition hasoccurred as indicated by range lines 17 and 18. Because the 1991 survey only covered the reservoir areaof pooi elevation 131.4 and below, it was assumed that no change occurred above this elevation. Forsediment computation purposes, a complete section was needed for all ranges. For this reason, theoriginal data was inserted into the 1991 data file to complete any areas not surveyed in 1991.
Concern exists for the future monitoring of the large reservoir surface area of segment 18, which islocated between range lines 18 and 19 on the Trinity River and includes the Harmon Creek arm of thereservoir. The physical makeup of this portion of the reservoir has the potential to form a largesediment delta when high Trinity River inflows occur during high reservoir stage. As the high inflowspass range line 19, the sediment would be deposited as the inflow velocities decrease in this large bay
5
area. Because of their location, surveying range lines 18 and 19 would not measure the sedimentdeposited outside of the original river channel. Future sedimentation surveys may need to considermapping this bay area to measure any surface area change caused by sediment deposition.
SEDIMENT ANALYSES
1991 Surface Areas
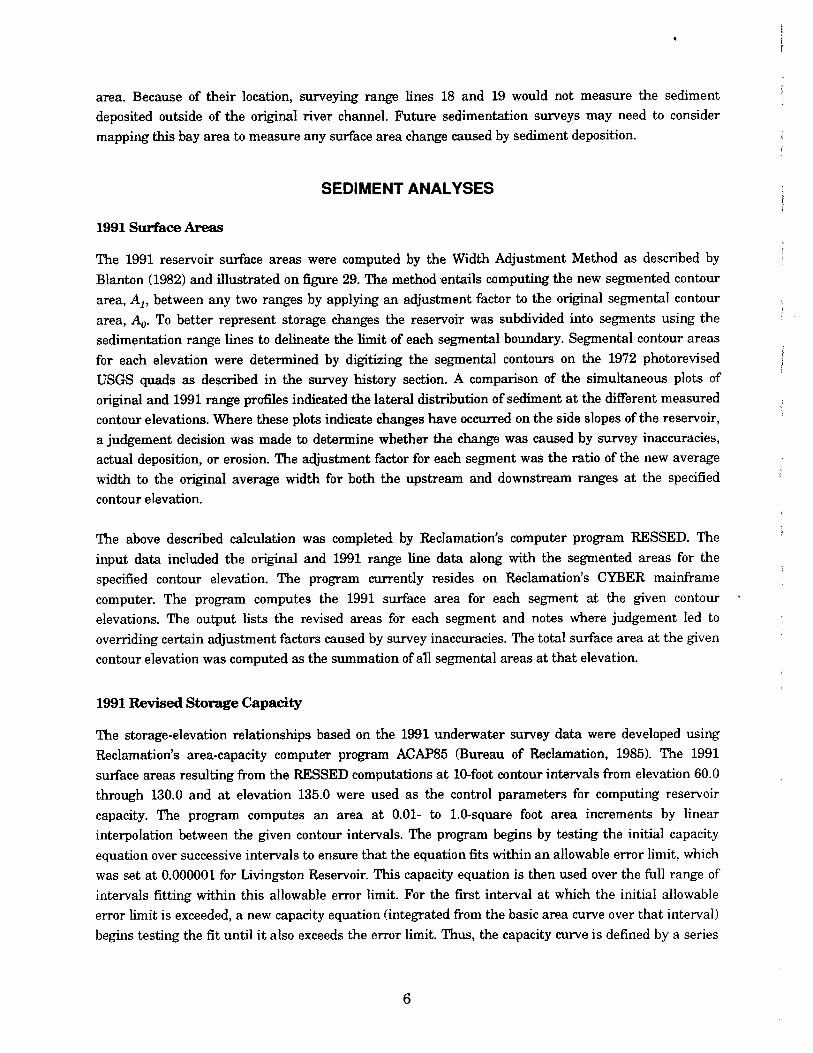
The 1991 reservoir surface areas were computed by the Width Adjustment Method as described by
Blanton (1982) and illustrated on figure 29. The method entails computing the new segmented contour
area, A1, between any two ranges by applying an adjustment factor to the original segmental contour
area, A0. To better represent storage changes the reservoir was subdivided into segments using thesedimentation range lines to delineate the limit of each segmental boundary. Segmental contour areasfor each elevation were determined by digitizing the segmental contours on the 1972 photorevisedUSGS quads as described in the survey history section. A comparison of the simultaneous plots oforiginal and 1991 range profiles indicated the lateral distribution of sediment at the different measuredcontour elevations. Where these plots indicate changes have occurred on the side slopes of the reservoir,a judgement decision was made to determine whether the change was caused by survey inaccuracies,actual deposition, or erosion. The adjustment factor for each segment was the ratio of the new averagewidth to the original average width for both the upstream and downstream ranges at the specified
contour elevation.
The above described calculation was completed by Reclamation's computer program RESSED. Theinput data included the original and 1991 range line data along with the segmented areas for the
specified contour elevation. The program currently resides on Reclamation's CYBER mainframe
computer. The program computes the 1991 surface area for each segment at the given contour
elevations. The output lists the revised areas for each segment and notes where judgement led to
overriding certain adjustment factors caused by survey inaccuracies. The total surface area at the given
contour elevation was computed as the summation of all segmental areas at that elevation.
1991 Revised Storage Capacity
The storage-elevation relationships based on the 1991 underwater survey data were developed usingReclamation's area-capacity computer program ACAP85 (Bureau of Reclamation, 1985). The 1991
surface areas resulting from the RESSED computations at 10-foot contour intervals from elevation 60.0through 130.0 and at elevation 135.0 were used as the control parameters for computing reservoir
capacity. The program computes an area at 0.01- to 1.0-square foot area increments by linear
interpolation between the given contour intervals. The program begins by testing the initial capacity
equation over successive intervals to ensure that the equation fits within an allowable error limit, whichwas set at 0.000001 for Livingston Reservoir. This capacity equation is then used over the full range ofintervals fitting within this allowable error limit. For the first interval at which the initial allowableerror limit is exceeded, a new capacity equation (integrated from the basic area curve over that interval)begins testing the fit until it also exceeds the error limit. Thus, the capacity curve is defined by a series
6

of curves, each fitting a certain region of data. Final area equations are derived by differentiating thecapacity equations, which are of second order polynomial form:
y = a1+ax+a3x2
where:
y = capacity,
x = elevation above a reference base,
a1 = intercept, and
a2 and a3 = coefficients
Results of the 1991 Livingston Reservoir area and capacity computations are listed in tables 1 and 2 andplotted on figure 30. A separate set of 1991 area and capacity tables has been published for the 0.01-,
0.1-, and 1-foot elevation increments (Trinity River Authority, 1991). The 1991 area and capacitycomputations results are listed in columns (5) and (6) of table 2. Column (2) in the table gives theoriginal measured contour areas used in the original area and capacity computation with the exceptionof the newly measured value at contour elevation 135.0. To make a valid comparison with the 1991computed values, these original capacity values were also recomputed by ACAP85 using the sameoriginal surface areas and the newly measured value at elevation 135.0. Thus, the capacity values incolumn (4) differ somewhat from those found in column (3) and in the original area and capacity tables.Both the original and 1991 area and capacity curves are plotted on figure 29 for a visual comparison of
changes. The 1991 survey determined that the reservoir has a storage capacity of 2,097,515 acre-feetand a surface area of 94,547 acres at ñiaxirnum reservoir elevation 135.0, and a storage capacity of
1,741,867 acre-feet and a surface area of 83,277 acres at the top of conservation storage elevation 131.0.
The sediment computations would not be affected if it is determined that the original surface area of91,000 acres should be used at elevation 135.0. The effect would only be noticed in the area and storagecapacity computations above elevation 130.0. Using the 1991 survey data with this restriction, thereservoir would have a storage capacity of 2,088,648 acre-feet and a surface area of 91,000 acres atmaximum reservoir elevation 135.0, and a storage capacity of 1,741,512 acre-feet and a surface area of82,568 acres at the top of conservation storage elevation 131.0. This decision has little effect on the
calculated capacity difference at elevation 131.0 (355 acre-feet), but has a major effect on the capacitycalculation at elevation 135.0 (8,867 acre-feet) and ultimately on the available capacity for flood
surcharge storage.
Reservoir Sedimentation Accumulation and Summary
Sediments have accumulated in Lake Livingston to a total volume of 64,227 acre-feet below elevation
131.0, top of reservoir conservation, since storage began in June 1969. This volume represents a3.56-percent loss in total capacity and an average annual accumulation rate of 2,854 acre-feet for the
22.5-year period of operation. The net sediment accumulation rate from the contributing basin was
0.329 acre-feet per square mile per year for the same period.
7

The results of the sediment data and volume computations for the 1991 survey are shown in tables 1and 2. The data include a tabulation of incremental sediment inflow volume and sediment accumulationcomputed for the period between initial conditions and the 1991 resurvey. Table 1 includes informationon the drainage basin, records of inflow, reservoir operations and reservoir sthrage.
REFERENCES
Blanton, James 0. ifi, Procedures for Monitoring Reservoir Sedimentation: Technical Guideline,Bureau of Reclamation, Denver, Colorado, 1982.
Bureau of Reclamation, ACAP85 User's Manual, Bureau of Reclamation, Denver Office, Denver,Colorado, 1985.
Trinity River Authority, Lake Livingston Area and Capacity Tables, Lake Livingston Project,Huntsville, Texas, 1991.
U.S. Army Corps of Engineers, WaterResourcesDeveiopment in Texas, 1988, Dallas, Texas, 1988.
8

RESERVOIR SEDIMENTDATA SUMMARY Livinciston Reservoir
NAME OF RESERVOIR 1DATA SHEET NO.
•5 1. aNER Trinity River Authority 2. STREAM 'trinity River 3. STATE Texas
A 4. SEC. TWP. RANGE 5. NEAREST P.O. Goodrich 6. COUNTY PoLk - San .Jacint
N 7. LAT 30' 38' 00" LONG 95 00' 36" 8. TOP OF DAM ELEVATION 145.0 8. SPILLWAY CREST ELEV. 99.0'
TE
10. STORAGEALLOCATION
11. ELEVATITOP OF POOL
ON 2. ORIGINALSURFACE AREA, Ac
13. ORIGINALCAPACITY, Al
4. GROSS STORAGEACRE- FEET
15. DATESTORAGEBEGAN
a. FL000 CONTROL 135.0 91,000 347,550 2,135,324
R b. t4JLTIPLE US!______________ ________________ 9/29/68*V
Oc.POWER
__________ _________ ___________ _______
I d. WATER SUPPLY 16. DATER
________________ ______________ _________________
NORMALOPERATION_______________
f. CONSERVATION_ __________
131.0_____
82,600 1,787,774 1,788,125 BEGAN
g. INACTIVE 58.0 234 351 351 6/26/69
11. LENGTH OF RESEh 01k 55 MILES AVG. WIDTh OF RE RVOIR 0.44 MILES
T 18. TOTAL DRAINAGE AREA 16,583 SQUARE MItES 22. MEAN ANNUAL PRECIPITATION INCHES
19. NET SEDIMENT CONTRIBUTING AREA 8, 423' SQUARE MILES 23. MEAN ANNUAL RUNOFF INCHES
I 20. LENGTH 360 MILES AV. WIDTH 46 MILES 24. MEAN ANNUAL RUNOFF 4,925,000k ACRE-FEETN
21. MAX. ELEVATION 1250 MIN. ELEVATION 58.0 25. ANNUAL TP. MEAN •F RANGE F to 'F
T" 26. DATE OF 27. 28. 29. TYPE OP 30. NO. P 31. SURFACE 32. CAPACITY 33. C/IU SURVEY PER. ACCL. SURVEY RANGES OR AREA, AC. ACRE-FEET RATIO Al/AlR YRS. YRS. INTERVAL
E 6/69 Contour (R)* 10-ft 83,277' 1,806,094' 0.37
Y
12/91 22.5 22.5 Range (D) 24 83,277 1,741,867 0.35DA
T_________________
26. DATE OF 34. PERIOD 35. PERIOD WATER INPLCM, ACRE FEET WATER INFLCM TO DATE, AlA SURVEY ANNUAL
PRECIP.a. MEAN ANN. b. MAX. ANN. c. TOTAL a. MEAN ANN. b. TOTAL
12/91 22.5 4,240,000' 9,727,000' 95,409,000' 4,240,000' 95,409,000'
26. DATE OF 37. PERIOD CAPACITY LOSS, ACRE-FEET 38. TOTAL SEDIMENT DEPOSITS TO DATE, AlSURVEY
a. TOTAL b. AV. ANN. C. /MI.'-YR. a. TOTAL b. AV. ANNUAL C. /MI.'YR.
12/91
-
64,227 2,854 0.329' 64,227 2,854 0.3298
26. DATE OF 39. AV. DRY 40. SED. DEP. TONS/MI.-YR. 41. STORAGE LOSS, PCT. 42. SEDIMENTSURVEY WT. (#/FT') INFLOW, PPM
a. PERIOD b. TOTAL TO a. AV. b. TOTAL TO a. b.DATE ANNUAL DATE PER. TOT.
12/91 0.158' 3.56'
26. 43. DEPTH DESIGNATION RANGE IN FEET BELOW TOP OF CONSERVATION (ELEVATION 131.0.)DATEOF 76.0- 61.0- 51.0- 41.0- 31.0- 21.0- 11.0-SURVEY 61.0 51.0 41.0 31.0 21.0 11.0 el.131
PERCENT OF TOTAL SEDIMENT LOCATED WITHIN DEPTH DESIGNATION
12/91 6.3 8.7 14.0 21.5 20.2 17.9 11.4
26. 44. REACH DESIGNATION PERCENT OP TOTAL ORIGINAL LENGTH OF RESERVOIRDATE 0-10 10- 20- 30- 40- 50- 60- 70- 80- 90- 100- 105- 110- 115- 120-
SURVEY 20 30 40 50 60 70 80 90 100 105 110 115 120 125
PERCENT OF TOTAL SEDIMENT LOCATED WITHIN REACH DESIGNATION
N/A
Table 1. - Reservoir sediment data summary.
9

4. RANGE IN RESERVoIR OPDLAtTON "
WATER YEAR MAX. ELEV. NIH. ZLEV. INFLOW, AF' WATER YEAR MAX, ELEV. KIN ELEV, INFLOW, AF'
1969" 103.6 100.7 214,000 1970 120,9 99.2 3,818,000
1971 1266 123.0 979,000 1972 131.6 130.1 4,004,000
Tt973 131,6 151.0 3,895,000 1974 131.7 130.0 4,617,000
1975 13L4 130.6 8,338,000 1976 132.0 130.2 3,135,000
1977 131.6 129.7 4,711,090 1978 131.1 126.9 1,081,000
1919 131.3 126.6 4.066,000 1960 131.5 127.4 2,265,900
1981 1322 12L4 2,697,000 1982 131.9 130.9 7,267,000
1963 131.9 130.8 3,257,000 1984 131.8 129.3 1,655,0001985 132.2 129.2 4,322,000 1986 131.6 130.3 6,098,0001987 132.3 130.1 4,957,000 1988 131.7 125.5 1.663,000
1989 152.6 125.4 6,26S,00 1990 132.5 130.6 9, 727,0001991 131.7 130.8 4,378,000 1992 - - -
48, ELEVATION - AREA - CAPACITY DATKTOR C.utIGIUL CAPIT! __________ __________ __________ __________
ELZV. AREA CAP. ELEV. AREA CAP. ELEV. AREA CAP.55 0 0 90 5,930 64,775 130 80,480 1,724,22560 390 975 100 19,840 193,625 131 (83,277) 1,806,004
70 1.180 8.825 110 41,520 500,425 135 94,547' 2,161,742
80 2,040 24,925 120 61,390 1,014,975
46. r.LEVATrDN - AREA - CAPACITY DATA rOR 1991 TOTAL APhcxTYELEV. AREA CAP. ELEV. AREA
_________CAP.
_____
ELEV.____ _________
AREA
_________CAP.
59.6 0 0 65 3,086 26,119 115 50,310 682,51960 82 16 90 4,933.7 46,168 120 59,920.6 958,09565 476 1,411 95 11,500 87,253 125 70,190 1,283.372
70 8590 4,773 100 18,086.1 161.170 130 80,480 1,659.998
73 1.034 9,379 105 29,383 279,794 131. 83,271 1.741.867
80 1,238.2 15,309 110 40,598,8 454,998 135 94,547 2.097,515
47. REMARKS AND REFERENCE
Sill of tainter gate, top of tainter gates is elevation 134.0,
2 m dam was completed 9/29/68, with deliberate impoundment beginning 6/26/69.
Represents loss of contributing areas since dam closing at Richiand in 1987 (285 m12 ), Navarro in 1963 (320 mi2),Bardwell in 1965 (178 m12), Cedar in 1965 (1,007 m12), Ray Hubbard in 1978 (184 rn!2), Lavon in 1953 (770 mi2),Mountain Creek in 1937 (295 rni2), Arlington in 1957 (143 mi2), Benbrook in 1952 (429 rni2), Grapevine in 1952(695 mi2), Lewisville in 1954 (1,660 mi2), and reservoir area (130 mi2).
48-year average of 4,630,000 acre-feet measured at USGS Trinity River at Riverside, TX, gage, which ac countedfor 941 of all area that drains into the reservoir.
Original surface areas measured from USGS 7% quads developed from 1958 photographic data.
Surface area and capacity at elevation 131.0 recalculated from original measured surface areas using Bureauof Reclamations program .4CAP85. Used original surface areas along with surface area of 94,547 acres, atelevation 135.0, which was measured using USGS 7% quads photoreviaed in 1972.
Values from USGS Trinity River near Crockett, TX, gage, which accounts for 841 of all area that drains intoreservoir.
• Adjusted for upstream darns reducing contributing drainage areas in 1978 and 1987, see remark #3.
• Average annual and total sediment deposits divided by 1,806,094 acre-feet (capacity at El. 131 recomputed byACAP85).
'° End-of-month values from USGS publications. Reservoir levels provided by Trinity River Authority.
" Includes July, Aug., and Sept. 1969 data, since normal operation of 6/26/1969.
' Surface area measured from 1972 photorevised USGS 7% quads.
48. AGENCY MAKING SURVEY Bureau of Reclamation49, AGENCY SUPPLYING DATA Bureau of Reclamation DATE December 1992
Table 1. - Reservoir sediment data summary - Continued.
10

(1)
Elevation(feet)
(2)
OriginalArea
(acres)
(3)
OriginalCapacity
(acre-feet)
(4)OriginalAdjustedCapacity
(acre-feet)
(5)
1991Area
(acres)
(6)
1991Capacity
(acre-feet)
(7)MeasuredSedimentVolume
(acre-feet)
(8)
PercentMeasuredSediment
(9)
PercentReservoir
Depth
135 94,5471 2,161,742 94,547 2,097,515 64,227 100.0 -
131 (83,277)
______________
1,788,125 1,806,094 (83,277) 1,741,867 64,227 100.0 100.0
130 80,460 1,706,595 1,724,225 80,460.0 1,659,998 64,227 100.0 98.7
125 1,330,216 1,345,762 (70,190) 1,283,372 62,390 97.1 92.1
120 61,390 1,001,072 1,014,975 59,920.6 958,095 56,880 88.6 85.5
115______________
718,949 732,862 (50,310) 682,519 50,343 78.4 78.9
110 41,520 486,522 500,425 40,698.8 454,998 45.427 70.7 72.4
105 306,033 319,925 (29,383) 279,794 40,131 62.5 65.8
100 19,840 179,734 193,625 18,066.7 161,170 32,455 50.5 59.2
95 103,199 111,812 (11,500) 87,253 24,559 38.2 52.6
90 5,930 60,574 64,775 4,933.7 46,168 18,607 29.0 46.0
85______________
37,625 39,987 (3,086) 26,119 13,868 21.6 39.5
80 2,040 24,400 24,925 1,238.2 15,309 9,616 15.0 32.9
75 15,550 15,800 (1,054) 9,579 6,221 9.7 26.3
70 1,180 8,850 8,825 869.0 4,773 4,052 6.3 19.7
65 3,925 3,912 (476) 1,411 2,501 3.9 13.2
59.6 825 825 0 0 825 1.3 6.0
55 0 0 0 0 0 0 0.0 0.0
I
(1) Elevation of reservoir water surface.(2) Original reservoir surface area, values in parentheses computed by Bureau of Reclamations program ACAP85.(3) Original calculated reservoir capacity.(4) Original reservoir capacity recomputed using ACAP8S from original measured surface areas and new area measured at elevation 135.(5) Reservoir surface area from 1991 survey. Values in parentheses computed by ACAP85.(6) 1991 calculated reservoir capacity from 1991 survey data.(7) Measured sediment volume = column (4) - column (6).(8) Measured sediment expressed in percentage of total sediment (64,227).(9> Depth of reservoir expressed in percentage of total depth (76 feet).
Surface area measured from 1972 photorevised USGS 74 quads, previously used 91,000 acres, which was calculated using areas measuredat El. 130.0 and El. 140.0.
Table 2.- Summary of 1991 survey results.

'5'
555rJ/
__F$
lPDINTESO U REPECT 2 flU
5"S
:i / \
55 5 51 /N/
'
135 s
5
5
'\ "
*:T55S N'-N / N
I' /
cS
N
NFigure 2. - Lake Livingston range location map (1 of 2).
15


110
100
t90
80
Lu
60
LAKE LIVINGSTON SEDIMENTATION SURVEYliii liii I III I I 11111111 I I II
I
/ \
1991 Thalweg- I
/I-4 /
I
-
\ ,
/
-
' 4 I /
A/
I /
-S
- 555
S
- Original Thalweg
I I I I I I I I I50 45 40 35 30 25 20 15 10 5
MILES ABOVE AXIS OF DAM
Figure 4. - Longitudinal profile - Trinity River.
0
y4- 1
-------
0
140
130
120
110
wwt.L
100
z0
F- 90
>u-i-Jw 80
70
60
50,
LAKE LIVINGSTON SEDIMENT CROSS SECTIONS
GROUND PROFILE FOR SECTION 101
_______ ORIGINAL SURVEY 1991 SURVEY
///J
I _______________________________ _______________________________ ________________________________
I
) 2000 4000 6000 8000 10000 12000 14000 16000 18000 20000
DISTANCE - FEET
Figure 5. - Sediment Range 101 (1 A) - Trinity River.

-------
180
LAKE LIVINGSTON SEDIMENT CROSS SECTIONSGROUND PROFILE FOR SECTION 1
_______ ORIGINAL SURVEY 199i SURVEY
160
wwU.. 120
140
z0
F-
>w-Jw
40 Do
80
60
00 8000 10000 12000 14000 16000
DISTANCE - FEET
Figure 6. - Sediment Range 1 - Trinity River.

-------
O4-2-i99 4: 39: 36 bUREAU OF RECLAMATION PLTSYS VER i PSPLT A:LYRESOC PLOT 3
LAKE LIVINGSTON SEDIMENT CROSS SECTIONSGROUND PROFILE FOR SECTION 2
_______ ORIGINAL SURVEY 1991 SURVEY
200
180
160
u-ILU
140
z0
F- ______ ______ ______ ______ ______ ______ ______
>LU-JLU
600 2000 4000 6000 8000 10000 12000 14000 16000 18000 20000
DISTANCE - FEET
Figure 7. - Sediment Range 2- Triny River.

-------
140
130
120
DISTANCE - FEET
110
LAKE LIVINGSTON SEDIMENT CROSS SECTIONSGROUND PROFILE FOR SECTION 3
_______ ORIGINAL SURVEY 1991 SURVEY
80
70 - ________ ________ ________ ________ -
602000 4000 6000 8000 10000 12000 14000 16000 18000 20000
Figure 8. - Sediment Range 3- Trinity River.

-------
140
130
120
ft 110IL
80
70
LAKE LIVINGSTON SEDIMENT CROSS SECTIONSGROUND PROFILE FOR SECTION 301
_______ ORIGINAL SURVEY 1991 SURVEY
0 2 4 6 8 10 12 14 1 6 1 8 20 22 24 26 28 30 32 34
DISTANCE - FEET (1000)
Figure 9. - Sediment Range 301 (3A) - Trinity River.

-------
LAKE LIVINGSTON SEDIMENT CROSS SECTIONSGROUND PROFILE FOR SECTION 4
_______ ORIGINAL SURVEY 1991 SURVEY
8000 10000 12000 14000 16000 1
DISTANCE - FEET
00
150
140
130
120LULUU-
110
z0
i-. 100>LU-JLU 90
80 -
70 -
6oo 2000
Figure 10. - Sediment Range 4- Trinity River.
-------
150
140
130wwU-
120
w 110
100
goDO
LAKE LIVINGSTON SEDIMENT CROSS SECTIONSGROUND PROFILE FOR SECTION 5
_______ ORIGINAL SURVEY 1991 SURVEY
___ A__ _
1000 2000 3000 4000 50 00 60 00 70 00 80 00 9000 10000 11000 12000 130
DISTANCE - FEET
Figure 11. - Sediment Range 5- Kickapoo Creek.

-------
Q4-j-j9 14: 4: 5 BUREAU OF RECLAMATION PLTSYS VER I PSPLT A; LVRESOC PLOT 9
LAKE LIVINGSTON SEDIMENT CROSS SECTIONSGROUND PROFILE FOR SECTION 6
_______ ORIGINAL SURVEY 1991 SURVEY
140
130
w
ft 120
z
110w-Jw
100
yoc
DISTANCE - FEET
1000 2000 3000 4000 5000 6000 7000 80C
Figure 12. - Sediment Range 6- Kickapoo Creek

LAKE LIVINGSTON SEDIMENT CROSS SECTIONSGROUND PROFILE FOR SECTION 60i
-------
cx
_______ ORIGINAL SURVEY jggj SURVEY
140
135
130
F-LuLu
125 I0
120 - _______ __________ __________ __________ __________ __________
ILu .1
I IILu ''I
115
_j110 - ______ _________ _________ _________ _________ _________
105o 500 1000 1500 2000 2500 3000 3500 40(
DISTANCE - FEET
Figure 13. - Sediment Range 601 (6A) - Kickapoo Creek.

-------
140
130
120
I-wLU
110
zD'-I
>w-Jw
go
80
7000
LAKE LIVINGSTON SEDIMENT CROSS SECTIONSGROUND PROFILE FOR SECTION 7
_______ ORIGINAL SURVEY ggj SURVEY
__ __ __ __ __ __ __ __ __ --s-- __
___ ___ ___ ___ ___ ___ ___ ___ ___ - ___ ___
0 1000 2000 3000 4000 5000 6000 7000 8000 9000 10000 11000 120
DISTANCE - FEET
Figure 14. - Sediment Range 7- Trinity River.
0
LAKE LIVINGSTON SEDIMENT CROSS SECTIONSGROUND PROFILE FOR SECTION 70i
_______ ORIGINAL SURVEY 1991 SURVEY
140
110
z0
>LU-JLU
90 -- ____
I'80 __ __ __ __ __ __ __ __ __ __ __
70o 1000 2000 3000 4000 5000 6000 7000 8000 9000 10000 11000 120 DO
DISTANCE - FEET
Figure 15. - Sediment Range 701 (7A) - Trinity River.

-------
c
04-1-199 14: 4 : p5 8UREAU OF RECLAMATION PLTSYS VER I PSPLT A: LVRESOC PLOT i3
LAKE LIVINGSTON SEDIMENT CROSS SECTIONSGROUND PROFILE FOR SECTION 8
_______ ORIGINAL SURVEY jggj SURVEY140
130
120
I-LULULi.
110
z01-4
>LU-jLU
go
80
701000 2000 3000 4000 5000 6000 7000 8000
OISTANCE - FEET
\ ,\
________ ___
Figure 16. - Sediment Range 8- Triny River.

O4-1-i993 14: 4 : 16 BUREAU OF RECLAMATION PLTSYS YEA I PSPLT A; LYRESOC PLOT j4
LAKE LIVINGSTON SEDIMENT CROSS SECTIONSGROUND PROFILE FOR SECTION 9
_______ ORIGINAL SURVEY iggi SURVEY
140
130
120
uJu-it.L 110
z0I;
>w-Ju-i
go ___________ ___________ ___________ ______
80
DISTANCE - FEET
I 'l fk ,
I,
1000 2000 3000 4000 5000 6000 7000 BOC
Figure 17. - Sediment Range 9-Trinity River.

-------
C3
p4--j99 j4: 42: 48 BUREAU OF RECLAMATION PLTSYS VER I PSPLT A: LYRESOC PLOT 15
LAKE LIVINGSTON SEDIMENT CROSS SECTIONSGROUND PROFILE FOR SECTION 10
_______ ORIGINAL SURVEY 1991 SURVEY
140
130
120
LULU
110
01-4I- _____ _____ _____ _____ _____ _____ _____ _____ _____ _____
>LU-JLii
go
80
70o 500 1000 1500 2000 2500 3000 3500 4000 4500 5000 5500
DISTANCE - FEET
-S -
, I
______ ______ 'I
1
Figure 18. - Sediment Range 10- Trinity River.

U4
-------
LAKE LIVINGSTON SEDIMENT CROSS SECTIONSGROUND PROFILE FOR SECTION Ii
_______ ORIGINAL SURVEY II SURVEY
140
130 _ _ _ _ _
120
UiUi
110
z01-4
>Ui-JUi
go - ________ ________ ________ ________ _______ _______ ________ _______ _______ _______
80 - - ________ ________ ________ ________ _______ _______ ________ ________ _______ _______
A
70o 1000 2000 3000 4000 5000 6000 7000 8000 9000 10000 110 )0
DISTANCE - FEET
Figure 19. - Sediment Range 11 - Triny River.

uu- -
-------
150
140
130
wLU
120
z0
I-
>LU-JUi
100
go
Qq;
LAKE LIVINGSTON SEDIMENT CROSS SECTIONSGROUND PROFILE FOR SECTION 12
_______ ORIGINAL SURVEY 1991 SURVEY
____ _
00 0 500 1000 1500 2000 2500 3000 3500 4000 4500 5000 5500
DISTANCE - FEET
Figure 20. - Sediment Range 12- White Rock and Caney Creeks.

-------
LAKE LIVINGSTON SEDIMENT CROSS SECTIONSGROUND PROFILE FOR SECTION 121
_______ ORIGINAL SURVEY jggj SURVEY
140
135
130
110
105 - _______ - ___________ ___________ ___________ ___________ ___________ ___________
1000 1000 öoo 3000 4000 5000 6000 7000 80( 0
DISTANCE - FEET
Figure 21.- Sediment Range 121 (12A)- Caney Creek.

tJ4 1
140
135
130
wuJ
125
z0
I-
>w-Jw
115
110
105
LAKE LIVINGSTON SEDIMENT CROSS SECTIONSGROUND PROFILE FOR SECTION 122
_______ ORIGINAL SURVEY jggj SURVEY
) 1000 2000 3000 4000 5000 6000 7000 8000 9000
DISTANCE - FEET
Figure 22. - Sediment Range 122 (1 2B) - White Creek.

-------
LAKE LIVINGSTON SEDIMENT CROSS SECTIONSGROUND PROFILE FOR SECTION 13
_______ ORIGINAL SURVEY 1991 SURVEY
140
130
120
1-wwIL 110 - ________ __________ _________ _________ _________
z0'-4
100>w-jLU
go
80
11
9ooo 0 1000 2000 3000 4000 5000 6000 70(
DISTANCE - FEET
Figure 23. - Sediment Range 13- Triny River.
-------
140
130
120
ww
1
110
W 100
go
LAKE LIVINGSTON SEDIMENT CROSS SECTIONS
GROUND PROFILE FOR SECTION 14
ORIGINAL SURVEY 1991 SURVEY
800
\
-
-
-/J \ 1v-- ___
___________________________ ____________________________ * ____________________________ ____________________________
uuu auu dUUU uu iouo bOU 4000 4500 5000 5500
DISTANCE - FEET
Figure 24. -Sediment Range 14-Trinity River.
-------
C
O4-12-199 14: 46 : 14 BUREAU OF RECLAMATION PLTSYS VER I PSPLT A; LVRESOC PLOT 24
LAKE LIVINGSTON SEDIMENT CROSS SECTIONSGROUND PROFILE FOR SECTION i5
_______ ORIGINAL SURVEY 1991 SURVEY
140
130
120I.-UiUiIL
110
Ui 100
go
80(00
OISTANCE - FEET
II
) 1000 2000 3000 4000 5000 6000 7000 8000 9000 10000 11000 12000 130
Figure 25. - Sediment Range 15- Trlny River.

-------
O-1-199 14: 4/ ; O BUREAU OF RECLAMATION PLTSYS VER I PSPLT A: LVRESOC PLOT 25
LAKE LIVINGSTON SEDIMENT CROSS SECTIONSGROUND PROFILE FOR SECTION 16
_______ ORIGINAL SURVEY 1991 SURVEY
140
130J - -
120(JJwtj
110 - - ___
LU 100 _____ ____ - - ___
go ____________ ______ ______ ______
80o 500 1000 1500 2000 2500 3000 3500 4000 4500 5000
DISTANCE - FEET
Figure 26. - Sediment Range 16- Trinity River.
uq-
-------
LAKE LIVINGSTON SEDIMENT CROSS SECTIONSGROUND PROFILE FOR SECTION i7
_______ ORIGINAL SURVEY 1991 SURVEY
140
130____ __ __ __
'I:L ___ ______ __ _________80 ______ ______ ______ ____ ______ ______ ______
70o 1000 2000 3000 4000 5000 6000 7000 80( 0
DISTANCE - FEET
Figure 27. - Sediment Range 17- Trinity River.

v- CF
-------
150
140
130
F-u-ILULL
120
z0IiF-
>LU-JLU
100
go
80
LAKE LIVINGSTON SEDIMENT CROSS SECTIONSGROUND PROFILE FOR SECTION 18
_______ ORIGINAL SURVEY 1991 SURVEY
1000 2000 3000 4000 000 A00O 7000
DISTANCE - FEET
Figure 28. - Sediment Range 18- Triny River.

WIDTH ADJUSTMENT METHOD FOR REV/SINGCONTOUR AREAS IN COMPUTATION OP
RESERVOIR SEDIMENTATION
Schematic Segmentof Reservoir
mit/cl Survey New SurveyContour Area 4, * Contour Area (Computed)Downstream Width W,' Downstream WidthUpstream Width w," Upstream Width
I II
/241x40(0I0lI
2
Figure 29. - Wkith adjustment method for revising contour areas.
44
Sediment Range

AREA (100 ACRES)
140
135
130
125
120
115
110
Ulii
zD
>LiLi
80
75
70
65
60
55
50
1000 800 600 400 200 U
i _____ _______ _____
/CAPACITI ___ _______
1i - -____
LEGEND.
F
1991 SURVEY _________________________
ORIGINAL SURVEY
n cnn mon icon 2000 251CAPACITY (1000 ACRE-FELT)
Figure 30. - Area and capacity curves - Lake Livingston.