Lake Environmental Management Strategy PHOSPHORUS ...
164
Lake Simcoe Environmental Management Strategy PHOSPHORUS MODELLING AND CONTROL OPTIONS Technical Report A.6 1985
Transcript of Lake Environmental Management Strategy PHOSPHORUS ...

Lake
Simcoe
Environmental
Management
Strategy
PHOSPHORUS MODELLING
AND CONTROL OPTIONS
Technical Report A.6
1985


LAKE SIMCOE ENVIRONMENTAL STRATEGY
PHOSPHORUS MODELLING
AND CONTROL OPTIONS
Prepared for the Steering Committee of the
Lake Simcoe Environmental Management Strategy
by
Dennis Draper, Dale Henry, Fritz Engler, Sam Singer
John Antoszek, Steve Batten, Mike Walters
1985

LAKE SIMCOE ENVIRONMENTAL MANAGEMENT STRATEGY
FOREWORD
This report is one of a series of technical reports prepared in the course of the Lake SimcoeEnvironmental Management Strategy (LSEMS) studies. These studies were initiated in 1981,as directed by the Cabinet Committee on Resource Development, to investigate methods ofreducing phosphorus loadings from the Holland Marsh.
These studies are under the direction of the LSEMS Steering Committee, comprised ofrepresentatives of the following agencies:
Ministry of Agriculture and Food Ministry of the EnvironmentMinistry of Natural Resources andSouth Lake Simcoe Conservation Authority.
The Committee expanded the SCOPE of these studies to include the total Lake Simcoe basin.The change in study mandate was made to place all sources of phosphorus loadings to LakeSimcoe into perspective. Thus the following sources were investigated:
- agricultural and rural runoff- urban runoff- streambank erosion and- sewage treatment facilities.
In order to develop practical abatement measures to minimize such inputs, studies wereinitiated to inventory, quantify and target areas with respect to soil loss, livestock andfarming operations, streambank erosion and urban runoff. These factors affect soil erosionrates, stream siltation and phosphorus loadings to Lake Simcoe.
The Committee approved the Lake Simcoe studies to establish current information on Lakewater quality and aquatic plant growth. Such studies were required to establish baselineconditions to compare future water quality conditions. These are expected to improve,because of the following:
i

- municipal and provincial efforts to reduce phosphorus loadings from sewagetreatment facilities and
- expected changes to more environmentally acceptable land use practice bydevelopers and farmers to reduce inputs from non-point sources.
Questions with respect to the contents of this report should be directed to:
Coordinator, LSEMS StudiesMinistry of the Environment, Central Region7 Overlea BoulevardToronto, OntarioM4H 1A8
OR
General ManagerLake Simcoe Region Conservation AuthorityBox 282Newmarket, OntarioL3Y 4X1
ii

DISCLAIMER
The material presented in these reports is analytical support information and does notnecessarily constitute policy or approved management priorities of the Province and/or theevaluation of the data and findings, should not be based solely on this specific report.Instead they should be analysed in light of other reports produced within the comprehensiveframework of this environmental management strategy.
Reference to equipment, brand names or suppliers in this publication is not to be interpretedas an endorsement of that product or supplier by the authors, the Ministry of theEnvironment or the South Lake Simcoe Conservation Authority.
iii

ABSTRACT
This report provides a complete data record of all water quantity and quality informationcollected during 1982, 1983 and 1984 for the Lake Simcoe Environmental ManagementStrategy (LSEMS) studies. During 1982 and 1983 seven water level recorders and thirteenwater quality stations were installed to determine discharge and nutrient concentrations forthe four largest watersheds of the Lake Simcoe drainage basin. These four watersheds werethe Pefferlaw Brook, the Beaverton, Black and Holland Rivers. The Holland River was mostintensively gauged and sampled watershed due to it's variability in landuse characteristicsand the backwater influences of Lake Simcoe.
iv

LAKE SIMCOE ENVIRONMENTAL MANAGEMENT STRATEGY Technical Report A.6
PHOSPHORUS MODELLING AND CONTROL OPTIONSTable of Contents
Forward iDisclaimer iiiAbstract ivTable of Contents vList of Figures viiiList of Tables ix
Section Title Page
1 INTRODUCTION 11.1 Lake Simcoe Studies to Date 1
2 DESCRIPTION OF THE LAKE SIMCOE DRAINAGE BASIN 42.1 Location 42.2 Physiography 42.3 Soils 42.4 Drainage 72.5 Climate 72.6 Land Use 10
2.6.1 Description of the Urban Centres 102.6.1.1 Aurora 102.6.1.2 Bradford 132.6.1.3 Barrie 132.6.1.4 Newmarket 172.6.1.5 Orillia 172.6.1.6 Uxbridge 19
2.7 Agricultural Activities 212.7.1 Cropping Activities 212.7.2 Livestock Operations 212.7.3 Cultivated Polders 22
3 DATA COLLECTION PROGRAM 253.1 Water Quantity Monitoring Network 25
3.1.1 Urban Test Catchment 283.2 Holland Marsh Pump Calibration 28
3.2.1 Historical Pump Operation 293.3 Water Quality Monitoring Network 30
3.3.1 Urban Test Catchment 32
v

4 POLLUTANT LOAD BASED ON MONITORING 344.1 Tributary and Polder Loadings: Calculations and Results 34
4.1.1 Sewage Treatment Plants 354.2 Load Discussion 36
4.2.1 Tributaries 364.2.2 Vegetable Polders 414.2.3 Sewage Treatment Plants 42
5 MODELLING AND EXTRAPOLATION TOOLS 435.1 Atmospheric Load 445.2 Sewage Treatment Facilities 445.3 Urban Washoff 46
5.3.1 Description of Storm 465.3.2 Data Collection for Storm Model Formulation 475.3.3 Test Catchment 475.3.4 Storm Model Calibration and Verification 495.3.5 Loads Generated by Storm 49
5.4 Cottage Tile Leakage 555.5 Phosphorus Loads from Soil Erosion to Tributary Waters 55
5.5.1 Lands Directorate - Priority Management Areas 555.5.2 G.A.M.E.S. 565.5.3 Application of the GAMES Model 585.5.4 Comparison with Monitoring Data 595.5.5 Results 60
5.6 Loadings from Livestock Operations 605.7 Streambank Erosion Loads 645.8 Evaluation of the Potential Soil Loss 65
5.8.1 Application of the USLE 655.8.1.1 Basin Study (Tier 1) 675.8.1.2 High Erosion Areas Map Study (Tier 2) 705.8.1.3 High Erosion Areas Field Study (Tier 3) 73
5.8.2 Other Studies 745.8.3 Study Comparison 74
6 DISCUSSION OF LAKE SIMCOE PHOSPHORUS LOADS AND SOURCES 796.1 Direct Lake Simcoe Phosphorus Loading Estimates 80
6.1.1 Atmospheric Loads 806.1.2 Built-up Areas 806.1.3 Cottages 816.1.4 Sub-basin Tributaries 82
6.2 Indirect Lake Loading From Tributary Sources 846.2.1 Ground Water Discharges 846.2.2 Built-up Areas 846.2.3 Cropland and Other Soil Erosion 85
vi

6.2.4 Streambank Erosion 866.2.5 Livestock Operations 866.2.6 Phosphorus Loads From Vegetable Polders 86
7 EVALUATION OF PHOSPHORUS CONTROL OPTIONS 887.1 Holland Marsh Polder 88
7.1.1 Drainage Canal Pumping Station Study 887.1.2 Phosphorus Removal from Polder Pump-off Water 90
7.1.2.1 Chemical Precipitation 907.1.2.2 Duckweed Harvesting 98
7.1.3 Phosphorus Removal Through Cultivated Muck Soils 1007.1.4 Phosphorus Fertilizer Study 106
7.2 Control Alternatives for Built-up Areas 1117.3 Cottages 1127.4 Soil Erosion 1127.5 Streambank Erosion 118
7.5.1 Rating System for the Evaluation of Severityof Streambank Erosion 119
7.5.2 Streambank Erosion Inventories 1197.5.3 Proposed Remedial Measures and Possible
Phosphorus Reductions 1207.5.4 Preliminary Estimate of Costs 1207.5.5 Dyke Erosion Problems 122
7.6 Livestock Operations 126
vii

LIST OF FIGURES
Figure Title Page2.1 Location of Lake Simcoe Basin 52.2 Soil Texture Map 62.3 Drainage Sub-Basins of Lake Simcoe 82.4 Meteorological Data for Orillia, Barrie and Bradford 92.5 Location of Sewage Treatment Plants 112.6 Land Use - Town of Aurora 122.7 Land Use - Town of Bradford 142.8 Land Use - City of Barrie 152.9 Land Use - Town of Newmarket 162.10 Land Use - City of Orillia 182.11 Land Use - Town of Uxbridge 202.12 Vegetable Polders Along the Holland River 233.1 Water Quantity Stations Prior to 1982 263.2 Water Quantity Monitoring Stations on Holland River System 273.3 Water Quality Monitoring Network 314.1 Annual Precipitation for Barrie and Bradford Stations 375.1 Location and Area of Bayview Park Test Catchment 485.2 Observed and Simulated Runoff for Bayview Park Test Catchment 505.3 Observed and Simulated Suspended Solids for Bayview Park Test Catchment 525.4 Observed and Simulated Total Phosphorus for Bayview Park Test Catchment 535.5 Generalized Version of Priority Management Areas 575.6 Manure Pathways to Receiving Channels in the Lake Simcoe Basin 625.7 Three-Tiered Approach to Identification of High Potential Erosion Areas 665.8 Estimated Gross Potential Erosion 695.9 Erosion Rate Comparison 767.1 Jar Test Analysis of Holland Marsh Polder Pump Off Water (1982) 917.2 Jar Test Analysis of Holland Marsh Polder Pump Off Water (1985) 927.3 Fennel Series 1027.4 Ustis Series 1037.5 Goderich Series 1047.6 Goderich Series 1057.7 The Vertical Distribution of Phosphorus in Goderich Soil 1077.8 Percentage of Total Acreage Exceeding 60 ppm of Phosphate 1097.9 Location of Sites for Air Photo Interpretation 123
viii

LIST OF TABLES
Table Title Page2.1 Agricultural Land Use 212.2 Livestock Populations 213.1 Water Quality Stations and Period of Record 283.2 Pumping Capacities for Bradford and Springdale Pumping Stations 293.3 Total Pump Volumes for the Holland Marsh Polder 1979-1984 303.4 Period of Record and Analytical Tests 304.1 Water Quality Stations and Years of Record 344.2A Suspended Solids Loads and Unit Area Loads 384.2B Total Phosphorus and Unit Area Loads 394.2C Filtered Reactive Phosphorus and Unit Area Loads 404.3 Annual Phosphorus Loads from the Various STP's 355.1 Annual Phosphorus Loads from Sewage Treatment
Facilities for the Years 2001 and 2031 465.2 Observed and Simulated Water Quantity and Quality Data 515.3 STORM Simulation Results Summary 1978-82 555.4 Annual Phosphorus Loads from Urban Washoff 555.5 Delivered Sediment and Phosphorus Unit Area Loads 595.6 Comparison of Monitored to GAMES Modelled Annual
Total Phosphorus Loads 595.7 Total Phosphorus Loads from Soil Erosion Delivered to
Lake Simcoe Tributaries 605.8 Number and Type of Livestock/Poultry in the Lake Simcoe Basin 615.9 Confinement of Inventory Livestock 615.10 Assumed Manure Management of Livestock Operations 635.11 Phosphorus Production Loading to Channels and Unit Area Loads -
By Subwatershed 645.12 Annual Gross Potential Soil Loss and Suspended Solids Delivery Ratios 715.13 Potential Erosion by Landuse abd Slope Class 725.14 Support Practice Factors for Erosion Control 736.1 Estimated Urban Phosphorus Loads Discharged Directly Into Lake Simcoe 816.2 Estimated Phosphorus Inputs to Lake Simcoe from all Sources 836.3 Estimated Urban Phosphorus Loads Entering the
Tributary Waters of Lake Simcoe 856.4 Phosphorus Loads in the Holland Marsh Polder Pump Off Water 867.1 Annual Discharge Volumes and Phosphorus Loads
for the Holland Marsh Polder 897.2 Annual Removal of Total Phosphorus by Chemical
Precipitation of Holland Marsh Polder Pump Off Water 937.3 Design Considerations of Control Scheme A and B 957.4 Cost Considerations of Scheme A and B 977.5 Averaged Leaching Volumes of the Organic Soil Cores 101
ix
7.6 Phosphorus Requirements for Vegetables on Organic Soils 1107.7 Potential Soil Loss Changes due to Alternative
Tillage Practices for Targeted Areas 1147.8 Potential Soil Loss Changes due to Alternative Tillage Practices
and Crop Rotation for Target Areas 1167.9 "C" Factors for Chisel Plough 1177.10 Potential Soil Loss Changes due to Chisel Tillage Practices and
Residue Management 1177.11 Distribution of Problem Erosion Sites 1217.12 Results of Historical Air Photo Interpretation of the Lower Holland River 124
x

1 INTRODUCTION
Lake Simcoe is an extremely valuable freshwater resource which has become endangereddue to an accelerated rate of eutrophication. The undesirably high annual phosphorus inputto the lake has been identified as the single most important factor contributing to theprocess (1). Municipal sewage effluent, rural and urban runoff are the major sources ofphosphorus entering the lake. Work is presently being conducted to reduce or eliminate theinputs of phosphorus from major sewage treatment plants (STP) in the drainage basin. Whilethe management of these "point sources" of phosphorus will be beneficial, it is neverthelessimportant that "non-point" or diffuse sources be assessed. If these sources are found to besignificant they must be seriously considered in developing an overall management strategyfor future reductions of lake phosphorus loadings. It is the goal of this report to investigatethese diffuse sources and recommend approaches for their control.
The Overview of Phosphorus Sources, Loads and Remedial Measures Studies has four mainobjectives:
1. To identify the sources of phosphorus loadings from rural and urban areas within theLake Simcoe drainage basin and to determine their magnitude and significance incomparison with other sources.
2. To carry out land and streambank erosion inventory studies identifying high erosionareas and problem streambank sites.
3. To carry out studies in cultivated marsh areas (polders) to quantify phosphorusloadings, phosphorus leaching of muck soils and treatability of pumped off water.
4. To identify best management practices that would reduce the phosphorus loadscontributed by rural and urban runoff.
This overview provides a summary of all the land based studies completed by Lake SimcoeEnvironmental Management Strategy (LSEMS) studies (2, 3, 4, 5, 6, 7, 8,). These studiesidentified and quantified sources of phosphorus loads, identified and prioritized streambankerosion sites and provided information on possible remedial measures for phosphorusreductions. Considerable effort was dedicated to the application of computer modellingtechniques which were used to evaluate rural soil and phosphorus loss and to identifypriority management areas for remedial measures.
1.1 LAKE SIMCOE STUDIES TO DATE
For decades, Lake Simcoe has served as a very important recreational resource providinga major cold and warm water fishing industry in southern Ontario. The increasing pressure
-1-

for urbanization and the desire to protect the recreational value of the lake led the OntarioMinistry of the Environment (MOE) in 1971 to undertake a four year study into the statusof water quality and water use of Lake Simcoe.
The results of the four year study were documented in a 1975 report entitled "Lake SimcoeBasin - A Water Quality and Use Study" (1). The report concluded that the general waterquality of Lake Simcoe was good, although there was evidence of water quality degradationwithin the major bay areas. This water quality degradation could be related to man'sactivities within the watershed.
The 1975 report identified phosphorus as the major nutrient contributing to theeutrophication of the lake. With this knowledge it was recommended that very stringentphosphorus guidelines be proposed for all sewage treatment plant discharges and othersources of waste material from municipalities. In addition, several recommendations tominimize pollution from land drainage and private sources were presented.
That same year, the Ontario Ministry of Natural Resources (MNR) initiated studies on thelake's fish population. Significant changes in the fish population and its age structure werefound and it was concluded that natural reproduction by lake trout and whitefish was injeopardy. Stresses impacting the fish community were identified as: declining water quality,heavy exploitation (fishing) levels and the introduction of a non-indigenous species of smelt(Osmerus mordax).
Increasing concerns about the quality of the lake prompted the formation of twocommittees, the Lakes Simcoe-Couchiching Report Committee and the LakesSimcoe-Couchiching Steering Committee in 1975. The Report Committee was directed bythe Cabinet Committee on Resources Development (CCRD) to assess, identify and deal withthe various types of environmental problems in the Lakes Simcoe-Couchiching drainagebasin. The resulting report entitled "Lake Simcoe-Couchiching Basin Environmental Strategy"(9), published in 1979, repeated many of the findings of the 1975 report. In addition,however, it identified particular environmental problems, e.g. phosphorus loads from theHolland Marsh polder and potentially increased loadings resulting from population growth.
Many recommendations emerged from the 1979 report and were presented to CCRD. CCRDresponded to the report by calling for the development of a water management strategy forLake Simcoe with MOE in the role of "lead agency". As a result, the Lake SimcoeEnvironmental Management Strategy (LSEMS) was initiated in 1981. The Overview ofPhosphorus Sources, Loads and Remedial Measures Studies summarizes the land basedstudies undertaken as part of LSEMS.
-2-

REFERENCES
(1 Ministry of the Environment - June, 1975. "Lake Simcoe Basin - A Water Quality andUse Study". M.O.E.
Frank D., D. Henry, J. Antoszek and F. Engler - 1986. "Lake Simcoe Tributary WaterQuantity and Quality Data Report". Lake Simcoe Environment Management Strategy,Technical Report Series, Technical Report A.1.
Frank D., D. Henry, T. Chang and B. Yip - 1986. "Newmarket Urban Test Catchment- Data Report". Lake Simcoe Environmental Management Strategy, Technical ReportSeries, Technical Report A.2.
Antoszek J., T. Stam and D. Pritchard - 1986. "Streambank Erosion InventoryVolume I. Lake Simcoe Environmental Management Strategy, Technical Report Series,Technical Report A.3.
Antoszek J., S. Meek, K. Butler and O. Kashef - 1986. "Streambank Erosion InventoryVolume II. Lake Simcoe Environmental Management Strategy, Technical ReportSeries, Technical Report A.3.
Rupke and Associates - 1986. "Calibration Summary of the Holland Marsh PolderDrainage Pumps". Lake Simcoe Environmental Management Strategy, TechnicalReport Series, Technical Report A.4.
Limnos Ltd. - 1985. "Phosphorus Control by Duckweed Harvest: Holland MarshPolder Drainage System. Lake Simcoe Environmental Management Strategy,Technical Report Series, Technical Report A.5.
Thomas R. L. and G. Sevean - 1985. "Phosphorus Movement Through CultivatedMuck Soils : Holland Marsh Polder" Lake Simcoe Environmental ManagementStrategy, File Report.
Ministry of the Environment - 1979. "Lake Simcoe-Couchiching Basin-EnvironmentalStrategy" M.O.E.
-3-

2 DESCRIPTION OF THE LAKE SIMCOE DRAINAGE BASIN
LOCATION
The Lake Simcoe drainage basin is located in Southern Ontario, approximately 50 kilometres(km) north of Toronto (Figure 2.1). The drainage basin occupies a total land and watersurface area of 3565 square kilometres in which the land portion represents approximately80% (2840 square kilometres). Most rivers in the drainage basin flow in a northerly directionfrom headwaters situated in the Oak Ridges Moraine. The basin discharges through theoutlet at Atherley into Lake Couchiching.
PHYSIOGRAPHY
The topographical features of the Lake Simcoe drainage basin are mainly attributed to thedeposition of unconsolidated glacial material during the Late Wisconsin Ice Age. The mostsouthern boundary of the drainage basin is along a prominent physiographic unit known asthe Oak Ridges Moraine. Four of the basin's major river systems originate within this glacialfeature. North of the Oak Ridges Moraine, Chapman and Putnam (1) identified three othermajor physiographic units. These units are the Schomberg Clay Plains, PeterboroughDrumlin Field, and the Simcoe Lowlands.
The Schomberg Clay Plains are found immediately north of the Oak Ridges Moraine nearSchomberg and Newmarket. Underlying the clay surface soils is material of a drumlinizedtill plain, with many of the larger drumlins partly exposed. These drumlins are part of thePeterborough Drumlin Field. In the eastern portion of the watershed there are many swampyareas between the drumlins.
Lake Simcoe is situated entirely in the eastern portion of the Simcoe Lowlands. Along thenorthern and western shores of the lake the lowland consists of a narrow bouldery terracefor the most part, confined by a low bluff cut by the highest stage of Lake Algonquin. On thesouthern and eastern shores there are broader, swampy, sandy plains.
SOILS
Southern Ontario is a glaciated plain underlain predominantly by Paleozoic limestones andshales. In most areas of southern Ontario there is deep overburden with a high content oflimestone and clay. A variety of environmental factors are responsible for the developmentof the present soils.
A broad range of soil types occur within the Lake Simcoe drainage basin. Distinct texturalclasses can, however, be noted in each of the four main physiographic regions:
-4-

Figure 2.1. Location of Lake Simcoe Drainage Basin.
-5-

Figure 2.2. Soil Texture Map.
-6-

Oak Ridge Moraine sandy soils,
Peterborough Drumlin Fields loams -Brown Forest soils,-Grey Brown Podzolic soil,
Schomberg Clay Plains silty-clay loams, -clays, -loams,
Lake Simcoe Basin portionof the Simcoe Lakelands swamp, wet sands (1).
Figure 2.2 illustrates the predominant soil textures for the entire Lake Simcoe drainage basin(3, 4, 5, 6, 7). A complete list of all of the soils found in the counties of the Lake Simcoedrainage basin are presented in Table A.1 of Appendix A.
2.4 DRAINAGE
Four of the five major tributaries flowing into Lake Simcoe originate in the Oak RidgesMoraine. They are the Holland, Black, Beaverton Rivers and Pefferlaw Brook. Thesetributaries follow a northerly path to discharge at points along the southern shoreline. TheTalbot River flows westward from Balsam Lake to discharge at a point along the easternshore. Annual mean discharge for these river systems ranges from 2 to 4 cubic meters persecond (cm). Peak flows range from 20 to 60 cm and usually occur during the spring meltperiod.
For the purposes of this study, the drainage basin was subdivided into eight sub-basins.These sub-basins include the five major river systems and three land areas with no majordrainage pattern. These three land areas are the western shore drainage area (North West),the northern shore (North East) and the Maskinonge River. The boundaries and areas ofthese sub-basins are illustrated in Figure 2.3.
2.5 CLIMATE
The Lake Simcoe area has a temperate climate that is influenced by local topography.Climatic influence is also attributed to the close proximity of the Great Lakes System. Thelong term mean annual temperature varies from 5.5°C for Orillia in the north to 6.9°C forBradford in the south. The long term mean annual precipitation varies from 907 mm (1390mm snow) for Orillia to 716 mm (900 mm snow) for Bradford (10 mm of snow is equivalentto 1 mm of water). Figure 2.4 summarizes climatic data observed at three meteorologicalstations within the drainage basin (2).
-7-

Figure 2.3. Drainage Sub-Basins of Lake Simcoe.
-8-

Figure 2.4. Meteorological Data for Orillia, Barrie and Bradford (2).
-9-
2.6 LAND USE
Approximately 61% (1,740 square kilometres) of the total land use within the Lake Simcoe'sdrainage basin is farmland, while only 2% (65 square kilometres) is urbanized. Included inthe urban component are approximately 12,000 cottages surrounding Lake Simcoe (8). Theremaining 37% of land use is classified as transportation corridors, extractive industry (sandand gravel), wooded and idle land.
2.6.1 DESCRIPTION OP THE URBAN CENTRES
The urban areas of the Lake Simcoe drainage basin vary from rural towns supportingagricultural based communities to small cities supporting a number of manufacturing andcommercial facilities. The total population of the drainage basin in 1982 was 190,000 withthe six major communities; Aurora, Barrie, Bradford, Newmarket, Orillia and Uxbridgeaccounting for approximately 126,000 of the total.
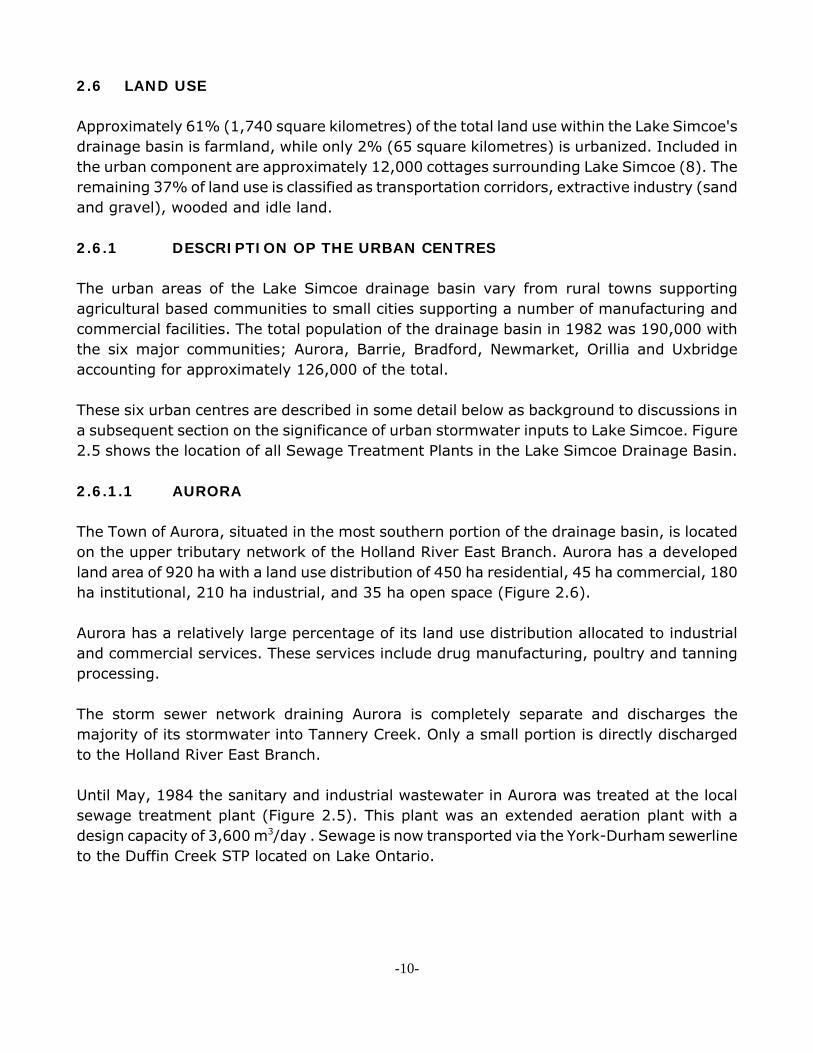
These six urban centres are described in some detail below as background to discussions ina subsequent section on the significance of urban stormwater inputs to Lake Simcoe. Figure2.5 shows the location of all Sewage Treatment Plants in the Lake Simcoe Drainage Basin.
2.6.1.1 AURORA
The Town of Aurora, situated in the most southern portion of the drainage basin, is locatedon the upper tributary network of the Holland River East Branch. Aurora has a developedland area of 920 ha with a land use distribution of 450 ha residential, 45 ha commercial, 180ha institutional, 210 ha industrial, and 35 ha open space (Figure 2.6).
Aurora has a relatively large percentage of its land use distribution allocated to industrialand commercial services. These services include drug manufacturing, poultry and tanningprocessing.
The storm sewer network draining Aurora is completely separate and discharges themajority of its stormwater into Tannery Creek. Only a small portion is directly dischargedto the Holland River East Branch.
Until May, 1984 the sanitary and industrial wastewater in Aurora was treated at the localsewage treatment plant (Figure 2.5). This plant was an extended aeration plant with adesign capacity of 3,600 m3/day . Sewage is now transported via the York-Durham sewerlineto the Duffin Creek STP located on Lake Ontario.
-10-
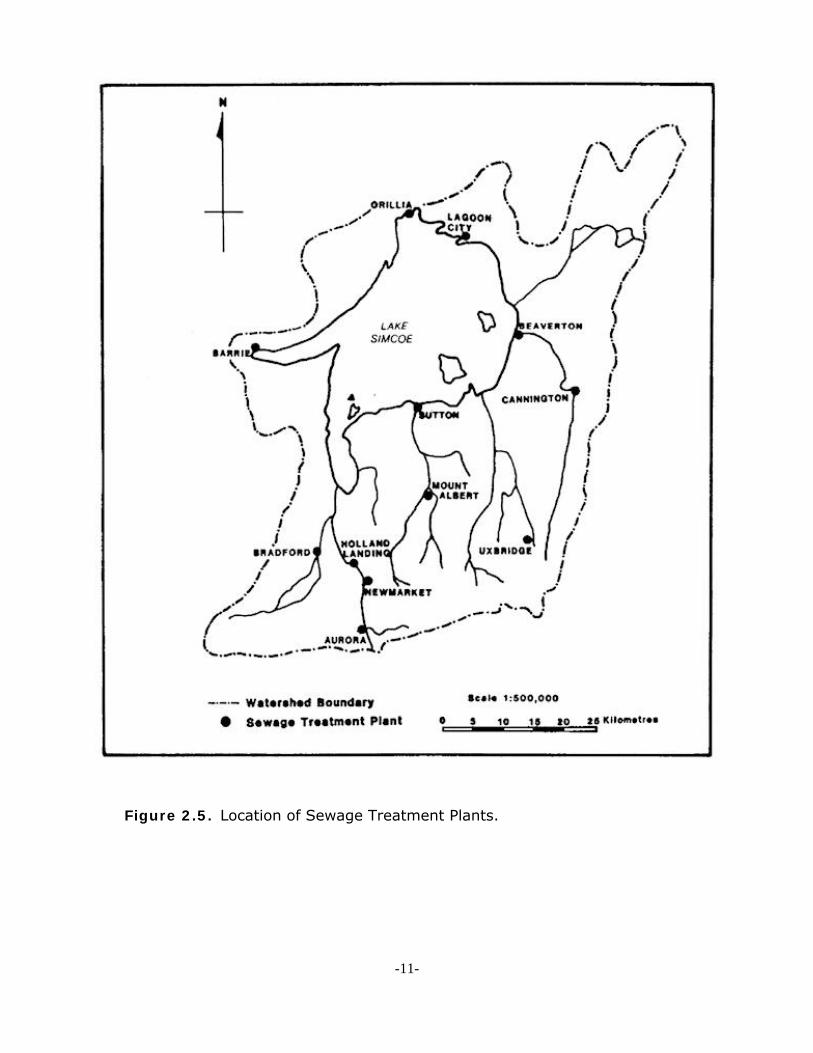
Figure 2.5. Location of Sewage Treatment Plants.
-11-

-12-

2.6.1.2 BRADFORD
The Town of Bradford is located on the Holland River, at the north end of the Holland Marshvegetable polder. Bradford has a total developed land area of 203 ha consisting of 150 haresidential, 40 ha commercial, 10 ha institutional, and 3 ha open space (Figure 2.7).
The Town of Bradford primarily services the marsh farming community with packing plants,transportation facilities and machinery repair.
Bradford has separate sanitary and storm sewer networks. The storm sewer systemdischarges directly into the Holland River.
The sanitary and industrial wastewater in Bradford is treated at the local sewage treatmentplant (Figure 2.5). Recently upgraded, this plant is an extended aeration plant with a designcapacity of 6,800 m3/day. The sewage effluent is discharged to the Holland River nearHighway #11 .
2.6.1.3 BARRIE
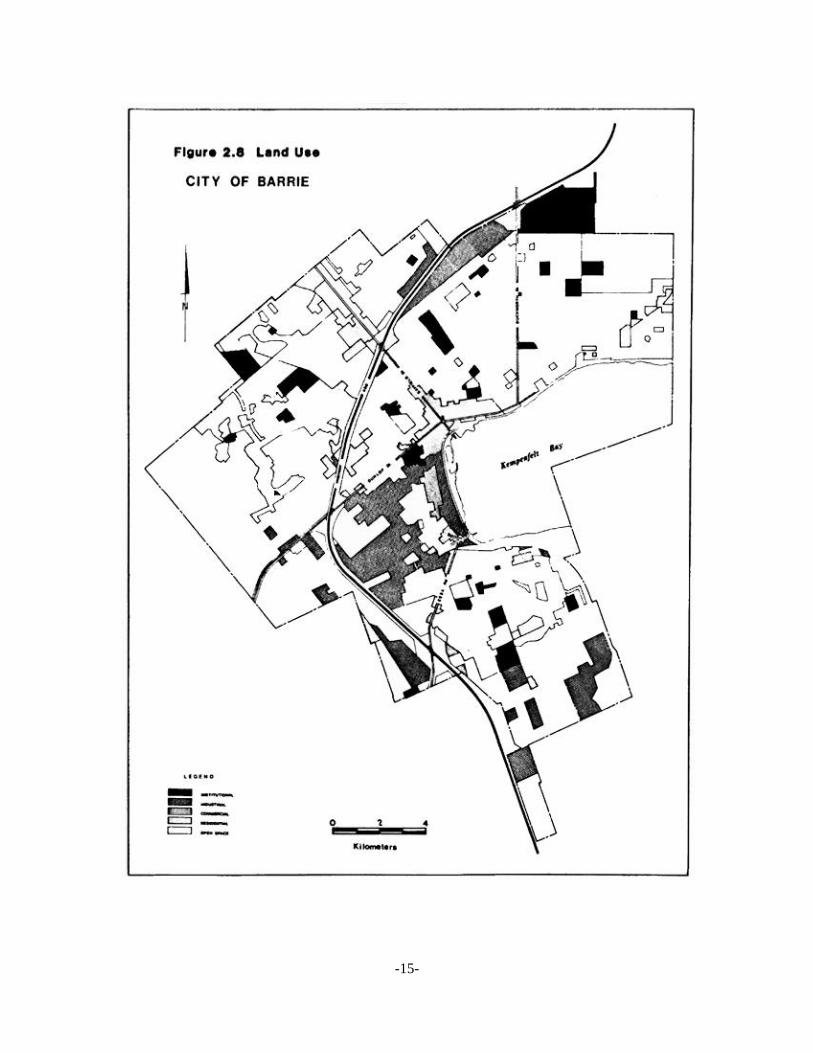
The City of Barrie is situated on Kempenfelt Bay, which is on the western shore of LakeSimcoe. The city has a developed land area of 1,545 ha with a land use distribution ofresidential 975 ha, commercial 105 ha, institutional 170 ha, industrial 250 ha, and openspace 45 ha (Figure 2.8).
Barrie's industrial base is noted for its diversity. Industries located within the city producea wide range of products that includes: beer, tires, hygiene products, tools, clothing,cosmetics and mechanical machinery.
The stormwater network primarily discharges into Kempenfelt Bay, however, a small portionof the network drains northward to the Little Lake watershed. The city has completelyseparate sanitary and storm sewer systems.
The sanitary and industrial wastewater in Barrie is treated locally at the activated sludgeplant (Figure 2.5) with a 1984 design capacity of 27,300 m3/day. The sewage effluent isdischarged to Kempenfelt Bay on Lake Simcoe. Improvements to this facility, which willreduce the phosphorus concentration in effluent to 0.3 mg/L, are slated for completion in1986.
-13-

-14-
-15-
-16-

2.6.1.4 NEWMARKET
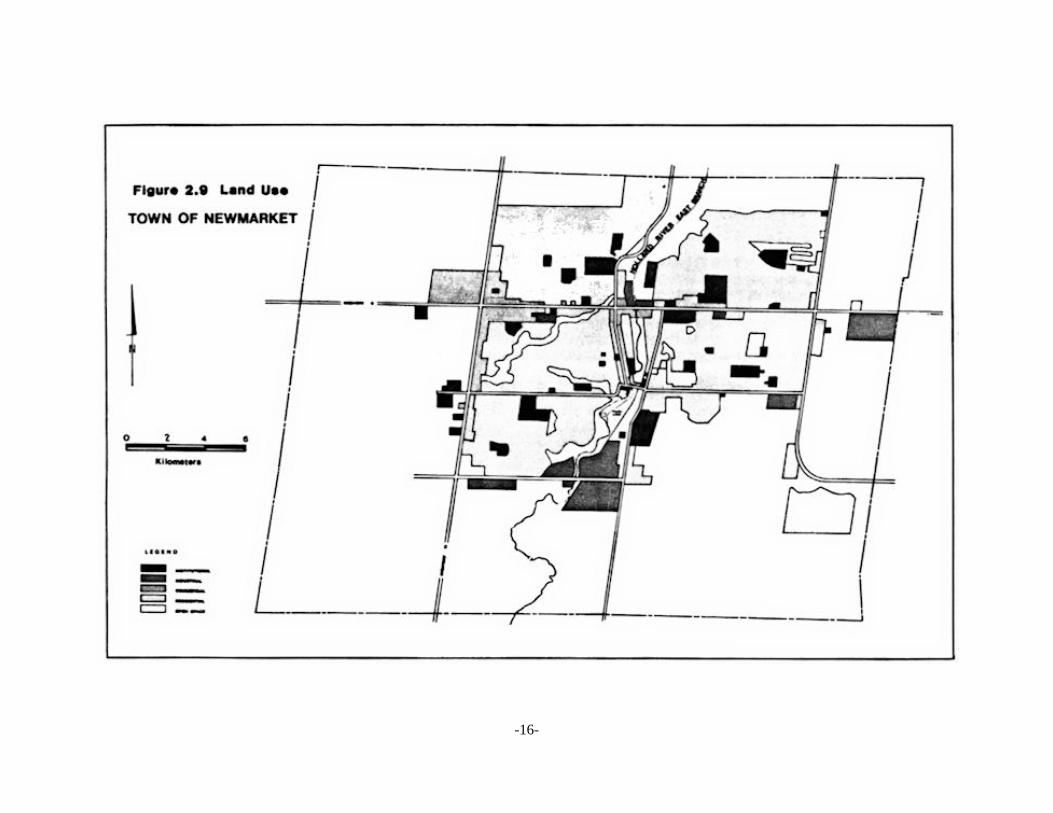
The Town of Newmarket is located on the Holland River East Branch, 6 km north of Aurora.The town has a developed land area of 1,100 ha. Newmarket's land use distribution consistsof residential 775 ha, commercial 100 ha, institutional 110 ha, industrial 55 ha, and openspace 60 ha (Figure 2.9).
The Newmarket industrial area is not as large as one would expect from its populationtrends. Newmarket is a commuter based community that supports the industrial base ofToronto and its surrounding areas. However, the town also has its own industriesmanufacturing writing and marking products, plastics and metal processing.
The Town of Newmarket provides a stormwater network that discharges into the HollandRiver East Branch. Newmarket employs modern stormwater management concepts such asaerated detention ponds and underground storage tanks.
The sanitary and industrial wastewater in Newmarket was treated at the local sewagetreatment plant (Figure 2.5) until May 1984. This plant was a tertiary activated sludge plantwith a design capacity of 13,600 m3/day . Sewage is now being transported to the DuffinCreek STP located on Lake Ontario via the York-Durham sewerline.
2.6.1.5 ORILLIA
The City of Orillia is situated on the northwestern shore of Lake Simcoe. The city has a totaldeveloped area of 1,240 ha with a land use distribution of residential 860 ha, commercial125 ha, institutional 60 ha, industrial 105 ha, and open space 90 ha. However, only aportion of the city drains its stormwater to the lake. In total, 325 ha residential, 45 hacommercial, 20 ha institutional, 25 ha industrial and 35 ha open space drain to Lake Simcoe(Figure 2.10).
Orillia's industrial base includes the manufacture of heavy machinery, metal castings, rubberproducts and chemicals.
The stormwater network for Orillia is very similar to that of Barrie. However, stormwater isdischarged both to Lake Simcoe and Lake Couchiching with a small portion flowing north intothe Bass Lake watershed.
The sanitary and industrial wastewater in Orillia is treated at a conventional activated sludgesewage treatment plant (Figure 2.5). This plant has recently been updated. It has a designcapacity of 18,200 m3/day and discharges effluent to Shingle Bay on Lake Simcoe.
-17-

Figure 2.10. Land Use - City of Orillia.
-18-

2.6.1.6 UXBRIDGE
Uxbridge is located near the headwaters of the Uxbridge Brook, a tributary of the PefferlawBrook. Uxbridge has a developed land area of 201 ha. The landuse distribution consists ofresidential 140 ha, commercial 15 ha, institutional 15 ha, industrial 20 ha and open space11 ha (Figure 2.11).
The town supports two industries which produce chrome auto parts and propane tanks. Thestorm and sanitary sewer networks of Uxbridge are completely separated. The stormwaternetwork discharges directly into the Uxbridge Brook.
The sanitary and industrial wastewater in Uxbridge is treated at the local sewage treatmentplant (Figure 2.5). This plant uses an extended aeration treatment process with a designcapacity of 3,600 m3/day. The sewage effluent is discharged to the Uxbridge Brook locatedon the Pefferlaw Brook .
-19-
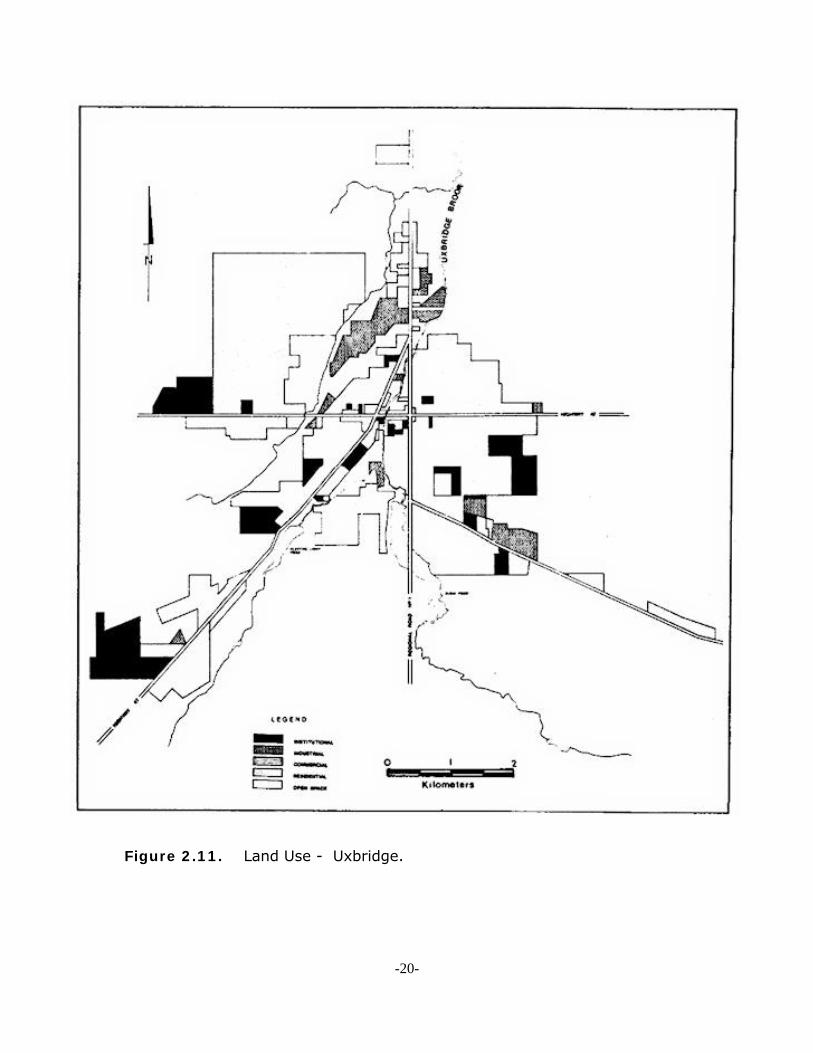
Figure 2.11. Land Use - Uxbridge.
-20-
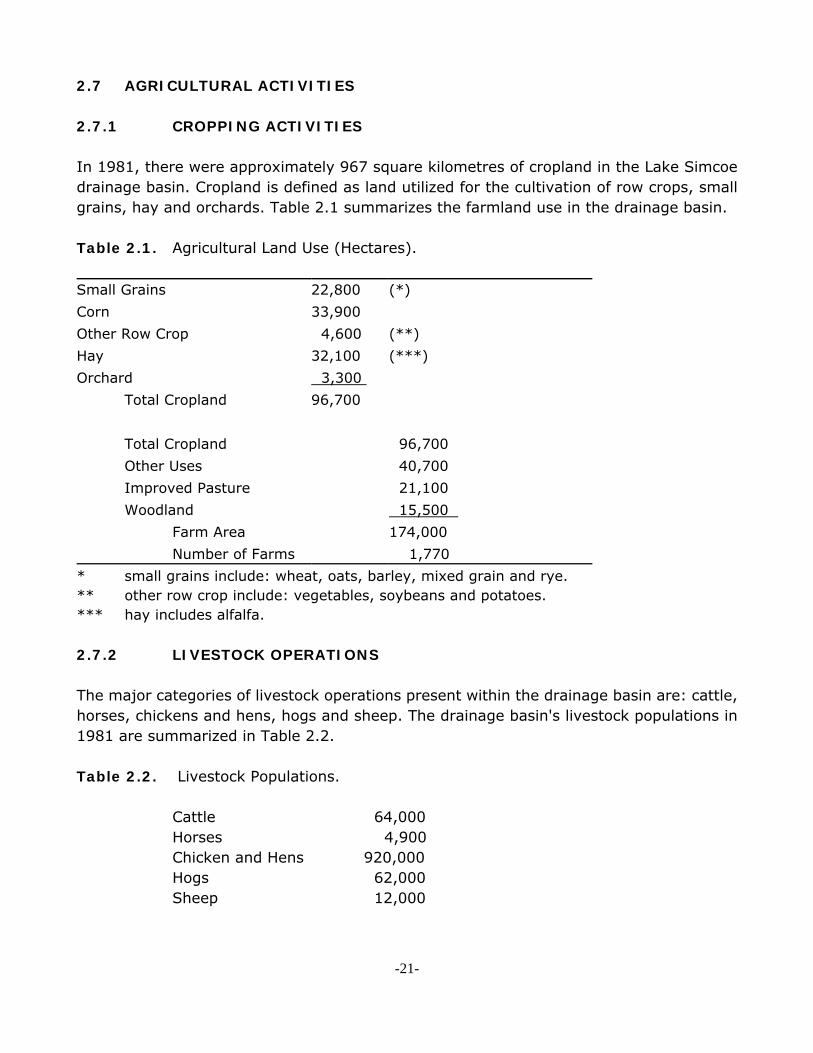
2.7 AGRICULTURAL ACTIVITIES
2.7.1 CROPPING ACTIVITIES
In 1981, there were approximately 967 square kilometres of cropland in the Lake Simcoedrainage basin. Cropland is defined as land utilized for the cultivation of row crops, smallgrains, hay and orchards. Table 2.1 summarizes the farmland use in the drainage basin.
Table 2.1. Agricultural Land Use (Hectares).
Small Grains 22,800 (*)Corn 33,900Other Row Crop 4,600 (**)Hay 32,100 (***)Orchard 3,300
Total Cropland 96,700
Total Cropland 96,700Other Uses 40,700Improved Pasture 21,100Woodland 15,500
Farm Area 174,000Number of Farms 1,770
* small grains include: wheat, oats, barley, mixed grain and rye.** other row crop include: vegetables, soybeans and potatoes. *** hay includes alfalfa.
2.7.2 LIVESTOCK OPERATIONS
The major categories of livestock operations present within the drainage basin are: cattle,horses, chickens and hens, hogs and sheep. The drainage basin's livestock populations in1981 are summarized in Table 2.2.
Table 2.2. Livestock Populations.
Cattle 64,000Horses 4,900Chicken and Hens 920,000Hogs 62,000Sheep 12,000
-21-

In addition, livestock densities referenced to improved pasture land were mapped for theentire drainage basin. Areas of delineation were developed from Census Canadaenumeration zones. These maps are presented in Appendix B.
2.7.3 CULTIVATED POLDERS
The Holland River system supports some of the largest cultivated marsh areas or "cultivatedpolders" within the province of Ontario. These marsh areas were originally formedapproximately 10,000 years ago, during the last retreat of glaciers from this area. LakeSimcoe flooded the land south of Cook Bay and subsequently, a large amount of organicmaterial was deposited. Since the 1930's, large tracts of these marsh areas have beendyked and drained solely for the purpose of providing good agricultural land. Figure 2.12shows the location and names of these cultivated polders.
The Holland Marsh polder is the most southern marsh of a series of marshes extending southfrom Cook Bay. This polder is approximately 3 km wide, 12 km long, 2800 ha in area andrepresents nearly two-thirds of the total cultivated marsh area of the Holland River system.It was dyked and drained during the 1930's to expose the muck soils. Water levels withinthe polder are still maintained by pumping.
-22-

Figure 2.12. Vegetable Polders Along the Holland River.
-23-

REFERENCES
(1) Chapman, L. J. and D. F. Putnam - 1973, "The Physiography of Southern Ontario",(p. 276 - 278).
(2) Environment Canada - 1981, "Canadian Climate Normals Temperature andPrecipitation", Atmospheric Environment Service, (p. 13, 21, 150).
(3) Department of Agriculture Canada - 1954. "Soil Map of York County Ontario", SoilSurvey Report No. 19, Agriculture Canada and Agriculture Ontario
(4) Department of Agriculture Canada - 1959. "Soil Map of Simcoe County Ontario", SoilSurvey Report No. 29, Agriculture Canada and Agriculture Ontario.
(5) Department of Agriculture Canada - 1957. "Soil Map of Victoria County Ontario", SoilSurvey Report No. 25, Agriculture Canada and Agriculture Ontario.
(6) Department of Agriculture Canada - 1979. "Soil Map of Ontario County Ontario", SoilSurvey Report No. 23, Agriculture Canada and Agriculture Ontario.
(7) Department of Agriculture Canada - 1945. "Soil Map of Durham County Ontario", SoilSurvey Report, Agriculture Canada and Agriculture Ontario.
(8) Ministry of the Environment - 1979. "Lake Simcoe-Couchiching Basin-EnvironmentalStrategy", M.O.E.
-24-
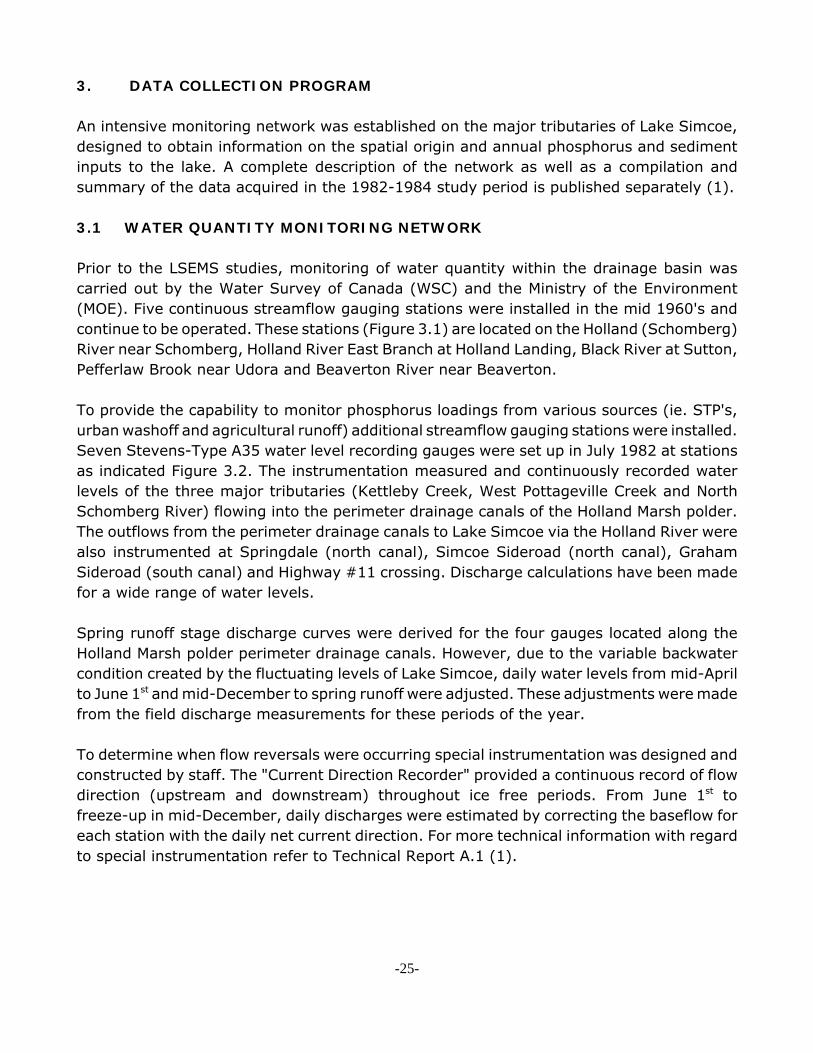
3. DATA COLLECTION PROGRAM
An intensive monitoring network was established on the major tributaries of Lake Simcoe,designed to obtain information on the spatial origin and annual phosphorus and sedimentinputs to the lake. A complete description of the network as well as a compilation andsummary of the data acquired in the 1982-1984 study period is published separately (1).
3.1 WATER QUANTITY MONITORING NETWORK
Prior to the LSEMS studies, monitoring of water quantity within the drainage basin wascarried out by the Water Survey of Canada (WSC) and the Ministry of the Environment(MOE). Five continuous streamflow gauging stations were installed in the mid 1960's andcontinue to be operated. These stations (Figure 3.1) are located on the Holland (Schomberg)River near Schomberg, Holland River East Branch at Holland Landing, Black River at Sutton,Pefferlaw Brook near Udora and Beaverton River near Beaverton.
To provide the capability to monitor phosphorus loadings from various sources (ie. STP's,urban washoff and agricultural runoff) additional streamflow gauging stations were installed.Seven Stevens-Type A35 water level recording gauges were set up in July 1982 at stationsas indicated Figure 3.2. The instrumentation measured and continuously recorded waterlevels of the three major tributaries (Kettleby Creek, West Pottageville Creek and NorthSchomberg River) flowing into the perimeter drainage canals of the Holland Marsh polder.The outflows from the perimeter drainage canals to Lake Simcoe via the Holland River werealso instrumented at Springdale (north canal), Simcoe Sideroad (north canal), GrahamSideroad (south canal) and Highway #11 crossing. Discharge calculations have been madefor a wide range of water levels.
Spring runoff stage discharge curves were derived for the four gauges located along theHolland Marsh polder perimeter drainage canals. However, due to the variable backwatercondition created by the fluctuating levels of Lake Simcoe, daily water levels from mid-Aprilto June 1st and mid-December to spring runoff were adjusted. These adjustments were madefrom the field discharge measurements for these periods of the year.
To determine when flow reversals were occurring special instrumentation was designed andconstructed by staff. The "Current Direction Recorder" provided a continuous record of flowdirection (upstream and downstream) throughout ice free periods. From June 1st tofreeze-up in mid-December, daily discharges were estimated by correcting the baseflow foreach station with the daily net current direction. For more technical information with regardto special instrumentation refer to Technical Report A.1 (1).
-25-
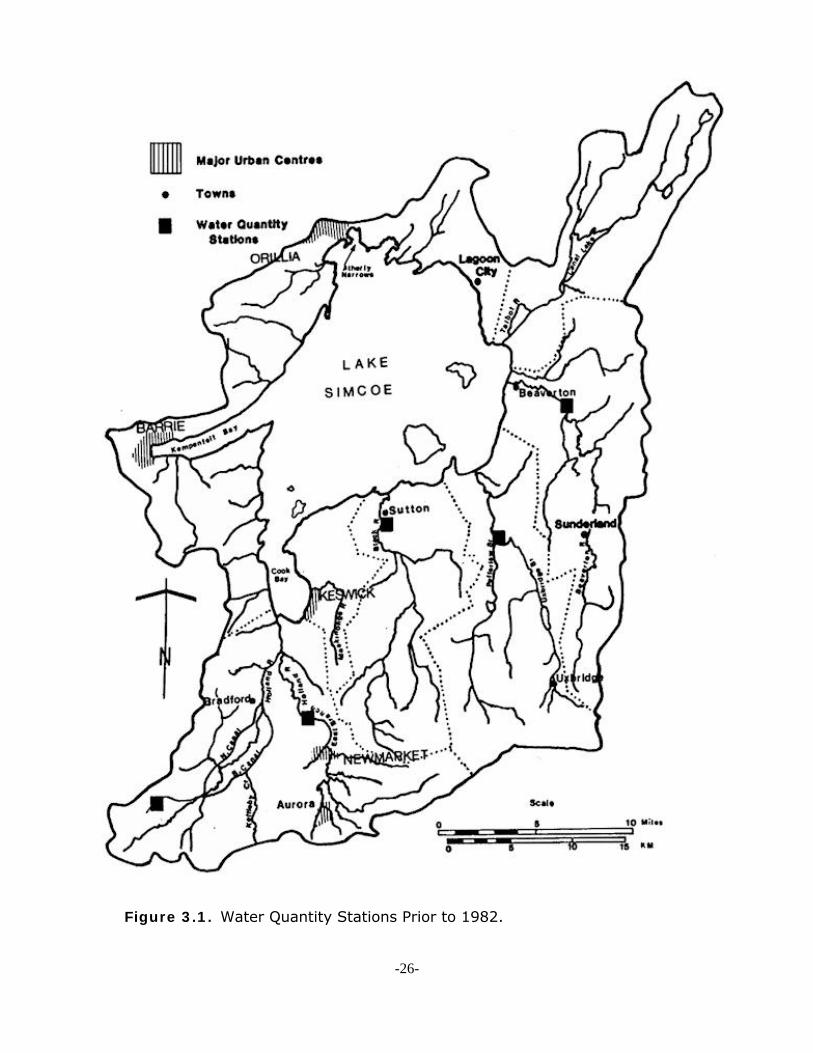
Figure 3.1. Water Quantity Stations Prior to 1982.
-26-

Figure 3.2. Water Quantity Monitoring Stations on Holland River System.
-27-

The average daily streamflows for the Black River at Sutton, Beaverton River nearBeaverton, Holland (Schomberg) River near Schomberg and Holland River East Branch atHolland Landing were provided by Water Survey of Canada. The average daily stream flowsof Pefferlaw Brook near Udora were provided by Central Region, Ministry of the Environment.The period of record for the above stations is shown in Table 3.1.
TABLE 3.1. Water Quantity Stations and Period of Record.
Station IdentificationNumber
Station Name and Location Period of Record
02EC009 Holland River at Holland Landing Oct 65 to Dec 8402EC010 Schomberg River Near Schomberg May 66 to Dec 8402EC012 Black River at Sutton (Baldwin) Nov 69 to Dec 84 03ECl02 Beaverton River Near Beaverton Oct 66 to Dec 8402EC103 Pefferlaw Brook Near Udora Dec 69 to Dec 8402EC117 Kettleby Creek at Hwy #9 Aug 82 to Dec 8402EC118 W. Pottageville Creek ‘02EC119 North Schomberg River ‘02EC120 North Holland Canal above Springdale “02EC121 North Holland Canal at Simcoe Rd. “02EC122 South Holland Canal at Graham Sd. Rd. “02EC123 Holland River at Hwy #11 “
3.1.1 URBAN TEST CATCHMENT
A specially instrumented test catchment was established in Bayview Park in the Town ofNewmarket in April 1983. This catchment was used to provide information on urbanstormwater runoff characteristics representative of urban residential areas in the drainagebasin. Instrumentation consisted of an Isco autosampler and a flow/level meter with aprinter plotter at the catchment outfall. A stage discharge relationship was derived toproduce storm hydrographs for each monitored event. The station was maintained untilAugust, 1984.
3.2 HOLLAND MARSH PUMP CALIBRATION
The Holland Marsh Drainage Commission operates and controls two pumping stations, theBradford Pumping Station located at the north end of the marsh and the Springdale PumpingStation located near the south end. Figure 3.2 shows the location of the two pumpingstations.
Water levels within the polder are currently kept at set limits to maintain optimum soilmoisture in the polder. During extreme dry periods, water can be siphoned from the
-28-
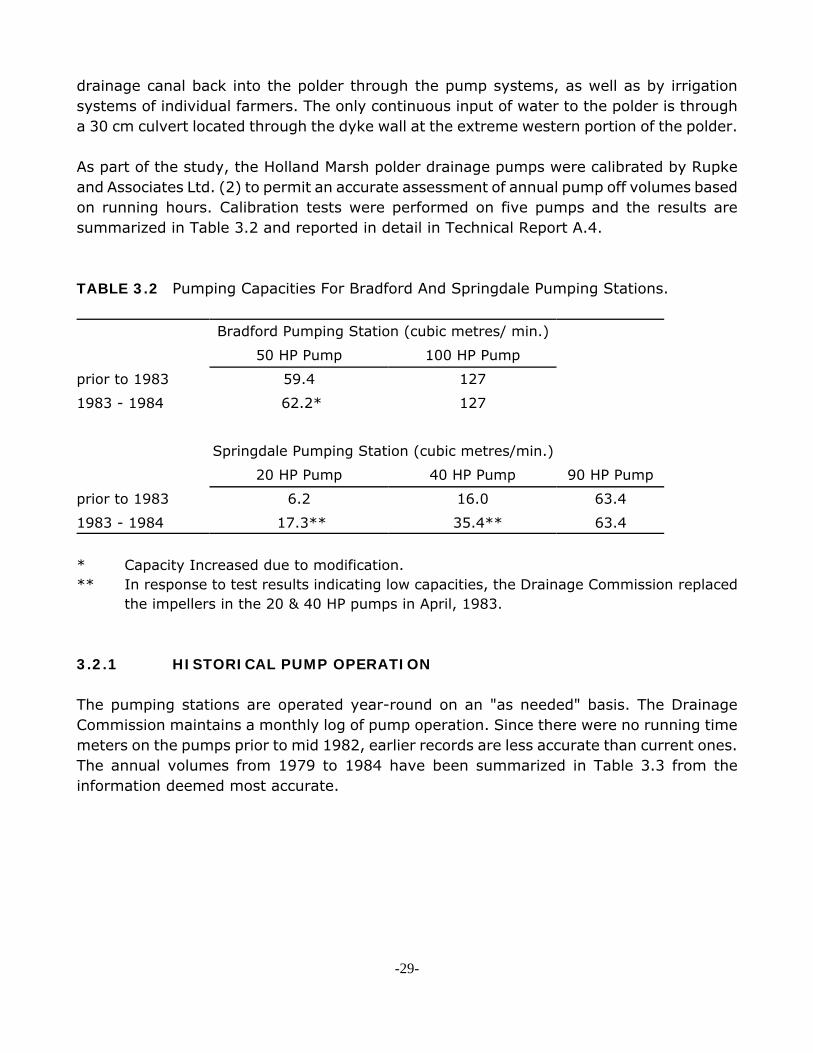
drainage canal back into the polder through the pump systems, as well as by irrigationsystems of individual farmers. The only continuous input of water to the polder is througha 30 cm culvert located through the dyke wall at the extreme western portion of the polder.
As part of the study, the Holland Marsh polder drainage pumps were calibrated by Rupkeand Associates Ltd. (2) to permit an accurate assessment of annual pump off volumes basedon running hours. Calibration tests were performed on five pumps and the results aresummarized in Table 3.2 and reported in detail in Technical Report A.4.
TABLE 3.2 Pumping Capacities For Bradford And Springdale Pumping Stations.
Bradford Pumping Station (cubic metres/ min.)
50 HP Pump 100 HP Pump
prior to 1983 59.4 127
1983 - 1984 62.2* 127
Springdale Pumping Station (cubic metres/min.)
20 HP Pump 40 HP Pump 90 HP Pump
prior to 1983 6.2 16.0 63.4
1983 - 1984 17.3** 35.4** 63.4
* Capacity Increased due to modification.** In response to test results indicating low capacities, the Drainage Commission replaced
the impellers in the 20 & 40 HP pumps in April, 1983.
3.2.1 HISTORICAL PUMP OPERATION
The pumping stations are operated year-round on an "as needed" basis. The DrainageCommission maintains a monthly log of pump operation. Since there were no running timemeters on the pumps prior to mid 1982, earlier records are less accurate than current ones.The annual volumes from 1979 to 1984 have been summarized in Table 3.3 from theinformation deemed most accurate.
-29-
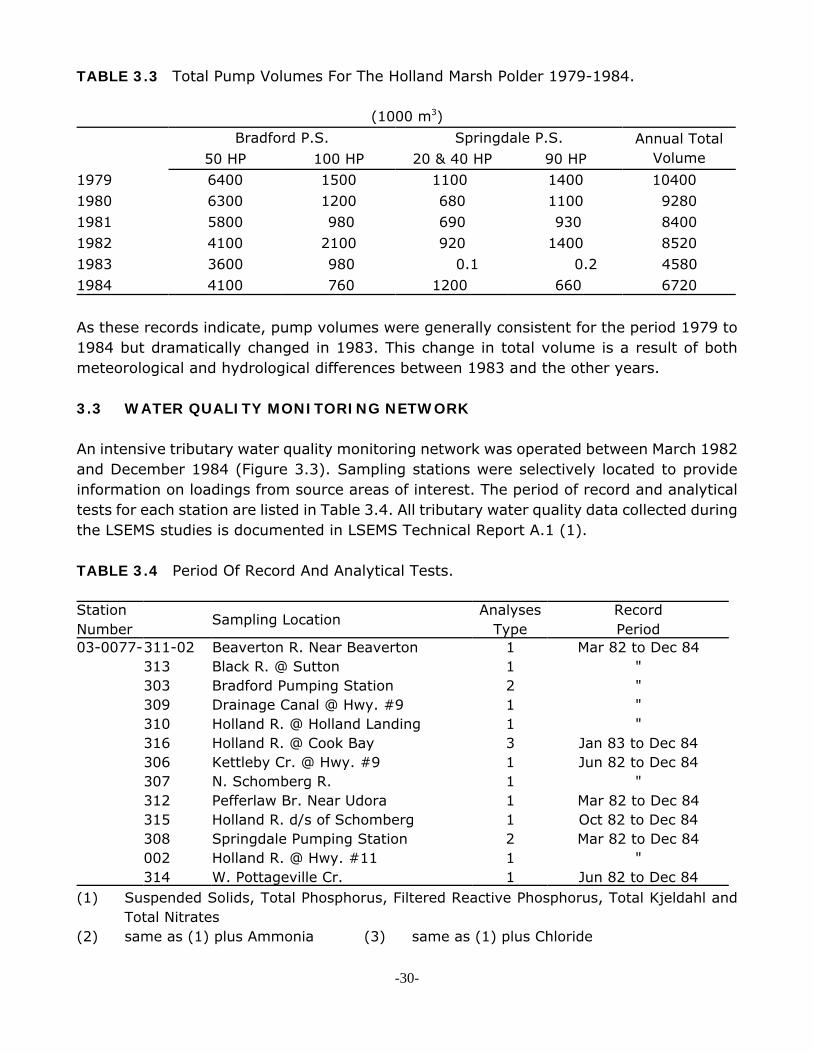
TABLE 3.3 Total Pump Volumes For The Holland Marsh Polder 1979-1984.
(1000 m3)Bradford P.S. Springdale P.S. Annual Total
Volume50 HP 100 HP 20 & 40 HP 90 HP1979 6400 1500 1100 1400 10400 1980 6300 1200 680 1100 92801981 5800 980 690 930 84001982 4100 2100 920 1400 85201983 3600 980 0.1 0.2 45801984 4100 760 1200 660 6720
As these records indicate, pump volumes were generally consistent for the period 1979 to1984 but dramatically changed in 1983. This change in total volume is a result of bothmeteorological and hydrological differences between 1983 and the other years.
3.3 WATER QUALITY MONITORING NETWORK
An intensive tributary water quality monitoring network was operated between March 1982and December 1984 (Figure 3.3). Sampling stations were selectively located to provideinformation on loadings from source areas of interest. The period of record and analyticaltests for each station are listed in Table 3.4. All tributary water quality data collected duringthe LSEMS studies is documented in LSEMS Technical Report A.1 (1).
TABLE 3.4 Period Of Record And Analytical Tests.
StationNumber
Sampling LocationAnalyses
TypeRecordPeriod
03-0077-311-02 Beaverton R. Near Beaverton 1 Mar 82 to Dec 84313 Black R. @ Sutton 1 "303 Bradford Pumping Station 2 "309 Drainage Canal @ Hwy. #9 1 "310 Holland R. @ Holland Landing 1 "316 Holland R. @ Cook Bay 3 Jan 83 to Dec 84306 Kettleby Cr. @ Hwy. #9 1 Jun 82 to Dec 84307 N. Schomberg R. 1 "312 Pefferlaw Br. Near Udora 1 Mar 82 to Dec 84315 Holland R. d/s of Schomberg 1 Oct 82 to Dec 84308 Springdale Pumping Station 2 Mar 82 to Dec 84002 Holland R. @ Hwy. #11 1 "314 W. Pottageville Cr. 1 Jun 82 to Dec 84
(1) Suspended Solids, Total Phosphorus, Filtered Reactive Phosphorus, Total Kjeldahl andTotal Nitrates
(2) same as (1) plus Ammonia (3) same as (1) plus Chloride
-30-

Figure 3.3 Water Quality Monitoring Network.
-31-
The Holland River watershed monitoring stations were located along the major tributariesentering the Holland Marsh polder perimeter drainage canal, the polder pumping stations,the Holland River at Cook Bay, Holland Landing and Highways #9 and #11.
The major tributaries feeding the Holland River upstream of Highway #11; namely KettlebyCreek, West Pottageville Creek, North Schomberg River, and the upper Holland River nearSchomberg were sampled on an event basis (ie. sampling frequency increased withincreased flow). Base flows were sampled once per week during ice free periods.
The discharges from the Springdale and Bradford pumping stations were automaticallysampled for each day of pump operation to allow an estimation of the daily load from theHolland Marsh polder. The upstream area of the polder (Holland River at Hwy.#9) and thedownstream area (Holland River at Hwy. #11) were also intensively sampled to allow aloading estimate upstream and downstream of the polder.
The Black and Beaverton Rivers and Pefferlaw Brook were grab-sampled on an event basis.Intensive sampling (three times daily) was conducted during snow melt spring runoff. Dailysamples were collected for storm events, and baseflow was sampled once per week duringice free periods.
The Holland River at Cook Bay was sampled to allow the determination of the combinedloads from the east and west branches of the Holland River. Intensive sampling (three timesdaily) was conducted during spring runoff. Daily samples were collected during periods ofconstant outflow. During periods of unsteady flow, samples were collected weekly.
3.3.1 URBAN TEST CATCHMENT
Intensive sampling of the urban test catchment was required to ensure a valid modellingdata set. This was accomplished with a programmable, water level activated, automaticwater sampler. Samples were collected on a variable frequency which was dependent uponstorm event duration and intensity. A total of 102 storms were sampled between May 8,1983 and August 30, 1984. A summary and complete listing of the water quantity andquality collected for the urban test catchment is documented in LSEMS Technical Report A.2(3).
-32-

REFERENCES
(1) Frank D, D. Henry, J. Antoszek and F. Engler - 1986. "Lake Simcoe Tributary WaterQuantity and Quality Data Report", Lake Simcoe Environmental ManagementStrategy. Technical Report Series, Technical Report A.1.
(2) Rupke and Associates Limited - 1986. "Calibration Summary of The Holland MarshPolder Drainage Pumps", Lake Simcoe Environmental Management Strategy.Technical Report Series, Technical Report A.4.
(3) Frank D, D. Henry, B. Yip, and T. Chang - 1986. "Newmarket Urban Test CatchmentData Report", Lake Simcoe Environmental Management Strategy. Technical ReportSeries, Technical Report A.2.
-33-

4 POLLUTANT LOAD BASED ON MONITORING
4.1 TRIBUTARY AND POLDER LOADINGS: CALCULATIONS AND RESULTS
The estimation of tributary loadings requires a data base that contains simultaneousmeasurement of water quantity and quality. Water quantity or discharge has beencontinuously monitored with various flow gauging devices as previously described. To obtainmore precise loading estimates for this study, sampling was event oriented, ie. high flowperiods were sampled more frequently than low flow periods.
The estimation of tributary loadings requires the use of a ratio estimator. The Beale ratioestimator was used to calculate annual tributary loads in this study. This estimator has beentested and used by the International Joint Commission (IJC) since 1975 to calculate tributaryloadings (1).
The Beale Ratio Estimator was not used to calculate the pumping station loadings sinceconcentrations were not flow dependent and fluctuated seasonally. Consequently, dailyloadings were calculated by multiplying the daily pump volumes with the average dailyconcentration. For missing values of concentration, an estimated concentration was obtainedby interpolation of preceding and subsequent concentrations. The daily loadings have beentotalled to obtain the annual pollutant load.
Pollutant loads were estimated for the various monitoring locations described in Chapter 3.Table 4.1 lists the stations and the years for which annual pollutant loads have beenestimated.
Table 4.1 Water Quality Stations and Years of Record.
Station Number Sampling Location Years of Data03-0077- 311-02 Beaverton R. Near Beaverton 1982 - 1984
313 Black R. @ Sutton 1982 - 1984303 Bradford Pumping Station 1982 - 1984309 Holland R. @ Hwy. #9 1982 - 1984310 Holland R. @ Holland Landing 1982 - 1984316 Holland R. @ Cook Bay 1983 - 1984306 Kettleby Cr. @ Hwy. #9 1983 - 1984307 N. Schomberg R. 1983 - 1984312 Pefferlaw Br. Near Udora 1982 - 1984315 Holland R. d/s of Schomberg 1983 - 1984308 Springdale Pumping Station 1982 - 1984002 Holland R. @ Hwy. #11 1982 - 1984314 W. Pottageville Cr. 1983 - 1984
Pollutant loads were calculated for three water quality parameters for the above tributary
-34-
monitoring stations, namely total and filtered reactive (soluble) phosphorus and suspendedsolids. At the two above pumping stations only the total phosphorus and soluble phosphorusloads were calculated since it was not possible to reliably sample the suspended solids of thepump out water due to the turbulence caused by the pump impellers. Pollutant loads wereestimated on an annual basis (Tables 4.2 A, B, and C) Appendix A presents a summary ofmonthly loads.
4.1.1 SEWAGE TREATMENT PLANTS
Monthly sewage effluent discharge and quality data were obtained from all the continuousdischarge sewage treatment plants for a 7 year period. A mean annual total phosphorusconcentration was derived by averaging all effluent quality collected. This meanconcentration was then multiplied by the mean annual discharge to generate annual totalphosphorus loads for the individual plants.
For sewage treatment facilities that discharge seasonally, daily phosphorus concentrationof sewage effluent during discharge periods and total effluent discharge volumes wereobtained. Again, the mean annual total phosphorus concentration of sewage effluent wasdetermined as the arithmetic mean of all samples collected during discharge. This meanconcentration was then multiplied with the total volume of effluent discharged to provideannual total phosphorus loads for the individual facilities.
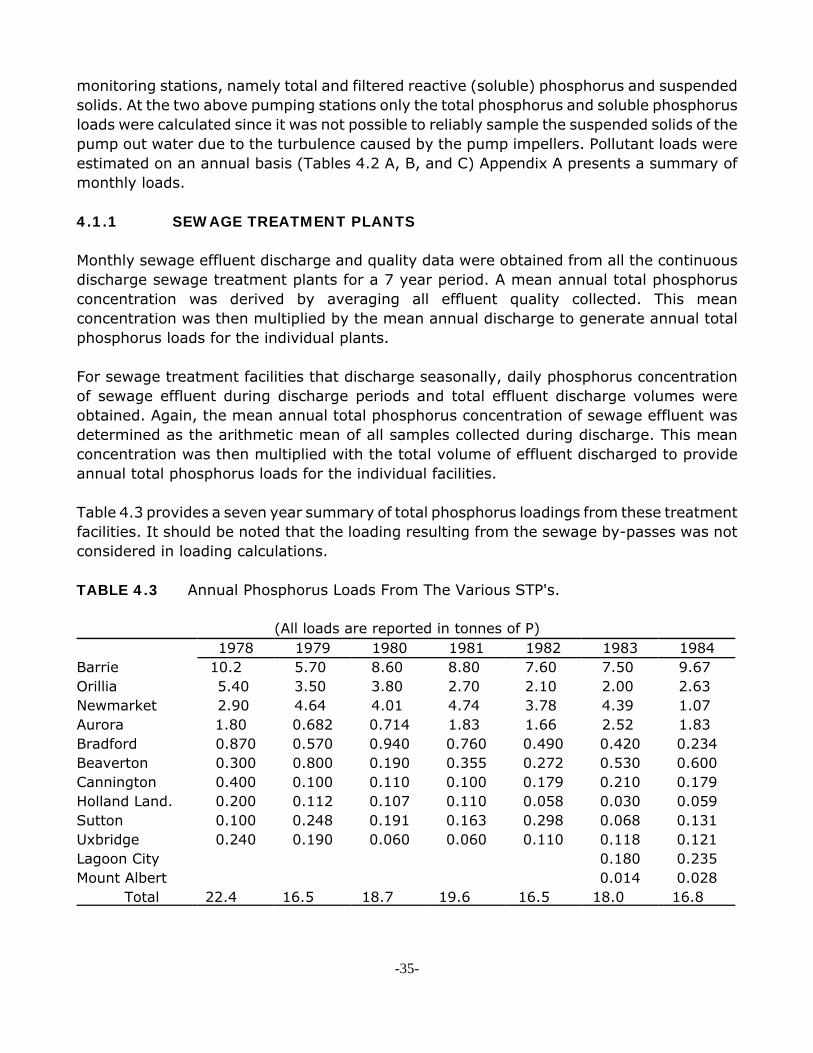
Table 4.3 provides a seven year summary of total phosphorus loadings from these treatmentfacilities. It should be noted that the loading resulting from the sewage by-passes was notconsidered in loading calculations.
TABLE 4.3 Annual Phosphorus Loads From The Various STP's.
(All loads are reported in tonnes of P)1978 1979 1980 1981 1982 1983 1984
Barrie 10.2 5.70 8.60 8.80 7.60 7.50 9.67 Orillia 5.40 3.50 3.80 2.70 2.10 2.00 2.63 Newmarket 2.90 4.64 4.01 4.74 3.78 4.39 1.07 Aurora 1.80 0.682 0.714 1.83 1.66 2.52 1.83 Bradford 0.870 0.570 0.940 0.760 0.490 0.420 0.234Beaverton 0.300 0.800 0.190 0.355 0.272 0.530 0.600Cannington 0.400 0.100 0.110 0.100 0.179 0.210 0.179Holland Land. 0.200 0.112 0.107 0.110 0.058 0.030 0.059Sutton 0.100 0.248 0.191 0.163 0.298 0.068 0.131Uxbridge 0.240 0.190 0.060 0.060 0.110 0.118 0.121Lagoon City 0.180 0.235Mount Albert 0.014 0.028
Total 22.4 16.5 18.7 19.6 16.5 18.0 16.8
-35-

4.2 LOAD DISCUSSION
4.2.1 TRIBUTARIES
The variation in tributary pollutant loads among the three years is a result of bothmeteorological and hydrological differences. In particular the greater loadings estimated for1982 are most likely due to the 10 - 20% higher amount of precipitation of that year (Figure4.1). The 1983 loadings decrease are a result of low spring runoff. Overall, precipitationamounts in 1983 and 1984 were closer to long term averages and therefore loadings for thetwo years are considered more representative than 1982.
The annual pollutant load for the four major tributaries, namely; the Beaverton (311),Pefferlaw (312)', Black (313) and Holland (316) also display variability. Per unit area andtotal loads for the three eastern tributaries are substantially lower than for the Holland. Ingeneral these differences can be attributed to the greater degree of urbanization andintensive agriculture within the Holland River watershed. Specific information as to themagnitude and significance of the various sources is discussed in subsequent sections.
The two distinct branches of the Holland River drainage system are the Holland River (Stn.002) and the Holland River East Branch (Stn. 310) (Figure 3.3). The Holland River drainsthe western portion of the system which is a predominantly agricultural area which includesthe Holland Marsh polder. The Holland River East Branch drains the eastern section whichincludes the towns of Newmarket, Aurora and some agricultural lands. Both branches aresignificant sources of suspended solids and phosphorus loads to Lake Simcoe compared tothe Beaverton, Black and Pefferlaw watersheds (Table 4.2 A, B and C).
In all three years it has been noted that the total phosphorous load at the Holland Riveroutlet at Cook Bay is lower than the sum of loads from the Holland River monitoring stationsat Highway #11 and Holland Landing. The difference in loads for 1982 - 1984 ranges from17 - 20 tonnes of total phosphorus. The main reason for this reduction is the hydraulicinefficiency of the lower Holland River as a water conveyance system. This results from itsshallow depth and broad width which produces low current velocities (less than 10 cm/s forthe majority of the year) and subsequently, reduces loads through the process ofsedimentation. Thus, for the majority of the year the lower Holland River and the north andsouth drainage canals can function as significant pollutant load deposition areas or sinks forparticulate phosphorus and sediment.
During the summer months and low flow or stagnant periods, the lower Holland Riversediments can also serve as a phosphorus source to the overlying water (2). Studiesconducted by Angelow and Robinson (1986) demonstrated that increased phosphorusconcentrations occurred in enclosed test corrals located in the lower Holland River during1983 (2). Evidence from these studies indicates that increased temperatures and low
-36-
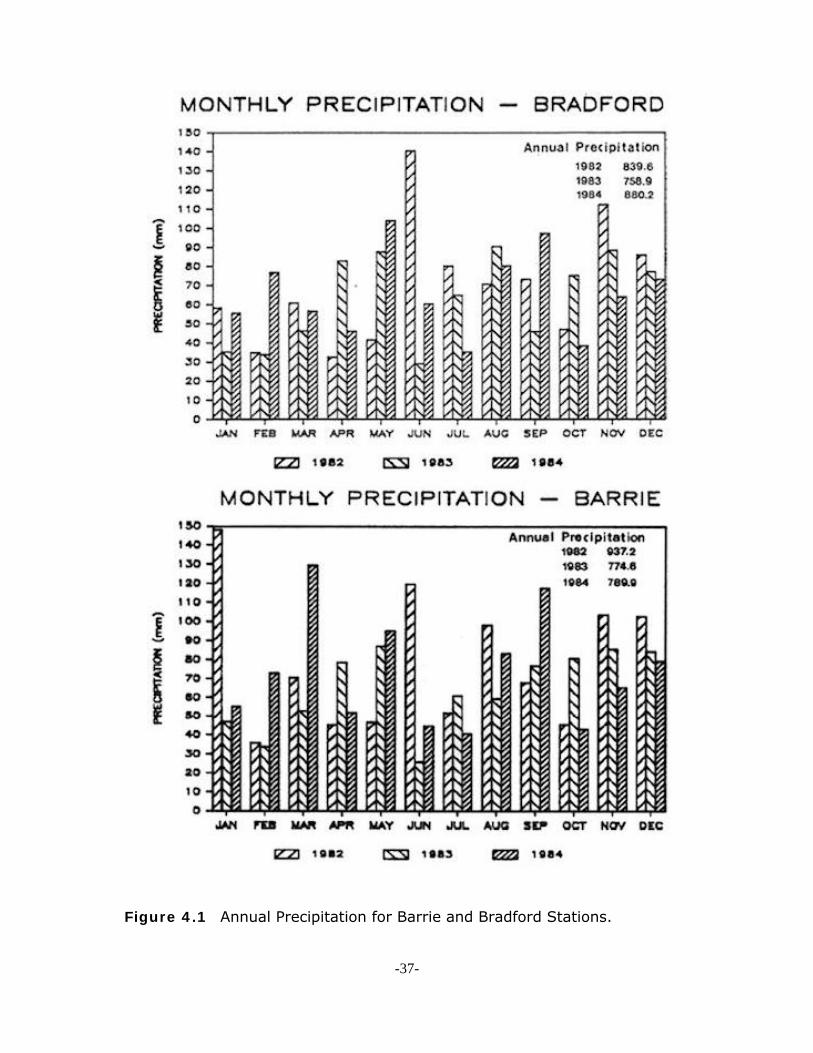
Figure 4.1 Annual Precipitation for Barrie and Bradford Stations.
-37-
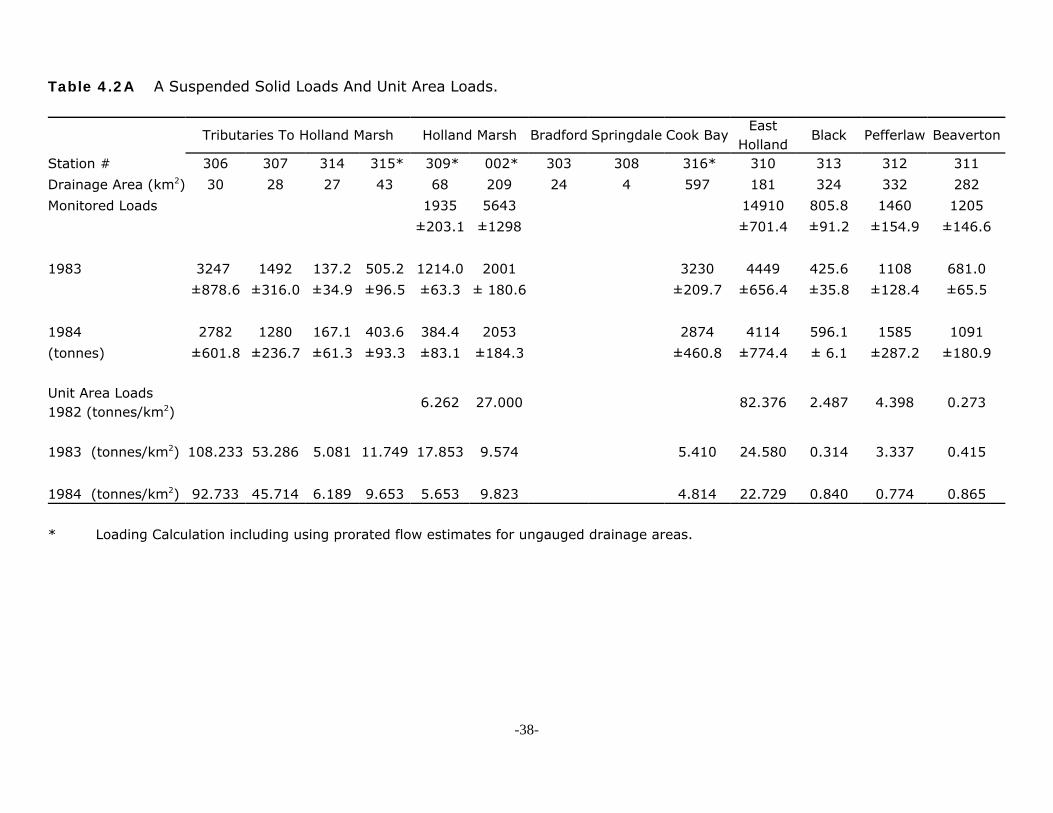
Table 4.2A A Suspended Solid Loads And Unit Area Loads.
Tributaries To Holland Marsh Holland Marsh Bradford Springdale Cook BayEast
HollandBlack Pefferlaw Beaverton
Station # 306 307 314 315* 309* 002* 303 308 316* 310 313 312 311Drainage Area (km2) 30 28 27 43 68 209 24 4 597 181 324 332 282Monitored Loads 1935 5643 14910 805.8 1460 1205
±203.1 ±1298 ±701.4 ±91.2 ±154.9 ±146.6
1983 3247 1492 137.2 505.2 1214.0 2001 3230 4449 425.6 1108 681.0±878.6 ±316.0 ±34.9 ±96.5 ±63.3 ± 180.6 ±209.7 ±656.4 ±35.8 ±128.4 ±65.5
1984 2782 1280 167.1 403.6 384.4 2053 2874 4114 596.1 1585 1091(tonnes) ±601.8 ±236.7 ±61.3 ±93.3 ±83.1 ±184.3 ±460.8 ±774.4 ± 6.1 ±287.2 ±180.9
Unit Area Loads1982 (tonnes/km2)
6.262 27.000 82.376 2.487 4.398 0.273
1983 (tonnes/km2) 108.233 53.286 5.081 11.749 17.853 9.574 5.410 24.580 0.314 3.337 0.415
1984 (tonnes/km2) 92.733 45.714 6.189 9.653 5.653 9.823 4.814 22.729 0.840 0.774 0.865
* Loading Calculation including using prorated flow estimates for ungauged drainage areas.
-38-

Table 4.2B Total Phosphorus Loads And Unit Area Loads.
Tributaries To Holland Marsh Holland Marsh Bradford Springdale Cook BayEast
HollandBlack Pefferlaw Beaverton
Station # 306 307 314 315* 309* 002* 303 308 316* 310 313 312 311
Drainage Area (km2) 30 28 27 43 68 209 24 4 597 181 324 332 282
Monitored Loads 5.2 25.7 8.2 2.4 29.2 6.4 7.9 6.0
1982 (tonnes) ± 0.5 ±3.1 ±1.1 ±0.4 ±0.8 ±0.4
1983 5.8 3.4 0.5 1.5 3.5 10.7 3.0 0.1 18.8 20.9 2.7 5.9 3.4
(tonnes) ±1.3 ±0.8 ±0.1 ±0.3 ±0.6 ±0.5 ±1.1 ±1.5 ±0.2 ±0.9 ±0.3
1984 4.1 1.8 0.5 1.5 1.5 16.9 4.2 1.6 17.3 17.3 3.3 6.4 4.7
(tonnes) ±0.8 ±0.2 ±0.1 ±0.2 ±0.4 ±1.4 ±1.2 ±1.3 ±0.3 ±0.8 ±0.5
Unit Area Loads
1982 (tonnes/km2) 0.076 0.121 0.341 0.611 0.161 0.020 0.024 0.021
1983 (tonnes/km2) 0.194 0.121 0.017 0.034 0.048 0.051 0.124 0.023 0.032 0.116 0.008 0.019 0.012
1984 (tonnes km2) 0.138 0.065 0.017 0.035 0.022 0.081 0.176 0.405 0.029 0.096 0.010 0.019 0.016
* Loading calculation included using prorated flow estimates for ungauged drainage areas.
-39-

Table 4.2C Filtered Reactive Phosphorus Loads And Unit Area Loads.
Tributaries To Holland Marsh Holland Marsh Bradford Springdale Cook BayEast
HollandBlack Pefferlaw Beaverton
Station M 306 307 314 315* 309* 002* 303 308 316* 310 313 312 311Discharge Area (km2) 30 28 27 43 68 209 24 4 597 181 324 332 282
Monitored Loads 1.0 13.1 6.1 1.8 9.0 .6 2.0 2.21982 (tonnes) ± 0.1 ±1.6 ±0.7 ±0.2 ±0.2 ±0.3
1983 0.2 0.3 0.1 0.4 0.3 4.4 1.6 0.04 7.3 8.7 0.8 1.3 0.9(tonnes) ±0.03 ±0.01 ±0.01 ±0.06 ±0.05 ±0.2 ±0.4 ±0.8 ±0.1 ±0.2 ±0.1
1984 0.3 0.3 0.1 0.5 0.6 11.0 3.5 1.4 5.9 7.0 1.3 2.6 1.6(tonnes) ±0.04 ±0.06 ±0.01 ±0.07 ±0.09 ±1.3 ±0.7 ±0.7 ±0.2 ±0.7 ±0.2
Unit Area Loads1982 (tonnes/km2) 0.015 0.063 0.253 0.453 0.050 0.008 0.006 0.008
1983 (tonnes/km2) 0.008 0.009 0.004 0.009 0.005 0.021 0.068 0.009 0.012 0.048 0.003 0.004 0.003
1984 (tonnes/km2) 0.011 0.012 0.004 0.012 0.009 0.053 0.146 0.339 0.010 0.039 0.004 0.008 0.006
* Loading calculation including using prorated flow estimates for ungauged drainage area
-40-

dissolved oxygen conditions probably lead to increased phosphorus concentrations. Thediversion of discharges from the Newmarket and Aurora STP's during 1984 will reducesummer flow and possibly enhance the conditions under which stagnation occurs in thelower Holland River.
For the Holland River East Branch, a substantial difference in loads were noted for 1983 and1984 compared to 1982.This difference can be explained by the following observations:
(a) 1982 was a year of above average precipitation and discharge.
(b) sewage was rerouted in May, 1984 from Newmarket and Aurora out of theHolland River watershed.
(c) Fairy Lake (located in Newmarket) was drawn down and dredged during 1982spring runoff. This left the lake's sediments exposed to severe erosion. Inaddition, Roger's Reservoir upstream of Holland Landing was also drawn down,(as common practice to prevent backwater blockage at the Newmarket STP)permitting complete flow through the reservoir and scouring to occur.
The above factors all would contribute to the large variation among the three years ofloading data.
4.2.2 VEGETABLE POLDERS
There are several vegetable polders within the Holland River watershed (Figure 2.12). Thelargest is the Holland Marsh polder which comprises nearly b of the total land area of allvegetable polders within the watershed. The water level within the Holland Marsh polder ismaintained by two pumping stations, located at Bradford and Springdale. Using the 1983and 1984 annual loads estimated for these two stations and comparing them to the uplandtributary monitoring stations (Kettleby Cr., W. Pottageville Cr., Holland R. downstream ofSchomberg and North Schomberg River) the following observations are of note:
The upland tributary total phosphorus loads range from 0.016 and 0.24 t/km2. Totalphosphorus unit area loads for the Holland Marsh Polder range from 0.023 and0.41 t/km2 are approximately 60% greater than the upland tributaries.
1983 and 1984 filtered reactive phosphorus (FRP) unit area loads for the HollandMarsh polder ranged from 0.009 and 0.453 t/km2 at the Springdale pumping stationand 0.068 to 0.253 t/km2 at the Bradford pumping station. These unit area loads aresignificantly higher than the FRP unit area loads observed for the upland tributarymonitoring stations, which range from 0.004 to 0.012 t/km2.
-41-

Filtered reactive phosphorus unit area loads ranged between 34% and 83% of thetotal phosphorus unit area loads for the marsh pumping stations. This is asignificantly higher soluble fraction than observed for the upland tributary monitoringstations, where the soluble fraction ranged between 3% and 34%.
Total phosphorus loads from sewage treatment plants in the watershed have remainedrelatively constant during the past seven years (Table 4.3). This trend indicates that plantshave improved their phosphorus removal techniques since most urban centres have hadexpanding populations.
4.2.3 SEWAGE TREATMENT PLANTS
During the seven year period, four of the twelve plants (Barrie, Orillia, Newmarket andAurora) accounted for approximately 80% of the total municipal STP phosphorus load. Workto eliminate or to reduce sewage effluent loads from these plants has been or soon will becompleted. As of May, 1984 sewage from Newmarket and Aurora is being transported to theDuffin Creek STP on Lake Ontario via the York - Durham sewerline. As of August, 1985phosphorus removal techniques have been upgraded at the Orillia STP. It is anticipated thatthe Barrie STP improvement and expansion will be completed during the summer of 1986.
REFERENCES
Whitt, D.M. - (revised) 1977. "Quality Control Handbook for Pilot Watershed Studies",International Joint Commission, PLUARG, Windsor.
Angelow, R. and Robinson, G. - 1986 "Summer Nutrient Conditions In The Lower HollandRiver Prior To Diversion of Municipal Inputs", Lake Simcoe EnvironmentalManagement Strategy, Technical Report Series, Technical Report B.3.
-42-

5 MODELLING AND EXTRAPOLATION TOOLS
The phosphorus loading of Lake Simcoe originates with a complex variety of land and wateruses which are broadly classified as "point" or "non-point" (diffuse) sources. Of point source,STP's are of primary importance and its relatively simple to estimate their phosphorusoutput. Diffuse sources, such as atmospheric inputs or phosphorus input from eroded soil,are not measurable directly; calculation of inputs from such sources requires that theunderlying processes be reproduced in a model form.
Modelling for water management is not a new approach and it has been extensively utilizedas a valuable aid in understanding and solving water quality problems. Models have beenused successfully:
1 when time and finances prevent extensive data collection,
2 to test different management strategies, and
3 to make predictions of how a watershed will respond over a wide range ofconditions.
Caution must be exercised in the use of models. The modeller must be aware of how themodel works, its inherent assumptions and the limitations of its use. There must besufficient input data available to minimize the need for assumed or estimated input. Themodel should be calibrated and verified using separate sets of data. Finally, the results ofthe modelling should be tested against reason.
The model is used in conjunction with data on land use or other factors known toindependently influence these processes. Several models have been used in this study.
1) Statistical extrapolation,
2) Storage Treatment Overflow Runoff Model (STORM),
3) Lands Directorate Screening Procedure,
4) Universal Soil Loss Equation,
5) G.A.M.E.S.
6) PLUARG livestock model.
The objectives of the modelling program were to:
1) Identify and quantify urban and rural diffuse sources of phosphorus.
2) Project future loadings from urban areas and municipal STP's.
-43-

(3) Evaluate the potential for the achievement of loading reductions, including anassessment of selected "Best Management Practices" for agriculture.
ATMOSPHERIC LOAD
The atmospheric loading of a nutrient material to a land or water surface can result from twoprocesses. The material is either removed from the atmosphere by precipitation (wetdeposition) or by gravity (dry deposition). Studies have indicated that approximately 70%of the total nutrient load from the atmosphere occurs through wet deposition (1).
Data collection locations for atmospheric nutrient loads are scattered widely across theProvince of Ontario. Two of these stations are located in or nearby the Lake Simcoe drainagebasin at Coldwater and Uxbridge (2). In the study area, prevailing winds are from the westtherefore, only the Coldwater station located directly upwind of Lake Simcoe, was used toestimate the atmospheric loading.
Wet deposition of phosphorus for the Coldwater station for the period of September, 1980to December, 1981 was 11.8 mg/m2/yr. Assuming 70% of the total annual atmospheric loadis attributed to wet deposition, the annual deposition is determined to be 16.9 mg/m2/yr.Given the lake area of 725 sq. km., the phosphorus input to the lake is 12.3 tonnes/year.
To substantiate the annual deposition rate, a report by PLUARG (1) was reviewed. For theperiod of 1973-1974, the annual deposition rate was recorded in the Lake Simcoe basin tobe 18.25 mg/m2/yr or 13.2 tonnes/year. Thus the annual deposition rates from bothinformational sources indicate a range of 12.3 to 13.2 tonnes/year. For this report it wasassumed that the mean annual phosphorus input to the lake was 12.8 tonnes/year.
To determine the annual phosphorus load from precipitation plus dry deposition for 1982,1983 and 1984 the mean annual load estimated by the two above publications wasnormalized to a normal precipitation year. Thus, the annual loads for 1982, 1983 and 1984were estimated to be 13.3, 12.4 and 12.8 tonnes/year.
SEWAGE TREATMENT FACILITIES LOADS
Past and present sewage treatment facility loads were based on monitored loads at theindividual facilities Technical Report A. In estimating future phosphorus loads for the years2001 and 2031, the following assumptions were made:
Barrie in 2001 would expand to serve a population of 61,500 and in 2031 support apopulation base of 111,000 199,000. Phosphorus effluent requirements for bothdesign years would be regulated to 0.3 mg/L.
-44-
Orillia in 2001 would serve a future population of 24,800 and in 2031 support apopulation base of 45,300 - 81,100. Phosphorus effluent requirements for both designyears would be regulated to 0.3 mg/L. In addition, infiltration into the sewerlineswould be remedied.
Newmarket and Aurora in 2001 would continue to discharge into the York-Durhamtrunk sewer line.
Bradford in 2001 would expand to service a population of 12,000 and in 2031 supporta population base of 21,700 38,900. Phosphorus effluent requirement for both designyears would be regulated to 0.3 mg/L.
Uxbridge in 2001 would expand to service a population of 3,300 and in 2031 supporta population base of 6,000 10,700. Phosphorus effluent requirement for both designyears would be regulated to 0.3 mg/L.
All other sewage treatment facilities would contribute an annual phosphorus load of2.5 tonnes in 2001 and 4.5 tonnes in 2031.
Water consumption would be 520 litre/person/day in both design years.
Barrie, Newmarket, Aurora and Bradford future population projections for the year2001 were based on discussions held with regional and municipal planners (3,4,5).For Uxbridge and Orillia an estimated annual growth rate of 0.2% was assumed. Thisassumption was based on past economic growth and population performance withintheir respective municipalities.
For the year 2031, the Lake Simcoe-Couchiching Report Committee (6) recommendeda future population growth rate of 1.5%/yr. However, based on the historical growthrate displayed in the drainage basin and the anticipated development from theMetropolitan Toronto area, this range has been considered too low. Therefore, futurepopulation growth rates were assumed to be between 2% and 4%/yr. Table 5.1shows the anticipated future growth for the 6 major urban areas.
A phosphorus load summary of sewage treatment facilities for both design years is shownin Table 5.1.
-45-
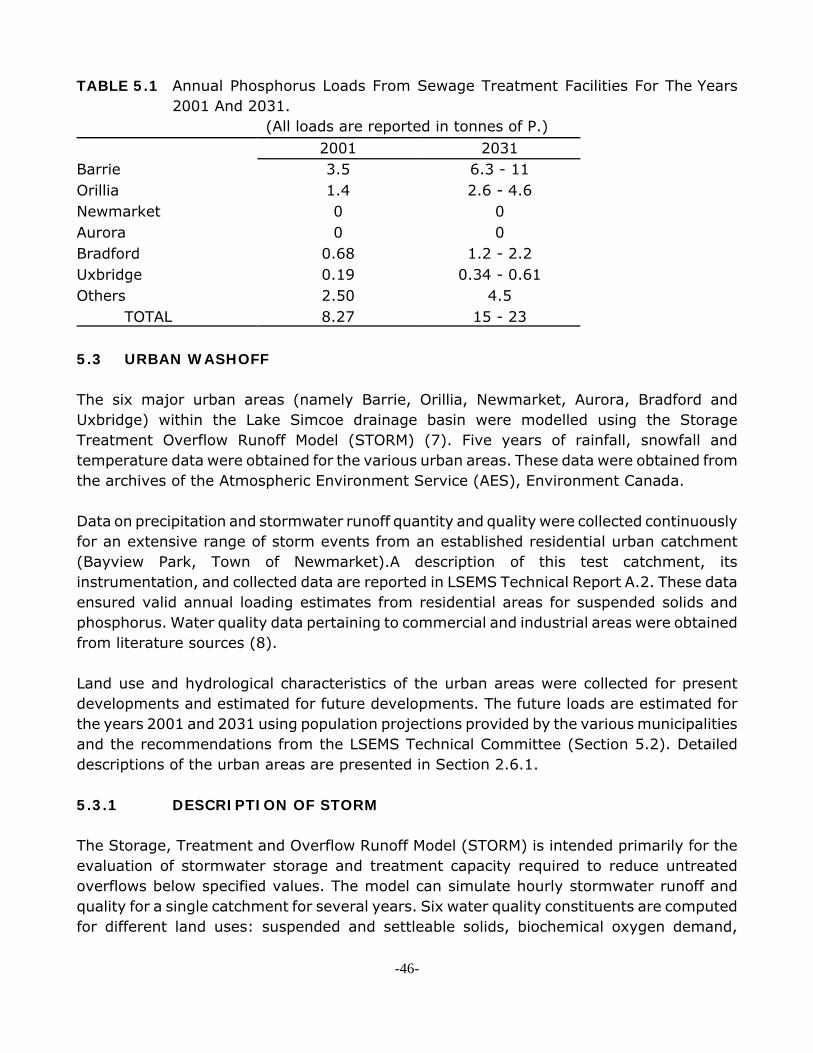
TABLE 5.1 Annual Phosphorus Loads From Sewage Treatment Facilities For The Years2001 And 2031.
(All loads are reported in tonnes of P.)2001 2031
Barrie 3.5 6.3 - 11Orillia 1.4 2.6 - 4.6Newmarket 0 0Aurora 0 0Bradford 0.68 1.2 - 2.2Uxbridge 0.19 0.34 - 0.61Others 2.50 4.5
TOTAL 8.27 15 - 23
5.3 URBAN WASHOFF
The six major urban areas (namely Barrie, Orillia, Newmarket, Aurora, Bradford andUxbridge) within the Lake Simcoe drainage basin were modelled using the StorageTreatment Overflow Runoff Model (STORM) (7). Five years of rainfall, snowfall andtemperature data were obtained for the various urban areas. These data were obtained fromthe archives of the Atmospheric Environment Service (AES), Environment Canada.
Data on precipitation and stormwater runoff quantity and quality were collected continuouslyfor an extensive range of storm events from an established residential urban catchment(Bayview Park, Town of Newmarket).A description of this test catchment, itsinstrumentation, and collected data are reported in LSEMS Technical Report A.2. These dataensured valid annual loading estimates from residential areas for suspended solids andphosphorus. Water quality data pertaining to commercial and industrial areas were obtainedfrom literature sources (8).
Land use and hydrological characteristics of the urban areas were collected for presentdevelopments and estimated for future developments. The future loads are estimated forthe years 2001 and 2031 using population projections provided by the various municipalitiesand the recommendations from the LSEMS Technical Committee (Section 5.2). Detaileddescriptions of the urban areas are presented in Section 2.6.1.
5.3.1 DESCRIPTION OF STORM
The Storage, Treatment and Overflow Runoff Model (STORM) is intended primarily for theevaluation of stormwater storage and treatment capacity required to reduce untreatedoverflows below specified values. The model can simulate hourly stormwater runoff andquality for a single catchment for several years. Six water quality constituents are computedfor different land uses: suspended and settleable solids, biochemical oxygen demand,
-46-

nitrogen, phosphorus and coliform bacteria. Depending on the user's requirements, themodel may be used to study stormwater (quantities and qualities) individually or incombination with dry weather flow of the catchment.
STORM does not provide for any routing mechanism for sewer or channel networks.Computations of treatment, storage and overflow proceed on an hourly basis using acatchment wide volume and mass balance. If the hourly flow exceeds the treatmentcapacity, the excess flow becomes the untreated overflow. If the flow is less than thetreatment capacity and water is in storage, then the excess treatment capacity is utilizedto diminish the storage volume.
5.3.2 DATA COLLECTION FOR STORM MODEL FORMULATION
Computation of annual loadings of suspended solids and phosphorus using STORM,information required included precipitation and temperature time series for the period beingstudied, land use characteristics and pollutant accumulation and washoff coefficients.
Precipitation and temperature records were obtained from the Atmospheric EnvironmentService for all stations within or near the Lake Simcoe drainage basin. Only two stations(Barrie and Orillia) provided a suitable data base for STORM.
A small program package was developed to convert the AES formatted data to a STORMdata file. For the hourly precipitation record, missing data was interpolated from the dailyrecord. During the winter period, hourly precipitation results were also generated from thedaily record. Very little missing data was noted in the temperature data set and correctionswere made manually.
The percentage of land use within the catchment was determined from land use maps madeavailable from the various planning departments. The percent imperviousness for each landuse was determined from aerial photographs and planning authority documentation. Fieldinvestigations on all urban areas were conducted to validate the estimated distributionpercentages of land use and imperviousness.
5.3.3 TEST CATCHMENT
The Bayview Park test catchment is located in the Town of Newmarket. The test catchmenthas an area of 33 hectares with a land use distribution consisting primarily of residentialdwellings (90%) and institutional lands (10 %). The location of the test catchment ispresented in Figure 5.1. Runoff from construction sites is not a consideration as the area isfully developed. These characteristics contributed to the selection of Bayview Park as anappropriate catchment for simulating stormwater runoff processes from urban residentialareas.
-47-
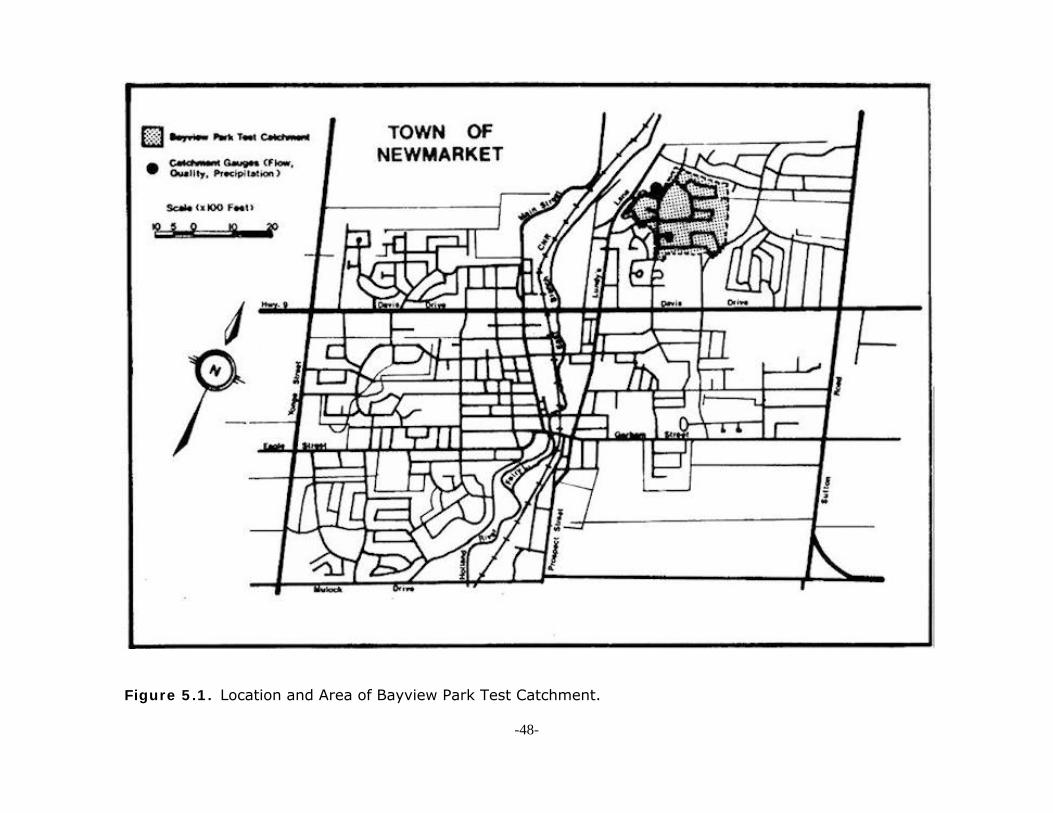
Figure 5.1. Location and Area of Bayview Park Test Catchment.
-48-
5.3.4 STORM MODEL CALIBRATION AND VERIFICATION
With the exception of land use and imperviousness, all model parameters were initially setat default values and subsequently corrected during the process of calibration. Twenty-onestorm events were used from the test catchment (Bayview Park) to enable calibration andverification of STORM for total event runoff and water quality (suspended solids and totalphosphorus). Storm event data was gathered from the period May 19, 1983 - July 6, 1984.Volume of runoff ranged from 0.1 to 7.5 mm which was considered sufficiently broad toprovide a valid assessment of stormwater quantity and quality runoff responses of the urbancatchment.
The storm event data collected during 1983 were used to calibrate STORM. Runoff volumessimulated by STORM compared well with those observed (correlation coefficient of 0.87).It was noted that some large deviations occurred with the minor storm events. Thesedeviations can be associated with a larger error attributed to measurements of events ofsmaller magnitudes.
Storm events collected during 1984 were used to verify the calibrated STORM model. Runoffvolumes generated by the calibrated STORM model correlated well with the observed.Combining all 21 storm events into a complete data set, a correlation coefficient of 0.91 wasobtained. Table 5.3 and Figure 5.2 summarize the observed and simulated data.
For total phosphorus and suspended solids, simulated results compared well with theobserved. It was noted that some large deviations occurred again with the minor stormevents. These deviations can again be attributed to a larger error of measurement for eventsof smaller magnitudes. They could also be associated with a lower washoff contributionduring smaller storm events. See Table 5.2 and Figures 5.3 and 5.4 for a completepresentation of the observed and simulated data for suspended solids and total phosphorus.
5.3.5 LOADS GENERATED BY STORM
As described in section 5.3, data was collected for the six urban areas in the watershed.Using this data in conjunction with the verified STORM model loads were generated for yearsof interest. Table 5.3 presents a summary of the simulation results for the six urban areasfor the period 1978 - 1982.
-49-
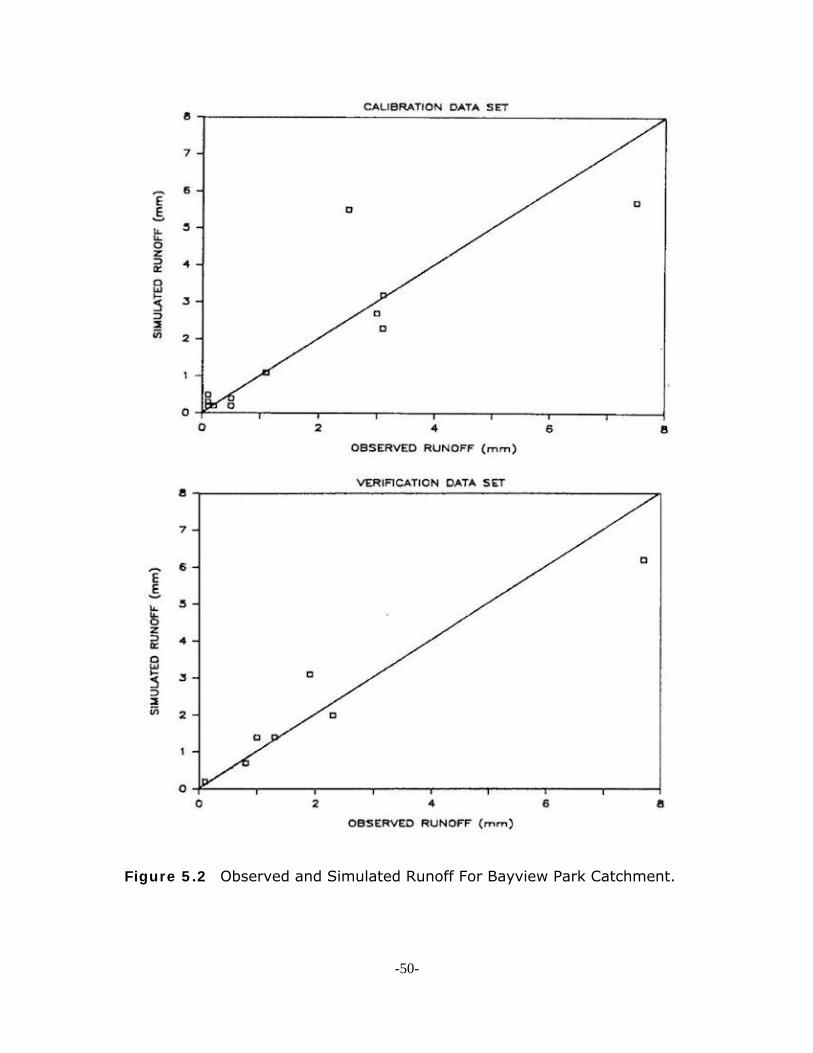
Figure 5.2 Observed and Simulated Runoff For Bayview Park Catchment.
-50-

TABLE 5.3 Observed And Simulated Water Quantity And Quality Data Bayview Park Test Catchment.
DATERunoff Volume
(mm) Observed
Runoff Volume(mm)
Simulated
Suspended Solids(Kg)
Observed
Suspended Solids(Kg)
Simulated
Total P (Kg)
Observed
Total P (Kg)
Simulated190583 2.5 5.5 136.96 82.96 0.51 0.41220583 0.2 0.2 6.64 2.18 0.02 0.01250583 0.1 0.2 4.99 1.51 0.02 0.01290583 0.4 1.1 15.42 15.68 0.08 0.08260683 0.1 0.5 23.70 9.22 0.05 0.05210783 0.5 0.2 6.43 3.50 0.02 0.02280783 1.1 1.1 23.06 34.32 0.20 0.17010883 3.1 2.3 63.08 69.18 0.24 0.35080883 0.5 0.4 8.12 9.26 0.04 0.05060983 0.1 0.3 9.95 6.68 0.03 0.03180983 3.0 2.7 74.50 65.07 0.26 0.33210983 7.5 5.7 111.94 145.66 0.59 0.73131083 3.1 3.2 175.82 145.18 0.59 0.62
040584 1.9 3.1 25.21 40.76 0.19 0.15230584 7.7 6.2 140.71 164.80 0.57 0.82260584 1.3 1.4 132.96 35.16 0.19 0.18280584 0.8 0.7 25.84 10.83 0.06 0.05170684 1.0 1.4 49.39 32.72 0.11 0.16180684 2.3 2.0 80.95 64.34 0.18 0.32230684 0.1 0.2 3.80 3.21 0.15 0.02060784 3.5 3.2 691.76 126.57 0.70 0.63
-51-

Figure 5.3 Observed and Simulated Suspended Solids For Bayview Park Catchment.
-52-

Figure 5.4 Observed and Simulated Total Phosphorus For Bayview Park Catchment.
-53-
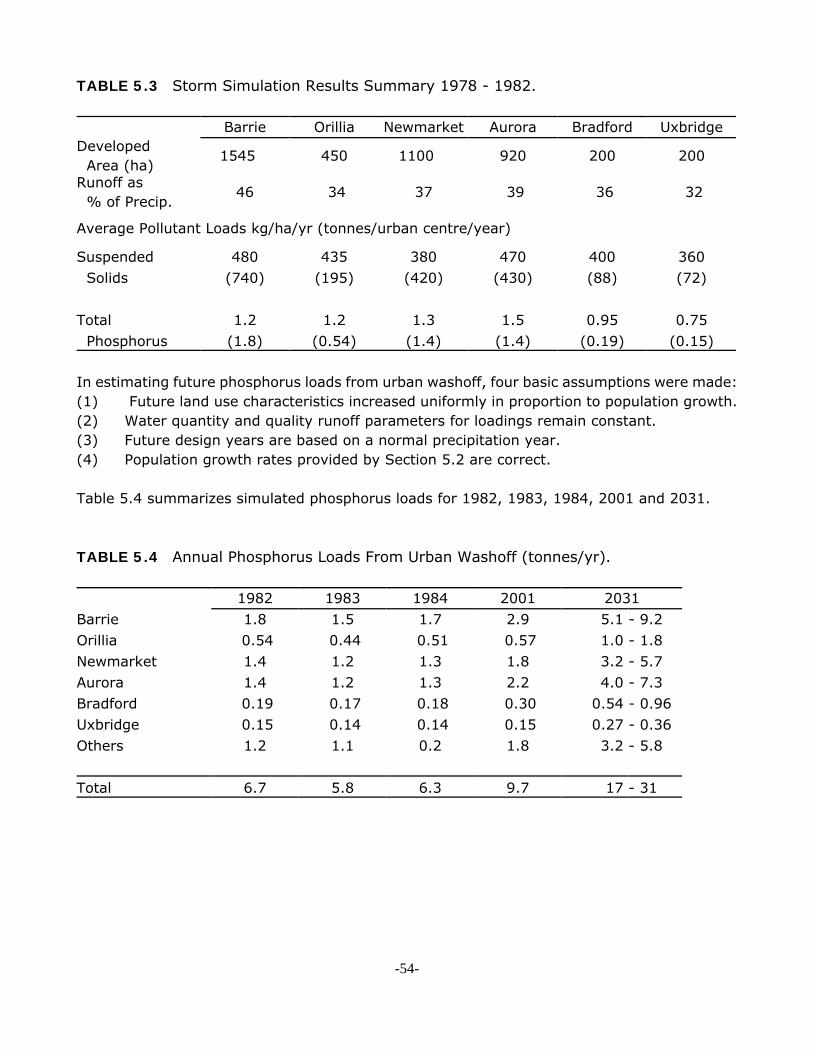
TABLE 5.3 Storm Simulation Results Summary 1978 - 1982.
Barrie Orillia Newmarket Aurora Bradford UxbridgeDeveloped Area (ha)
1545 450 1100 920 200 200
Runoff as % of Precip.
46 34 37 39 36 32
Average Pollutant Loads kg/ha/yr (tonnes/urban centre/year)
Suspended 480 435 380 470 400 360 Solids (740) (195) (420) (430) (88) (72)
Total 1.2 1.2 1.3 1.5 0.95 0.75 Phosphorus (1.8) (0.54) (1.4) (1.4) (0.19) (0.15)
In estimating future phosphorus loads from urban washoff, four basic assumptions were made:(1) Future land use characteristics increased uniformly in proportion to population growth.(2) Water quantity and quality runoff parameters for loadings remain constant.(3) Future design years are based on a normal precipitation year.(4) Population growth rates provided by Section 5.2 are correct.
Table 5.4 summarizes simulated phosphorus loads for 1982, 1983, 1984, 2001 and 2031.
TABLE 5.4 Annual Phosphorus Loads From Urban Washoff (tonnes/yr).
1982 1983 1984 2001 2031Barrie 1.8 1.5 1.7 2.9 5.1 - 9.2Orillia 0.54 0.44 0.51 0.57 1.0 - 1.8Newmarket 1.4 1.2 1.3 1.8 3.2 - 5.7Aurora 1.4 1.2 1.3 2.2 4.0 - 7.3Bradford 0.19 0.17 0.18 0.30 0.54 - 0.96Uxbridge 0.15 0.14 0.14 0.15 0.27 - 0.36Others 1.2 1.1 0.2 1.8 3.2 - 5.8
Total 6.7 5.8 6.3 9.7 17 - 31
-54-
COTTAGE TILE LEAKAGE
No new work was undertaken for this report with regard to cottage tile seepage. The totalannual phosphorus load generated by shoreline cottages was estimated by an earlier LakeSimcoe report to be 8.3 tonnes (6). A subsequent Lake Simcoe report which consideredattenuation of phosphorus through the soil layer lowered the annual estimate to 3.0 tonnes.
In order to determine the annual phosphorus load from cottage tile seepage for 1982, 1983and 1984 the mean annual load provided by the above publication had to be normalized.Normalized annual loads for 1982, 1983 and 1984 were determined to be 3.6, 2.6 and 2.8tonnes.
PHOSPHORUS LOADS FROM SOIL EROSION TO TRIBUTARY WATERS
This section describes the approaches used to estimating the amount of phosphorusdelivered from field to the nearest receiving water by the erosion process. The estimationof phosphorus load to a receiving water involves:
1) determining the amount of soil erosion occurring infield,2) quantifying the delivery of the eroded material to a receiving water and3) determining the phosphorus component of the delivered material.
Not until recently (July, 1985) has a model been developed to estimate the amount ofsediment delivered to a receiving water. The GAMES (The Guelph model for evaluatingeffects of Agricultural Management systems on Erosion and Sedimentation) (10) modelpresently completes the operation of the first two steps. By using a phosphorus componentthe third step of the estimation can be achieved.
5.5.1 LANDS DIRECTORATE - PRIORITY MANAGEMENT AREAS
The methodology was developed by the Lands Directorate (11) to categorize areas ofpotential diffuse agricultural soil erosion and sediment loading to streams. This modelutilizes the Universal Soil Loss Equation (USLE see section 5.8) and research by Dickinson(12) on factors controlling sediment delivery. The method produces a series of mapsdepicting potential soil loss, field to stream delivery ratio, and Priority Management Areas(PMA's). Its intent is to identify priority management areas for targeting remedial efforts andfunds.
The determination of potential soil loss requires that some factors of the USLE be transferredgraphically onto National Topographical Survey (NTS) maps. The resulting maps are thenoverlaid and the individual polygons which emerge are assigned ratings from a USLECategory Table. The result is a Potential Average Annual Soil Loss from Rural Areas map
-55-

showing areas of very high, high, medium, and low potential soil loss.
The procedure involved in calculating field to stream delivery ratio is characterized byprogressive mapping of factors affecting sediment delivery on land. These factors includedistance to a stream, slope, landscape roughness or vegetation cover, hydrologic activity ofan area, and hydraulic characteristics of sediment to be transported. Upon completion, arough map which could contain up to nineteen different categories is sub-divided into high,moderate, and low field to sediment delivery ratio rankings.
The final step in the methodology is the production of the Priority Management Areas map.This is accomplished by overlaying the Potential Average Annual Soil Loss from Rural Areasmap and the Field to Stream Delivery Ratio map. The resulting combinations are thenranked and areas most likely to contribute sediment loads to receiving waters are mappedas high, moderate, and low, correspondingly. Due to its scale, it is not intended to exactlylocate specific field level sites of problem soil loss or sediment pollution. This model cannotquantify sediment delivery ratios or sediment volumes reaching a stream. Figure 5.5 showsa generalized version of the priority management areas for the drainage basin.
5.5.2 G.A.M.E.S. (10)
The Lands Directorate approach is a valuable tool for classifying areas into major categorieson the basis of relative amounts of sediment potentially delivered to stream channels. Thesize of watersheds which can be modelled by GAMES is limited to those under 5-10 km2. TheGAMES model is a more detailed analysis based on mathematical relationships which canbe used to quantify the amount of soil loss by sheet erosion and the delivery of suspendedsolids in overland flow from field to stream. The model divides the rural watershed into finite(field size), irregular cells with approximately homogeneous landuse, soil type and slopeclass characteristics. Seasonal and annual sediment loads can be predicted using suitablevariables.
The Universal Soil Loss Equation (USLE) is incorporated in the GAMES model to determinethe potential gross erosion from each watershed cell. This model is described in section 5.8.The sediment delivery component relates potential gross sediment erosion to the amountof sediment delivered to a receiving water.
This component varies inversely with the travel time. The equation that has been used inthe GAMES model is as follows:
-56-

Figure 5.5 Generalized Version of the Priority Management Areas.
-57-

DR = A•[(1/n)• S 0.5 • Hc/L] B
where:n = surface roughness coefficient as indexed by Manning's nS = cell slopeHc = hydrologic coefficient, an index of the probability and depth of overland flowL = length of cell overland flow pathA, B = calibration coefficients
The model requires the calibration of two parameters. The elements are subjectively dividedinto 3 hydrological classes depending on the distance from the stream and drainagecharacteristics of the element.
The product of the gross potential soil loss and the sediment delivery components providethe amount of suspended solids transported to the receiving water.
5.5.3 APPLICATION OF THE GAMES MODEL
Application of the GAMES model to the entire Lake Simcoe Basin was not feasible since theextensive data requirements exceeded the time and resources available for their acquisition.Instead small representative watersheds (100-150 ha) were selected and modelled in detailto obtain unit area loads which could be extrapolated to larger areas.
Three unmonitored watersheds in the Uxbridge township were located each of whichconsisted entirely of either high, moderate, or low ranking drainage area under the LandsDirectorate Methodology. In each of these, data required for the GAMES model applicationwas acquired and used to delineate the 1-5 ha cells of relatively uniform characteristics.Subsequent model calculations produced unit area loads of sediment considered applicableto all high, moderate or low PMA classes in the Lake Simcoe basin.
To estimate the amount of phosphorus delivered to the receiving waters two assumptionswere made. First, phosphorus concentration of the eroded sediment was 733 parts permillion. The figure is based on the mean value of soil samples analysed from the area (10).Second, the phosphorus content of the delivered sediment would be 1.3 times that of erodedsediment due to an enrichment process which occurs during transportation.
As water and sediment particles flow over the soil surfaces, a sorting process occurs duringwhich finer clay particles with higher phosphorus content remain in suspension while largerparticles with lower phosphorus content settle. This "enrichment" process results in a ratio,greater than 1, which expresses phosphorus in delivered sediment to phosphorus in erodedsediment. The value of this ratio for a particular area is dependant upon soil physicalcharacteristics, cover, slope length, history of phosphorus application and other factors.
-58-

Using these assumptions and the sediment delivered unit area loads, phosphorus deliveredunit area loads were calculated. Table 5.5 shows both sediment and phosphorus unit arealoads for the high, medium and low priority management areas.
TABLE 5.5 Delivered Sediment And Phosphorus Unit Area Loads (Normal Year).
Sediment (kg/ha) Phosphorus (kg/ha)High 1000 - 2000 1.0 - 2.0Medium 500 - 1000 0.5 - 1.0Low 100 - 500 0.1 - 0.5
5.5.4 COMPARISON WITH MONITORING DATA
The above results are based on numerous lumped and estimated model parameters in whatis essentially an uncalibrated model. To ensure that the unit area loads modelled are realisticestimates, a comparison of monitoring and modelled data from two small (28 - 32 km2)watersheds was completed. Loads were modelled by distributing the above unit area loadsover the known breakdown of high, moderate, and low priority management areas in thetwo watersheds. Table 5.6 compares the monitored loads to watershed priority managementarea derived (simulated) loads. For Kettleby Creek the monitored load range generallyexceeds the simulated load range. For North Schomberg, the simulated load range compareswell with monitored load range.
The comparison demonstrates that for one of the two monitored watersheds there isreliability in the simulated total phosphorus ranges. For Kettleby Creek the simulated loadsare conservative and underestimate the actual delivered load. This conservative estimatemay be due to restricting the upper limit of the high priority management area to 2.0 kg/haas a result of using the phosphorus enrichment value of 1.3.
TABLE 5.6 Comparison Of Monitored To Games Modelled Annual Total Phosphorus Loads.
Monitored Load(tonnes/year)
Simulated Load(tonnes/year)
Kettleby Creek (1983) 4.5 - 7.2 0.9 - 2.3(1984) 3.2 - 5.0 0.9 - 2.3
North Schomberg (1983) 2.5 - 4.2 1.5 - 3.3(1984) 1.6 - 2.1 1.5 - 3.5
-59-
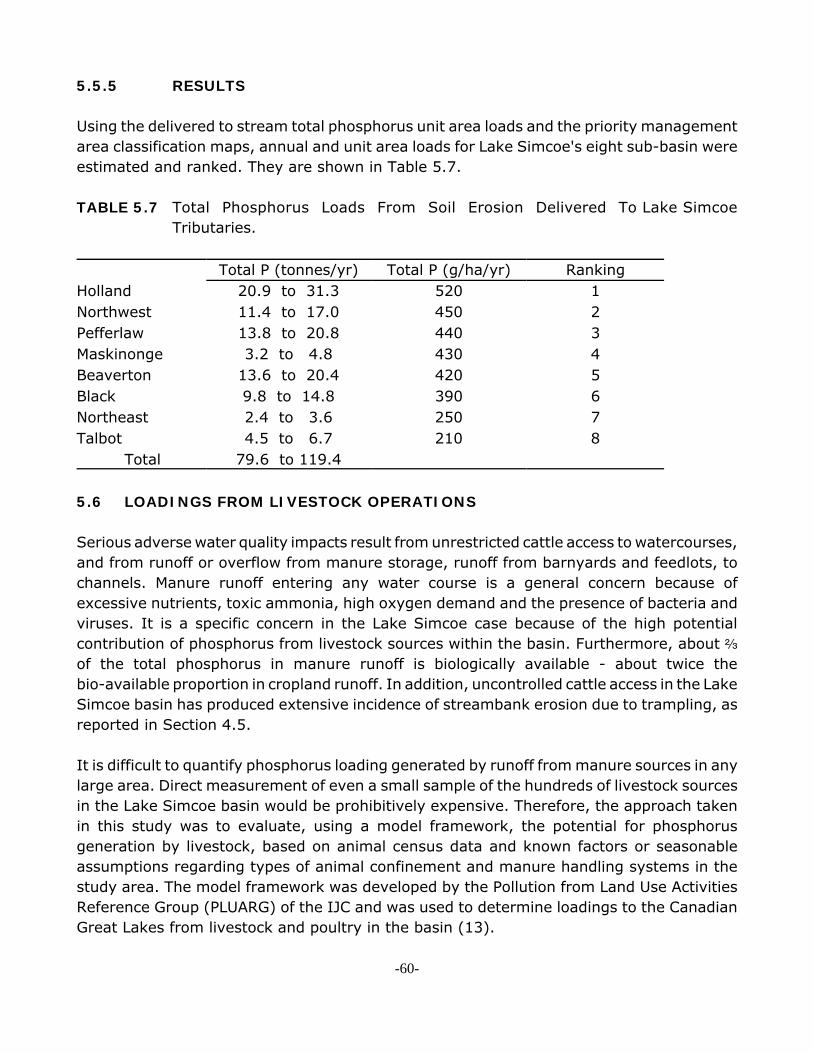
5.5.5 RESULTS
Using the delivered to stream total phosphorus unit area loads and the priority managementarea classification maps, annual and unit area loads for Lake Simcoe's eight sub-basin wereestimated and ranked. They are shown in Table 5.7.
TABLE 5.7 Total Phosphorus Loads From Soil Erosion Delivered To Lake SimcoeTributaries.
Total P (tonnes/yr) Total P (g/ha/yr) RankingHolland 20.9 to 31.3 520 1Northwest 11.4 to 17.0 450 2Pefferlaw 13.8 to 20.8 440 3Maskinonge 3.2 to 4.8 430 4Beaverton 13.6 to 20.4 420 5Black 9.8 to 14.8 390 6Northeast 2.4 to 3.6 250 7Talbot 4.5 to 6.7 210 8
Total 79.6 to 119.4
5.6 LOADINGS FROM LIVESTOCK OPERATIONS
Serious adverse water quality impacts result from unrestricted cattle access to watercourses,and from runoff or overflow from manure storage, runoff from barnyards and feedlots, tochannels. Manure runoff entering any water course is a general concern because ofexcessive nutrients, toxic ammonia, high oxygen demand and the presence of bacteria andviruses. It is a specific concern in the Lake Simcoe case because of the high potentialcontribution of phosphorus from livestock sources within the basin. Furthermore, about b of the total phosphorus in manure runoff is biologically available - about twice thebio-available proportion in cropland runoff. In addition, uncontrolled cattle access in the LakeSimcoe basin has produced extensive incidence of streambank erosion due to trampling, asreported in Section 4.5.
It is difficult to quantify phosphorus loading generated by runoff from manure sources in anylarge area. Direct measurement of even a small sample of the hundreds of livestock sourcesin the Lake Simcoe basin would be prohibitively expensive. Therefore, the approach takenin this study was to evaluate, using a model framework, the potential for phosphorusgeneration by livestock, based on animal census data and known factors or seasonableassumptions regarding types of animal confinement and manure handling systems in thestudy area. The model framework was developed by the Pollution from Land Use ActivitiesReference Group (PLUARG) of the IJC and was used to determine loadings to the CanadianGreat Lakes from livestock and poultry in the basin (13).
-60-

Table 5.8 lists the numbers and types of livestock and poultry found in the Lake Simcoebasin, based on provincial census data of 1981 (14). Further breakdown of these populationsby sub-basin was carried out and by applying specific phosphorus excretion rates, a totalannual manure phosphorus production was estimated for each area. The results of thesecalculations are given in Table 5.12.
TABLE 5.8 Number And Type Of Livestock/poultry In The Lake Simcoe Basin.
TYPE NUMBERSheep 11650Horses 4835Pullets 775558Hens 144710Sows 6499Hogs 55126Dairy Cows 14794Beef Cows 15149Steers/Beef Feeders 26650
The proportion of the annual manure phosphorus production which ultimately enters astream through the runoff process is dependent upon management factors (Tables 5.9 -5.10) and proximity of exposed manure to runoff channels. The pathways to streams ofmanure phosphorus, as controlled by these two main factors are depicted in Figure 5.6. Thethree manure source categories considered are (1) runoff from open feedlots and barnyards,(2) runoff from manure in open solid or semi-solid manure storage, and (3) runoff frommanure spread in winter on frozen soil.
TABLE 5.9. Confinement Of Inventory Livestock.(% of each Livestock Category)
DairyBeef Feedlot(Mixed Ages) Cattle
Swine Poultry Other
COVERED ONLYLarge Operations 0.2 4.9 4.0 82.4 60.0 0Small-Medium Operations 1.3 5.3 0.1 4.7 28.7 4.8
OUTSIDE LOTSLarge Operations 41.2 39.6 93.5 11.4 7.5 50.9Small-Medium Operations 57.3 50.2 2.4 1.5 3.8 44.3
-61-

Figure 5.6. Manure-P Pathways to Receiving Channels in the Lake Simcoe Basin. (Numbersrepresent proportions transmitted to next compartment).
-62-

TABLE 5.10 Assumed Manure Management Of Livestock Operations Based OnInventory Samples.
(% of each Livestock Category)CATTLE SWINE POULTRY
Separate Solid or Semi-solid Manure Storage areas
0 58.2 85.3
Liquid Manure Storage 0 41.8 14.7Manure Storage on open lot areas 100 0 0
Not all the manure phosphorus which runs off from these three sources reaches streamchannels. We assume, based on earlier PLUARG research, that sources further than 122m(400') from the stream have no impact, while sources within this `critical distance` deliverphosphorus in proportion to their proximity to stream channels. The use of this model withthese assumptions has resulted in loading estimates in good agreement with smallwatershed livestock loading measurements in two other studies (13,16).
An aerial photographic interpretation study of large livestock operations in Ontario (15) wasused as a basis for describing the distribution of livestock and poultry farms with respect tostream channels in the Lake Simcoe basin. Farms generally follow a skewed distributionaway from channels, e.g. 45% of beef cattle operations are within the first 60m of a streamchannel, while only an additional 15% of beef cattle operations are found within the next60m.
Assumptions of the model:
1. the only sources of manure phosphorus are runoff from open feedlots and barnyards,semi-solid and solid manure storages and winter spread manure
2. the runoff of total phosphorus from manure will be fixed proportions of the manurephosphorus
3. 30% of manure is spread in winter (randomly)
4. 10% of winter spread manure phosphorus runs off
5. 2% of solid and semi-solid manure phosphorus runs off from storage
6. 5% of manure phosphorus produced in open lot categories (See Table 3.10) runs off
7 Linear attenuation of phosphorus runoff from spread manure, lots and storage occurswithin 122m of a channel.
-63-

Application of the model described above indicates that of the annual phosphorus producedin animal manure approximately 1.3% reaches a stream channel.
Phosphorus production, loading to stream channels and unit area loads by sub-watershedare summarized in Table 5.11 with the exception of the Northeast and Talbotsub-watersheds, manure phosphorus production, total and unit area loads are fairly evenlydistributed throughout the basin. In comparison with Southern Ontario as a whole, theestimated unit area loadings are moderate. Loads in the drainage basin are approximately½ to a of loading in many watersheds in south-western Ontario. In terms of the LakeSimcoe loadings, the total estimated annual amount of 17.5 tonnes is close to the totalannual load from the 12 sewage treatment facilities in the basin.
TABLE 5.11 Phosphorus Production, Loading To Channels And Unit Area Loads - BySubwatershed.
SubwatershedAnnual Manure
P. Produced (t/yr)Annual P. loaded to
Channels (t/yr)Unit Area Load
(gm P/ha)Maskinonge 47.3 0.8 75Black 187.9 2.7 72Pefferlaw 215.8 2.7 62Beaverton 277.4 3.2 73Talbot 86.7 1.0 30Northeast 74.2 0.8 55Northwest 208.5 2.7 60Holland 281.9 3.6 60
Total 1380 t/yr 17.5 t/yr
5.7 STREAMBANK EROSION LOADS
To estimate loadings from this source, reference was made to a detailed study ofstreambank erosion conducted by PLUARG (17). This study concluded that 2 to 32% of thephosphorus loads from a number of small agricultural watersheds were associated withstreambank erosion. The unit area estimates for the study watersheds ranged from 0.003to 0.103 kg/ha of total phosphorus. Watersheds that were similar to those in the LakeSimcoe drainage basin in terms of land use and topography had loading rates at the low endof this range - 0.003 to 0.016 kg/ha. These values were used to derive a range ofphosphorus loadings associated with streambank erosion.
-64-

5.8 EVALUATION OF THE POTENTIAL SOIL LOSS
The main causes of soil loss from rural land are sheet and rill erosion. Sheet erosion is theremoval of a thin, fairly uniform layer of soil from the land surface by runoff water. Rillerosion is soil loss by many small channels only a few centimetres deep. Both of these soilloss processes are accounted for by the Universal Soil Loss Equation (USLE) (18). This modelprovided the basis for estimation of potential soil loss in this study.
The USLE model considers climatic, topographic and soil characteristics as well as cultivationpractices to estimate soil loss. The equation is:
A = R • K • LS • C • P
where A is the computed soil loss per unit area, expressed in the units selected for K andthe period selected for R,
R is the rainfall factor (per year),K is the soil erodibility factor (tonnes/hectare),LS is the topographic factor, (dimensionless)C is the cover and management factor, (dimensionless) andP is the support practice factor (dimensionless)
The model requires a minimum of field measurements and the judicious application ofpublished parameter values. The USLE is widely accepted and well developed model whichhas been used previously in Ontario (25). Considerable literature exists on its use.
The following section describes the application of the model and the methodology used indetermining the values of the factors.
5.8.1 APPLICATION OF THE USLE
Typical applications require that the parameters of the USLE be derived for individual farmfields (or even parts of fields) by relatively simple on-site survey methods. An investigationon this scale is not practical for large watershed planning studies. Therefore, a three tieredapproach was used based on,
1) a whole basin study based on the Universal Transverse Mercator (UTM) grid,
2) a study of the high erosion areas indicated in the basin study based on discrete areasdelineated on the OMAF Agricultural Land Use Systems maps, and
3) an actual field investigation of the potential high erosion areas indicated by thesecond tier study. This approach is shown diagrammatically in Figure 5.7.
-65-

Figure 5.7. Three Tiered Approach to Identification of High Potential Erosion Areas.
-66-
5.8.1.1 BASIN STUDY (TIER 1)
A methodology was developed to apply the USLE to the Lake Simcoe drainage basin usingthe Universal Traverse Mercator (UTM) Grid as the basis to segregate the drainage basin intosub-areas or "cells" of one square kilometre. For each cell the value or a weighted averagevalue of each factor (ie. topographic) of the USLE was estimated. The application usedherein provides a level of accuracy suitable for conservation planning on a watershed level.From this overview, areas of high potential soil erosion were identified for which moredetailed investigations should be carried out to pinpoint specific problem sites.
values of the factors of the USLE were determined as follows:
The Rainfall or R factor was estimated to be 99 for 1982, 71 for 1983, 77 for 1984, and 82for the average year (19). The Erodibility or K factor was determined as the area weightedaverage value of the K factors of all the soils within the individual UTM grid cell.
Topographic or LS factor was determined using the equation:
LS = (λ /72.6) M •(65.41 SIN 2 θ +4.56 SIN θ +0.065)where:
LS is the topographic factor,λ is the slope length expressed in feet θ is the angle of the slope, andM is 0.5 if the percent slope is > 5%,
0.4 if the percent slope is 3.5 - 5.0%, 0.3 if the percent slope is 1.0 - 3.5%, 0.2 if the percent slope is < 1.0%.
R.E. Horton (20) proposed that the average slope of an area could be measuredsatisfactorily from topographic maps. The equation for the average slope is
S = D • LC / A • 100where:
S is the average slope of the area, expressed as a percent,D is the contour interval of the topographic map in metres,LC is the length of the contour lines in metres, and A is the area, expressed in square metres.
The accuracy of this method is limited by the scale and contour interval of the topographicmap. The larger the scale and smaller the contour interval the greater the accuracy of theestimated slope. In the Lake Simcoe area, the most detailed topographic map available was1:50,000 with a 25 foot contour interval.
-67-
To determine the slope length per cell, air photo interpretation was necessary. Ten cells withsimilar slopes (0-2%, 2-4%, 4-6%, 6-8%, 8-10%, 10%>, ie. 60 cells) were randomlychosen within the boundaries of the drainage basin. Air photos of these areas wereexamined with a stereoscope to determine slope lengths. Average values of slope lengthswere then calculated for the entire cell. These results are presented in Appendix C. Errorsin measuring the average slope length are not as critical since they are a less sensitiveparameter than the slope gradient in the USLE (21).
To determine the Cover and Management or C Factor values, information on current landuse was obtained from the Ontario Ministry of Agriculture and Food's "Agricultural Land UseSystems" maps (1982 and 1983). These agricultural land use maps indicate areas of specificcrops or rotations and are valid over a time period longer than one season.
The C Factors used for the individual crops were taken from material published by van Vlietand Moore (22). The crop rotations included in the agricultural land use system classificationwere coupled with these values in order to derive weighted C factors for the individualrotations. A table of the C factors for the Agricultural Land Use System classifications isincluded in Appendix D. An area weighted C factor was derived from the values of the Cfactors of all the land use classification systems within the individual UTM grid cells.
The Support Practice or P factor was assumed to have a value of 1. A value of 1 wouldassume that the ploughing direction of all fields in the drainage basin would be up and downthe slope. This assumption would generate the worst case estimates.
The basin study (Tier 1) identified areas with a significant number of cells with high erosionrates. This method has indicated the magnitude of the erosion problem in the basin anddelineated areas of significant potential soil erosion in a general way.
Figure 5.8 is a computer generated map of the potential soil loss for the average year in theLake Simcoe drainage basin. A total of 183 square kilometres (approximately 6 percent ofthe watershed) has potential soil loss greater than or equal to 11.2 tonnes/hectare/year (5tons/acre/year).The LSEMS Technical Committee adopted as a standard that soil lossexceeding 11.2 tonnes/hectare/year was unacceptable. The areas having the greatestpotential soil erosion are easily identified from the figure. Used separately, or in conjunctionwith Priority Management mapping, such information will be useful for the development ofa targeting-strategy for soil erosion control.
The potential soil loss for the average year, calculated as outlined in previous sections, isapproximately 1 million tonnes/year (1.1 million tons/year) for the drainage basin.
-68-
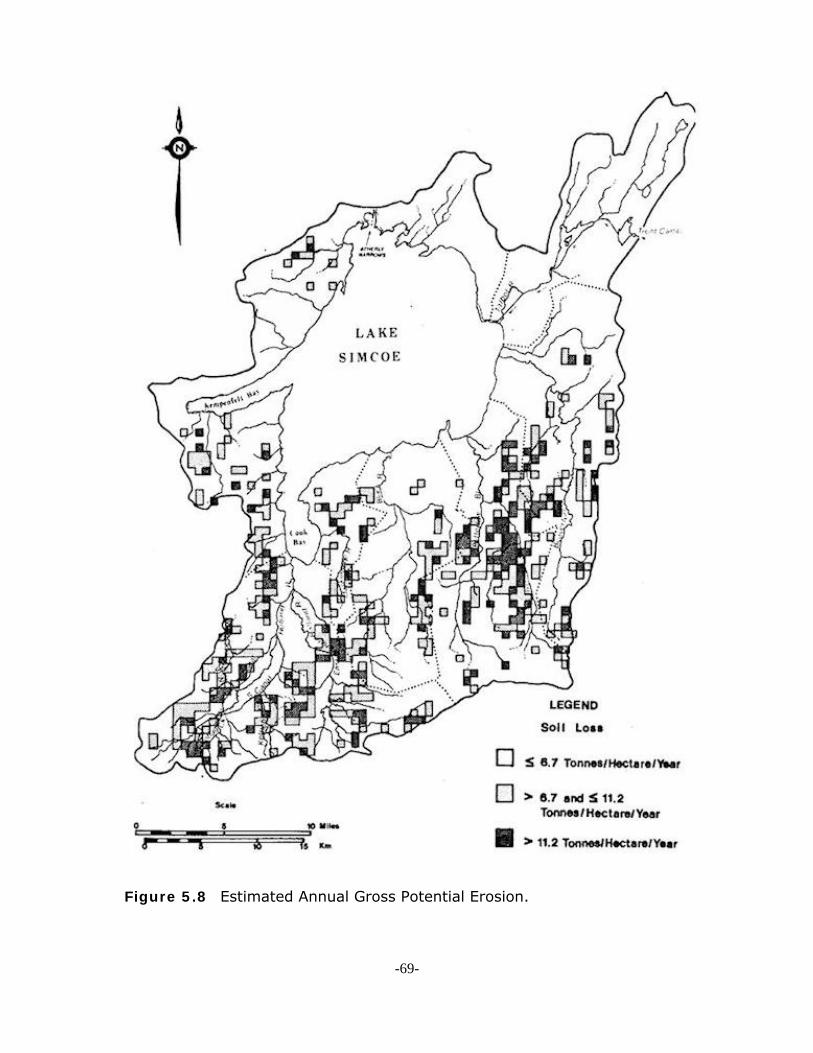
Figure 5.8 Estimated Annual Gross Potential Erosion.
-69-

Table 5.12 presents the potential soil loss for each of the sub-basins computed both on anannual and a unit area basis. The Pefferlaw Brook and Holland River sub-basins exhibit thehighest unit area erosion rates in the drainage basin exceeding 5 tonnes/hectare/year. TheNorth East sub-basin had the lowest unit area potential erosion rate of, 0.3tonnes/hectare/year.
The soil loss that is actually delivered to Lake Simcoe represents a very small portion of thebasin's total potential soil loss. This observation is supported by comparing the total annualsuspended solids loads to the annual potential soil loss from the 4 major sub-basins (seeTable 5.13). Suspended solids delivery ratios for the three years of data range from a lowvalue of 0.5% in 1983 to 1.2% in 1982.
Suspended solids delivery ratios for various monitoring stations have also been estimatedand are shown in Table 5.13. Higher delivery ratios are present in the upland watersheds,namely; Kettleby Creek, North Schomberg River and Holland River East Branch. Lowerdelivery ratios exist for the downstream stations. The main reason for this difference isbelieved to be a net deposition of particulate matter in the slower moving river reaches.These differences in delivery ratios also support the large load losses discussed in TechnicalReport A.
To provide an economically feasible management strategy to reduce loads to Lake Simcoe,target watersheds should be established. The three watersheds mentioned above all exhibitextremely high delivered loads. Although these delivered loads to gauge may not reach LakeSimcoe, improvement within these watersheds will benefit the drainage basin as a whole.
5.8.1.2 HIGH EROSION AREAS - MAP STUDY (TIER 2)
The 183 cells that the basin study (tier 1) indicated had potential soil loss greater than 11tonnes/hectare/year (5 tons/acre/year) were the subject of this study (see Figure 5.7).Within and around each high erosion UTM cell the USLE factors were abstracted for discreteareas of land use, indicated on OMAF Land Use maps. Four hundred twenty-three (423)discrete areas were examined. This process eliminated the effects of averaged C factors andserved to expose the high and low potential erosion areas within the individual UTM cells andhigh potential soil loss areas in neighbouring cells.
The values of the USLE factors were determined from the sources and by the methodsdescribed in the basin study. Only land use system areas with C factors greater than 0.1were investigated; i.e., only the land use systems of monoculture corn/beans (P), cornrotation system (C), mixed rotation system (M), and grain system (MG) were examined.
-70-

Table 5.12 Annual Gross Potential Soil Loss And Suspended Solids Delivery Ratios.
Sub-BasinDrainage
Areakm2
Annual Potential Soil Loss - tonnes x 10 3 UnitArea Potential Soil Loss (Tonnes/ha)
Suspended Solids DeliveryRatio
Normal 1982 1983 1984 1982 1983 1984BEAVERTON 443 156 189 136 147 0.010 0.007 0.012
(3.5) (4.3) (3.1) (3.3)
BLACK 376 112 136 97 105 0.007 0.005 0.007(3.0) (3.6) (2.6) (3.0)
HOLLAND 596 314 380 273 295 0.012 0.010(5.3) (6.4) (4.6) (5.0)
MASKINONGE 111 44 53 38 41(4.0) (4.8) (3.4) (3.7)
NORTHEAST 151 4 5 3 4(0.3) (0.3) (0.2) (0.3)
NORTHWEST 402 125 151 109 118(3.1) (3.8) (2.7) (2.9)
PEFFERLAW 437 221 267 192 208 0.008 0.007 0.010(5.1) (6.1) (4.4) (4.8)
TALBOT 325 26 31 23 24(0.8) (1.0) (0.7) (0.7)
-71-

Table 5.13. Potential Erosion By Land Use And Slope Class.
(Areas in Hectares)ResourceInventoryLanduse*
GrossErosion
(Tonnes)Area
Unit AreaErosion
Percent Slope
0-2 2-4 4-6 6-8 8-10 Above 10
P 153659 0 49801 75375 26547 1503 433 6571 0 2819 2959 755 28 10
23 0 18 26 35 54 43
88194 0 6651 57198 21309 3036 05364 0 510 3764 935 155 0
16 0 13 15 23 20 0
M 47486 0 2158 27384 16787 0 1157 2919 0 190 1789 915 0 25
16 0 11 15 18 0 46
MG 31686 0 5855 17041 7826 964 02034 0 495 1174 315 50 0
16 11 15 25 19 0TOTALS: 321025 16888
*P - Continuous Row Crop: Corn or Beans. C - Corn System: 60% rotational corn or beans, 20% mixed grains, 20% Hay. M - Mixed System: equal parts of rotational corn or beans, mixed grains, hay. MG - Grain System: 85% mixed grains, 15% hay or pasture.
-72-

Of the 423 land use areas examined within and around the 183 cells, the potential soil lossrates of 168 areas were less than 11 tonnes/hectare/year. Of the 255 areas with potentialsoil loss greater than 11 tonnes/hectare/year, 78 were found to have potential erosion ratesof 22 tonnes/hectare/year or greater.
Table 5.13 presents the results of this study.
This tier 2 study has identified potential erosion rates in areas where the land use is asignificant determining factor. In comparison to the basin study (tier 1), some areas havebeen added and some have been dropped from further consideration.
5.8.1.3 HIGH EROSION AREAS - FIELD STUDY (TIER 3)
Sixty-five (65) of the 78 potentially high erosion (22 tonnes/ha/ yr +) areas from the MapStudy (tier 2) were examined in the field. The data used to determine soil loss for theindividual fields were obtained during the site visits using standard methods prescribed forthe USLE. The value of the P factors were obtained from Table 5.14.
TABLE 5.14 Support Practice Factors For Erosion Control (22).
Slope(%)
Up AndDown Slope
Cross SlopeFarming
Without Strips
ContourFarming
Cross-slopeFarming With
Strips
Contour Strip-cropping
0-2* 1.0 1.0 1.0 1.0 1.01.0 0.75 0.50 0.37 0.251.0 0.80 0.60 0.45 0.30
12-18 1.0 0.90 0.80 0.60 0.4018-24 1.0 0.95 0.90 0.67 0.45
P FACTOR NOT DEFINED FOR 0-2% SLOPE - ASSUME 1.0
Potential erosion rates were calculated for each field. Area weighted potential erosion rateswere then calculated for the 65 land use areas. Of the 65 land use areas examined, 18 werefound to have weighted average erosion rates of less than 11 tonnes/hectare/year. Of the47 remaining land use areas with potential soil loss greater than 11 tonnes/hectare/year,nineteen land use areas had weighted average erosion rates of 22 tonnes/ hectare/year ormore.
-73-

Of the 647 actual fields investigated, 370 had calculated erosion rates that were less than11 tonnes/hectare/year. Of the 277 fields that were in land use areas with potential soil lossrates greater than 11 tonnes/hectare/year, 159 fields had erosion rates of 22tonnes/hectare/year or more.
This study has pinpointed actual fields where remedial measures can be applied for optimalbenefits. These fields have been located on aerial and orthophotographs on file at theAuthority office.
5.8.2 OTHER STUDIES
The Authority has conducted several studies to evaluate potential soil erosion in smallwatersheds. For these studies Authority staff determined USLE factors and potential soil lossrates through in-field investigations. The field data for the North Schomberg RiverWatershed Soil Erosion Study (23) was available in a format that allowed a comparison ofresults.
5.8.3 STUDY COMPARISON
Wischmeier (24) warns against potential errors in estimating factors of the USLE when thesefactors are evaluated over large land areas. He also states that applying the USLE tosituations for which its factor values cannot be determined from existing data withacceptable accuracy is a misuse. Wischmier also estimated the average prediction error ofthe method at 1.27 tonnes/acre with about 5 percent of the estimated losses differing fromestimated losses by about 4.08 tonnes/acre. The most common method of determining thefactors of the USLE is on a field-by-field basis. Unfortunately, this approach is too timeconsuming and costly to be used for the analysis of large areas. In order to overcome theseconstraints, the approach used in tier 1 analysis previously described was to evaluate USLEfactors on a 1 square kilometre grid basis using existing data sources. In order to validatethis approach a comparison was made between their USLE estimates and in-field soil lossestimate for one sub watershed area where such detailed studies had been carried out.
The North Schomberg River Watershed Soil Erosion Study (23) determined potential soil lossusing the USLE on a field-by-field basis. This watershed encompassed a drainage area of 53square kilometres with 36 square kilometres completely within the Universal TransverseMercator grid system. These 36 1 square kilometre cells served as the units for comparisonwith the basin study.
To provide an accurate comparison between the two studies, weighted averages of theerosion rates for the field-by-field study were determined. These values were then comparedto the tier 1 USLE potential soil loss estimates by pairing results. Regression analysis yieldeda correlation coefficient of 0.72 with a standard error of estimate of 1.74
-74-

tonnes/hectare/year (see Figure 5.9). This indicates a close correspondence between thepotential soil loss estimates of LSEMS's basin study (tier 1) and the Authority's field-by-fieldstudy.
-75-

Figure 5.9 Erosion Rate Comparison.
-76-

REFERENCES
1. International Reference Group on Great Lakes Pollution From Land Use Activities -March 1977. "Atmospheric Loading of the Lower Great Lakes and the Great LakesDrainage Basin", PLUARG, IJC.
2. Chan, W. H., A.J. Tang and M.A. Lusis. - June 1983. "Precipitation Concentration andWet Deposition Fields of Pollutants in Ontario", MOE Report RAB-61-83-ARSP.
3. Personal Communication with Walter Taylor, Clerk, Township of Uxbridge, August,1983.
4. Personal Communication with Patrick Storey, Clerk-Administrator, Town of Bradford,August, 1983.
5. Communication with York Region Long Range Planning Department, August, 1983.
6. Ministry of the Environment. - June, 1975. "Lake Simcoe Basin - A Water Quality andUse Study", M.O.E.
7. U.S. Army Corps of Engineers - 1977. "Storage Treatment Overflow Runoff Model",Hydrologic Engineering Centre, California.
8. Singer, S and S. So. - May, 1982. "Urban Non-Point Source Pollution and Control",Grand River Implementation Committee, Technical Report Series, Report #28.
9. Ministry of the Environment. - 1979. "Lake Simcoe-Couchiching Basin EnvironmentalStrategy" M.O.E.
10. Cooke D. J., W. T. Dickinson and R. P. Rudra - July, 1985 "The Guelph model forevaluating effects of Agricultural Management systems on Erosion and Sedimentation- User's Manual", University of Guelph, Technical Report 126-71.
11. Snell, E. A. - March, 1984. "A Manual For Regional Targeting of Agricultural SoilErosion and Sediment Loading to Stream", Lands Directorate, Environment Canada,Working Paper No. 36.
12. Dickinson, W. T. - 1977. "Rainfall Intensity-Frequency Relationships From MonthlyMeans.", Journal of Hydrology.
13. Robinson, J.B. and D.W. Draper - 1978. "A Model for Estimating Inputs to the GreatLakes from Livestock Enterprises in the Great Lake Basin", IJC, PLUARG Report Task
-77-

C, Activity 1.
14. Statistics Canada - 1981. 15. Coote, D.R., E. MacDonald, M. Rigby - 1974. "A Selective Inventory of Large Livestock
Operations in Southern Ontario", Combined Report of ERS/SRI Agriculture Canada,Section IV.
16. Demal, L. - 1983. "An Intensive Water Quality Survey of Stream Cattle Access Areas",Stratford Avon Environmental Management Project, Tech. Report # R-19.
17. Knap, K. M. and W. F. Mildner - 1978. "Streambank Erosion in the Great Lakes Basin",PLUARG, IJC.
18. Wischmeier, W. H., and D. D. Smith, - 1978. "Predicting Rainfall Erosion Losses - AGuide To Conservation Planning", U.S. Department of Agriculture, AgricultureHandbook 537.
19. Wilson J., Unpublished doctoral thesis, "The Problems of Accelerating Soil Erosion andCultural Eutrophication and Their Management in the Lake Simcoe-Couchiching Basin,Ontario, Canada, 1800-1983".
20. Horton, R.E. - 1914. "Deviation of Runoff From Rainfall Data" Trans., A.S.C.E. 77,p.369-375.
21. Williams, J.R. and H.D. Berndt, - 1976. "Determining the Universal Soil LossEquation's Length Slope Factor for Watersheds".
22. van Vliet, L. J. P., and N. Moore, - 1977. "Water Erosion: nature and extent inOntario soil erosion". In-service training seminar for O.M.A.F. Guelph, Ontario.
23. Cunningham D., L. Drescher, E. Lew, L. Philip and F. Raininger - 1983. "NorthSchomberg River Watershed Soil Erosion Study", South Lake Simcoe ConservationAuthority.
24. Wischmeier, W. H.. "Use and Misuse of the Universal Soil Loss Equation",January-February 1976 Journal of Soil and Water Conservation (volume 31, no. 1, pp.5-9).
25. Wall, G.J. and L.J.P. van Vliet, 1977. "Prediction of Rainfall Erosion Losses".In-service training seminar for O.M.A.F. Guelph, Ontario.
-78-

6 DISCUSSION OP LAKE SIMCOE PHOSPHORUS LOADS AND SOURCES
The estimation of phosphorus contributions to a receiving water body from various diffuseand point sources along a tributary network is a difficult task. Pollutants in transport aresubject to many physical, chemical and biological processes. This has consequences in termsof the efficiency of delivery of a pollutant. For example, if a point source is located in theheadwaters of a stream, the overall annual load contributed to the outlet of the streamwould probably be smaller than if this point source was located at the mouth of the stream.Any net reduction in the initial upstream loading may be caused by sedimentation or plantuptake within the tributary. However, instream losses by sedimentation may be temporaryas during next spring runoff or major runoff event (e.g. a 100 year storm), this storedloading is contributed as part of the diffuse load.
To evaluate the significance of diffuse and point source loads for this study, loadings weredivided into two categories. The first category includes all sources of phosphorus loadeddirectly to Lake Simcoe. The second category includes all sources of loadings to the varioussub-basin tributaries (indirect loadings).
The direct loadings to Lake Simcoe include: • Atmospheric (direct lake interception)
• Built-up areas on the lake (Barrie, Orillia, Lagoon City, Beaverton and Sutton)(Stormwater runoff and sewage effluent)
• Cottage private waste disposal systems
• Sub-Basin tributary outlet loadings.
The second loading category specifically examines the inputs to the various sub-basintributaries along its water course to the lake. These inputs include:
• Built-up areas (sewage treatment facilities and urban washoff areas ontributaries within a drainage basin)
• Soil Erosion
• Streambank Erosion Livestock Operations Vegetable Polders
• Ground Water sources
-79-

The classification into direct and indirect lake inputs is of value in assigning relativeimportance to the various sources and in addressing effectiveness and significance ofproposed remedial strategies.
6.1 DIRECT LAKE SIMCOE PHOSPHORUS LOADING ESTIMATES
Phosphorus sources discharging directly to Lake Simcoe were estimated for 1982, 1983 and1984. Phosphorus inputs from built-up areas were extrapolated to the years 2001 and 2031.These sources are individually described and quantified in the following sections.
6.1.1 ATMOSPHERIC LOADS
Total atmospheric loadings deposited directly into Lake Simcoe were estimated (Section 5.1)to be 13.3, 12.4 and 12.8 tonnes for 1982, 1983 and 1984 respectively. These atmosphericestimates for Lake Simcoe are in line with two literature sources (referenced in Section 5.1).
6.1.2 BUILT-UP AREAS
Monitored municipal phosphorus inputs that directly enter the lake are described in Table6.1. In the year 2001, phosphorus loads from these sources are forecast to decline by 48%relative to 1984 levels. This decrease is due to improvements to the sewage treatmentplants in Barrie and Orillia.
The reduction gained to the year 2001 by improved sewage treatment processing may bepartially offset by an increase in urban runoff loads (1.3 tonnes increase relative to 1984).Moreover, by 2031, phosphorus contributions from sewage effluent could potentiallyincrease back to their 1984 levels if no additional measures are taken. Urban runoff loadswould be approximately three to five times their 1984 levels in 2031 if no qualityrequirements are imposed on urban stormwater runoff. In summary, total direct urbanloadings of phosphorus to the lake could exceed 1984 levels by a minimum of 15tonnes/year by 2031 if no measures are imposed to offset these projected effects ofpopulation growth.
-80-

Table 6.1. Estimated Urban Phosphorus Loads Discharged Directly Into Lake Simcoe.
(A) URBAN STORM SEWERS2031 a
Location 1982 1983 1984 2001 low highBarrie 1.8 1.4 1.7 2.9 5.1 9.2Orillia 0.54 0.44 0.51 0.57 1.0 1.8
Total 2.34 1.84 2.21 3.47 6.1 11.0
(B) WATER POLLUTION CONTROL FACILITIES2031 a,b
Location 1982 1983 1984 2001 low highBarrie 7.60 7.50 9.67 3.50 6.30 11.0Orillia 2.10 2.00 2.63 1.40 2.60 4.60Beaverton 0.272 0.530 0.600Sutton 0.298 0.068 0.131 2.00Lagoon City 0.180 0.235
Total 10.27 10.28 13.27 6.9 12.4 19.1
NOTES:a) Low and high values are based on low and high population estimates.b) Keswick and Innisfil facilities, which are under construction, are included in the future
forecasts.
6.1.3 COTTAGES
The total phosphorus loading estimated to be generated by private waste disposal byshoreline cottages is 8.3 tonnes (1). Due to losses and attenuation as cottage effluentpercolates through the soil, a loading for a normal year to Lake Simcoe of 3 tonnes/yr wasconsidered reasonable. Normalizing this load with regard to precipitation, the 1982, 1983and 1984 loads were estimated to be 3.63, 2.61 and 2.82 tonnes respectively.
-81-

6.1.4 SUB-BASIN TRIBUTARIES
Four of the eight sub-basin areas were monitored for total phosphorus at or near theirmouths (see chapters 3,4). For the four unmonitored sub-basins extrapolation techniqueswere used to determine their magnitude of loading. Table 6.2 summarizes these sub-basinloads and other direct loads to the lake.
The Holland sub-basin contributes the highest loading to Lake Simcoe and is the single mostimportant source of phosphorus to Lake Simcoe. This sub-basin is comprised of both anintensive agricultural area and rapidly expanding urban areas. Work has recently beencompleted to divert sewage effluent from Newmarket and Aurora out of this drainage basin.
Aside from atmospheric deposition, which is not controllable, the second highest contributoris the direct sewage effluent discharges to the lake. In the near future (late 1986) thissource will have been reduced as the effluent total phosphorus concentration will be reducedto 0.3 mg/L to 1.0 mg/L.
-82-

TABLE 6.2. Estimated Phosphorus Inputs To Lake Simcoe From All Sources.
Total Loading (tonnes/yr)Source 1982 1983 1984 Average % of TotalIndirect (Tributary) Loadings from all sources
Holland 36.84 18.82 17.27 24.31 (29.8) Maskinonge 2.18 1.23 1.48 1.63 (2.0)Black 7.41 3.17 3.84 4.80 (5.9)Pefferlaw 10.07 7.54 8.22 8.61 (10.6) Beaverton 9.02 5.11 6.98 7.04 (8.6)Talbot 1.29 0.73 0.87 0.96 (1.2)Northeast 0.40 0.22 0.27 0.30 (0.4)Northwest 6.19 3.49 4.20 4.63 (5.7)
Total 73.40 40.31 43.13 52.28 (64.1)
Direct Loadings to Lake SimcoeCottage SepticTanks
3.63 2.61 2.82 3.02 (3.7)
Urban Centres on the LakeSewage Effluent 10.27 10.28 13.27 11.27 (13.8)Stormwater Runoff 2.34 1.84 2.21 2.16 (2.6)AtmosphericDeposition
13.30 12.40 12.80 12.83 (15.7)
TOTAL 102.94 67.44 74.23 81.56 (100)
-83-
6.2 INDIRECT LAKE LOADING FROM TRIBUTARY SOURCES
Phosphorus sources that enter the tributaries include phosphorus carried by ground waterdischarges, built-up areas, soil and streambank erosion, livestock operations and vegetablepolders. With the exception of sewage effluent and polder pump off water, these loadingscould not be observed and monitored directly. Instead, they were estimated using a varietyof modelling and extrapolation techniques described in Chapter 5. These sources areindividually described and quantified in the following sections.
6.2.1 GROUND WATER DISCHARGES
Phosphorus loads contributed by ground water sources were estimated by a simple empiricalmodel and the analysis of base flow data. It was estimated that the phosphorus contributionfrom this source was 2 to 3 tonnes/year.
6.2.2 BUILT-UP AREAS
Stormwater loadings to tributaries from urban and other built-up areas were comparable tothose entering Lake Simcoe directly. Sewage effluent loadings are considerably less in both1984 and in the future as a result of the Newmarket-Aurora diversion (Tables 6.2 and 6.3).Stormwater stands out as a significant source in the future due to expanding urban areas.
It should be noted that increasing urban loads will be off set by a slight reduction of diffuseagricultural loads by the conversion of agricultural cropland to urban land uses.
-84-

TABLE 6.3. Estimated Urban Phosphorus Loads Entering The Tributary Waters Of LakeSimcoe.
(a) Urban Storm Sewers 2031aLocation 1982 1983 1984 2001 low highNewmarket 1.4 1.2 1.3 1.8 3.2 5.7Aurora 1.4 1.2 1.3 2.2 4.0 7.3Bradford 0.19 0.17 0.18 0.30 0.54 0.96Uxbridge 0.15 0.14 0.14 0.15 0.27 .036Other 1.2 1.1 1.2 1.8 3.2 5.8
(b) Water Pollution Control FacilitiesNewmarket 3.78 4.39 1.07 0 0 0Aurora 1.66 2.52 1.83 0 0 0Bradford 0.490 0.420 0.234 0.68 1.20 2.20Uxbridge 0.110 0.118 0.121 0.19 0.34 0.61Cannington 0.179 0.210 0.179Holland Landing 0.058 0.030 0.059 0.50 1.00 1.00Mount Albert 0.014 0.028
TOTAL 6.277 7.702 3.521 1.370 2.54 3.81
NOTE: a) Low and high values are based on low and high population estimates.
6.2.3 CROPLAND AND OTHER SOIL EROSION
Accurate calculation of phosphorus loads delivered into tributaries by eroded sediment is notfeasible on a basin scale. Therefore, modelling and extrapolation techniques (as describedin section 5.5) were used to project an estimate of these phosphorus loads. These estimatesare in the range of 80 to 120 tonnes/year for the entire basin (Table 5.6).
-85-

Because of instream processing, only a portion of these phosphorus loads reach the lake.This portion constitutes a part of the total delivery of 139 tonnes of phosphorus coming fromall sources through tributary input. However, there is insufficient information available at thepresent time to allow calculation of the amount contributed by soil erosion to the totaltributary load to the lake.
6.2.4 STREAMBANK EROSION
The estimated phosphorus input from streambank erosion ranges from 0.9 to 4.6tonnes/year (section 5.7). During the course of the streambank erosion inventory workdescribed in Chapter 7, 882 problem sites were found. Thirty of these exhibited a significanterosion problem. Four rivers, namely the Beaverton, Black, North Schomberg and Holland(upstream of the Holland Marsh polder) accounted for 50% of the 882 sites.
6.2.5 LIVESTOCK OPERATIONS
Phosphorus input from livestock operations, appears to be a more significant source thanstreambank erosion. Of the total manure phosphorus generated within the drainage basineach year, 17.5 tonnes are estimated to enter the tributaries. It should be noted this valueis a very preliminary estimate since livestock operations were not examined in detail.Numerous livestock operations also allow free cattle access to streams which in some casesis a primary factor in causing streambank erosion and disruption of the stream bed.
6.2.6 PHOSPHORUS LOADS FROM VEGETABLE POLDERS
With the joint participation of the Holland Marsh Drainage Commission, Lake Simcoe RegionConservation Authority and the Ministry of the Environment, water level, pump running timeand pump off water quality data were gathered for 1982, 1983 and 1984 at the Bradford andSpringdale Pumping Stations. From this data, volumes and mass loadings for totalphosphorus and filtered reactive phosphorus, (soluble phosphorus), were calculated. Thesevolumes and loads are presented in Table 6.4.
Table 6.4 Phosphorus Loads In The Holland Marsh Polder Pump Off Water (Bradford andSpringdale Stations).
Year 1982 1983 1984Volume (1000 cu. m.) 8,520 4,580 6,670Total Phosphorus (tonnes) 10.63 3.07 5.84Filtered Reactive Phosphorus (tonnes) 7.88 1.66 4.86
-86-
The pump off water loads include only the transfer of phosphorus out of the polder. Theseloads do not take into consideration that phosphorus may find its way back into the polderthrough irrigation and tile drain transfer. It has been estimated using a water budgetbalance that the annual phosphorus loads that enters the polder were 0.7, 0.9 and 0.8tonne/year for 1982, 1983 and 1984 respectively.
To estimate the net annual phosphorus contribution derived from all vegetable polderswithin the drainage basin, it was assumed that the other polders contribute a unit area loadequal to that of the Holland Marsh polder. The net annual phosphorus loads from allvegetable polders were thus estimated to be 15.2, 3.36 and 7.87 tonnes for 1982, 1983 and1984 respectively.
REFERENCES
1. Ministry of the Environment. June, 1975. "Lake Simcoe Basin - A Water Quality andUse Study", M.O.E.
-87-
7 EVALUATION OF PHOSPHORUS CONTROL OPTIONS
Various phosphorus control options are evaluated in this section for the sources modelledand extrapolated in Chapter 5. These sources include: built-up areas (urban washoff andsewage treatment facilities), streambank and soil erosion, livestock operations and theHolland Marsh polder. The following sections detail the study's emphasis placed on each oneof these sources and the information used.
7.1 HOLLAND MARSH POLDER
The Holland Marsh polder studies were initiated to document the significance of a polder asa phosphorus source and to investigate cost effective remedial measures to reduce itsimpact. The multi-disciplinary studies incorporated facets of agricultural and environmentalengineering. In total five independent studies were completed. These studies were:
• The Drainage Canal Pumping Station Study
• The Chemical Precipitation Study
• Phosphorus Control By Duckweed Harvest - Holland Marsh Polder DrainageSystem (1)
• Holland Marsh Polder - Phosphorus Movement Through Cultivated MuckSoils (2)
• The Phosphorus Fertilizer Use Study
The following subsections detail the above studies
7.1.1 DRAINAGE CANAL PUMPING STATION STUDY
The monitoring of the Holland Marsh polder pumping stations was a joint program conductedby the Holland Marsh Drainage Commission (HMDC), SLSCA and MOE. Data gatheredincluded: water level, pump running time and water quality analysis. Techniques used in thecollection of data are described in Chapter 3.
Data was summarized on both a monthly and annual basis. Pump-off water volumes andphosphorus loadings were calculated. Phosphorus loadings included both total phosphorusand filtered reactive (soluble) phosphorus. Annual loads are presented in Table 7.1. Monthlyloads are presented in Appendix C.
-88-
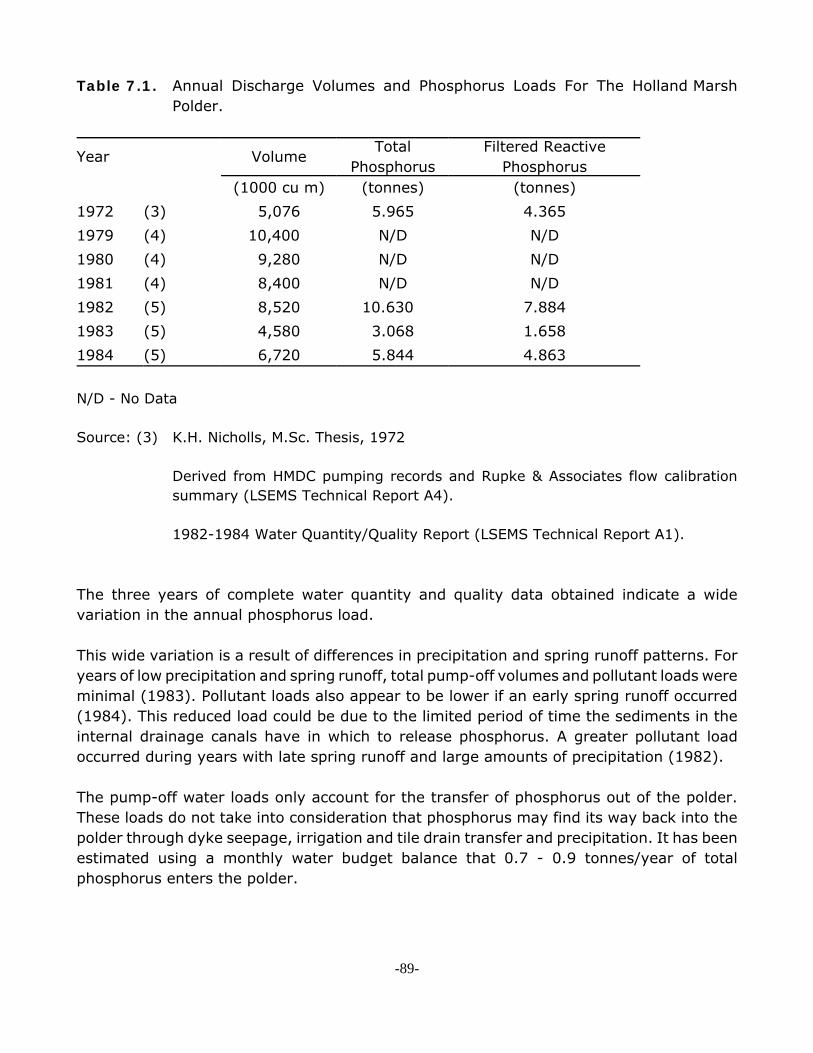
Table 7.1. Annual Discharge Volumes and Phosphorus Loads For The Holland MarshPolder.
Year VolumeTotal
PhosphorusFiltered Reactive
Phosphorus(1000 cu m) (tonnes) (tonnes)
1972 (3) 5,076 5.965 4.3651979 (4) 10,400 N/D N/D1980 (4) 9,280 N/D N/D1981 (4) 8,400 N/D N/D1982 (5) 8,520 10.630 7.8841983 (5) 4,580 3.068 1.6581984 (5) 6,720 5.844 4.863
N/D - No Data
Source: (3) K.H. Nicholls, M.Sc. Thesis, 1972
Derived from HMDC pumping records and Rupke & Associates flow calibrationsummary (LSEMS Technical Report A4).
1982-1984 Water Quantity/Quality Report (LSEMS Technical Report A1).
The three years of complete water quantity and quality data obtained indicate a widevariation in the annual phosphorus load.
This wide variation is a result of differences in precipitation and spring runoff patterns. Foryears of low precipitation and spring runoff, total pump-off volumes and pollutant loads wereminimal (1983). Pollutant loads also appear to be lower if an early spring runoff occurred(1984). This reduced load could be due to the limited period of time the sediments in theinternal drainage canals have in which to release phosphorus. A greater pollutant loadoccurred during years with late spring runoff and large amounts of precipitation (1982).
The pump-off water loads only account for the transfer of phosphorus out of the polder.These loads do not take into consideration that phosphorus may find its way back into thepolder through dyke seepage, irrigation and tile drain transfer and precipitation. It has beenestimated using a monthly water budget balance that 0.7 - 0.9 tonnes/year of totalphosphorus enters the polder.
-89-
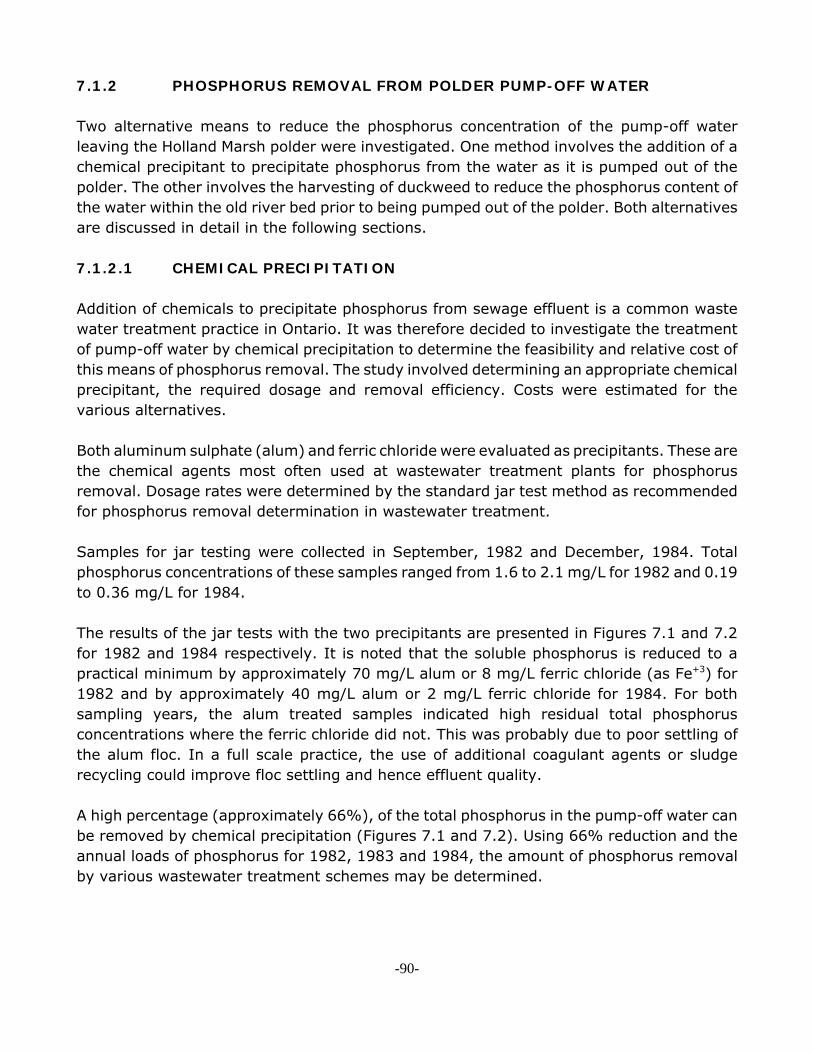
7.1.2 PHOSPHORUS REMOVAL FROM POLDER PUMP-OFF WATER
Two alternative means to reduce the phosphorus concentration of the pump-off waterleaving the Holland Marsh polder were investigated. One method involves the addition of achemical precipitant to precipitate phosphorus from the water as it is pumped out of thepolder. The other involves the harvesting of duckweed to reduce the phosphorus content ofthe water within the old river bed prior to being pumped out of the polder. Both alternativesare discussed in detail in the following sections.
7.1.2.1 CHEMICAL PRECIPITATION
Addition of chemicals to precipitate phosphorus from sewage effluent is a common wastewater treatment practice in Ontario. It was therefore decided to investigate the treatmentof pump-off water by chemical precipitation to determine the feasibility and relative cost ofthis means of phosphorus removal. The study involved determining an appropriate chemicalprecipitant, the required dosage and removal efficiency. Costs were estimated for thevarious alternatives.
Both aluminum sulphate (alum) and ferric chloride were evaluated as precipitants. These arethe chemical agents most often used at wastewater treatment plants for phosphorusremoval. Dosage rates were determined by the standard jar test method as recommendedfor phosphorus removal determination in wastewater treatment.
Samples for jar testing were collected in September, 1982 and December, 1984. Totalphosphorus concentrations of these samples ranged from 1.6 to 2.1 mg/L for 1982 and 0.19to 0.36 mg/L for 1984.
The results of the jar tests with the two precipitants are presented in Figures 7.1 and 7.2for 1982 and 1984 respectively. It is noted that the soluble phosphorus is reduced to apractical minimum by approximately 70 mg/L alum or 8 mg/L ferric chloride (as Fe+3) for1982 and by approximately 40 mg/L alum or 2 mg/L ferric chloride for 1984. For bothsampling years, the alum treated samples indicated high residual total phosphorusconcentrations where the ferric chloride did not. This was probably due to poor settling ofthe alum floc. In a full scale practice, the use of additional coagulant agents or sludgerecycling could improve floc settling and hence effluent quality.
A high percentage (approximately 66%), of the total phosphorus in the pump-off water canbe removed by chemical precipitation (Figures 7.1 and 7.2). Using 66% reduction and theannual loads of phosphorus for 1982, 1983 and 1984, the amount of phosphorus removalby various wastewater treatment schemes may be determined.
-90-
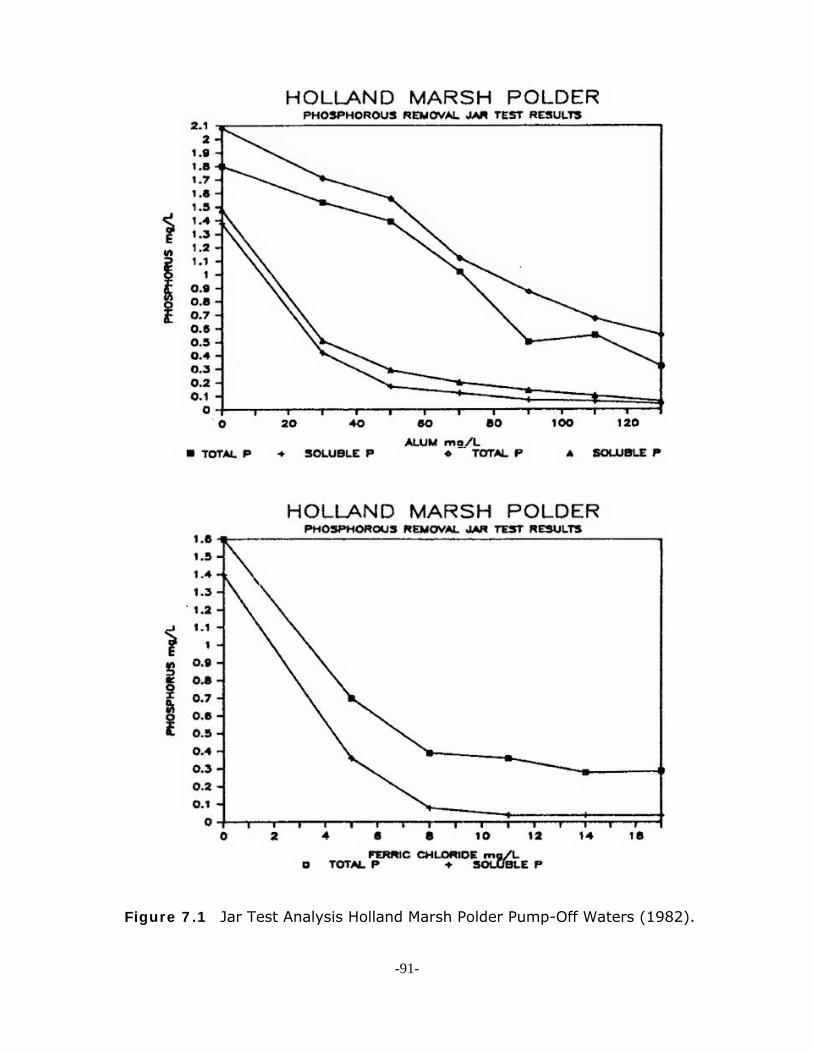
Figure 7.1 Jar Test Analysis Holland Marsh Polder Pump-Off Waters (1982).
-91-

Figure 7.2 Jar Test Analysis Holland Marsh Polder Pump-Off Waters (1985).
-92-

Assuming all pump-off waters at both pumping stations were chemically treated with thisefficiency, the annual phosphorus loadings reductions shown in Table 7.2 would be obtained.
Table 7.2. Annual Removal of Total Phosphorus By Chemical Precipitation of HollandMarsh Polder Pumped Off Water.
(tonnes)1983 1984
Bradford Station 5.4 2.0 2.8Springdale Station 1.6 0.06 1.1
In order to be an effective treatment facility, a chemical feed system paced to the flow rateof the pump(s) is required. Also a clarifier with settled sludge removal facilities would haveto be provided and sized to accommodate the maximum pumping rate capacity of eachstation.
Capital and operation costs associated with facilities to remove these small percentages ofphosphorus for the Springdale pumping station would not be cost efficient. The Springdalepumping station discharged less than 28% of the total polder pump-off water in 1982, lessthan 6% in 1983 and less than 28% in 1984.
Similarly, the 100 HP pump at the Bradford station discharged only 25% in 1982, 20% in1983 and 11% in 1984 of the annual polder pump-off water. The majority of the pump-offwater is discharged by the 50 HP pump at the Bradford station with greater than 47% in1982, 74% in 1983 and 61% in 1984.
Two alternative treatment schemes for phosphorus removal of the polder pump-off watersare considered feasible. Scheme A involves chemical treatment of the discharge from the50 HP pump at the Bradford Station. Scheme B involves chemical treatment of a constantpumped flow at the Bradford Station. The latter scheme would require two constant flowpumps; one pumping water into the west end of the old river bed within the polder; theother pumping from the old river bed into a treatment facility located at the BradfordStation.
The design rationale of Scheme A is that the Bradford 50 HP pump discharges the majorportion of the annual polder pumped-off water (47% in 1982, 74% in 1983 and 61% in1984). Consequently, the treatment facility would be designed to accommodate the peakflow of the 50 HP pump.
The rationale behind Scheme B is based on the provision of chemical treatment to a constantflow for 8 months of the year. In order to permit a constant pumping rate water would haveto be pumped from the canal at a similar rate. The drainage pumps would still be required
-93-

to pump off excess snow melt and rainwater.
Although the pump-off volume discharged by the 50 HP Bradford pump is dependent uponmeteorological conditions, the treatment facility remains constant based upon the nominalcapacity of the 50 HP pump. Consequently, two design scenarios are presented for schemeA, one based on 1982 flows, (maximum) the other on 1983 flows (minimum). Although thedesign of scheme B may be independent of meteorological conditions two scenarios are alsopresented for this scheme based upon the pump-off flow volumes of 1982 and 1983.
Table 7.3 summarizes the design considerations for the two scenarios under Schemes A andB, while Table 7.4 presents cost estimates of these scenarios.
The design consideration and costs are substantially different depending on choice oftreatment scheme and design year. Scheme A involves intermittent operation of thetreatment facility as it provides treatment only while the 50 HP pump is running. For the1982 design year this corresponds to an average of 2-4 hours pumping at an averageinterval of 2.4 days between operation. These short "on times" and long idle periods mayresult in operational problems and higher operator costs, particularly during periods offreezing conditions.
Scheme B, on the other hand, operates under constant flow and could conceivably operateunattended for extended periods of time requiring only normal maintenance checks andaddition of bulk chemical and removal of accumulated sludge. The effectiveness of SchemeB, however, requires further consideration and should be evaluated on a trial basis beforebeing seriously considered. Of particular concern is the diluting property of the externaldrainage canal water that is pumped into the polder. This water, having considerably lowerlevels of total phosphorus than the river water could seriously affect the phosphorus removalefficiency of the treatment facility.
-94-

Table 7.3. Design Considerations of Control Schemes A and B.
SCHEME A (treatment of 50 HP pump flow).
Design Year1982
Design Year1983
Annual Discharge Volume 4,090,000 m3 3,250,000 m3
Nominal Pump Rate 60 m3/min 60 m3/min(86,400 m3/d) (86,400 m3/d)
Chemical Precipitant (Alum)
Dosage (as Alum) 70 mg/L 40 mg/LApplication Rate 6.4 L/min 3.7 L/minAnnual Consumption 284 tonnes 130 tonnes
Chemical Precipitant (Ferric Chloride)
Dosage (as Fe+3) 8 mg/L 2 mg/LApplication Rate 2.5 L/min 0.63 L/minAnnual Consumption 32.4 tonnes 6.49 tonnesClarifier Dimensions 52.2 m diameter * 52.2 m diameter *
(2,160 m2) (2,160 m2)
Annual Sludge Production
Alum 253 tonnes 201 tonnes(6,300 m3) (5,200 m3)
Ferric Chloride 216 tonnes 172 tonnes(5,400 m3) (4,300 m3)
Total Phosphorus Removed 5,600 kg 2100 kg
* based on a surface settling rate of 40 m3/m2/d (MOE guideline for primary clarifiers with P removal)
-95-
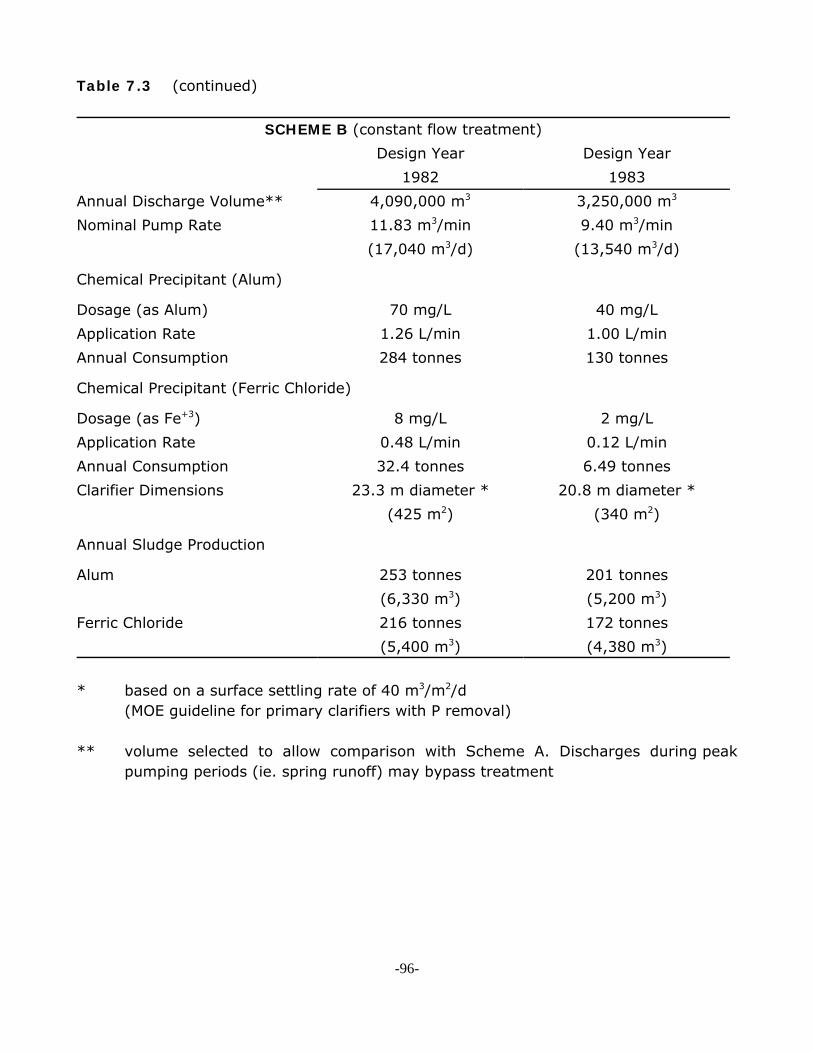
Table 7.3 (continued)
SCHEME B (constant flow treatment)Design Year Design Year
1982 1983Annual Discharge Volume** 4,090,000 m3 3,250,000 m3
Nominal Pump Rate 11.83 m3/min 9.40 m3/min(17,040 m3/d) (13,540 m3/d)
Chemical Precipitant (Alum)
Dosage (as Alum) 70 mg/L 40 mg/LApplication Rate 1.26 L/min 1.00 L/minAnnual Consumption 284 tonnes 130 tonnes
Chemical Precipitant (Ferric Chloride)
Dosage (as Fe+3) 8 mg/L 2 mg/LApplication Rate 0.48 L/min 0.12 L/minAnnual Consumption 32.4 tonnes 6.49 tonnesClarifier Dimensions 23.3 m diameter * 20.8 m diameter *
(425 m2) (340 m2)
Annual Sludge Production
Alum 253 tonnes 201 tonnes(6,330 m3) (5,200 m3)
Ferric Chloride 216 tonnes 172 tonnes(5,400 m3) (4,380 m3)
* based on a surface settling rate of 40 m3/m2/d (MOE guideline for primary clarifiers with P removal)
** volume selected to allow comparison with Scheme A. Discharges during peakpumping periods (ie. spring runoff) may bypass treatment
-96-
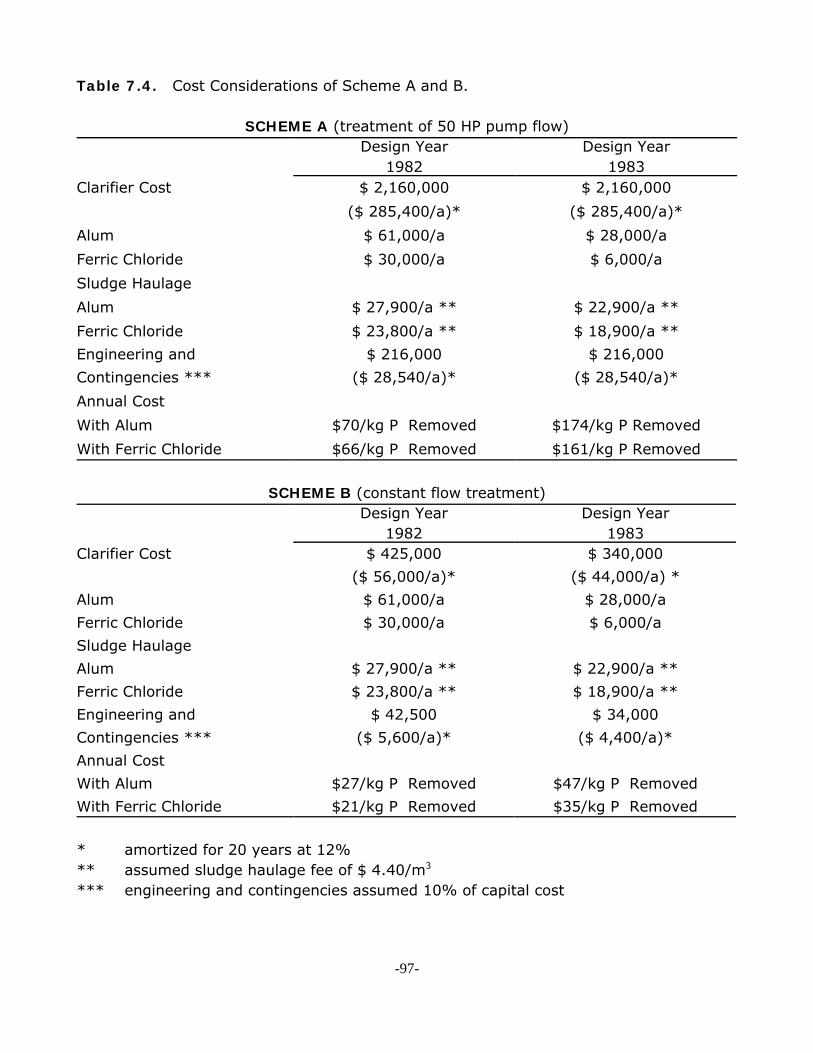
Table 7.4. Cost Considerations of Scheme A and B.
SCHEME A (treatment of 50 HP pump flow)Design Year
1982Design Year
1983Clarifier Cost $ 2,160,000 $ 2,160,000
($ 285,400/a)* ($ 285,400/a)*Alum $ 61,000/a $ 28,000/aFerric Chloride $ 30,000/a $ 6,000/aSludge HaulageAlum $ 27,900/a ** $ 22,900/a **Ferric Chloride $ 23,800/a ** $ 18,900/a **Engineering and $ 216,000 $ 216,000Contingencies *** ($ 28,540/a)* ($ 28,540/a)*Annual CostWith Alum $70/kg P Removed $174/kg P RemovedWith Ferric Chloride $66/kg P Removed $161/kg P Removed
SCHEME B (constant flow treatment)Design Year
1982Design Year
1983Clarifier Cost $ 425,000 $ 340,000
($ 56,000/a)* ($ 44,000/a) *Alum $ 61,000/a $ 28,000/aFerric Chloride $ 30,000/a $ 6,000/aSludge HaulageAlum $ 27,900/a ** $ 22,900/a **Ferric Chloride $ 23,800/a ** $ 18,900/a **Engineering and $ 42,500 $ 34,000Contingencies *** ($ 5,600/a)* ($ 4,400/a)*Annual CostWith Alum $27/kg P Removed $47/kg P RemovedWith Ferric Chloride $21/kg P Removed $35/kg P Removed
* amortized for 20 years at 12%** assumed sludge haulage fee of $ 4.40/m3
*** engineering and contingencies assumed 10% of capital cost
-97-

The design considerations and costs are substantially different given the choice of controland design year. Scheme A is conceptually a batch reactor where the wastewater treatmentfacility is used when pumping is needed. For the 1982 design year pump running times wereusually in the range of 2 - 4 hours. In addition, the average period between pumpingintervals was 2.4 days. These short "on times" and long idle periods may cause difficultiesduring periods of freezing conditions and will add greater expense to operator costs. SchemeB on the other hand is a constant flow reactor. This type of reactor could conceivablyoperate unattended for extended periods of time requiring only additions of bulk chemicaland removal of accumulated sludge.
The cost associated with construction and operation of the two control schemes aresubstantially different. Scheme A requires a very large clarifier with a construction cost of$ 2,160,000. Based on the MOE survey of municipal wastewater treatment systems, only15 of the 235 facilities with sedimentation processes have clarifiers that would equal orexceed this installation. Scheme B on the other hand would cost approximately 1/5 the valueof Scheme A ($ 425,000). In terms of cost per kilogram per year of phosphorus removed,Scheme A would cost between $ 66 - $ 174 and Scheme B would cost between $ 21 - $ 47given the differences between design years.
The cost effectiveness of Scheme B would diminish during periods of extended wet weatherpumping and during long periods of dry weather. During wet weather pumping the capacityof the wastewater treatment facility would be exceeded and phosphorus enriched waterwould bypass the facility. During periods of dry weather water recirculation from theexternal drainage canals would be necessary to maintain a constant level of water fortreatment and agricultural purposes. The water supplied from the external drainage canalhas considerably lower levels of total phosphorus and could possibly dilute the wastewaterof the internal drainage canal.
In evaluating both schemes for cost effectiveness and practical implementation, Scheme Bis found to be the best candidate. However, implementation should not proceed with thiscontrol scheme until further work is completed in evaluating the impact of waterrecirculation within the internal drainage canal.
7.1.2.2 DUCKWEED HARVESTING
The "Phosphorus Control By Duckweed Harvest - Holland Marsh Polder Drainage System"(1) study was undertaken to assess the potential of a biological phosphorus extractionprogram. Duckweed is highly efficient in the uptake of nutrients and can accumulate andstore large amounts in its tissues.
-98-

This study was conducted for the LSEMS by Limnos Ltd., during the summer of 1983. Threedesign alternatives were investigated to harvest duckweed at the Bradford Pumping stationThe three design alternatives were:
1. To modify the existing conveyer system at the Bradford Pumping station with apositive feed, a more efficient conveyer fabric and a submersible pump to assist ingathering duckweed.
2. To modify the conveyer fabric on a conventional aquatic plant harvester to increaseits efficiency in harvesting duckweed, and to use the existing conveyer system withminor alterations for off-loading the harvester.
3. To combine the features of Alternatives 1 and 2.
An accurate estimate of the potential removal of duckweed from the internal drainage canalwas not possible. The summer of 1983 was very dry and virtually no pumping at theBradford Pumping Station was required. Therefore, little biomass was removed by theconveyor system at the Bradford Pumping Station. The amount collected in 1982, however,was much larger, indicating that an efficient harvesting system could be achieved.
The standing crop biomass measured during the months of August, September and Octoberof 1983 indicated a total of 16.9 tonnes of dry matter. If an equivalent amount was presentduring June and July, a total standing crop biomass would have been 28.2 tonnes. At aphosphorus concentration of 1%, the phosphorus bound in the plants, and hence thepotential removal, would have been 282 kg.
The thick duckweed mat standing in water at warm summer temperature will be undergoinga continual process of regeneration and decomposition. The total potential removal in thelower third of the river is undoubtedly many times the standing crop figure (282 Kg ofPhosphorus). A value of two to four times the standing crop would appear to be realistic,suggesting a potential harvest of 50 to 100 tonnes dry matter yielding 500 to 1,000 kg ofphosphorus.
The following is a cost estimate for the three design alternatives based on a harvest of 50tonnes of duckweed for a yield of 500 kg of phosphorus.
Design Alternative #1
Harvest by means of a push-boat and a self-loading conveyer
Equipment Cost $ 8,500Operating Cost $ 7.700 Total Cost $16,200
-99-

Design Alternative #2
Modified aquatic plant harvester, off-loading to existing conveyer system.
Equipment Cost $ 3,000Operating Cost $15,100Total Cost $18,100
Design Alternative #3
Develop self-feed conveyer - use harvester for harvesting and/or push-boat.
Equipment Cost $ 8,500Operating Cost $11,800Total Cost $20,300
It is also recommended that an amount of $3,000 be added to the program in the initial yearto provide for complete recording of harvested wet weight and analysis of dry weight, tissuephosphorus and nitrogen in order that removal can be quantified. This information togetherwith recommendations for improvements in methodology to be used in future controlprograms would be reported upon completion of the harvesting season.
7.1.3 PHOSPHORUS REMOVAL THROUGH CULTIVATED MUCK SOILS
The "Holland Marsh Polder - Phosphorous Movement Through Cultivated Muck Soils" (2) wasundertaken to provide information required to predict the fate of fertilizer phosphorus withinthe organic soils of the Holland Marsh polder and to indicate the potential release ofphosphorus already present in the soil. This information is to be used as the basis forimplementing management strategies which could reduce the amount of phosphorusdischarged from cultivated marsh lands.
To provide the above information, soil cores from selected soil series within the HollandMarsh polder were collected, leached and analysed. Soil core leaching tests were conductedcontinuously for 6 months by dripping approximately 180 ml of phosphorus free water oneach column of soil. The amount of leachate collected after each three day period wasmeasured and analysed. During the fifth month a simulated addition of phosphorus fertilizerwas added to designated columns at two rates of applications (50 and 100 kg of P/ha). Asmall amount of KCl was also added as a tracer to indicate the leaching pattern of anon-reactive ion. At the end of the 6 month period soil cores were sectioned and analysedfor various chemical and physical properties (2).
-100-
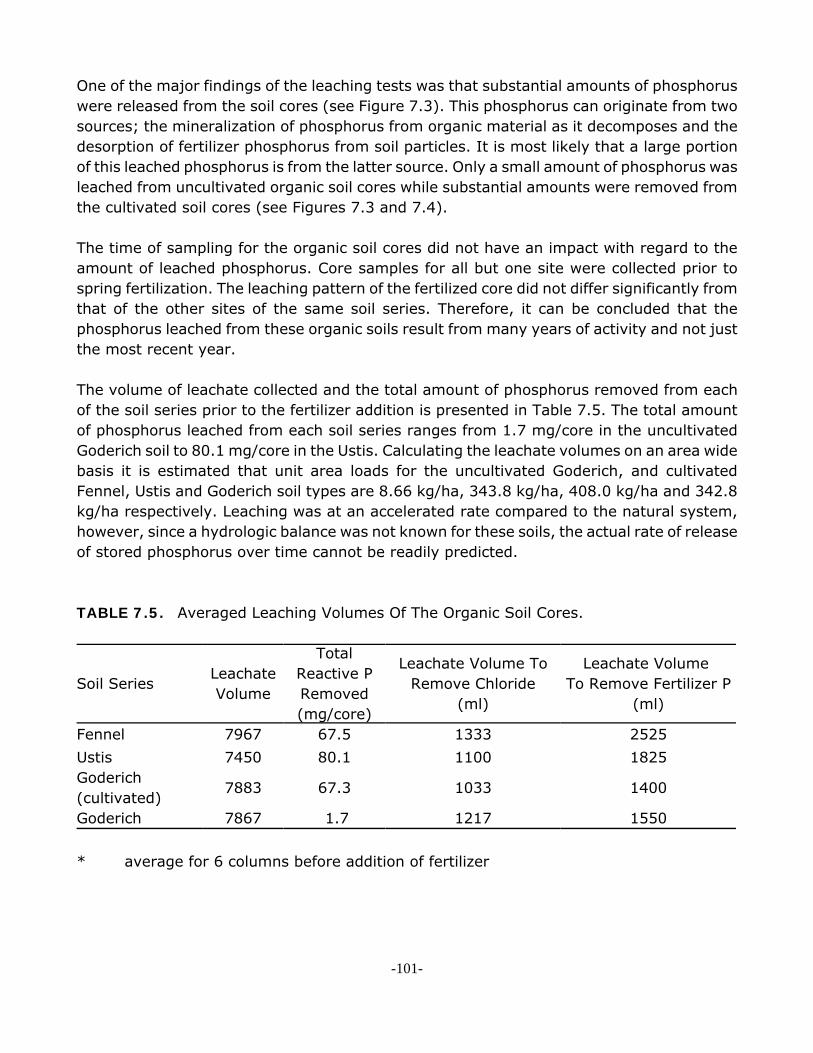
One of the major findings of the leaching tests was that substantial amounts of phosphoruswere released from the soil cores (see Figure 7.3). This phosphorus can originate from twosources; the mineralization of phosphorus from organic material as it decomposes and thedesorption of fertilizer phosphorus from soil particles. It is most likely that a large portionof this leached phosphorus is from the latter source. Only a small amount of phosphorus wasleached from uncultivated organic soil cores while substantial amounts were removed fromthe cultivated soil cores (see Figures 7.3 and 7.4).
The time of sampling for the organic soil cores did not have an impact with regard to theamount of leached phosphorus. Core samples for all but one site were collected prior tospring fertilization. The leaching pattern of the fertilized core did not differ significantly fromthat of the other sites of the same soil series. Therefore, it can be concluded that thephosphorus leached from these organic soils result from many years of activity and not justthe most recent year.
The volume of leachate collected and the total amount of phosphorus removed from eachof the soil series prior to the fertilizer addition is presented in Table 7.5. The total amountof phosphorus leached from each soil series ranges from 1.7 mg/core in the uncultivatedGoderich soil to 80.1 mg/core in the Ustis. Calculating the leachate volumes on an area widebasis it is estimated that unit area loads for the uncultivated Goderich, and cultivatedFennel, Ustis and Goderich soil types are 8.66 kg/ha, 343.8 kg/ha, 408.0 kg/ha and 342.8kg/ha respectively. Leaching was at an accelerated rate compared to the natural system,however, since a hydrologic balance was not known for these soils, the actual rate of releaseof stored phosphorus over time cannot be readily predicted.
TABLE 7.5. Averaged Leaching Volumes Of The Organic Soil Cores.
Soil SeriesLeachateVolume
TotalReactive PRemoved(mg/core)
Leachate Volume ToRemove Chloride
(ml)
Leachate Volume To Remove Fertilizer P
(ml)
Fennel 7967 67.5 1333 2525Ustis 7450 80.1 1100 1825Goderich(cultivated)
7883 67.3 1033 1400
Goderich 7867 1.7 1217 1550
* average for 6 columns before addition of fertilizer
-101-
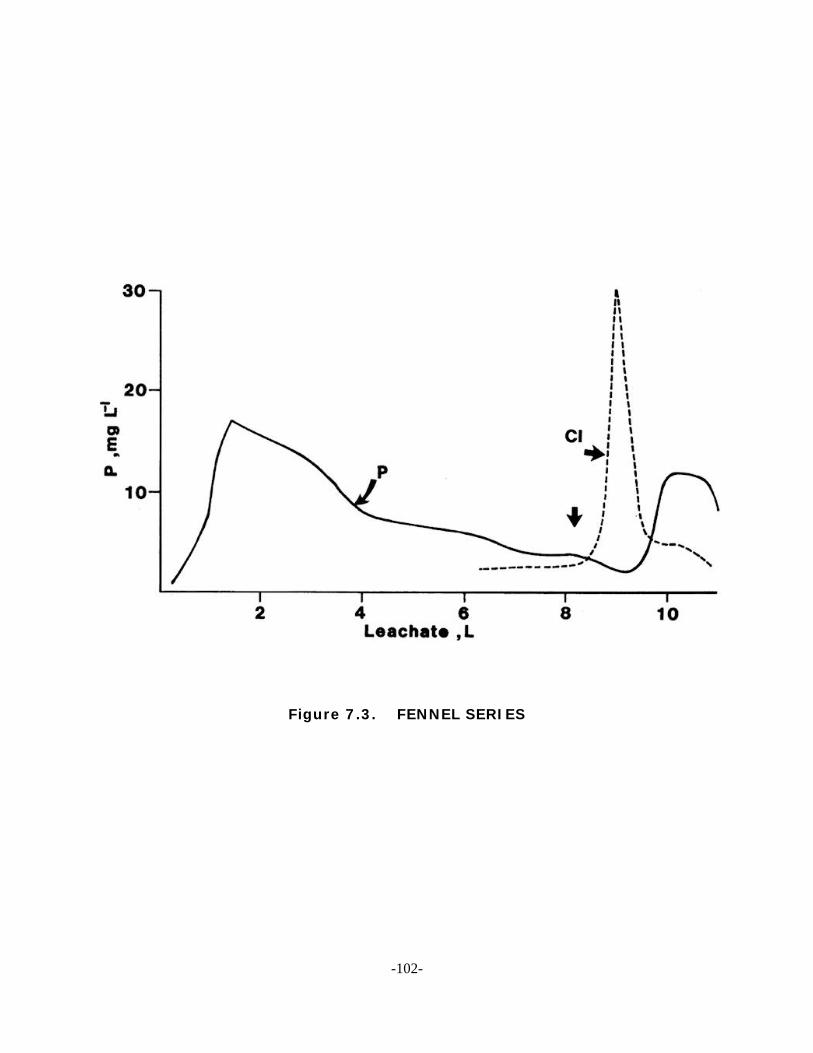
Figure 7.3. FENNEL SERIES
-102-

Figure 7.4. USTIS SERIES
-103-

Figure 7.5. GODERICH SERIES
-104-

Figure 7.6. GODERICH UNCULTIVATED
-105-

The consistency of the leaching patterns (see Figures 7.3, 7.4, 7.5 and 7.6) and similarityin the total amount of phosphorus leached from the three cultivated soils indicates that thesoil type is not a major factor in determining the behaviour of phosphorus in organic soils.The difference between the uncultivated and cultivated Goderich soils clearly shows that pastagronomic practices have left a major reserve of phosphorus in the cultivated soils.
The addition of phosphorus fertilizer and the non-reactive chloride tracer to the core sampleshighlighted the interactions of phosphorus with the organic soil (see Figures 7.3, 7.4, 7.5and 7.6). The difference of several hundred millilitres of leachate between the removal ofchloride and phosphorus reflects the interaction of phosphorus with the soil (see Table 7.5).This lag observed illustrates the point discussed above, that phosphorus which appears inleachate during a given season has mainly originated from fertilizer additions from previousyears.
The phosphorus analysis of the individual cores revealed that a large accumulation ofphosphorus is present near the surface of the cultivated organic soils (see Figure 7.7). Thisaccumulation is attributed to the annual application of phosphorus fertilizer.
The data obtained by the soil core leaching tests suggest a number of implications withregard to the water quality of the Holland Marsh polder. It is evident from the leaching teststhat phosphorus has accumulated in the organic soils and that this phosphorus can beleached out of the soil. This result indicates a potential water quality problem, however theactual problem cannot readily be evaluated. To estimate the actual annual leaching ofphosphorus from the polder a hydrologic balance is necessary.
It is expected that with subsidence the delay of the leaching process will be shortened sincethe tile drainage network will be closer to the large accumulation of phosphorus in the toplayer. Eventually this accumulation may reside directly above the tile drains and the qualityof drainage waters will continue to degrade.
7.1.4 PHOSPHORUS FERTILIZER STUDY
The Phosphorus Fertilizer Study was conducted to establish past and current annualphosphorus loadings from fertilizers to the soils of the Holland Marsh polder. This task wasaccomplished by statistically analyzing all available soil data, reviewing completed studiesand interviewing various personnel from the Muck Research Station within the Holland Marshpolder (6).
-106-

Figure 7.7. The Vertical Distribution of Phosphorus in a Goderich Soil. (Terric Mesisol).
-107-

The soil data consisted of soil samples analysed by the University of Guelph and thenreported to the Muck Research Station. These results were screened by staff to include onlythe samples from the Holland Marsh polder. The samples were gathered in the late fall toearly spring period so the growers would be able to apply the recommendations from thesoil analysis for the next growing season. All soil data was received through Matt Valk, theSenior Muck Crop Specialist, at the Muck Research Station (6).
The data abstracted from the soil test reports included the amount of available phosphoruswithin the top layer of the soil, the number of samples taken per field and the size of thefield.
For those reports that did not include field size, measurements were made from a map ofthe Holland Marsh polder. Six years of data were gathered for the period of 1977 - 1983.
Figure 7.8 relates the various survey years to the percentage of acres that exceed 60 partsper million (ppm) of available phosphorus. A 60 ppm phosphorus level is considered to bean excessive amount present in an organic soil. Figure 7.8 indicates that there is a slightincrease in the number of fields that have excess of 60 ppm over the six year period. Inaddition an average of 68 percent of the fields for the six year period exceed the 60 ppmlevel. The recommended amount of phosphorus to be applied during the next growingseason for these fields is 0 kg/ha. This recommendation is included in those made by theOntario Soil Management Research Committee and presented in Table 7.6.
To determine the annual phosphorus to the soil load for past and present years throughfertilizing is a difficult task. This difficulty is associated with the lack of data and changes insoil testing procedures for phosphorus. However, an estimate of the present annualphosphorus fertilizer inputs to the soils of the Holland Marsh polder has been completed byinterviewing the senior muck crop specialist for the agricultural area (6). It was suggestedthe average amount of phosphorus in the form of P2O5 applied to one hectare was 30kilograms. Thus, the total phosphorus loading to the entire polder has been estimated at 32tonnes/year.
To estimate the amount of total phosphorus that has been applied to the marsh soil in thepast is even more difficult. However, there is strong evidence that past practices encouragedlarger applications of phosphorus to the marsh soils. This is supported by recentimprovements in research, education and availability of products for muck soils that haveconsistently advised and allowed for reduced application rates. These advancements include:improvements in the accuracy of soil testing procedures for phosphorus, a betterunderstanding of the mechanics and chemical composition of muck soils, the use of aneffective muck soil demonstration and education program and the availability of specializedfertilizer packaging.
-108-

Figure 7.8. Percentage of Total Acreage Exceeding 60 ppm of Phosphate.
-109-

The testing procedure for determining the amount of available phosphorus in organic soilshas dramatically changed in the past thirty years. Originally, soil testing was conducted onsite and had three measurement levels (low, medium and high). This enabled only threeapplication rates to be defined. Phosphorus levels are now analysed in a laboratory and aremeasured to an accuracy of one part per million (ppm). This level of accuracy has enabledthe development of a better defined application rate schedule. Table 7.6 presents thisschedule. With the correct use of this schedule the probability of an incorrect application rateis substantially decreased.
TABLE 7.6. Phosphorus Requirements For Vegetables On Organic Soils.
Soil Phosphorus (using 0.5 N sodiumbicarbonate test)
cabbage*, cauliflower, broccoli, brusselssprouts, potatoes, celerycarrots, parsniponions**, garlic,lettuce, spinach,radishes, beets.
ppm P in soil Phosphate (P2O5) required - kg/ha0-3 100 Low 120 Low4-5 100 Low 120 Low6-7 100 Low 120 Low8-9 100 Low 120 Low10-12 90 Medium 120 Low13-15 90 Medium 110 Medium16-20 80 Medium 100 Medium21-25 70 Medium 90 Medium26-30 60 Medium 80 Medium31-40 50 High 70 High41-50 30 High 50 High51-60 20* Very High 40* Very High61-80 0 Very High 0 Very High80+ 0 Excessive 0 Excessive
* If no insecticide is used in the planting water, use a starter solution high in nitrogensuch as 20-20-20 at 1 kg/ 200 L and apply 0.2 to 0.3 L/plant. Under hightemperatures use ½ the fertilizer concentration.
** If maturity of onions is a problem on organic soils less than 40 cm deep, additionalphosphate may be required. The fertilizer rates in this table are designed to producehighest economic yields when accompanied by good or above average management.
-110-

Agricultural schools and various government agencies have in the past and still do strive forimproved and economical crop yields. These organizations have either conducted orsponsored studies on organic soils to improve farming cost effectiveness. One of the resultsof these studies is the recommended reduced application of phosphorus to organic soils. Infact, prior to 1982 a maintenance level of phosphorus was applied to all marsh soils whetherthe phosphorus concentration level was high or not. The present revised phosphorusrequirements for organic soils are present in Table 7.6.
In the past, fertilizer companies packaged fertilizer in a limited number of combinations andphosphorus was limited to three or four application rates. Now, however, most fertilizercompanies market fertilizer mixed to the exact proportions specified by the grower. If thegrowers are unsure of the required fertilizer mixture, they can bring in their soil test analysisto the fertilizer specialist to design and supply the appropriate mixture.
To further educate the growers with organic soils, the Ministry of Agriculture and Food hasestablished the Muck Research Station. This service provides not only research but is alsoa source of information for the local growers. Growers can inquire on up-to-date growingand fertilizer practices, and actually see these practices in use. On-going demonstrationprojects are conducted at the Muck Research Station. At the present time, yield tests oncrops with reduced applications of phosphorus are being performed at the Muck ResearchCentre.
7.2 CONTROL ALTERNATIVES FOR BUILT-UP AREAS
Previous studies in the Lake Simcoe drainage basin have already led to the implementationof more stringent regulations and controls on sewage effluent discharges. These regulationsand controls have lead to a 0.3 mg/L effluent quality discharge on all newly constructedfacilities and the diversion of sewage from Newmarket and Aurora. In addition, upgradingand renovations at Orillia are complete while construction on the Barrie plant will becomplete in 1986.
Moreover, urban stormwater drainage represents another source of phosphorus in built-upareas. If this source is left unchecked and urban expansion proceeds as rapidly as previouslyprojected, this source will increase in significance. To reduce this increase in the contributionof phosphorus, practical stormwater management techniques need to be implemented.
Practical stormwater management techniques have been documented and implemented bymany public and private agencies and universities. The general emphasis of thesetechniques stress the importance of retention, detention and infiltration processes toimprove water quality and reduce water quantity. The most commonly accepted techniquesinclude:
-111-

- detention and retention ponds- park storage- disconnection of roof leaders from the storm sewer network- grassed swales- parking lot storage- roof top storage - cisterns- super pipes- soak-away pits- seepage trenches
However, the implementation of many of the above techniques on fully urbanized areascould be cost prohibitive or impractical. Thus, it is recommended that only cost effective, sitespecific remedial measures be implemented on presently developed areas.
On areas where urbanization is proposed it is recommended that the "Urban DrainageManagement Program" (7) developed by the Province of Ontario be implemented. Theseguidelines outline practical stormwater management techniques for both water quantity andquality discharges from urban areas during and after construction.
It is also recommended that test catchment areas be monitored for water quantity andquality to ensure that the stormwater management techniques are successful.
COTTAGES
New cottage developments are subject to an approval process governing the installation ofsewage treatment facilities such as field tile beds. In the Lake Simcoe drainage basin,approvals are based on the adherence to standard design guidelines.
In certain high density cottage developments central sanitary sewage treatment services arebeing introduced. This is occurring in both the Keswick and Innisfil areas. By the end of1985, the Keswick system should be operational and construction of the Innisfil plant willhave started.
SOIL EROSION
The USLE is commonly used as a method for identifying soil loss from rural areas.Phosphorus, the target nutrient of the LSEMS studies, is transported in the dissolved formor attached to particles of the eroding soil. Dissolved or particulate phosphorus cannot bequantified by the USLE. However, particulate phosphorus can be linked to potential soil loss.
Farming practices that reduce the velocity of runoff water also reduce its capacity totransport eroded soil particles. Several remedial practices which can be implemented to
-112-

achieve this include;
- cross-slope tillage,- cross-slope tillage with strips, - contour farming,- contour farming with strips, and- changing continuous corn/beans to a corn/bean rotation system. - chisel tillage
All of the above practices have been found to reduce soil erosion effectively (8).
To implement a cost-effective program to reduce soil loss and phosphorus from rural lands,targeting of available resources is necessary. To illustrate the effect of targeting bestmanagement practices, the following analysis is presented. Potential soil erosion on areasidentified as high erosion areas from the map study (Section 3.8.1.2) were re-evaluatedusing the USLE for various C and P factors that would reduce soil loss. These modificationswould represent changes made to present tillage and cropping practices.
The effects of the various practices upon continuous row crop systems, corn/bean rotationsystems, grain systems, and mixed systems are shown in Table 7.7.
-113-
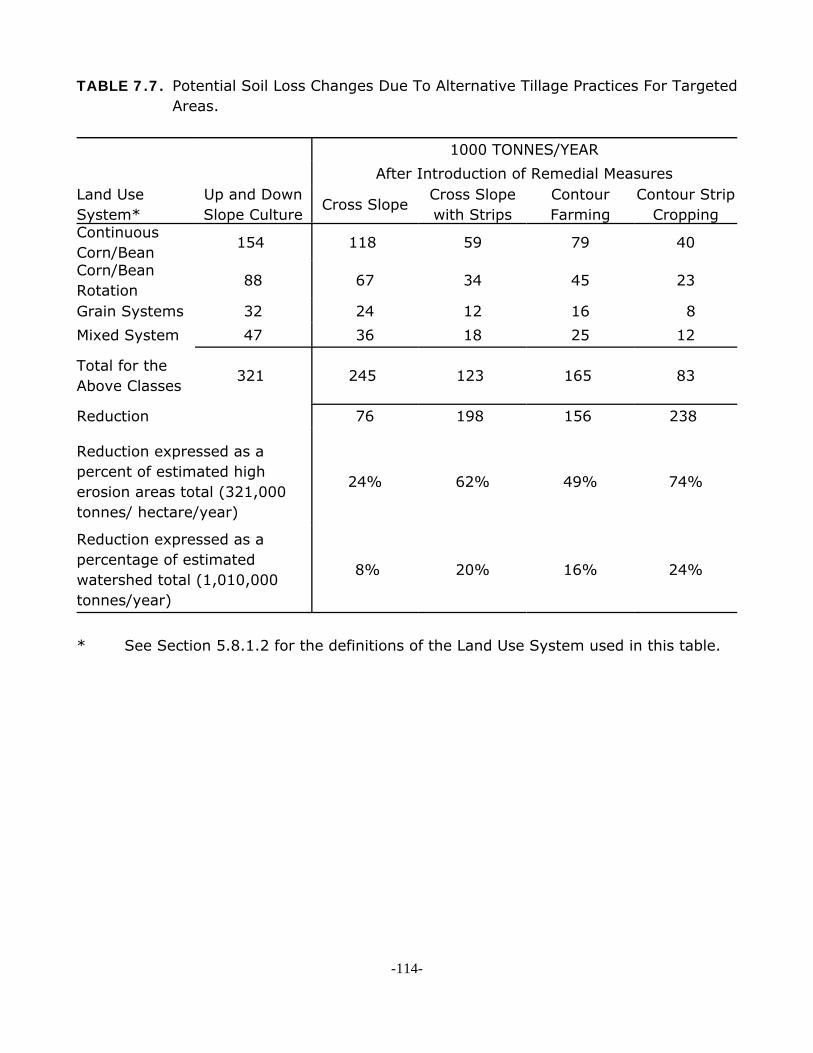
TABLE 7.7. Potential Soil Loss Changes Due To Alternative Tillage Practices For TargetedAreas.
1000 TONNES/YEARAfter Introduction of Remedial Measures
Land UseSystem*
Up and DownSlope Culture
Cross SlopeCross Slopewith Strips
ContourFarming
Contour StripCropping
ContinuousCorn/Bean
154 118 59 79 40
Corn/BeanRotation
88 67 34 45 23
Grain Systems 32 24 12 16 8Mixed System 47 36 18 25 12
Total for theAbove Classes
321 245 123 165 83
Reduction 76 198 156 238
Reduction expressed as apercent of estimated higherosion areas total (321,000tonnes/ hectare/year)
24% 62% 49% 74%
Reduction expressed as apercentage of estimatedwatershed total (1,010,000tonnes/year)
8% 20% 16% 24%
* See Section 5.8.1.2 for the definitions of the Land Use System used in this table.
-114-

According to Table 7.7, the most effective erosion reduction practice among those examinedappears to be contour strip cropping. On the highly eroding land with continuous crops, areduction of approximately 114,000 tonnes/year of gross erosion results. Similarly, oncorn/bean rotation systems approximately 65,000 tonnes/year of erosion could be reduced.The reduction of erosion on these four land uses (covering approximately 170 sq. km of thetotal 2,841) represents a 24 percent reduction of the potential 1 million tonnes/yearestimated for the entire drainage basin or a 74% reduction of the potential high erosionareas.
Cross slope farming with strips is nearly as effective as contour strip farming. The reductionof erosion on approximately 170 sq. km of fields with these four land uses represents a 20percent reduction of erosion for the entire watershed.
Of the remaining support practices, application of contour farming and cross slope farmingreduce erosion by 16 and 8 percent respectively.
To determine the effect of changing from a continuous monoculture system to a croprotation system, potential soil erosion estimates for fields under monoculture werere-calculated using a Cover and Management (C) factor appropriate for the rotation system.The erosion estimates in Table 4.8 indicate that changing cropping practices on the 170 sq.km can result in an 7 percent reduction of the total potential erosion for the entirewatershed. This is approximately equal to the reduction attainable through the applicationof cross slope farming (without grass strips).
The combined effect of switching from a continuous cropping system to a rotational systemand the various tillage practices has also been considered. The results of this switch areshown in Table 7.8. Comparison of the figures in Tables 7.7 and 7.8 indicate that with eachtillage alternative there is an increase in the erosion reduction attainable. This reductionranges from 2% of the estimated total basin soil loss with contour strip tillage to 5% of theestimated total basin soil loss with cross slope tillage. Again, the most effective erosionreduction support practice is contour strip cropping. The maximum reduction obtainable is26%.
-115-
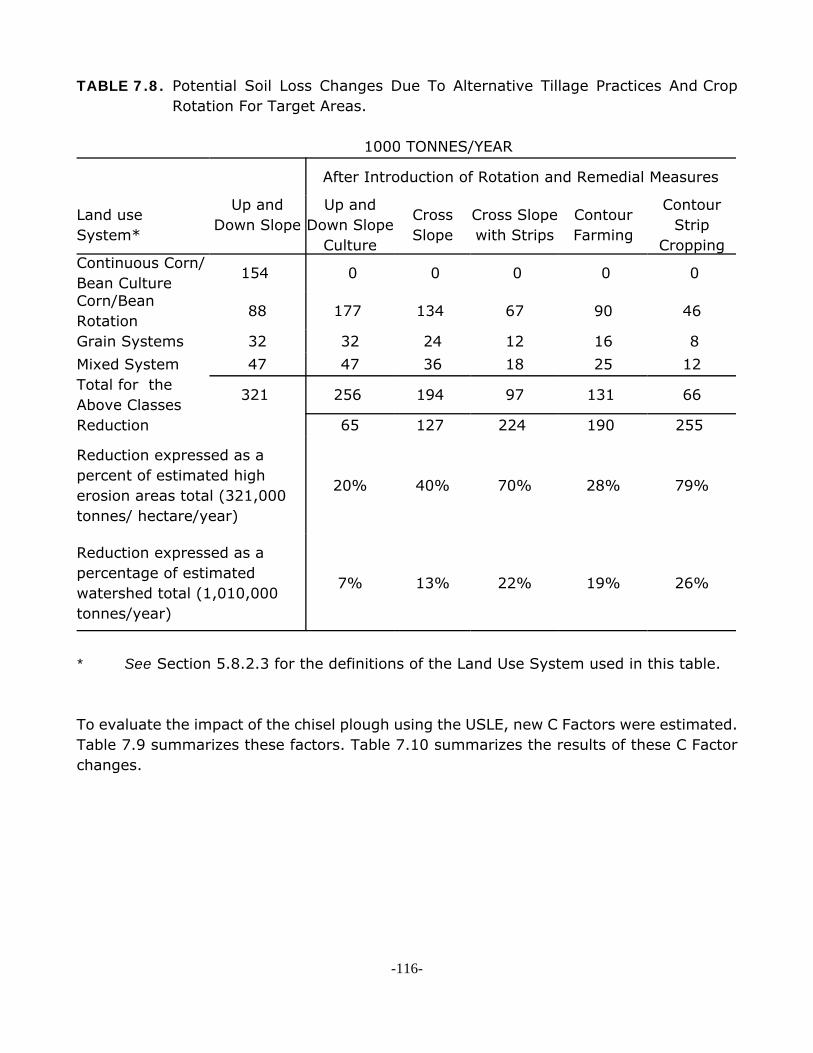
TABLE 7.8. Potential Soil Loss Changes Due To Alternative Tillage Practices And CropRotation For Target Areas.
1000 TONNES/YEAR
After Introduction of Rotation and Remedial Measures
Land useSystem*
Up andDown Slope
Up andDown Slope
Culture
CrossSlope
Cross Slopewith Strips
ContourFarming
ContourStrip
CroppingContinuous Corn/Bean Culture
154 0 0 0 0 0
Corn/BeanRotation
88 177 134 67 90 46
Grain Systems 32 32 24 12 16 8Mixed System 47 47 36 18 25 12Total for theAbove Classes
321 256 194 97 131 66
Reduction 65 127 224 190 255
Reduction expressed as apercent of estimated higherosion areas total (321,000tonnes/ hectare/year)
20% 40% 70% 28% 79%
Reduction expressed as apercentage of estimatedwatershed total (1,010,000tonnes/year)
7% 13% 22% 19% 26%
* See Section 5.8.2.3 for the definitions of the Land Use System used in this table.
To evaluate the impact of the chisel plough using the USLE, new C Factors were estimated.Table 7.9 summarizes these factors. Table 7.10 summarizes the results of these C Factorchanges.
-116-
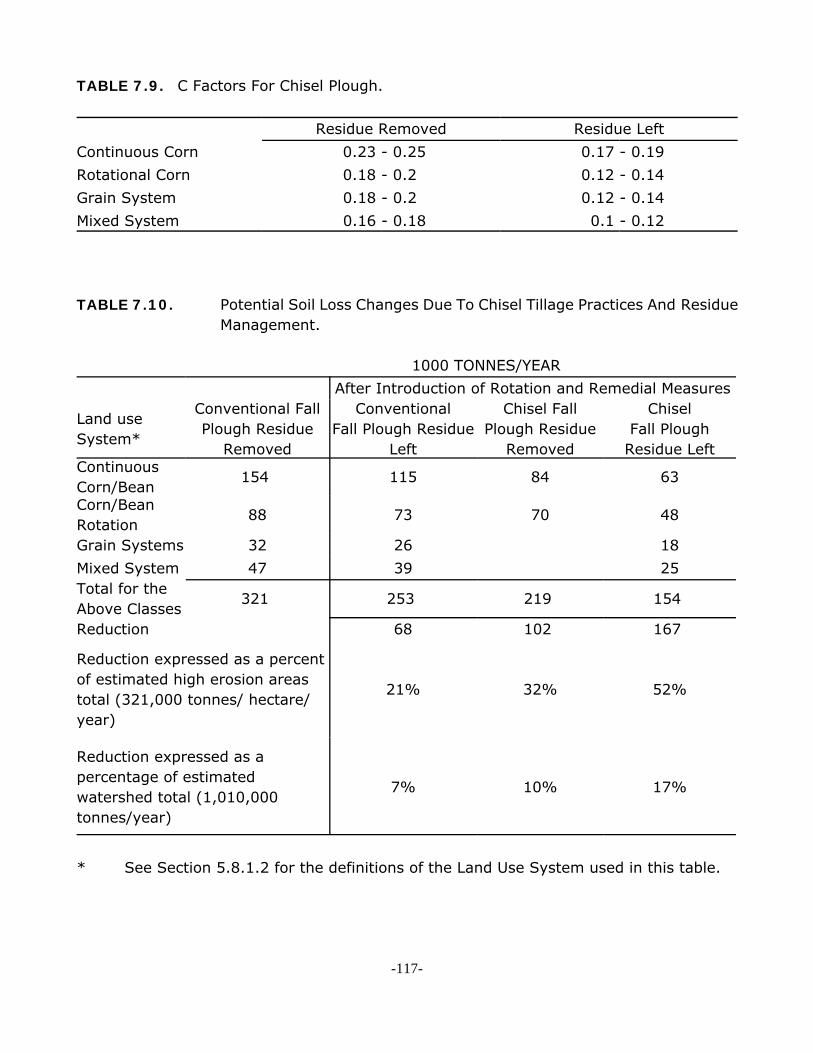
TABLE 7.9. C Factors For Chisel Plough.
Residue Removed Residue LeftContinuous Corn 0.23 - 0.25 0.17 - 0.19Rotational Corn 0.18 - 0.2 0.12 - 0.14Grain System 0.18 - 0.2 0.12 - 0.14Mixed System 0.16 - 0.18 0.1 - 0.12
TABLE 7.10. Potential Soil Loss Changes Due To Chisel Tillage Practices And ResidueManagement.
1000 TONNES/YEARAfter Introduction of Rotation and Remedial Measures
Land useSystem*
Conventional FallPlough Residue
Removed
ConventionalFall Plough Residue
Left
Chisel FallPlough Residue
Removed
ChiselFall Plough
Residue LeftContinuousCorn/Bean
154 115 84 63
Corn/BeanRotation
88 73 70 48
Grain Systems 32 26 18Mixed System 47 39 25Total for theAbove Classes
321 253 219 154
Reduction 68 102 167
Reduction expressed as a percentof estimated high erosion areastotal (321,000 tonnes/ hectare/year)
21% 32% 52%
Reduction expressed as apercentage of estimatedwatershed total (1,010,000tonnes/year)
7% 10% 17%
* See Section 5.8.1.2 for the definitions of the Land Use System used in this table.
-117-

According to data presented in Table 7.10, the most effective tillage practice examinedappears to be chisel ploughing with residue left on surface. On the highly eroding land withcontinuous crops, a reduction of approximately 91,000 tonnes/year of gross potentialerosion results. Similarly, on rotation systems approximately 40,000 tonnes/year of erosioncould be reduced. The reduction of erosion on these four land uses (covering approximately170 sq. km of the total 2,841) represents a 17 percent reduction of the potential 1 milliontonnes/year estimated for the entire drainage basin or a 52% reduction of the potential higherosion areas.
Chisel ploughing removing residue and conventional tillage leaving residue remain onsurface reduces potential erosion by 10 and 7 percent for the entire drainage basin.
The above tillage practices for reducing soil erosion are not the only practices available.Various engineering structures and other tillage practices, such as conservation tillage, canbe incorporated in to the overall farm plan to reduce soil loss.
However, the main purpose of this study was to determine if and where four (4) tonnes oftotal phosphorus could be removed from agricultural sources. As indicated earlier this taskhas been made difficult due to a variety of instream processes that occur with regard tophosphorus. Thus to determine how four tonnes of phosphorus could be prevented fromentering the lake a simple empirical model was developed.
The model examined the three sub-basins where predominately rural land soil loss was themajor contributor of phosphorus. A relationship was derived between potential soil loss andtotal phosphorus assuming that all phosphorus delivered was from soil loss. This relationshipwas that 100,000 tonnes of potential soil loss contributed 2.1 tonnes of total phosphorus toLake Simcoe. Therefore, if chisel ploughing was implemented in the high erosion areas (170sq.km.) between 2.1 and 3.6 tonnes of total phosphorus could be prevented from enteringLake Simcoe depending on the residue management practice used. This is in addition to the0.5 to 1.0 tonnes that could be removed by duckweed harvesting (Section 7.1.2.2).
7.5 STREAMBANK EROSION
To implement an effective streambank erosion control program in order to reducephosphorus loads and prevent other damages the first step is to identify and evaluate all ofthe erosion problem areas in the entire drainage basin. Identification of such problem areasrequires a complete streambank survey that documents the extent, type and location of theproblem areas. Such a survey is necessary to evaluate the measures required to preventfurther erosion and expected benefits from their implementation. A complete and accurateinventory will enable effective scheduling of individual control measures for each of thestreambank erosion problem areas.
-118-

7.5.1 RATING SYSTEM FOR THE EVALUATION OF SEVERITY OF STREAMBANKEROSION
For the purposes of problem site comparison and prioritization of remedial measures eachproblem site identified in the study had to be objectively evaluated and assigned a problemseverity rating. In the Streambank Erosion Inventories compiled, this was accomplishedthrough the use of numerical values. These numerical values correspond to the problemseverity as follows:
1. a minor but contributing erosion problem,
2. a moderate erosion problem,
3. an extensive erosion problem,
4. a major erosion problem,
5. a severe erosion problem.
7.5.2 STREAMBANK EROSION INVENTORIES
To date, the Authority has completed 6 separate streambank erosion inventories (9, 10, 11,12, 13, 14) that incorporate the numerical erosion problem severity rating. A total of 470erosion problem sites have been catalogued in these reports. Also, information on 42 otherproblem streambank erosion sites is contained in other erosion studies (17, 18, 19).
Under the LSEMS studies program, additional streambank erosion inventories werecompleted. The areas studied for the streambank erosion inventories (15,16) includedtributaries within the Holland, North West, and Talbot sub-basins (see Figure 2.2). Theircompletion expanded a data base that was used to determine the extent and control of thephosphorus contribution from streambank erosion. These inventories are similar in mostrespects to those compiled by the Authority. A total of 412 erosion problem sites have beencatalogued in this study. It should be noted that for all studies the same site evaluationmethodology was used.
In all of the streambank erosion inventory studies, a total of 882 problem sites arecatalogued. Four of the 20 streams investigated accounted for over 50% of the total. Thesestreams are:
1. the Holland (Schomberg) River, headwaters to Holland Marsh Canal,
2. the Beaverton River,
-119-

3. the North Schomberg River, and
4. the Black River.
Thirty percent (265) of the 882 sites are considered to rank as either an extensive, Majoror severe erosion problem. Approximately 49$ (129) of these 265 sites are located on thefour streams listed above. Table 7.11 presents a summary of the distribution of erosionproblem sites in the Lake Simcoe drainage basin.
7.5.3 PROPOSED REMEDIAL MEASURES AND POSSIBLE PHOSPHORUSREDUCTIONS
Measures to reduce or eliminate the erosion problems are suggested for each site in thestreambank erosion inventories and for some sites in the other studies. Selecting the correctcontrol measure for a problem site requires a detailed individual site investigation todetermine the actual problems and their causes. The impact of application of any remedialmeasure on the local fishery should also be assessed. It should also be noted that themajority of the erosion problem sites are situated on private land. In this case,implementation can only proceed with the acceptance and co-operation of the landowner(s).
The phosphorus contribution from streambank erosion was quantified in Section 5.7. It wasreported earlier that the contribution for the Canadian portion of the Great Lake range from2 - 32% (20,21). In addition, given the number of streambank sites that were documented,this would indicate that the contribution from streambank erosion for the Lake Simcoedrainage basin is significant.
By stabilizing streambanks, restricting cattle access, and widening buffer strips are unlikelyto be 100 percent effective in eliminating the sediment load due to streambank erosion.However, by providing the above type of protection could reduce sediment and phosphorusloads from other sources such as livestock manure runoff and field erosion. In fact thestreambank buffer strip is the last line of defense to the rural land receiving waters.
7.5.4 PRELIMINARY ESTIMATE OF COSTS
A range of costs of implementing the remedial measures suggested in the various reportshas been determined based on a subjective evaluation of the information contained in thereports and information on the costs and design specifications of recent streambankimprovement projects. (22, 23).
-120-
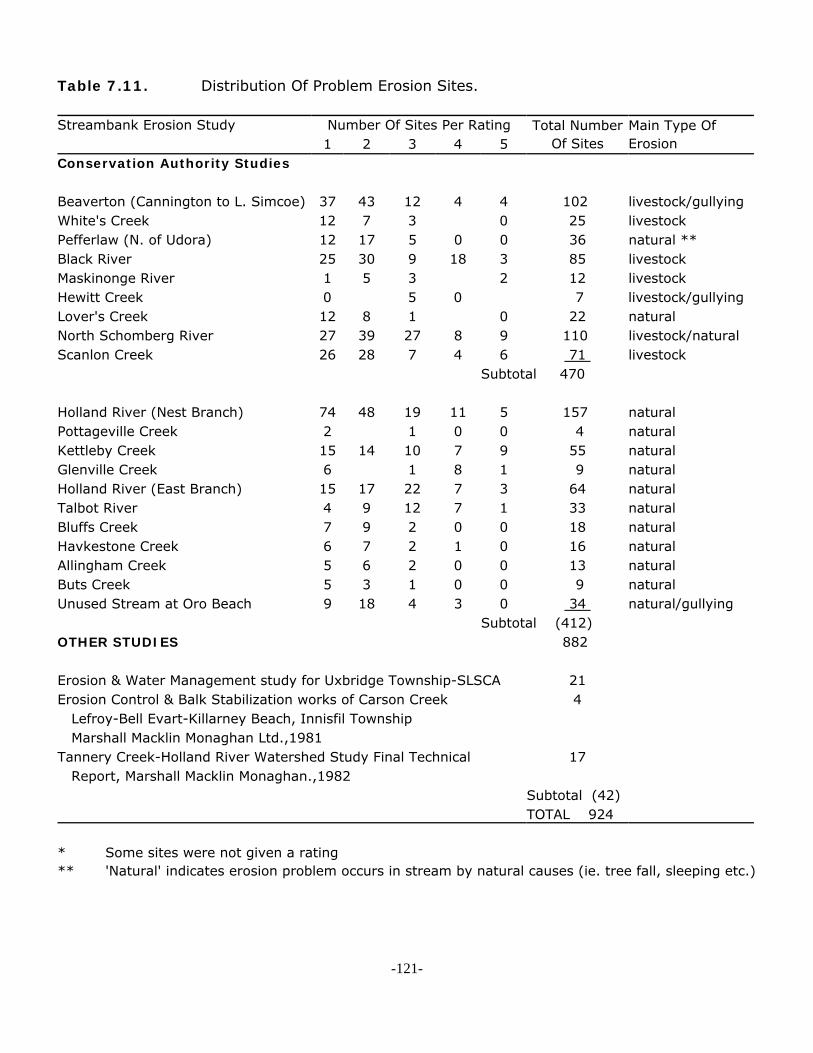
Table 7.11. Distribution Of Problem Erosion Sites.
Streambank Erosion Study Number Of Sites Per Rating Total NumberOf Sites
Main Type OfErosion1 2 3 4 5
Conservation Authority Studies
Beaverton (Cannington to L. Simcoe) 37 43 12 4 4 102 livestock/gullyingWhite's Creek 12 7 3 0 25 livestockPefferlaw (N. of Udora) 12 17 5 0 0 36 natural **Black River 25 30 9 18 3 85 livestockMaskinonge River 1 5 3 2 12 livestockHewitt Creek 0 5 0 7 livestock/gullyingLover's Creek 12 8 1 0 22 naturalNorth Schomberg River 27 39 27 8 9 110 livestock/naturalScanlon Creek 26 28 7 4 6 71 livestock
Subtotal 470
Holland River (Nest Branch) 74 48 19 11 5 157 naturalPottageville Creek 2 1 0 0 4 naturalKettleby Creek 15 14 10 7 9 55 naturalGlenville Creek 6 1 8 1 9 naturalHolland River (East Branch) 15 17 22 7 3 64 naturalTalbot River 4 9 12 7 1 33 naturalBluffs Creek 7 9 2 0 0 18 naturalHavkestone Creek 6 7 2 1 0 16 naturalAllingham Creek 5 6 2 0 0 13 naturalButs Creek 5 3 1 0 0 9 naturalUnused Stream at Oro Beach 9 18 4 3 0 34 natural/gullying
Subtotal (412)OTHER STUDIES 882
Erosion & Water Management study for Uxbridge Township-SLSCA 21Erosion Control & Balk Stabilization works of Carson Creek 4 Lefroy-Bell Evart-Killarney Beach, Innisfil Township Marshall Macklin Monaghan Ltd.,1981Tannery Creek-Holland River Watershed Study Final Technical 17 Report, Marshall Macklin Monaghan.,1982
Subtotal (42)TOTAL 924
* Some sites were not given a rating** 'Natural' indicates erosion problem occurs in stream by natural causes (ie. tree fall, sleeping etc.)
-121-

The reported costs are for remedial measures on the extensive, major, and severe erosionproblem sites listed in the Streambank Erosion Inventories. An allowance has been madefor the sites noted in the other studies. Since it is likely that correction of the minor andmoderate erosion problem sites will not be a priority and that the reported costs will notreflect the cost of remedial measures for problems of this severity, this estimate does nottake these sites into consideration. Furthermore, the costs in this estimate are based on theassumptions that labour is performed for the minimum wage and that engineering designcosts are not taken into account. Therefore, for the extensive, major, and severe erosionproblem sites catalogued in the various reports, it is estimated that the cost would rangefrom 1.0 to 1.8 million dollars.
7.5.5 DYKE EROSION PROBLEMS
In recent years, streambank erosion and the deterioration of the riverbank cattail marginalong the lower Holland River is threatening the stability of the dykes of the Keswick andColbar Marsh polders. These two vegetable polders represent a total land mass of 10 squarekilometres with much of the enclosed land lying below lake level. Thus the failure of eitherdyke system could result in a significant financial loss and environmental problem.
At present (1985), approximately 400 m of dyke is directly exposed to direct river contact.These dykes are mainly composed of organic soil and clay that was dredged from thesurrounding area. This composition of dyke material is highly susceptible to erosion. Toprotect these exposed areas, wood and sheet metal stabilizing barriers have been placed bythe landowners, but are only temporary measures.
The cattail marshes also utilize nutrients in the aquatic environment and their demise resultsin more through flow of nutrients to Cook Bay. Therefore the loss of the cattail margin couldcontribute to the degradation of the water quality of Lake Simcoe and the possible floodingof various vegetable polders.
Aerial photographs of the Holland River were examined to determine historic changes inriver widths. Of the 10 site locations selected, 5 were of prime concern: the 3 adjacent tothe Keswick Marsh polder and 2 adjacent to the Colbar Marsh polder. All site locations areshown in Figure 4.9.
A significant increase in the width of the channel was observed at each site investigated. Atthe three sites adjacent to the Keswick Marsh polder the widths increased from 60 m to 170m at site #1, from 95 m to 120 m at site #2, and from 174 m to 240 m at site #3. At thetwo sites (#4 and #5) adjacent to the Colbar Marsh polder the widths increased from 48 mto 85 m in both cases. A summary of the changes at all sites is presented in Table 7.12.
-122-

Figure 7.9. Location of Sites for Air Photo Interpretation.
-123-
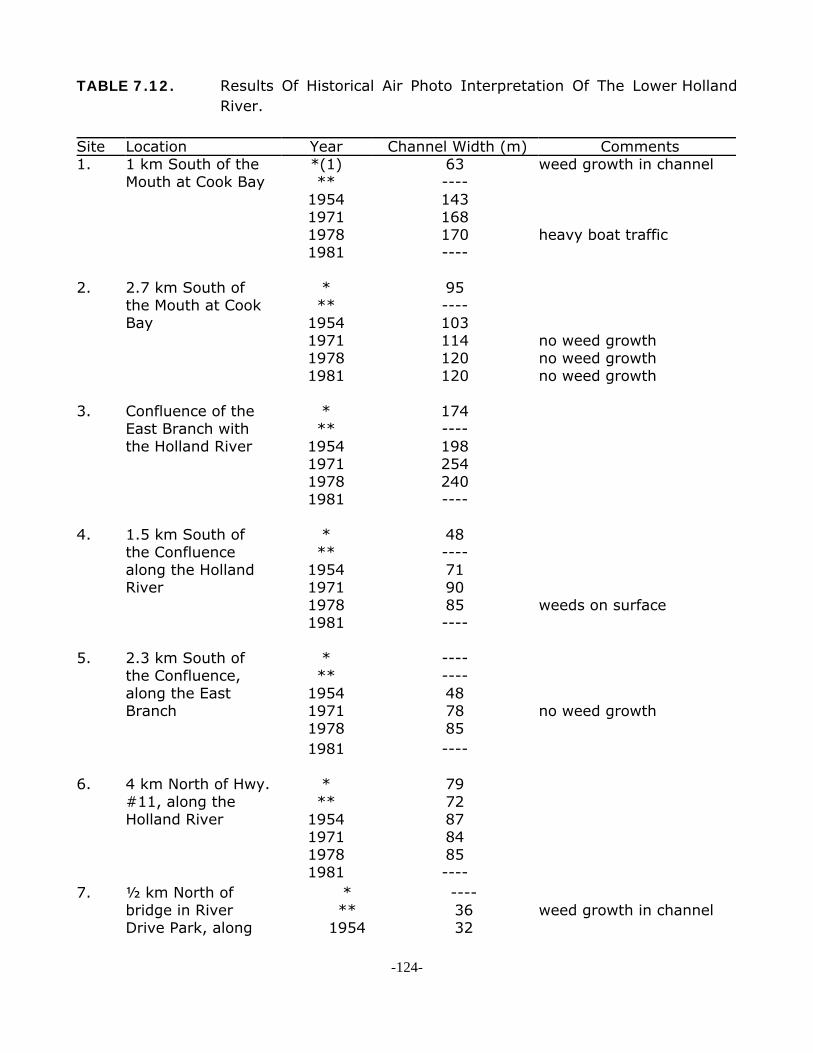
TABLE 7.12. Results Of Historical Air Photo Interpretation Of The Lower HollandRiver.
Site Location Year Channel Width (m) Comments1. 1 km South of the *(1) 63 weed growth in channel
Mouth at Cook Bay ** ----1954 1431971 1681978 170 heavy boat traffic1981 ----
2. 2.7 km South of * 95the Mouth at Cook ** ----Bay 1954 103
1971 114 no weed growth1978 120 no weed growth1981 120 no weed growth
3. Confluence of the * 174East Branch with ** ----the Holland River 1954 198
1971 2541978 2401981 ----
4. 1.5 km South of * 48the Confluence ** ----along the Holland 1954 71River 1971 90
1978 85 weeds on surface1981 ----
5. 2.3 km South of * ----the Confluence, ** ----along the East 1954 48Branch 1971 78 no weed growth
19781981
85----
6. 4 km North of Hwy. * 79#11, along the ** 72Holland River 1954 87
1971 841978 851981 ----
7. ½ km North of * ----bridge in River ** 36 weed growth in channelDrive Park, along 1954 32
-124-

the East Branch 19711978
------
1981 648. 3 km North of Hwy. * 63
#11, along the ** 60Holland River 1954 87
1971 841978 851981 ---
9. 1.5 km North of * 87Hwy. #11, along ** 90 weeds below surfacethe Holland River
1954 103 weeds below surface1971 ---1978 110 heavy weed growth1981 104
10. ¾ km North of * 63Hwy. #11, along ** 72the West Channel 1954 79
1971 ----1978 801981 80
(1) Years unknown - * predates **, ** predates 1954 photos
In the November 1984 report "Holland River Erosion Investigation" (24), the dyke erosionwas attributed to factors of both natural and manmade origin. The report cited theincreasing amount of boat traffic on the river in the late 1970's and 80's as the dominantfactor creating erosion. The report also noted that as river width increased, the fetchincreased providing a greater opportunity for larger surface waves, created by overwaterwind, to erode the river banks and cattail margins.
The maintenance of the cattail buffers along the dykes is critical to the prevention of dykeerosion. It appears that this may be controlled through a program of boat-wake and erosioncontrols. Certainly stabilizing the cattail marsh areas and creating an environment conducivefor cattail marsh re-establishment should be a priority where wave action is now affectingthe stability of the dykes in a number of areas.
Another possibility for reducing the loss of the cattail margin is to prevent the high waterlevels which occur annually in the lower Holland River. During spring runoff the cattailmargins are flooded by approximately 5 - 10 cm due to the high lake levels. This floodingweakens the root system and detachment of large masses of cattails occur. In addition to
-125-

suspended matter, nutrients are also released to the waters which eventually find their wayto Cook Bay.
The lowering of the lake's water levels will also provide an additional flood safety margin tothe vegetable growers that reside along the Holland River and reduce the amount of waterneeded to be pumped out of these polders. With lower lake levels the water surface gradientincreases thereby increasing the river's hydraulic capacity. In addition, the amount of waterseeping through the earth dykes into the polders will be reduced. This seepage reductionbenefits both the vegetable growers by reducing the cost of pumping excess water out oftheir polders, and also the environment since less nutrients are pumped into the riversystem.
At present, the lake level is controlled to a regulating curve by Parks Canada. The maximumcontrol elevation has been set at 219.10 m. At this elevation approximately 5 - 10 cm offlooding occurs into the cattail margins during April and May each year. To reduce thisflooding and the loss of cattails and nutrients, it is recommended that an investigation bemade into the associated feasibility of reducing the maximum lake elevation to 219.00 m.
7.6 LIVESTOCK OPERATIONS
The main purpose of this section is to evaluate effective remedial measures from livestockoperations, however no detailed work was completed for this source. The actualenvironmental impact of the particular livestock operation will depend on many site specificfactors which include:
(1) slope of lot(2) internal drainage (soil type)(3) existence of surface/sub-surface drainage conduits(4) drainage pattern around lot and storage area(5) existence of runoff controls, retention ponds(6) vegetative "buffers" around runoff channels(7) lot surface type(8) animal density on lot(9) seasonal management factors
It is recommended that an evaluation of the animal husbandry factors and other relevantdata determining impact take place. This evaluation would provide information extremelyuseful for prioritizing problem sites and targeting available resources to them.
-126-

Most sources of manure runoff can be effectively controlled through cost-effective manuremanagement systems. Properly utilized in a soil management program, manureeconomically provides a valuable supplement to soil improves soil tilth (tillage), structureand internal drainage.
-127-
REFERENCES
(1) Limnos Limited - 1985. "Phosphorous Control By Duckweed Harvest - Holland MarshPolder Drainage System", Lake Simcoe Environmental Management Strategy,Technical Report Series, Report A5.
(2) Thomas, R. L. and G. Sevean - 1985. "Leaching of Phosphorus From the OrganicSoils of the Holland Marsh", Lake Simcoe Environmental Management Strategy,Unpublished.
(3) K.H. Nicholls - November, 1972. "Nutrient-Phytoplankton Relationships in the HollandMarsh" M.Sc. Thesis, University of Guelph.
(4) Rupke and Associates Limited - September, 1983. "Calibration Summary of TheHolland Marsh Polder Drainage Pumps", Lake Simcoe Environmental ManagementStrategy, Technical Report Series, Technical Report A4.
(5) Frank D., D. Henry, J. Antoszek and F. Engler - 1985. "Lake Simcoe Tributary WaterQuantity and Quality Data Report", Lake Simcoe Environmental ManagementStrategy, Technical Report Series, Technical Report A1.
(6) Valk, M. - August, 1983 Personal Communication.
(7) Province of Ontario - (unreleased draft) 1985. "Urban Drainage ManagementProgram", Toronto.
(8) Wischmeier, W.H., and Smith, D.D. - 1978. "Predicting Rainfall Erosion Losses - AGuide To Conservation Planning", U.S. Department of Agriculture. AgricultureHandbook 537.
(9) South Lake Simcoe Conservation Authority - 1982. "Erosion Inventory of BeavertonRiver, White's Creek, Pefferlaw Brook", South Lake Simcoe Conservation Authority.
(10) South Lake Simcoe Conservation Authority - 1982. "Black River, Maskinonge RiverStreambank Erosion Inventory", South Lake Simcoe Conservation Authority.
(11) Cunningham, D., L. Drescher, L. Philip and F. Raininger 1983. "Hewitt CreekWatershed Streambank Erosion Study", South Lake Simcoe Conservation Authority.
(12) Cunningham, D., L. Drescher, E. Lew, L. Philip and F. Raininger - 1983. "Lover'sCreek Watershed Streambank Erosion Study", South Lake Simcoe ConservationAuthority.
-128-

(13) South Lake Simcoe Conservation Authority - 1982/83. "Scanlon Creek Watershed SoilErosion Study", South Lake Simcoe Conservation Authority.
(14) Cunningham, D., E. Lew, L. Drescher, L. Philip and F. Raininger - 1983. "NorthSchomberg River Watershed Streambank Erosion Study" South Lake SimcoeConservation Authority.
(15) Antoszek, J., T. Stam and D. Pritchard - 1983. "Streambank Erosion Inventory -Volume 1", Lake Simcoe Environmental Management Strategy, Technical ReportSeries, Technical Report A3.
(16) Antoszek, J., S. Meek, K. Butler and O. Kashef - 1984. "Streambank ErosionInventory - Volume 2", Lake Simcoe Environmental Management Strategy, TechnicalReport Series, Technical Report A3.
(17) South Lake Simcoe Conservation Authority - February, 1981. "Erosion and WaterManagement Study for Uxbridge Township", South Lake Simcoe ConservationAuthority.
(18) Marshall Macklin Monagham Limited - March, 1981. "Erosion Control & BankStabilization Works of Carson Creek, Lefroy-Bell Ewart-Killarney Beach, InnisfilTownship", Marshall, Macklin and Monaghan, File report 16-78127 D01.
(19) Marshall Macklin Monaghan Limited - April 1982. "Tannery Creek - Holland RiverWatershed Study Final Technical Report", Marshall, Macklin and Monaghan, FileReport 16-78119.
(20) Knap, K. M. and W. F. Mildner - 1978. "Streambank Erosion in the Great LakesBasin", PLUARG, IJC
(21) Spires, A. and M. H. Miller - 1978. "Contribution of Phosphorus from Agricultural Landto Streams by Surface Runoff", PLUARG, IJC.
(22) Taylor, J. - 1983. "Belgrave Creek Rehabilitation Program Report".
(23) South Lake Simcoe Conservation Authority - 1983 Internal memoranda.
(24) LATHEM Group Inc - November, 1984. "Holland River Erosion Investigation", TheLathem Group Inc. Consulting Engineers.
-129-

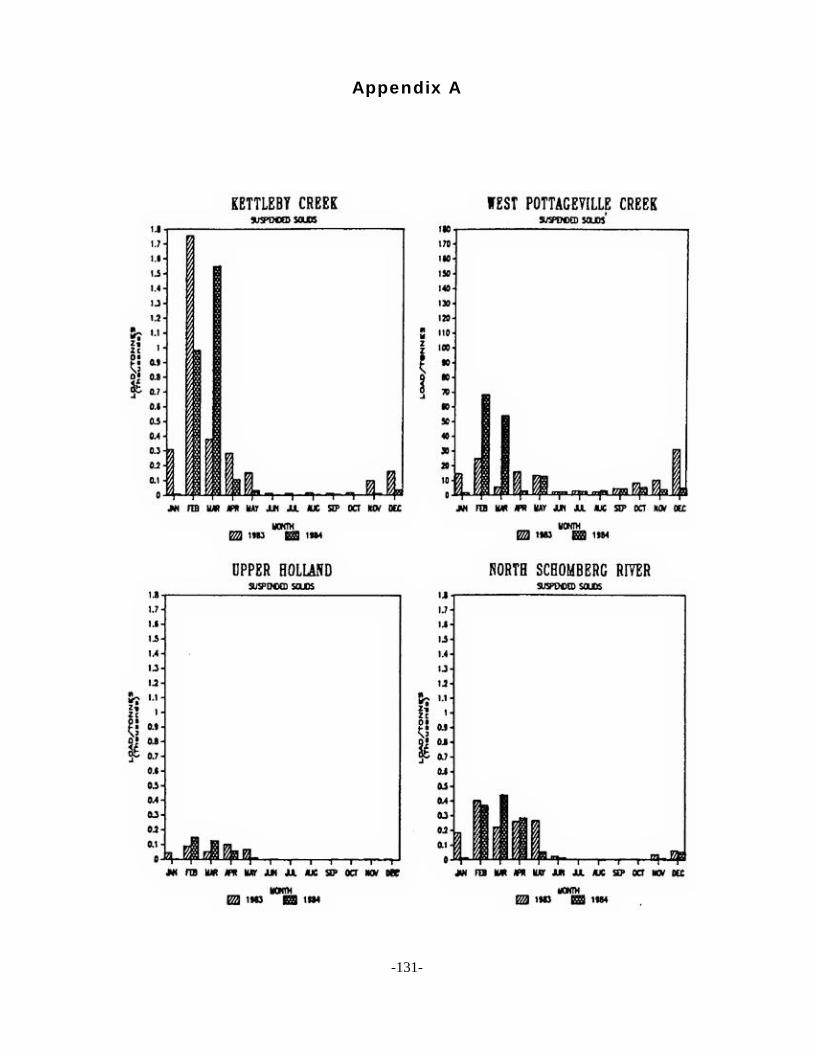
Appendix A
-131-
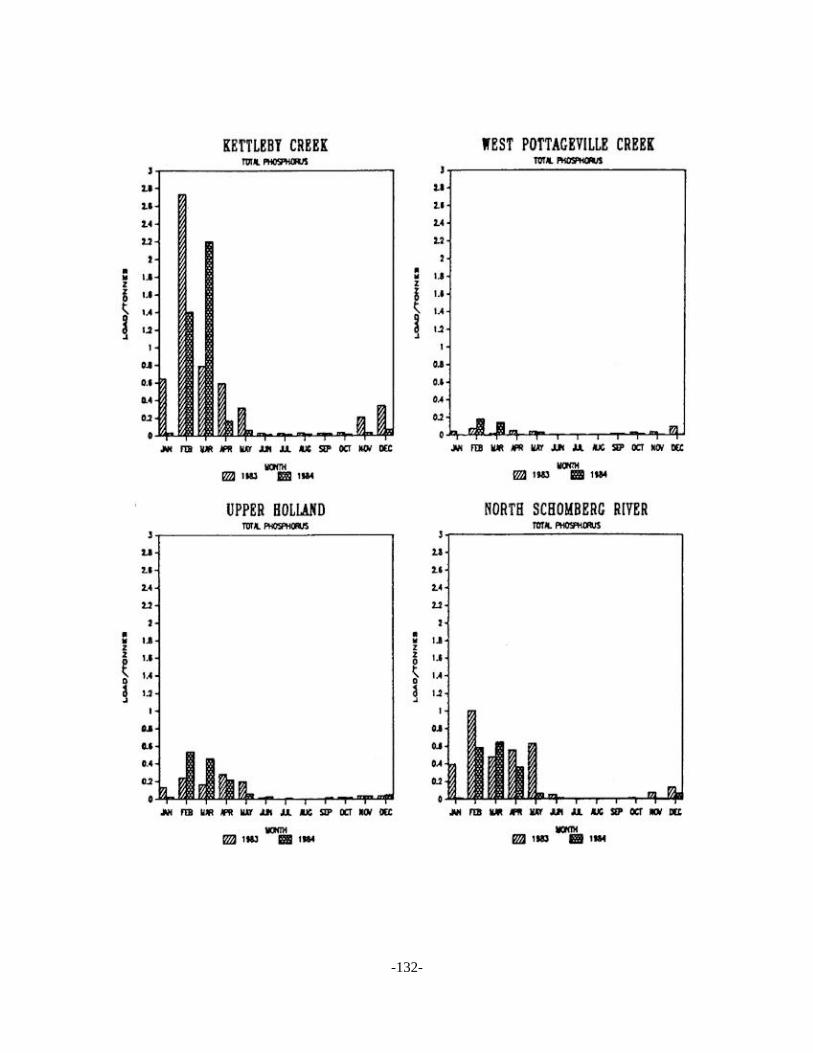
-132-
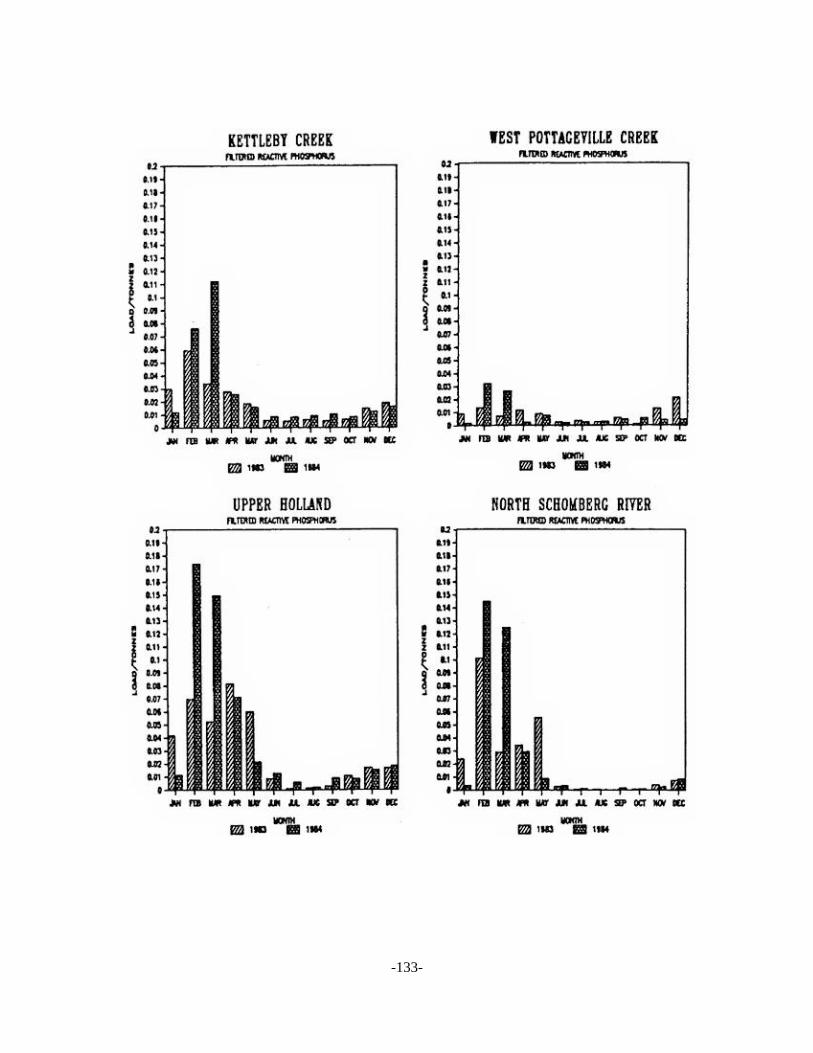
-133-

-134-

-135-
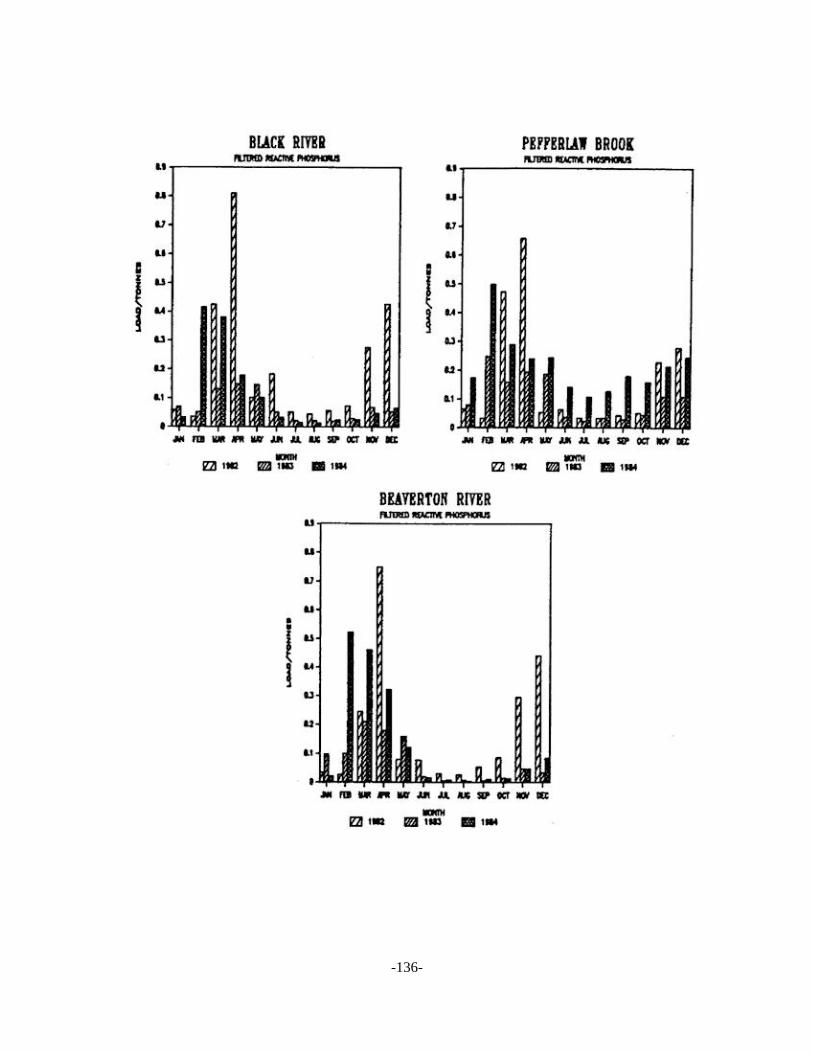
-136-
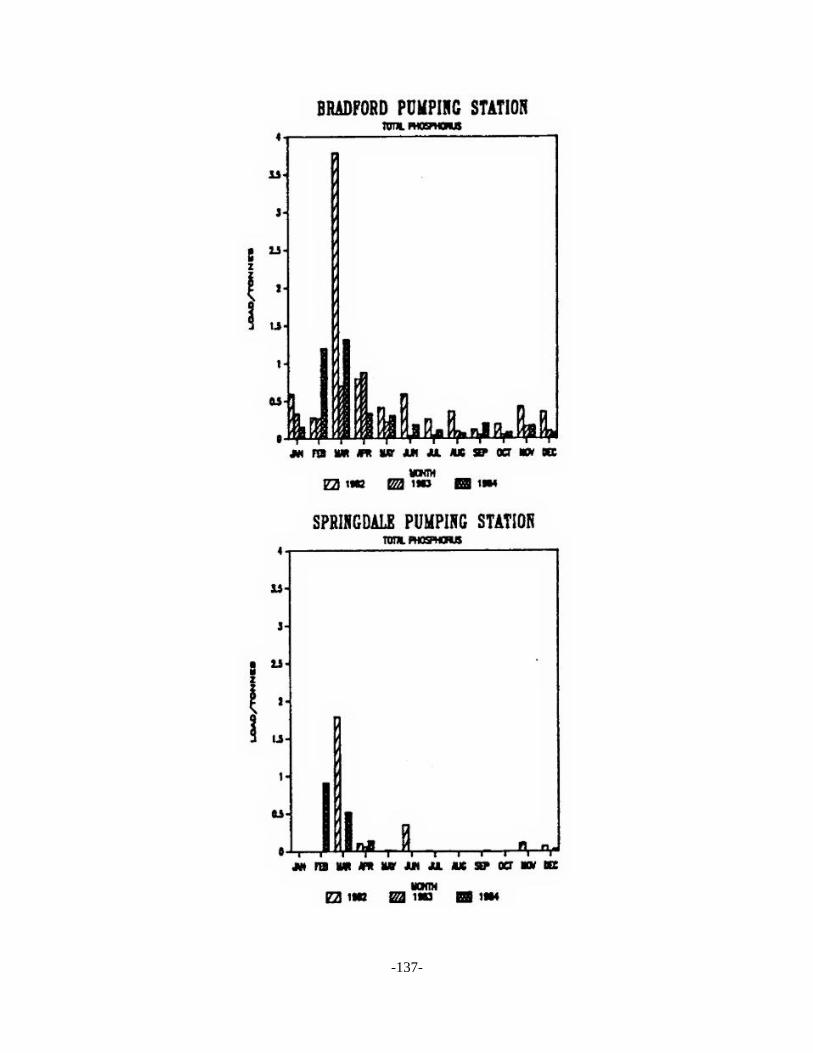
-137-
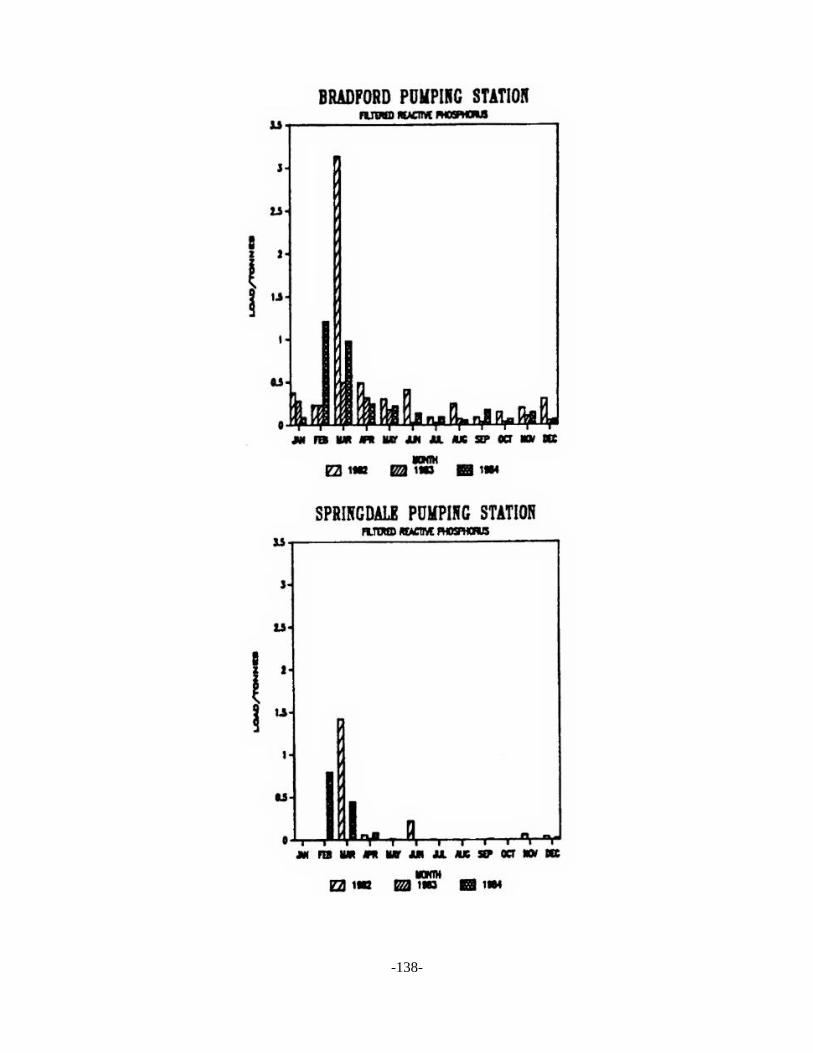
-138-

-139-

-140-

-141-

Appendix B
-142-

-143-

-144-
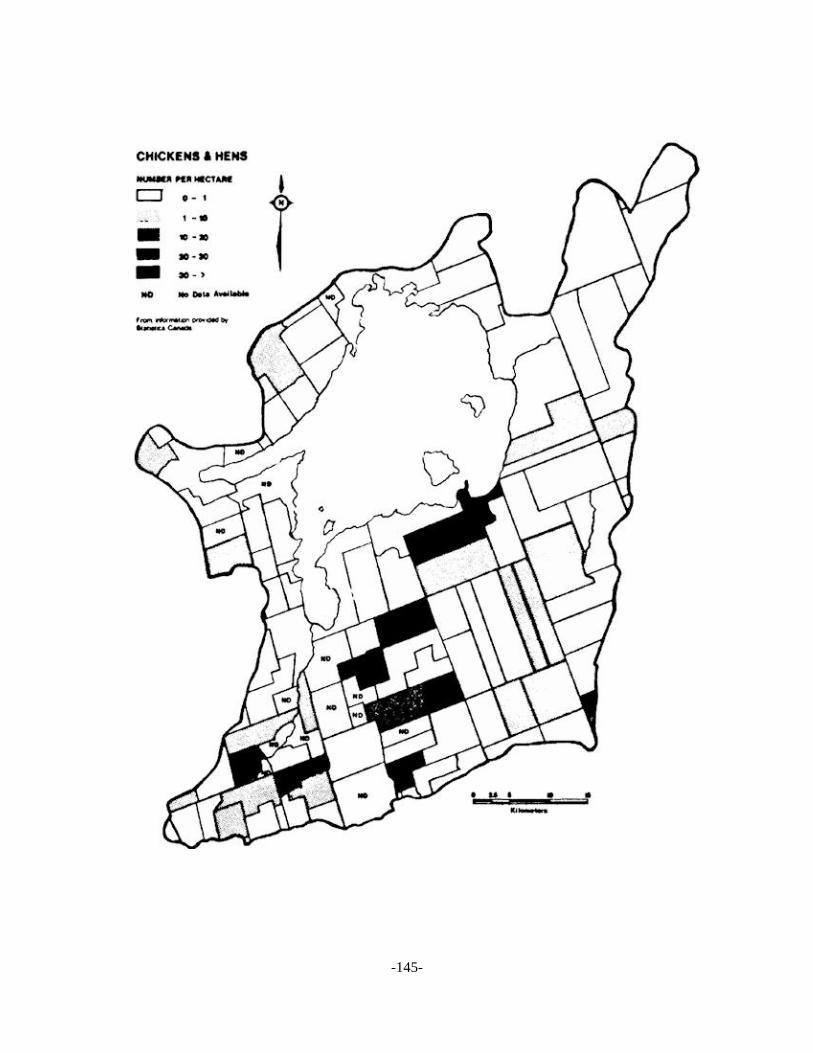
-145-
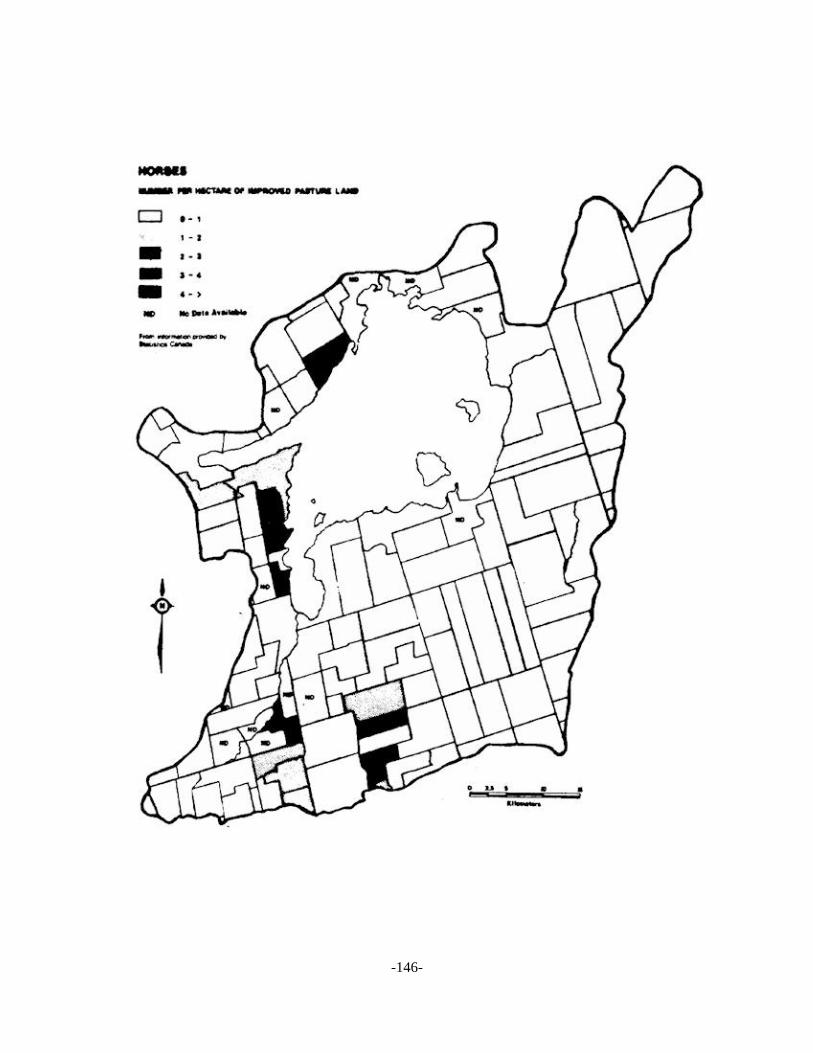
-146-

APPENDIX D
TABLE D-1 ERODIBILITY FACTORS FOR THE LAKE SIMCOE DRAINAGEBASIN
The K factors for the different soils were abstracted from a publication by G. Wall, Universityof Guelph. This report obtained its values from Wischmeier's soil erodibility graph. Thisinformation was provided in the form of three tables. Table 1 contained K values based onanalytical results from surface soil samples. The K values in Table 2 were based oninformation available from the County Soil Survey reports including % sand, % silt, % clay,% organic matter and soil structure. Table 3 K values were determined by soil textural class.
SOIL TYPE K K DERIVED FROM TABLE1 2 3
Alliston s.l. Ans .18 xAlliston f.s.l. Anf .34 xAmeliasberg c.l. Acl .25 xAtherley c. Ayc .10 xAtherley c.l. Aycl .25 xAtherley si.c.l. Aysc .24 xBennington v.f.s.l. Bnf .51 xBerrien s.l. Bes .18 xBerrien f.s.l. Bef .34 xBondhead l. Bl .38 xBondhead s.l. Bs .27 xBookton s.l. Bos .18 xBookton f.s.l. Bof .34 xBottom Land B.L. +Brady s.l. Bsl .18 xBridgeman s. Bis .11 xBrighton s.l. Brsl .27 xBurford l. Bg .15 xCaledon l. Cg .46 xCashel l. Cac .10 xChinguacousey c.l. Chc .25 xCramahe g. Cg .14*Dalton s.l. Dasl .18 xDarlington l. Dal .46 xDummer l. Dl .46 xDundonald s.l. Dasl or Ds .41 xDundonald f.s.l. Df .34 xDunedin c. Duc .10 xEastport s. Ets .11 xEdenvale s.l. Es .18 xEmily l. El .46 x
-147-
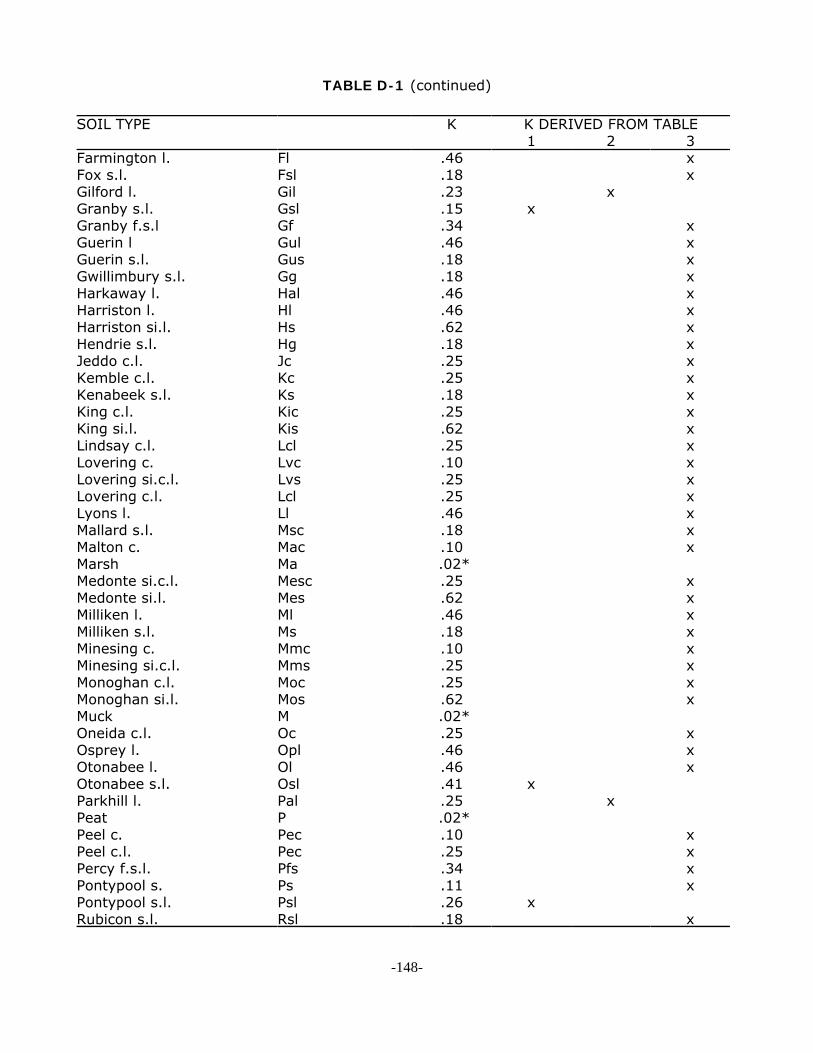
TABLE D-1 (continued)
SOIL TYPE K K DERIVED FROM TABLE1 2 3
Farmington l. Fl .46 xFox s.l. Fsl .18 xGilford l. Gil .23 xGranby s.l. Gsl .15 xGranby f.s.l Gf .34 xGuerin l Gul .46 xGuerin s.l. Gus .18 xGwillimbury s.l. Gg .18 xHarkaway l. Hal .46 xHarriston l. Hl .46 xHarriston si.l. Hs .62 xHendrie s.l. Hg .18 xJeddo c.l. Jc .25 xKemble c.l. Kc .25 xKenabeek s.l. Ks .18 xKing c.l. Kic .25 xKing si.l. Kis .62 xLindsay c.l. Lcl .25 xLovering c. Lvc .10 xLovering si.c.l. Lvs .25 xLovering c.l. Lcl .25 xLyons l. Ll .46 xMallard s.l. Msc .18 xMalton c. Mac .10 xMarsh Ma .02*Medonte si.c.l. Mesc .25 xMedonte si.l. Mes .62 xMilliken l. Ml .46 xMilliken s.l. Ms .18 xMinesing c. Mmc .10 xMinesing si.c.l. Mms .25 xMonoghan c.l. Moc .25 xMonoghan si.l. Mos .62 xMuck M .02*Oneida c.l. Oc .25 xOsprey l. Opl .46 xOtonabee l. Ol .46 xOtonabee s.l. Osl .41 xParkhill l. Pal .25 xPeat P .02*Peel c. Pec .10 xPeel c.l. Pec .25 xPercy f.s.l. Pfs .34 xPontypool s. Ps .11 xPontypool s.l. Psl .26 xRubicon s.l. Rsl .18 x
-148-

TABLE D-1 (continued)
SOIL TYPE K K DERIVED FROM TABLE1 2 3
Sargent g.s.l. Stsl .18 xSchomberg c.l. Shc .25 xSchomberg si.l. Shs .62 xSchomberg si.c.l. Shsc .25 xSimcoe c. Sic .10 xSimcoe c.l & si.s.c. Sic .25 xSimcoe si.l. Sis .62 xSmithfield c.l. Scl .25 xSmithfield si.c.l. Smsc .25 xSmithfield si.l. Sms .62 xSolmesville c.l. Socl .25 xTecumseth s.l. Tsl .19 xTioga l.s. Tis .09 xTioga s.l. Tisl .18 xTioga f.s.l. Tif .34 xTrent f.s.l. Tfsl .34 xVasey l. Vl .46 xVasey s.l. Vasl .18 xVincent c.l. Vc .25 xWaupoos c.l. Wsc .25 xWauseon s.l. Was .18 xWauseon f.s.l Waf .34 xWendigo s.l. Wes .18 xWhitby l. Whl .46 xWiarton l. Wl .46 xWoburn l. Wol .46 xWoburn s.l. Wol .18 xWyevale s.l. Wg .18 x
c. - clay l. - loam s. - sand si. - silt
* from conversations with Dr. G. Wall
+ due to the variability of the composition of bottom land, the uncertainty with regard tothe location of boundaries for bottom land , and the relatively small amount of bottomland present; no value for the K factor was considered. It was assumed that areasindicated as bottom land were comprised of neighbouring soils.
-149-

TABLE D-2 COVER AND MANAGEMENT FACTORS FOR THELAKE SIMCOE DRAINAGE BASIN
FIELD CROP SYSTEMS C
P Continuous Row Crop .43C Corn System .22M Mixed System .19MG Grain System .22H Hay System .06HG Pasture System .03G Grazing System .06
FRUIT AND GRAPE SYSTEMSPE Peaches .10CH Cherries .10PC Peaches - Cherries .10OR Orchard .10V Vineyard .10OV Orchard Vineyard .10VO Vineyard - Orchard .10BE Berries .35
SPECIALTY AGRICULTUREKF Extensive Field Vegetables .39KM Market Gardens/Truck Farms .38KT Tobacco System .28KN Nursery .02
NON - SYSTEM LAND USESA1 Idle Agricultural Land (5-10 years) .03A2 Idle Agricultural Land (over 10 years) .10Z Woodland .02Zp Pastured Woodland .10Zr Reforestation .02B Built-up 0X Swamp, Marsh, or Bog .02E1 Extraction (pits and quarries) 0E2 Extraction (top soil removed) 0T Sod Farms .06R Recreation .06W Water 0
-150-

APPENDIX C
SLOPE LENGTHS FOR USE IN THE UNIVERSAL SOIL LOSS EQUATION
Slope lengths for given percent slopes were derived by averaging slope lengthsfor 10 areas of uniform and similar slope throughout the drainage basin.
0 - 2% = 600 ft (185 m) 2 - 4% = 540 ft (165 m) 4 - 6% = 480 ft (145 m) 6 - 8% = 430 ft (130 m) 8 - 10% = 370 ft (115 m) 10 - 12% = 330 ft (100 m)
-151-