LAKE ECOLOGY Unit 1: Module 2/3 Part 4 – Spatial and Temporal variability January 2004.
85
LAKE ECOLOGY Unit 1: Module 2/3 Part 4 – Spatial and Temporal variability January 2004
-
Upload
nathaniel-carpenter -
Category
Documents
-
view
213 -
download
0
Transcript of LAKE ECOLOGY Unit 1: Module 2/3 Part 4 – Spatial and Temporal variability January 2004.

LAKE ECOLOGY
Unit 1: Module 2/3 Part 4 – Spatial and Temporal variabilityJanuary 2004

Developed by: R.Axler and C. Hagley Draft Updated: January 14, 2004 U1-m2/3Part 4-s2
Modules 2/3 overview
Goal – Provide a practical introduction to limnology
Time required – Two weeks of lecture (6 lectures) and 2 laboratories
Extensions – Additional material could be used to expand to 3 weeks. We realize that there are far more slides than can possibly be used in two weeks and some topics are covered in more depth than others. Teachers are expected to view them all and use what best suits their purposes.

Developed by: R.Axler and C. Hagley Draft Updated: January 14, 2004 U1-m2/3Part 4-s3
Modules 2/3 outline
1. Introduction2. Major groups of organisms; metabolism3. Basins and morphometry4. Spatial and temporal variability – basic
physical and chemical patchiness (habitats)5. Major ions and nutrients 6. Management – eutrophication and water
quality

Developed by: R.Axler and C. Hagley Draft Updated: January 14, 2004 U1-m2/3Part 4-s4
4. Spatial & temporal variability – basic physical and chemical patchiness (habitats)

Developed by: R.Axler and C. Hagley Draft Updated: January 14, 2004 U1-m2/3Part 4-s5
4. Spatial & temporal variability – basic physical and chemical patchiness (habitats)
Physical structure – morphometric features Physical properties – vertical patterns of light,
temperature and density Density stratification effects on chemistry
O2 pH, EC25 (specific conductivity/salinity) nutrients (in section 5)
Developed by: R.Axler and C. Hagley Draft Updated: January 14, 2004 U1-m2/3Part 4-s6
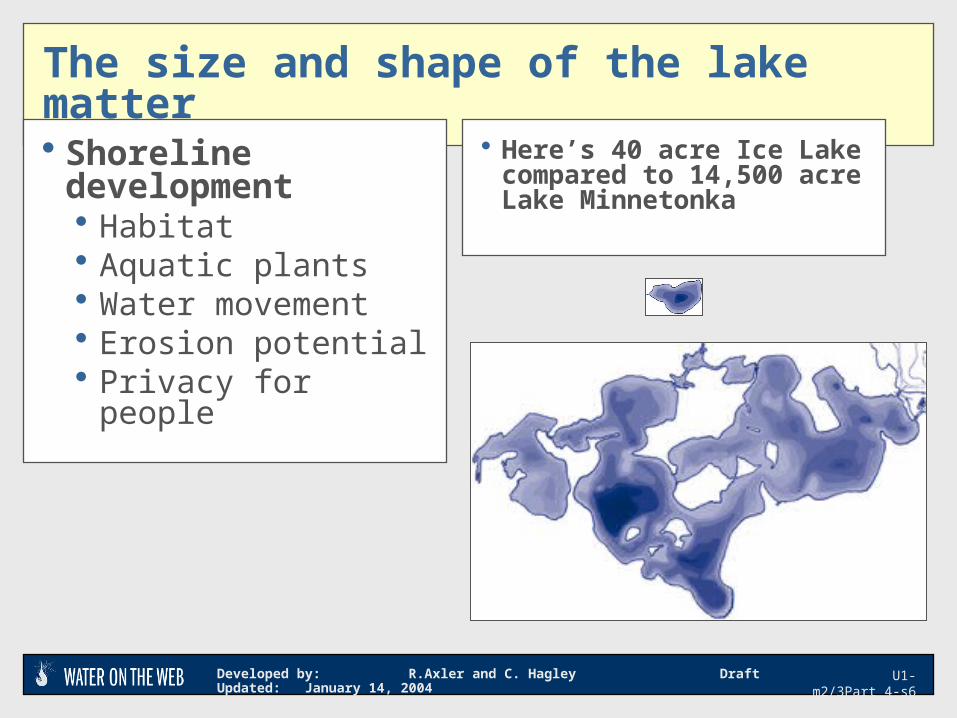
The size and shape of the lake matter
Shoreline development Habitat Aquatic plants Water movement Erosion potential Privacy for people
Here’s 40 acre Ice Lake compared to 14,500 acre Lake Minnetonka

Developed by: R.Axler and C. Hagley Draft Updated: January 14, 2004 U1-m2/3Part 4-s7
Lakes: spatial variability 1
How might water quality vary between site 1 and site 2?
How might their aquatic organism communities differ? Fish Zooplankton Algae Plants

Developed by: R.Axler and C. Hagley Draft Updated: January 14, 2004 U1-m2/3Part 4-s8
Lakes: spatial variability 2
How might water quality vary between sites 1, 2 and 3?
How might aquatic organism communities differ? Fish Zooplankton Algae Plants

Developed by: R.Axler and C. Hagley Draft Updated: January 14, 2004 U1-m2/3Part 4-s9
How might water quality vary across this lake?
How might aquatic communities differ? Fish Zooplankton Algae Plants
Minnesota or Wisconsin bass-bluegill lake
Lakes: spatial variability 3

Developed by: R.Axler and C. Hagley Draft Updated: January 14, 2004 U1-m2/3Part 4-s10
Lakes: spatial variability 4
Here’s a western US reality check
What are major sources of variation for this system ? Water Quality Fish Zooplankton Algae Plants
California bass-bluegill lakeZ-max ~ 4 mArea ~ 10 acres Watershed - ??
(urban runoff)Wind & water flow –
westerly

Developed by: R.Axler and C. Hagley Draft Updated: January 14, 2004 U1-m2/3Part 4-s11
Riverlake, Sacramento, CA
Price: $798,000 (Sep ’03) Sq Ft: 3511 Year Built: 1990 Bedrooms: 4
“…Just minutes from downtown, you'll feel like you are living at a resort in the city! Dynamic architecture brings the lake view to all major rooms”.
… an upscale community … commenced development in 1987… Currently, it consists of 11 villages comprising approximately 1,000 home sites (incl. 150 lake front lots),…

Developed by: R.Axler and C. Hagley Draft Updated: January 14, 2004 U1-m2/3Part 4-s12
Persistent seasonal and short-term longshore currents in Lake Superior
Upwelling and downwelling regions Sediment transport from shoreline erosion and deepwater
resuspension Where do you sample ? How might water quality and aquatic
communities vary spatially and temporally ? Where do stormwater and sewage overflows from Duluth go ?
•Duluth
Horizontal variations from physical factors

Developed by: R.Axler and C. Hagley Draft Updated: January 14, 2004 U1-m2/3Part 4-s13
Water movements- currents and waves
Waves consist of the rise and fall of water particles, with some oscillation but no net flow
Currents consist of net unidirectional flows of water
•credit: www.aquatic.uoguelph.ca/lakes/waves

Developed by: R.Axler and C. Hagley Draft Updated: January 14, 2004 U1-m2/3Part 4-s14
Surface waves
Surface waves are wind-driven. Regular patterns of smooth, rounded waves are called swells. Capillary waves have wavelengths less than 6 cm
and are restored to equilibrium due to the surface tension of the water
Gravity waves have wavelengths greater than 6 cm and fall due to the force of gravity

Developed by: R.Axler and C. Hagley Draft Updated: January 14, 2004 U1-m2/3Part 4-s15
•Resuspension importantparticularily in shallow lakes but also in deep lakes
Resuspension of nutrients and sediments

Developed by: R.Axler and C. Hagley Draft Updated: January 14, 2004 U1-m2/3Part 4-s16
Generated by steady wind Surface water driven downward Water piles up on the lee shore Water flows back due to gravity Standing wave rocks back and forth with
decreasing motion = "surface seiches" Sloshes at resonant frequencies based on
basin shape Can also result from landslides, air pressure,
and earthquakes
Standing waves - surface seiches

Developed by: R.Axler and C. Hagley Draft Updated: January 14, 2004 U1-m2/3Part 4-s17
Standing waves - surface seiches cont.
Developed by: R.Axler and C. Hagley Draft Updated: January 14, 2004 U1-m2/3Part 4-s18
www.northernimages.com
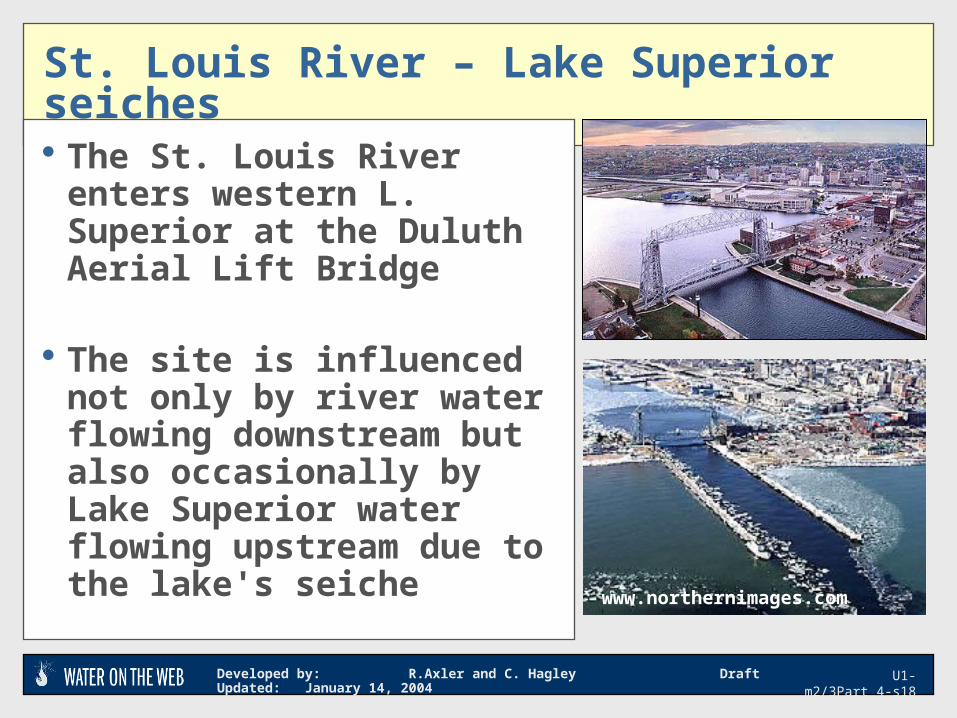
St. Louis River – Lake Superior seiches
The St. Louis River enters western L. Superior at the Duluth Aerial Lift Bridge
The site is influenced not only by river water flowing downstream but also occasionally by Lake Superior water flowing upstream due to the lake's seiche

Developed by: R.Axler and C. Hagley Draft Updated: January 14, 2004 U1-m2/3Part 4-s19
St. Louis River – Duluth inlet data
Brown stripes are periods when water flows out into the lake
Blue indicates “negative” velocity when the lake is sloshing back into the bay
Which water body has higher EC ?
What factors influence the turbidity plot ?

Developed by: R.Axler and C. Hagley Draft Updated: January 14, 2004 U1-m2/3Part 4-s20
Horizontal & vertical variability
• How do light, temperature, sediments vary across these zones ?
• How do plants, periphyton, invertebrates, fish and algae vary ?
LITTORAL ZONE LIMNETIC ZONE
Major Lake Zones
Developed by: R.Axler and C. Hagley Draft Updated: January 14, 2004 U1-m2/3Part 4-s21
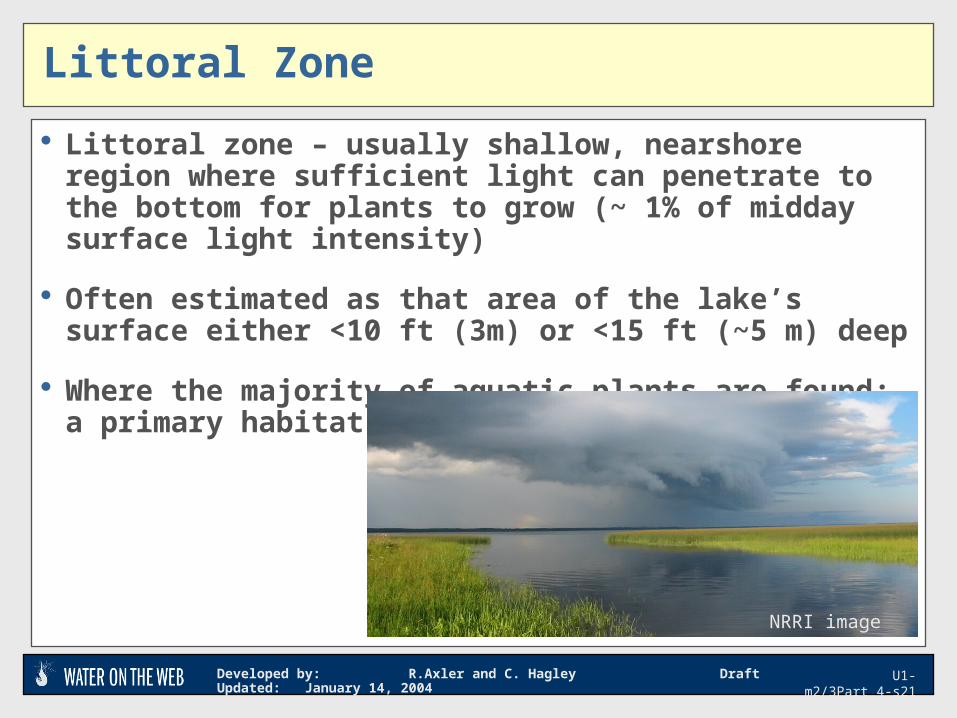
Littoral zone – usually shallow, nearshore region where sufficient light can penetrate to the bottom for plants to grow (~ 1% of midday surface light intensity)
Often estimated as that area of the lake’s surface either <10 ft (3m) or <15 ft (~5 m) deep
Where the majority of aquatic plants are found; a primary habitat for young fish
NRRI image
Littoral Zone
Developed by: R.Axler and C. Hagley Draft Updated: January 14, 2004 U1-m2/3Part 4-s22
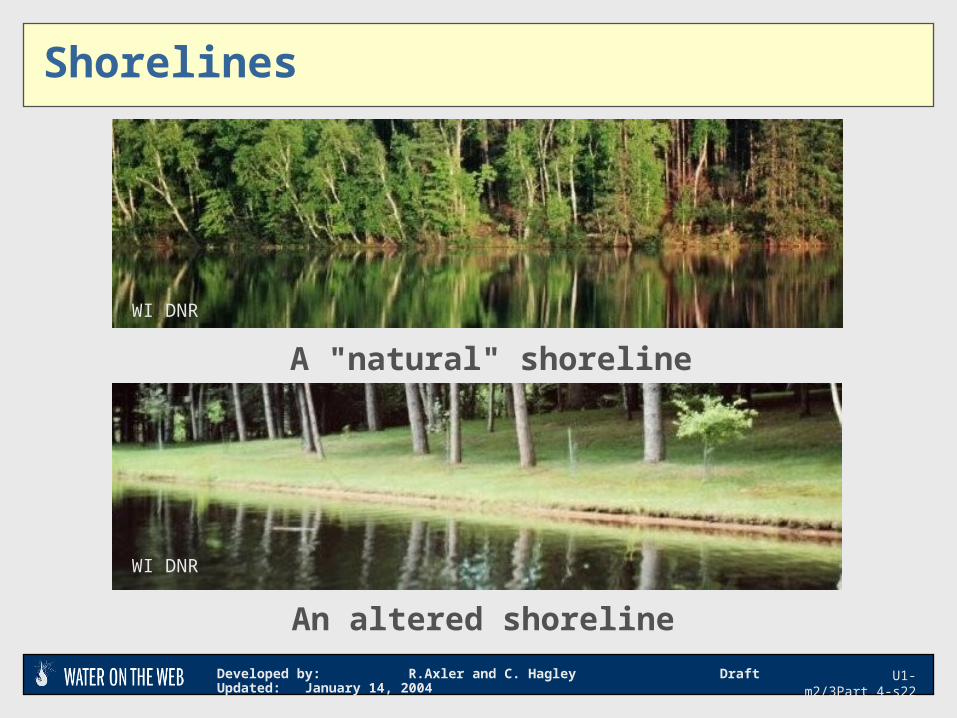
A "natural" shoreline
An altered shoreline
WI DNR
WI DNR
Shorelines

Developed by: R.Axler and C. Hagley Draft Updated: January 14, 2004 U1-m2/3Part 4-s23
• Can you explain each seasonal pattern ?
• What might cause the mid-summer nutrient spikes ?
• Is this likely to be a stratified or unstratified lake and why ?
•Secchi depth
•Nutrients N or P
•Bottomwater- O2
winter
spring
summerfall
winter
Temporal variations - seasonality

Developed by: R.Axler and C. Hagley Draft Updated: January 14, 2004 U1-m2/3Part 4-s24
Lake Ecology Module – light, temp, density, O2
The following slides represent the temperature, density, dissolved oxygen, and stratification portion of the Lake Ecology introductory lecture module 3+4, subtopic 4
Additional explanatory information is available by viewing the attached Notes for each slide
Developed by: R.Axler and C. Hagley Draft Updated: January 14, 2004 U1-m2/3Part 4-s25
Density, Thermal and Oxygen Stratification
Temperature and oxygen levels are major factors regulating aquatic organisms
The layering of lake waters due to density differences is a major factor structuring the ecosystem and creating distinct habitats
The seasonal pattern of turbulent mixing is also a critical determinant of ecosystem function and community structure

Developed by: R.Axler and C. Hagley Draft Updated: January 14, 2004 U1-m2/3Part 4-s26
A Review of Some Basic H2O Physics
DENSITY The warmer the water, the
better it floats, but ice floats too
Water becomes less dense as it warms
The difference in density per degree of warming increases as temperatures rise
SO ….

Developed by: R.Axler and C. Hagley Draft Updated: January 14, 2004 U1-m2/3Part 4-s27
Density layering
Surface water is very buoyant because of the big density difference between it and cold bottom water (leading to stable thermal stratification)
Bottom water is colder than the surface in summer (and a bit warmer in winter)

Developed by: R.Axler and C. Hagley Draft Updated: January 14, 2004 U1-m2/3Part 4-s28
Gas Solubility
Temp (o C)
Temp (o F)
O2- Sol(mg/L)
0 32 15
5 41 13
10 50 11
15 59 10
20 68 9
25 77 8
• Warmer water holds less gas (warm beer goes flat)
• As 100% air-saturated water warms, it loses O2
Developed by: R.Axler and C. Hagley Draft Updated: January 14, 2004 U1-m2/3Part 4-s29
Dep
th
Lightx
x
x
x
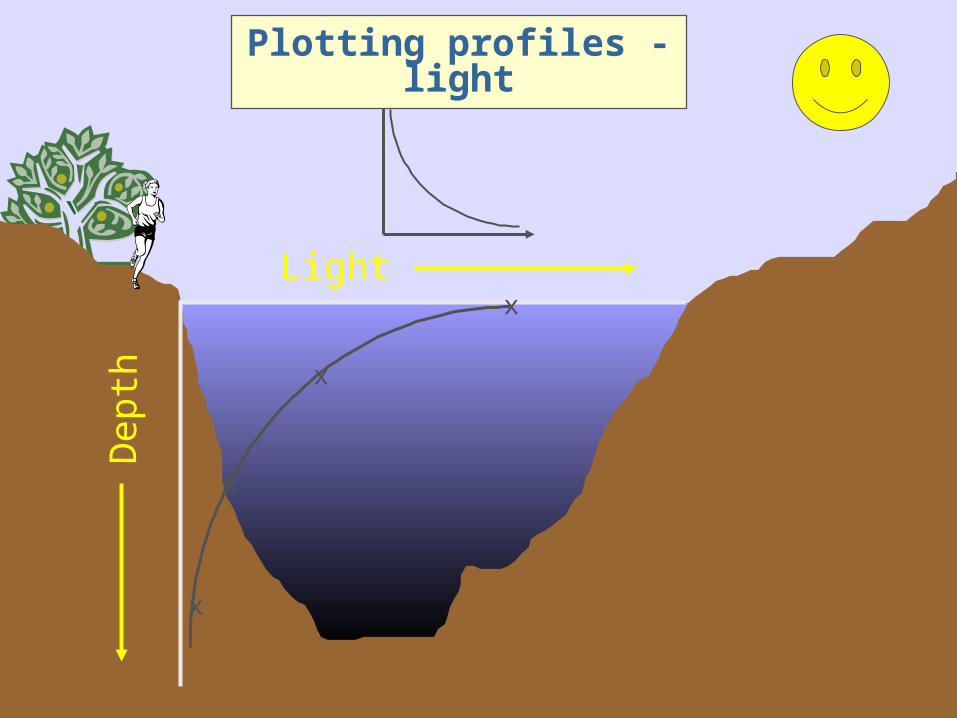
Plotting profiles - light

Developed by: R.Axler and C. Hagley Draft Updated: January 14, 2004 U1-m2/3Part 4-s30
Heat and Light
Light intensity decreases exponentially with depth in a lake
Which curve is the clear lake – blue or black ?
What shape would you expect for the profile of temperature ?

Developed by: R.Axler and C. Hagley Draft Updated: January 14, 2004 U1-m2/3Part 4-s31
Vertical light extinction
Light intensity decreases exponentially with depth and is well described by the Beer-Bouguer-Lambert Law which states that:
I(z) = I(0) * [ e-kz ]
Where:
I(z) = intensity of light as a function of depth z
I(0) = intensity of light at the surface (0 m)
k = the vertical extinction or attenuation coefficient.

Developed by: R.Axler and C. Hagley Draft Updated: January 14, 2004 U1-m2/3Part 4-s32
• The lake surface is exposed to the wind, which mixes the surface water, but the turbulent energy from the wind dissipates with depth, having less impact further down.
• The greater the density difference (mostly from temperature) between layers of water, the harder it is to mix them together.
Heat, as indicated by temperature would also be expected to decrease exponentially with depth, BUT ….
Wind: turbulent mixing

Developed by: R.Axler and C. Hagley Draft Updated: January 14, 2004 U1-m2/3Part 4-s33
Wind mixing links
• Also see slides in Section 5 (Water Chemistry) of this module that discuss gases (O2, N2,CO2 and H2S)

Developed by: R.Axler and C. Hagley Draft Updated: January 14, 2004 U1-m2/3Part 4-s34
Depth
Temperaturex
x
x
x
The Temperature profile would look just like the light profile – at least on a perfectly calm day
Temperature – calm day

Developed by: R.Axler and C. Hagley Draft Updated: January 14, 2004 U1-m2/3Part 4-s35
Depth
Temperaturex
x
x
x
• But when the wind blows, it mixes the surface water with deeper water
• And its energy dissipates with depth
xx
Temperature – windy day

Developed by: R.Axler and C. Hagley Draft Updated: January 14, 2004 U1-m2/3Part 4-s36
Depth
Temperature0oC

Developed by: R.Axler and C. Hagley Draft Updated: January 14, 2004 U1-m2/3Part 4-s37
Depth
Temperature0oC

Developed by: R.Axler and C. Hagley Draft Updated: January 14, 2004 U1-m2/3Part 4-s38
Depth
Temperature0oC

Developed by: R.Axler and C. Hagley Draft Updated: January 14, 2004 U1-m2/3Part 4-s39
Depth
Temperature0oC 10oC

Developed by: R.Axler and C. Hagley Draft Updated: January 14, 2004 U1-m2/3Part 4-s40
Depth
Temperature0oC 10oC

Developed by: R.Axler and C. Hagley Draft Updated: January 14, 2004 U1-m2/3Part 4-s41
Depth
Temperature0oC 10oC 20oC

Developed by: R.Axler and C. Hagley Draft Updated: January 14, 2004 U1-m2/3Part 4-s42
Bottom water colder than surface in summer
Surface water is very buoyant
BIG density difference between surface and cold bottom water = resistance to mixing
Mid-summer thermal stratification

Developed by: R.Axler and C. Hagley Draft Updated: January 14, 2004 U1-m2/3Part 4-s43
Depth
Temperature0oC 10oC

Developed by: R.Axler and C. Hagley Draft Updated: January 14, 2004 U1-m2/3Part 4-s44
Depth
Temperature0oC 10oC
Developed by: R.Axler and C. Hagley Draft Updated: January 14, 2004 U1-m2/3Part 4-s45
Depth
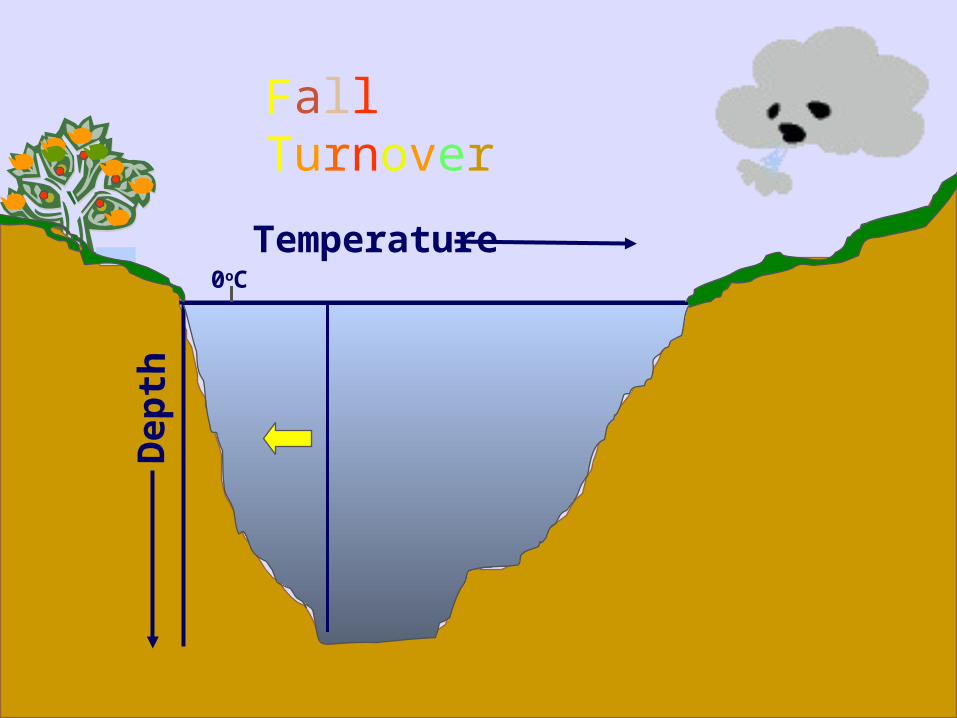
Temperature0oC
Fall Turnover

Developed by: R.Axler and C. Hagley Draft Updated: January 14, 2004 U1-m2/3Part 4-s46
Depth
Temperature0oC
Developed by: R.Axler and C. Hagley Draft Updated: January 14, 2004 U1-m2/3Part 4-s47
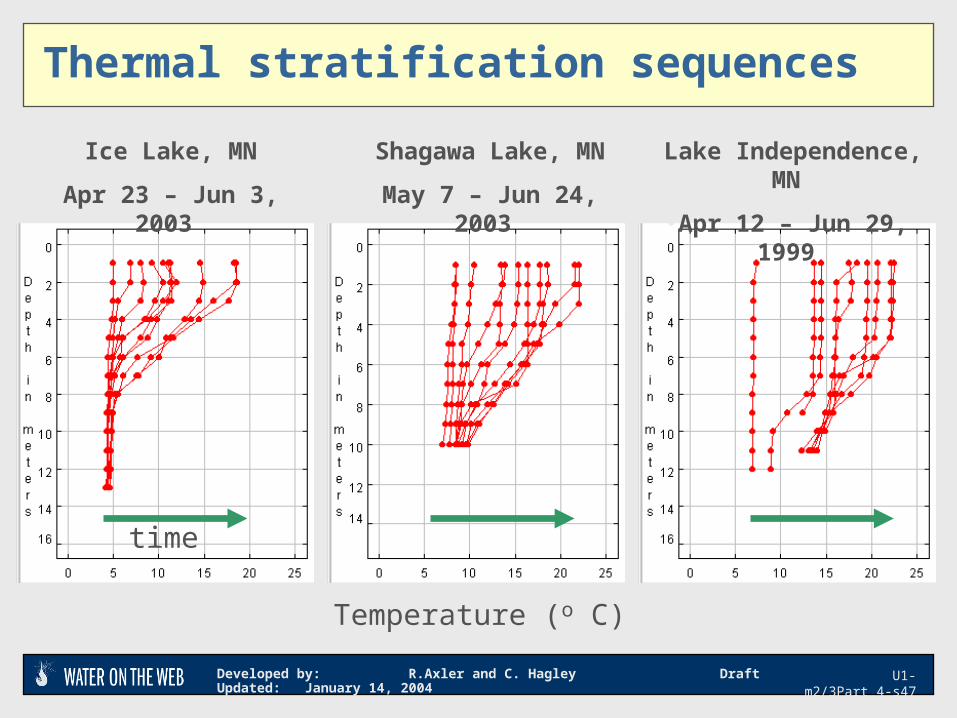
Thermal stratification sequences
•Ice Lake, MN
•Apr 23 – Jun 3, 2003
•Shagawa Lake, MN
•May 7 – Jun 24, 2003
•Lake Independence, MN
•Apr 12 – Jun 29, 1999
•Temperature (o C)
time

Developed by: R.Axler and C. Hagley Draft Updated: January 14, 2004 U1-m2/3Part 4-s48
Oxygen
What are the sources of oxygen to a lake?
What are the sinks for oxygen in a lake?

Developed by: R.Axler and C. Hagley Draft Updated: January 14, 2004 U1-m2/3Part 4-s49
Wind energy
Photosynthesis
Two Major Sources of O2

Developed by: R.Axler and C. Hagley Draft Updated: January 14, 2004 U1-m2/3Part 4-s50
Major Sinks (losses)
O2 O2O2
Diffusion
Water column respiration
Sediment respiration (bacteria and benthos)

Developed by: R.Axler and C. Hagley Draft Updated: January 14, 2004 U1-m2/3Part 4-s51
Factors affecting dissolved oxygen levels
• How far down can light penetrate ?• Is the lake thermally stratified ?• How windy is it ?• Are there a lot of aquatic plants and algae ?• How warm is the lake ?• Is there a lot of organic “gunk” in the water ?• Are there sources of fertilizer, ag & urban runoff,
wastewater, etc. coming in ?• How much organic sediment area is there
relative to hypolimnetic volume ?

Developed by: R.Axler and C. Hagley Draft Updated: January 14, 2004 U1-m2/3Part 4-s52
“Idealized” Stratification Curves
Un
pro
du
ctiv
eP
rod
uct
ive

Developed by: R.Axler and C. Hagley Draft Updated: January 14, 2004 U1-m2/3Part 4-s53
Mid-summer thermal stratification - summary
Surface water is very buoyant – it floats on top of the thermocline
BIG density difference between surface and cold bottom water
It takes a lot of wind energy to push the surface water down long enough to mix with the water below
Bottom water is colder than the surface in summer

Developed by: R.Axler and C. Hagley Draft Updated: January 14, 2004 U1-m2/3Part 4-s54
Annual cycle of thermal stratification - dimixis

Developed by: R.Axler and C. Hagley Draft Updated: January 14, 2004 U1-m2/3Part 4-s55
Illustrations of Water on the Web lake data visualization tools (DVT’s):
Profile plotter (all parameters vs depth)
Color mapper (2 parameters vs depth)
DxT (depth vs time)
Reality – “real” data

Developed by: R.Axler and C. Hagley Draft Updated: January 14, 2004 U1-m2/3Part 4-s56
Profile Plotter
West Upper Bay of Lake Minnetonka
8/31/2000
Temperature
Thermocline
Dissolved oxygen
Scales: oC and ppm O2
• Strong temperature and DO stratification
• No O2 below thermocline

Developed by: R.Axler and C. Hagley Draft Updated: January 14, 2004 U1-m2/3Part 4-s57
Color Mapper
BackgroundBackground Scale
DO TempLine plotLine plot
Scale
Anoxic below
thermocline

Developed by: R.Axler and C. Hagley Draft Updated: January 14, 2004 U1-m2/3Part 4-s58
Color Mapper - Shallow Lake
DO Temp

Developed by: R.Axler and C. Hagley Draft Updated: January 14, 2004 U1-m2/3Part 4-s59
Seasonal Cycles of Temperature & Oxygen

Developed by: R.Axler and C. Hagley Draft Updated: January 14, 2004 U1-m2/3Part 4-s60
Partial Mixing in Medicine Lake, MN
Temp
DO
8/31/2001
Is it totally mixed ?
Developed by: R.Axler and C. Hagley Draft Updated: January 14, 2004 U1-m2/3Part 4-s61
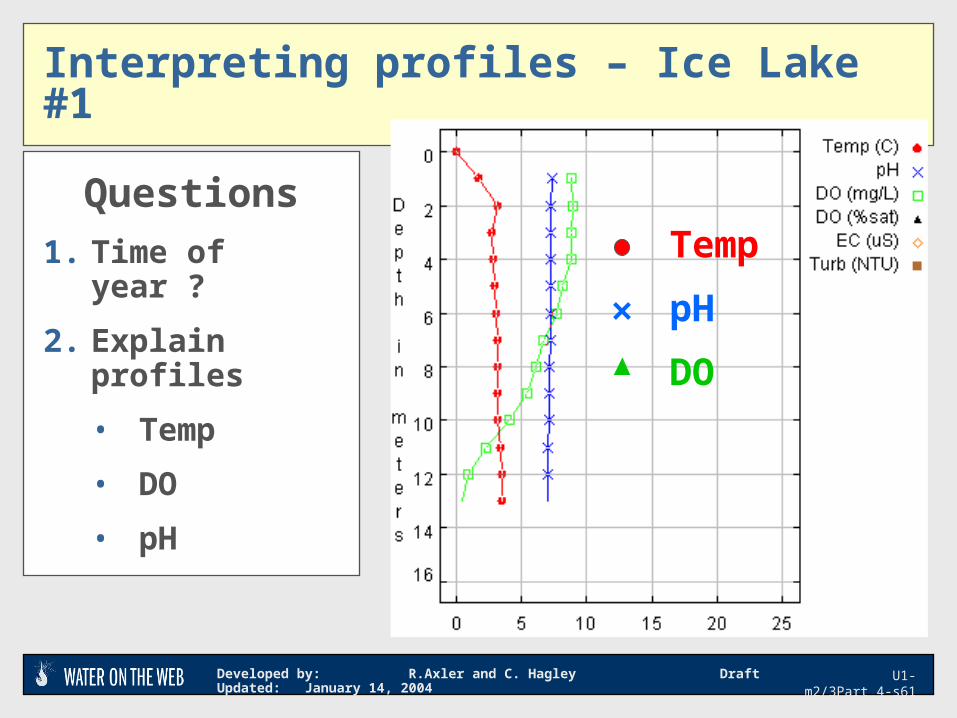
Interpreting profiles – Ice Lake #1
Questions
1. Time of year ?
2. Explain profiles
• Temp
• DO
• pH
Temp
pH
DO
Developed by: R.Axler and C. Hagley Draft Updated: January 14, 2004 U1-m2/3Part 4-s62
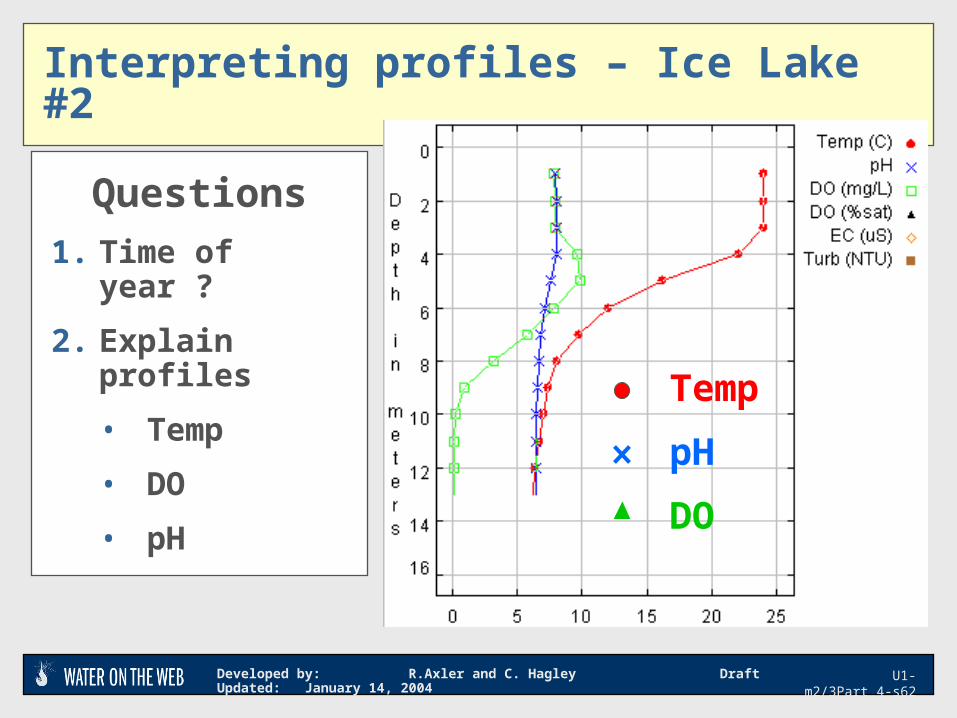
Interpreting profiles – Ice Lake #2
Questions
1. Time of year ?
2. Explain profiles
• Temp
• DO
• pH
Temp
pH
DO

Developed by: R.Axler and C. Hagley Draft Updated: January 14, 2004 U1-m2/3Part 4-s63
Seasonal Cycles in Ice Lake, MN (Profile Plotter)
Temp
pH
DO
Here’s the full annual cycle on a monthly time step

Developed by: R.Axler and C. Hagley Draft Updated: January 14, 2004 U1-m2/3Part 4-s64
Seasonal Cycles in Ice Lake, MN (Color Mapper)

Developed by: R.Axler and C. Hagley Draft Updated: January 14, 2004 U1-m2/3Part 4-s65
Interesting Summer O2 Depth Profiles
Ice Lake Grindstone Lake
6/14/99 6/20/99

Developed by: R.Axler and C. Hagley Draft Updated: January 14, 2004 U1-m2/3Part 4-s66
Compare with Three Nearby Lakes (June 1999)
Q1: Why is West Upper temperature so different?
Q2: What caused the strange West Upper O2 profile?
Halsted’s Bay, Minnetonka West Upper, L. M’tonka L. Independence

Developed by: R.Axler and C. Hagley Draft Updated: January 14, 2004 U1-m2/3Part 4-s67
Onondaga midsummer – color mapper
• Set the color mapper for mid Aug 2003 (this profile is from Aug 22, 2003. Set EC to 1200-2200 uS/cm (in red), DO to % sat (black) and pH in blue
• DO > 150% from 0-3m and then <10% down to the bottom !
• pH drops >1 unit from 3 down to 5 m
• EC jumps up and down by 400 uS/cm !
Very dynamic data set

Developed by: R.Axler and C. Hagley Draft Updated: January 14, 2004 U1-m2/3Part 4-s68
Depth versus Time Plotter (DxT)
Time of Year Location Parameter
Scale
Dep
th

Developed by: R.Axler and C. Hagley Draft Updated: January 14, 2004 U1-m2/3Part 4-s69
Annual Temp & O2 in a Shallow, Productive Bay –
Halsteds Bay, L. Minnetonka
•Temp
•O2

Developed by: R.Axler and C. Hagley Draft Updated: January 14, 2004 U1-m2/3Part 4-s70
Compare two bays of the same lake Halsteds and West Upper, Minnetonka, MN
Halsteds
West Upper

Developed by: R.Axler and C. Hagley Draft Updated: January 14, 2004 U1-m2/3Part 4-s71
Medicine Lake - summer stratification

Developed by: R.Axler and C. Hagley Draft Updated: January 14, 2004 U1-m2/3Part 4-s72
Ice Lake, MN - Interannual variation
Fall mixing
Fallmixing ?
Fall mixing
Fallmixing
spring mixing
rate of thermocline descent
No spring mixing
No spring mixing
No spring mixing
“rate of hypolimnetic O2 –depletion”
Developed by: R.Axler and C. Hagley Draft Updated: January 14, 2004 U1-m2/3Part 4-s73
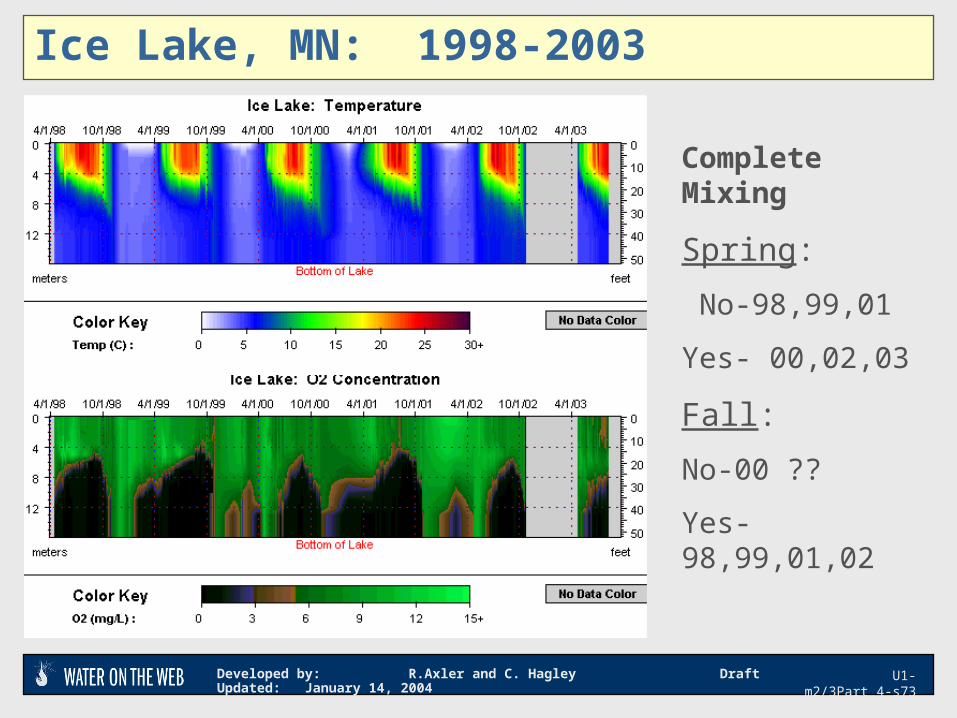
Ice Lake, MN: 1998-2003
Complete Mixing
Spring:
No-98,99,01
Yes- 00,02,03
Fall:
No-00 ??
Yes- 98,99,01,02
Developed by: R.Axler and C. Hagley Draft Updated: January 14, 2004 U1-m2/3Part 4-s74
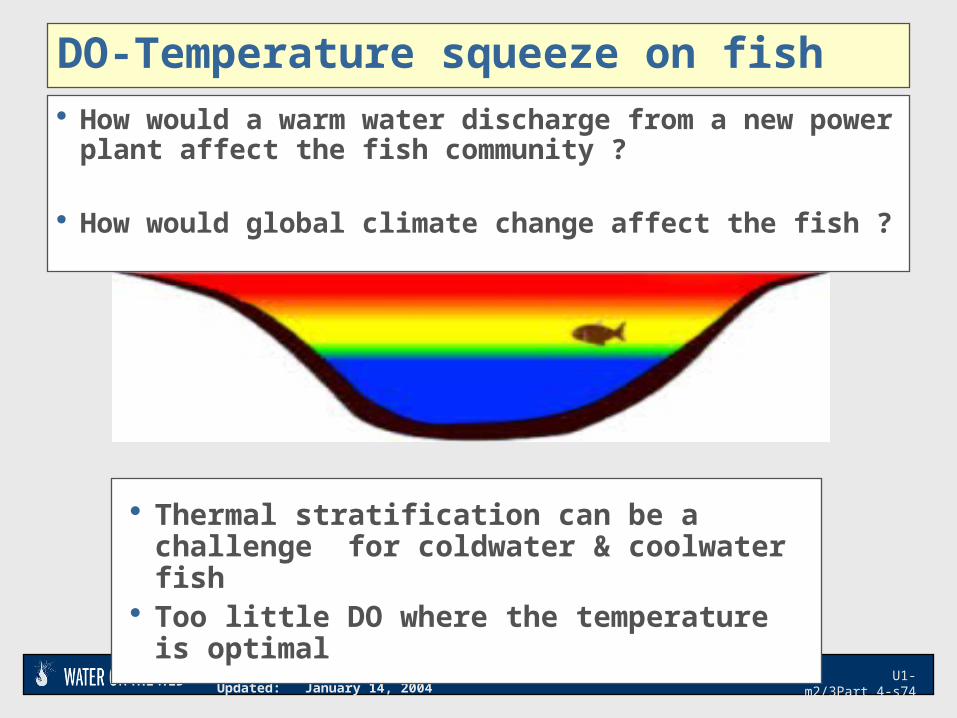
DO-Temperature squeeze on fish
Thermal stratification can be a challenge for coldwater & coolwater fish
Too little DO where the temperature is optimal
How would a warm water discharge from a new power plant affect the fish community ?
How would global climate change affect the fish ?
Developed by: R.Axler and C. Hagley Draft Updated: January 14, 2004 U1-m2/3Part 4-s75
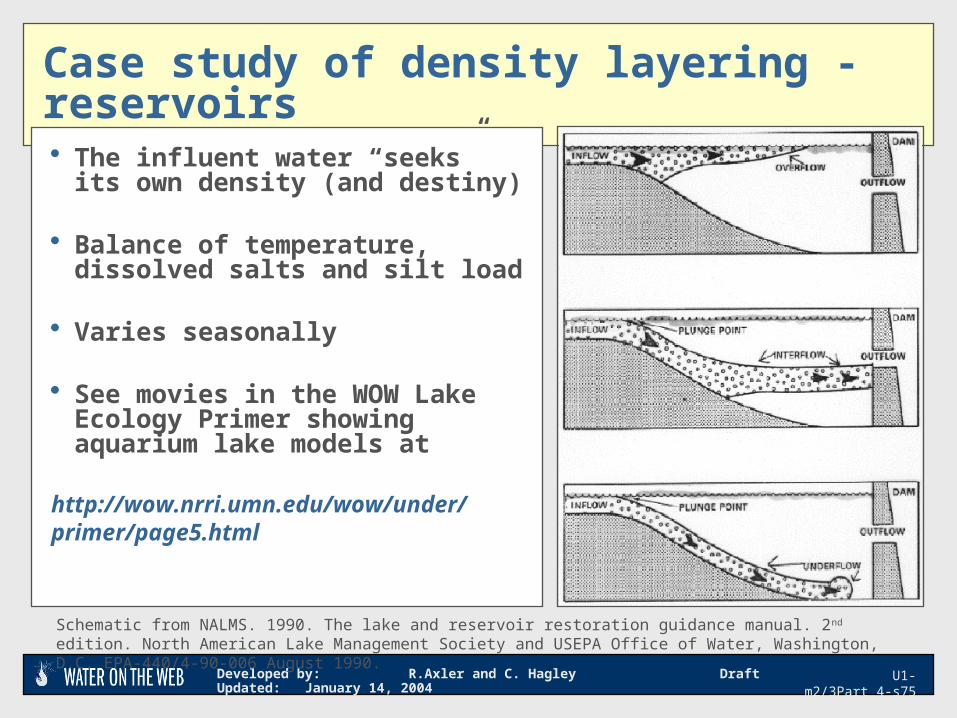
Case study of density layering - reservoirs
The influent water “seeks” its own density (and destiny)
Balance of temperature, dissolved salts and silt load
Varies seasonally
See movies in the WOW Lake Ecology Primer showing aquarium lake models at
http://wow.nrri.umn.edu/wow/under/primer/page5.html
Schematic from NALMS. 1990. The lake and reservoir restoration guidance manual. 2nd edition. North American Lake Management Society and USEPA Office of Water, Washington, D.C. EPA-440/4-90-006 August 1990.

Developed by: R.Axler and C. Hagley Draft Updated: January 14, 2004 U1-m2/3Part 4-s76
USBR: http://www.hooverdam.usbr.gov/
Lake Mead, NV-AZ, USA

Developed by: R.Axler and C. Hagley Draft Updated: January 14, 2004 U1-m2/3Part 4-s77
Mainstem Colorado R. Lifeblood of SW US Largest reservoir in US National Recreation Area
A: 158,000 acres V: ~ 21-26 million acre-feet z-max: ~ 150 m (main basins) z- max ~ 2-55 m (LV Bay )
• power for 500,000 homes
(2,074,000 kilowatts)
• drinking water ~20 million
• irrigation ~1 million acres
• wastewater ~ 153 mgd
• oligotrophic - main basins
• eutrophic Las Vegas Bay
• municipal sewage
• density plumes can combine
wastewater & drinking water
Lake Mead, NV-AZ, USA - features

Developed by: R.Axler and C. Hagley Draft Updated: January 14, 2004 U1-m2/3Part 4-s78
DW intake
Las Vegas Bay
Boulder Basin- Sentinel I.
Hoover Dam
Lake Mead, Las Vegas Bay – images
Developed by: R.Axler and C. Hagley Draft Updated: January 14, 2004 U1-m2/3Part 4-s79
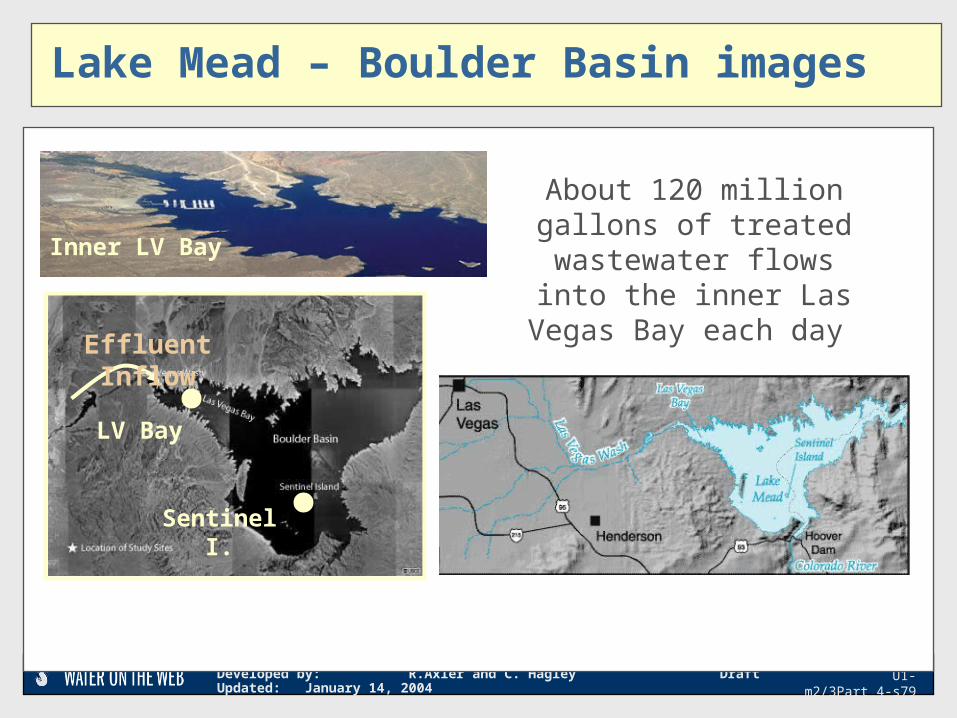
Lake Mead – Boulder Basin images
Inner LV Bay
LV Bay
Sentinel I.
Effluent Inflow
About 120 million gallons of treated wastewater
flows into the inner Las Vegas Bay each day
Developed by: R.Axler and C. Hagley Draft Updated: January 14, 2004 U1-m2/3Part 4-s80
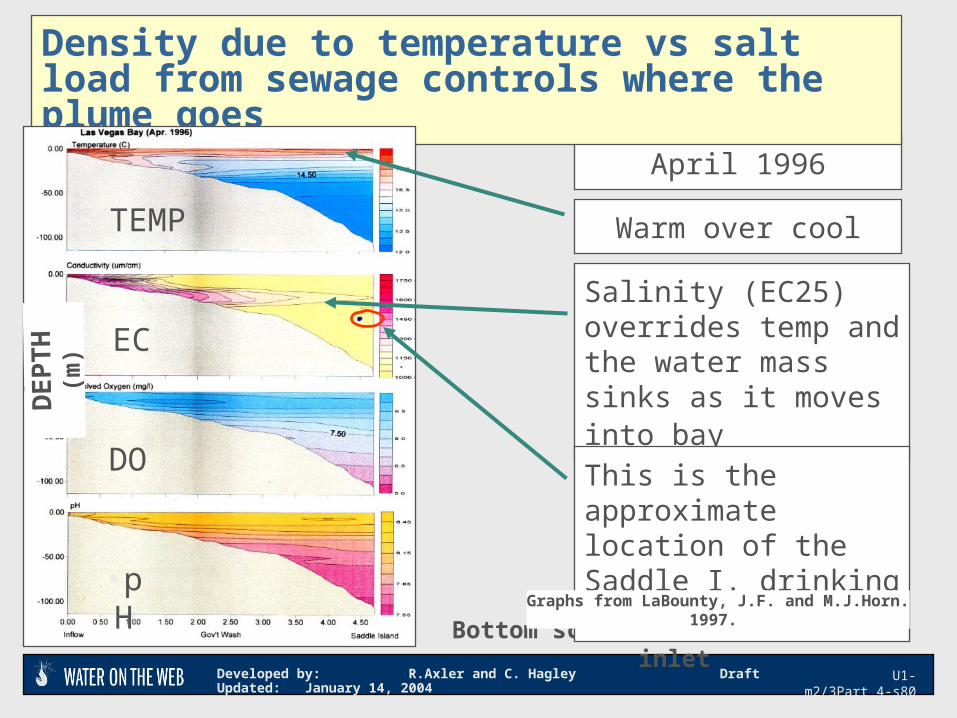
April 1996
Density due to temperature vs salt load from sewage controls where the plume goes
EC
TEMP
DO
•pH
DE
PT
H (
m)
•Bottom scale: miles from LV Wash inlet
Salinity (EC25) overrides temp and the water mass sinks as it moves into bay
This is the approximate location of the Saddle I. drinking water intake
Warm over cool
Graphs from LaBounty, J.F. and M.J.Horn. 1997.

Developed by: R.Axler and C. Hagley Draft Updated: January 14, 2004 U1-m2/3Part 4-s81
Density plumes – Outer Vegas Bay, L. Mead AZ
pH
DO
EC
TEMP
DE
PT
H
These graphs show how LV Bay water moves into the main lake in Boulder Basin
Drinking Water intake Hoover Dam– 10 miles out
Low salinity, narrow stratum of water is the “remains” of the Colorado River flowing down lake for over 70 miles
High salinity (EC25), low DO plume from wastewater
Graphs from LaBounty, J.F. and M.J.Horn. 1997.
Developed by: R.Axler and C. Hagley Draft Updated: January 14, 2004 U1-m2/3Part 4-s82
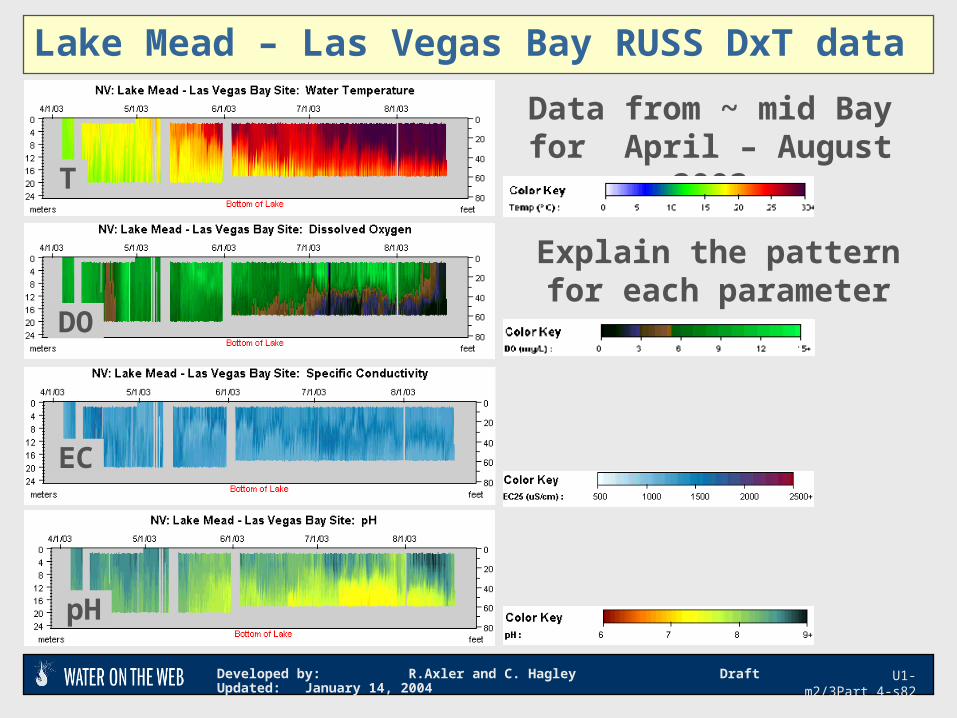
Lake Mead – Las Vegas Bay RUSS DxT data
Data from ~ mid Bay for April – August 2003
T
DO
EC
pH
Explain the pattern for each parameter

Developed by: R.Axler and C. Hagley Draft Updated: January 14, 2004 U1-m2/3Part 4-s83
Lake Mead – Las Vegas Bay DxT scaling
•An example of how playing with the scale adjustment on the DxT tool can highlight the behavior of a stratum of water

Developed by: R.Axler and C. Hagley Draft Updated: January 14, 2004 U1-m2/3Part 4-s84
Lake Onondaga – also has a density layer
Corresponding DO (% saturation)
South Deep site
DxT: start 6/21/03 for 85 d
What’s causing the high salinity layer that is ~ 10 m thick ?

Developed by: R.Axler and C. Hagley Draft Updated: January 14, 2004 U1-m2/3Part 4-s85