
LAK15 panel - European Perspectives
88
Learning Analytics: European Perspectives LAK15 Panel March 18 2015 Learning Analytics Community Exchange (LACE) #laceproject
-
Upload
lace-project -
Category
Education
-
view
840 -
download
1
Transcript of LAK15 panel - European Perspectives

Learning Analytics: European Perspectives
LAK15 Panel March 18 2015Learning Analytics Community Exchange (LACE)
#laceproject

Gathering evidence
http://evidence.laceproject.eu/

Propositions
http://evidence.laceproject.eu/

Exploring the evidence
http://evidence.laceproject.eu/

Visualising evidence
http://evidence.laceproject.eu/

You can help
http://evidence.laceproject.eu/contribute/add-evidence/

• Rebecca Ferguson, The Open University, UKIntroduction
• Alejandra Martínez Monés, University of Valladolid, SpainBuilding on past collaborations
• Kairit Tammets, Tallinn University, EstoniaWork in Estonia
• Alan Berg, University of Amsterdam, The NetherlandsWork in The Netherlands
• Anne Boyer, Université de Lorraine, FranceWork in France
• Hendrik Drachsler (OUNL) and Adam Cooper (Cetis), LACEMoving forward together – the LACE project
• Questions and discussion

Learning Analytics: European Perspectives.
Kaleidoscope NoEAlejandra Martínez Monés
18-3-2015

Was there learning analytics before “learning
analytics”?LAK 15 Poughkeepsie, March 11, 2015
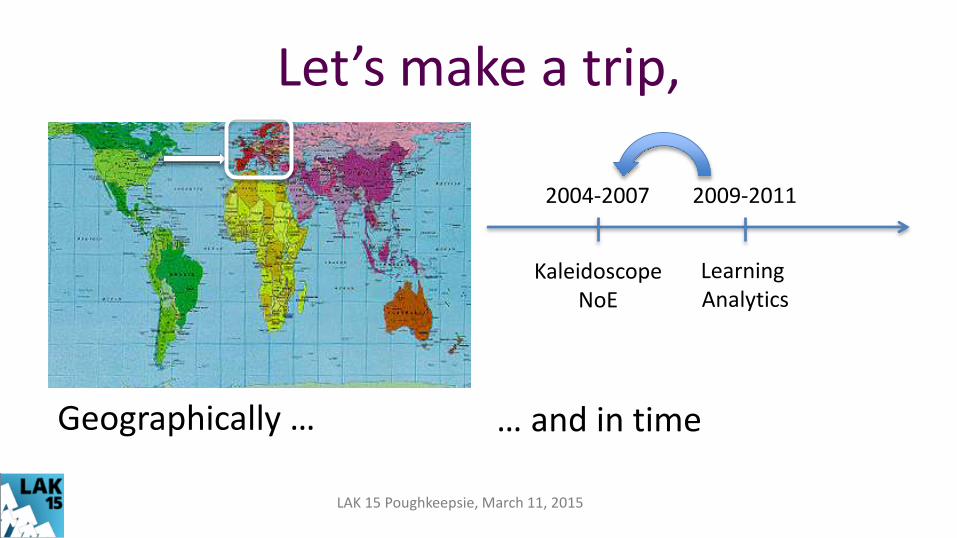
Let’s make a trip,
Geographically … … and in time
2004-2007 2009-2011
Learning Analytics
KaleidoscopeNoE
LAK 15 Poughkeepsie, March 11, 2015

Kaleidoscope NoE
• Projects related to Computer-Assisted Interaction Analysis – ICALTS & IA (2004-2005)
Interaction and Collaboration Analysis Supporting Teachers’ and Students’ Self-Regulation
– CAVicola (2006)Computer-based analysis and visualization of Collaborative Learning activities
LAK 15 Poughkeepsie, March 11, 2015

Who?
• Researchers – From the AIED and CSCL research communities
– Different backgrounds (Psychology, Computer Science …)
• Interest in using data provided by computer logs to understand (collaborative) learning and help teachers and learners improve the learning process
LAK 15 Poughkeepsie, March 11, 2015

WE HAD A SMALL IMPACT
LAK 15 Poughkeepsie, March 11, 2015

Small impact
• A small number of researchers, coming from the “CS” in CSCL
• Focus on understanding learning and on providing support on a small scale
• Unstable prototypes with little usability
LAK 15 Poughkeepsie, March 11, 2015

Small impact (cont)
• We had no “name”, no “label” for what we were doing:
• (Computer-supported) Interaction / Collaboration Analysis
• Collaborative learning modeling
• Management of collaborative interaction
• …
LAK 15 Poughkeepsie, March 11, 2015

BUT WE HAD WORKED HARD AND ACHIEVED SOME OUTCOMES
LAK 15 Poughkeepsie, March 11, 2015

Main outcomes
1. Conceptualization of analysis indicators and methods
• A catalogue of indicators
• A model of computer supported interaction analysis process
LAK 15 Poughkeepsie, March 11, 2015

Main outcomes
2. Focus on interoperability – A common data format to
enable data exchange between learning tools and analysis tools
– Cross-case studies with participation of all the partners
LAK 15 Poughkeepsie, March 11, 2015

Main outcomes3. Focus on visualization
of the analysis
– Augmentation of Social Networks with:
• measurements and properties
• navigability
LAK 15 Poughkeepsie, March 11, 2015

Was there learning analytics before “learning analytics”?
LAK 15 Poughkeepsie, March 11, 2015

Recommended readings• Harrer, A., Martínez Monés, A., Dimitracopoulou, A. Users’ data:
Collaborative and social analysis in Technology-Enhanced Learning: Principles and Products, Springer, Netherlands, 2009.
• Nicolas Balacheff, Kristine Lund. Multidisciplinarity vs. Multivocality, the case of "Learning Analytics”. LAK 2013 - International Conference on Learning Analytics and Knowledge, Apr 2013, Leuven, Belgium. ACM New York, NY, USA, pp.5-13,
LAK 15 Poughkeepsie, March 11, 2015

Learning Analytics:
European Perspectives
Estonian contextKairit Tammets
Tallinn University
18. March 2015

Learning Analytics in Estonia• Two state level initiatives:
– Educational resources cloud for secondary education
– eDidaktikum for teacher education
• Few research-based software development initiatives:
– Edufeedr.net
– Dippler
• Several EU funded projects with LA element:
– EMMA - European Multiple MOOC Aggregator
– Learning Layers – Scaling Up Technologies for Informal Learning in SME Clusters
– WatchMe
eDidaktikum• … is a learning environment for Estonian teacher education
• … partnership between five teacher education institutions
• … aims to provide knowledge construction and sharing across the borders of educational institutions in pre-service context
• … enhances the development of informal and formal professional communities for teachers
• … supports competency-based learning


Learning Analytics in eDidaktikum (1)• Instant feedback through dashboard to:
– Learners:• Overall progress in the course based on
assignments, accessed materials, … ;• Emerged networks of students and artefacts
based on comments in weblog, replies in forum, accessed materials;
• Competency profile based on evidences in the system

Learning Analytics in eDidaktikum (2)
• Instant feedback through dashboard to: – Course designers:
• Students in fall-out position in formal courses;
• Most used and less used learning resources;
• Overview of task performance;
• Emerged networks of resources and learners;
• Competency profile of course based on evidences in
the system

Learning Analytics in eDidaktikum (3)
• Retrospective analysis in progress:
– What pedagogical patterns emerge in the eDidaktikum:
• Knowledge building – discussions, comments,
collaborative work
• Knowledge testing – mainly performing assignments;
• Knowledge storing and distributing – mainly using
eDidaktikum as repository;

Technical architecture of eD LA
• Drupal-based eDidaktikum;
• Open-source Learning Record Store Learning
Locker;
• xAPI statements between eDidaktikum and
Learning Locker
• Highcharts for visualizations on dashboards


Educational Cloud• … initiated by Estonian Ministry of Education and
Science, will be ready in the end of 2015
• … aims to develop a digital ecosystem and toolsets for
managing and accessing digital open and commercial
resources that are produced and hosted by various
content providers
• … makes use of learning analytics at the level of
secondary education

Educational Cloud• Cloud makes accessible for end-users (teachers, students
and parents) stored resources in the publishers’ servers,
learning resources repositories and different web services
(Youtube, Slideshare, Flickr LearningApps)
• End-users may create collections of (non-)commercial
resources, re-use and share them
• The system tracks interactions with these collections and
related resources and aggregated interaction data will be
collected in a learning record store.

Learning Analytics in Educational Cloud
LA dashboards for:
• Teachers and students:• Recommendations about resources to use in collection
based on subject, history of browsing collections and materials, used resources;
• Overview of collections: nr of accessing, re-using, commenting collection.

Learning Analytics in Educational Cloud• LA dashboards for:
– Representative of the repository (publishers,
existing digital learning resource repositories):• Usage of the resources in different schools: most
and least used resources, number of accessing
and using of the materials;
• Overall overview of usage of resources in
collections created by students and teachers


Dippler
• … pedagogy-driven software development project (2011 -
2013) funded by Estonian Information Technology Foundation
for Education;
• … is a digital learning ecosystem intended for use in higher
education;
• … supports: self-directed learning, competence-based
education, collaborative knowledge building, task-centered
instructional design

Learning Analytics in Dippler
• Adapted activity stream: pedagogic vocabulary added to
actors, objects, verbs
• Linking events and learning resources with tasks and learning
outcomes
• Adding semantics through domain ontology keywords
(taxonomy) and user-defined tags (folksonomy)
• Using native features of Wordpress: categories and tags


EduFeedr.net
• Tool designed for monitoring blog-based
courses
• Web-based aggregator of WordPress and
Blogspot blogposts

Hans Põldoja, 2014

Hans Põldoja, 2014


Conclusion• Learning Analytics is new for our educational sector and so far interest
object of small research group and EU funded projects
• Preparing the collaboration between Estonian and Finnish joint
educational cloud;
• Recently funded Era-Chair proposal “Cross-Border Educational
Innovation thru Technology-Enhanced Research”, aims to increase
TLU capacity in research based teacher education especially focusing
on Learning Analytics tools and methodologies;
• Plan to establish Estonian Learning Analytics SIG to involve
researchers of our universities, policy makers and industries

Used materials• Eradze, M., Laanpere M. (2013). Analysing Learning Interactions in
Digital Learning Ecosystems based on Learning Activity Streams.
http://www.slideshare.net/martlaa/ecer13-learning-interactions
• Põldoja, H. (2013). Dippler and EduFeedr: two approaches to blog-
based course. http://www.slideshare.net/hanspoldoja/2013-1004-
dippler-edu-feedr

THANK YOU!
PhD Kairit Tammets
Centre for Educational Technology
Tallinn University
Estonia
Contact: [email protected]

Learning Analytics
NL
OR oh dear how much time do I have?

Who am I● Board of Directors Apereo Foundation● Community officer Apereo LAI● Co-Chair SIG LA SURF● Program manager Learning Analytics UvA● Innovation Work Group ● I like meeting new people. ● TALK TO ME :)

Special Interest Group Learning Analyticshttps://www.surf.nl/diensten-en-producten/communitys-special-interest-groups-sigs/index.html
https://www.surfspace.nl/sig/18-learning-analytics/
S
U
R
F
https://www.surf.nl

Joining of the dots in the ecosphere
from the NL perspective
SOLARLACE
JISC
Apereo
Foundation
Universities
SURF
SIG LA
Commercial
Companies
ESUP
SchoolsKennisnet
CJKR
Grant bodies
Standards bodies
EU Consortiums
New Faces
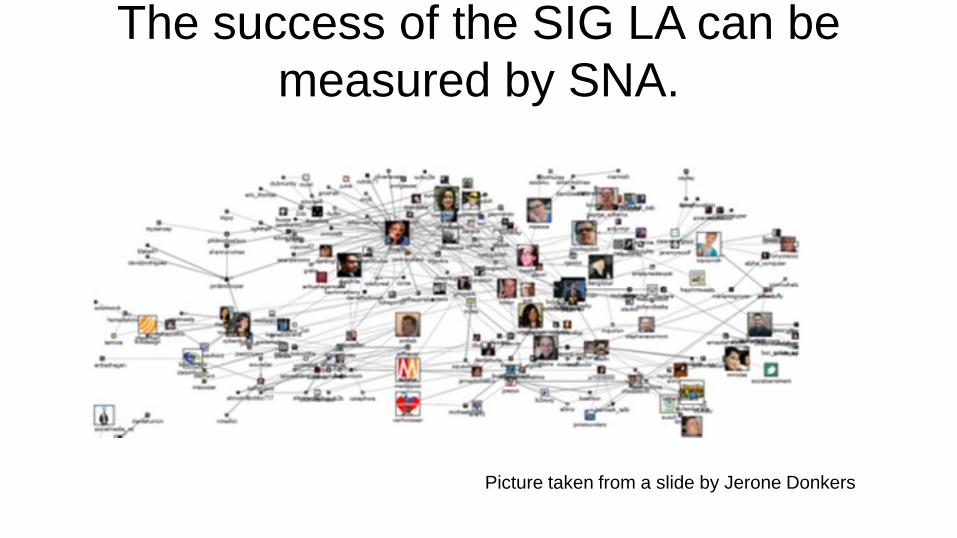
The success of the SIG LA can be
measured by SNA.
Picture taken from a slide by Jerone Donkers
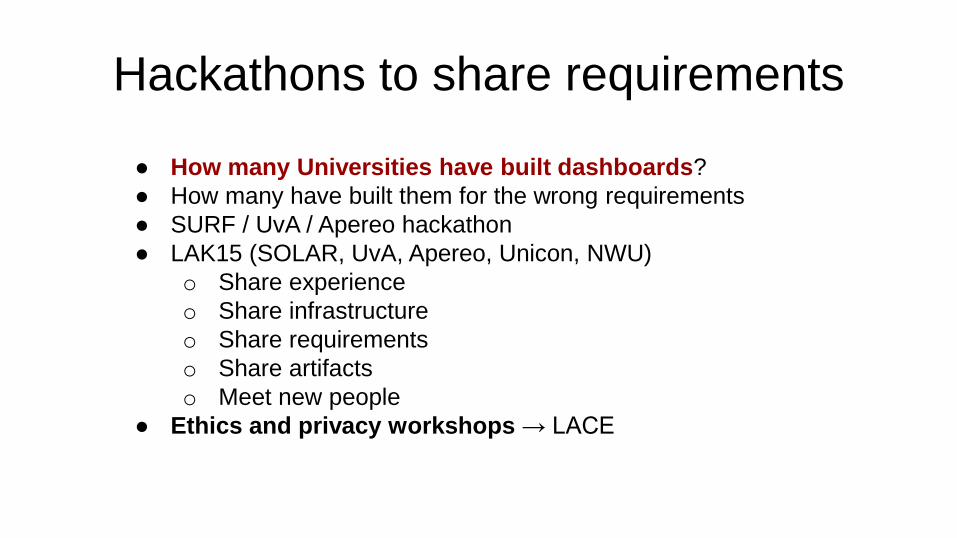
Hackathons to share requirements
● How many Universities have built dashboards?
● How many have built them for the wrong requirements
● SURF / UvA / Apereo hackathon
● LAK15 (SOLAR, UvA, Apereo, Unicon, NWU)
o Share experience
o Share infrastructure
o Share requirements
o Share artifacts
o Meet new people
● Ethics and privacy workshops → LACE


(LA is Nicely bubbling)
● Eduworks (EU consortium)
● Apereo LAI
o OAAI, Open DashBoard, LRS
o LTI, PMML xAPI (more standards please).
● Learning Record Store
● xAPI (Unicon) enabling Sakai,uPortal, Apereo OAE
● POC’s - COACH, UvAnalytics
● Hackathon, workshops.
● Focus group LA - Stefan Mol Chair
● UvAInform: Stimulation grant for 7 pilots

UvAInform
● Establish needs across the UvA Community
● Establish priorities, synergies and economy of scale
● Gain Experience with LA Infrastructure
● Generate evidence
By pilots at Facilities ± 1000 students

UvAInform
❏ Clustered Exam Feedback
❏ COACH2 (Group mirroring)
❏ Effective Comparative Feedback
❏ Goal Setting platform
❏ Validating LA in Higher ED
❏ Assignment Criteria Validation
❏ Web Lecture Statistics
❏ Learning Record Store
❏ Open Dashboard ??

Scaling up obstacle for 2016Data centralism and actions generated from the data
motivates the need for a central data
governance and innovation body.
UvA then NL?

Learning Analytics: European Perspectives
Work in FranceAnne Boyer

A short snapshot
• a community under construction– several laboratories working in LA
• some national actions– an on-going survey, with a cartography of research activity– a workgroup about data provision to research teams & ethical
questions– link with practitioners (as Esup Portail consortium)
• some national research projects– PIA 1 e-education Péricles– ANR Hubble

The PIA 1 Péricles project
• topic: quality assessment in education
• supported by "Investment for the Future” (PIA) e-education project
• beginning: November 2012
• End: May 2016
• http://www.e-pericles.org

Administrative description• coordinator: Jacques Dang (HEC) & a company ALTRAN• partners:
– 1 research team• KIWI team – LORIA lab, Université de Lorraine
– 2 digital thematic universities• Université Ouverte des Humanités• AUNEGE
– 4 companies: • e-charlemagne• Altran• Sailendra SAS• DEMOS France
– and many associated partners

Main objectives
• Design and experimentation of an open source tool – dedicated to HE institutions
– to run an quality process based on criteria selected in a public databasis or internally defined
• Personalized recommendations of learning resources or formation program in LLL

Scientific objectives
• Collection and exploitation of digital traces let by learners when interacting with a repository of OERs or with a pedagogical platform
• Design of hybrid recommenders, depending of the available data

The Hubble project
• HUman oBservatory Based on anaLysis of e-LEarning traces
• supported by the French national agency for research (ANR)
• beginning: sept. 2014• http://www.agence-nationale-recherche.fr/projet-
anr/?tx_lwmsuivibilan_pi2%5BCODE%5D=ANR-14-CE24-0015

Administrative description• coordinator: Venda Luengo (Laboratory LIG, Grenoble)• partners:
– 7 laboratories or research teams:• Equipe MeTAH, Laboratory LIG, Université Grenoble Alpes• Laboratoire LINA, Université de Nantes• Equipe Silex, Université Claude Bernard, Lyon 1• Equipe IEIAH, Université du Mans (MAINE)• Equipe EduTICE, Ecole normale supérieure de Lyon• Laboratoire STEF, Ecole normale supérieure de Cachan• Laboratoire LabSTICC, Institut de Mines Télécom, Télécom
Bretagne
– 1 company: Entreprise OpenClassrooms

Main objectives
• creation of an observatory for the construction and the sharing of massive data in e-learning, of their analysis process and their usage context
• creation of a community on Learning Analytics

Scientific objectives
• Proposition of models, languages &methods to support all users (mostly not computer scientists) in the interpretation of massive traces– traces collection and modeling
– tools to analyze traces
– means to describe analysis process for various stakeholders

As a conclusion
• About 10 labs or teams working on Learning Analytics
• An interdisciplinary community under construction

The Why and How of LACE
LAK15 Panel March 18 2015Learning Analytics European Perspectives
#laceprojectAdam Cooper
Cetis

... because it is hard to get to the top alone

Learning Analytics in Europe –some of the issues

Union Does Not Mean Uniformity
Politically
• Lisbon Treaty“supporting, coordinating or complementary actions”
• Harmonisation NOT permitted
Culturally
• Pedagogy
• Organisations
• Authority and freedom
• Privacy

Op
tim
isin
g Su
cce
ss?

We
hav
e s
om
e p
arad
oxe
sto
de
al w
ith
76

• Research
• Suppliers
• IT
• Policy
77
Silos Do Matter

Size Does Matter• Too small and too big
• Fragmented
– Research
– Ed Tech market
78

So... what are we doing?
79

Vision
Building bridges between research, policy andpractice to realise the potential of learninganalytics in EU.

Getting People Talking• Ethics and privacy
workshops• Bett• EC-TEL, LAK• EUNIS• European Parliament

Capture, write, share, sense-make
LACE website
Evidence Hub Guidance and White Papers

Modularity, Standards, Shared Infrastructure
Contribute to the
Open Learning Analytics Network1. Open Data and Models
2. Open Research
3. Open-Source Software/Platforms
4. Open Strategy and Policy
5. Open Learning Designs

Building a Mutually-supportive Network
84
LACE Network
LACE Consortium

We Work With Associated Partners To...and to:• provide mutual support in out-reach
and dissemination;• co-organise events;• co-author reports and provide peer-
review;• help to join-up communities of
educators, researchers, policy-makers, and suppliers;
• discuss emerging themes and priorities for action;
• avoid duplication of effort and maximise synergy.
run sessions like this
(thanks panel members!)

Join with us!
Credits
Eiger north face CC BY-SA 3.0 Terra3http://en.wikipedia.org/wiki/Eiger#/media/File:North_face.jpg
Map of countries in Europe CC BY-SA 3..0 San Josehttp://commons.wikimedia.org/wiki/File:Europe_countries_map_en.png
Superior Portland Cement Silos - Concrete Washington - in Autumn CC BY-SA 3.0 SkagitRiverQueenhttp://en.wikipedia.org/wiki/Concrete,_Washington#/media/File:Concrete_silos_in_autumn.jpg
A monocultivated potato field CC BY 2.0 NightThreehttp://en.wikipedia.org/wiki/Monoculture#/media/File:Tractors_in_Potato_Field.jpg
Resist Monoculture, reclaim the commons CC BY-ND Sasha Y. Kimelhttps://www.flickr.com/photos/sashakimel/8737861544/
Learning Analytics Diamond CC BY-NC-SA Aaron Zeckoski, Unicon
And with thanks to Hendrik Drachsler, OUNL, from whom I borrowed some slides and Maren Scheffel, OUNL, who took some of the LACE event photographs.
“The Why and How of LACE” by Adam Cooper, Cetis, was presented at the
LAK15 Panel “Learning Analytics European Perspectives” on March 18 2015.
The LACE Project is supported by the European Commission Seventh Framework Programme, grant 619424.
These slides are provided under the Creative Commons Attribution Licence: http://creativecommons.org/licenses/by/4.0/. Some images used may have different licence terms.
www.laceproject.eu@laceproject


