LAGOS-KANO-JIBIYA (LAKAJI) CORRIDOR … · lagos-kano-jibiya (lakaji) corridor performance:...
83
LAGOS-KANO-JIBIYA (LAKAJI) CORRIDOR PERFORMANCE: BASELINE ASSESSMENT REPORT ON THE TIME AND COST TO TRANSPORT GOODS NIGERIA EXPANDED TRADE AND TRANSPORT PROJECT (NEXTT) June 2013 This report is made possible by the generous support of the American people through the United States Agency for International Development (USAID). It was prepared by CARANA Corporation.
Transcript of LAGOS-KANO-JIBIYA (LAKAJI) CORRIDOR … · lagos-kano-jibiya (lakaji) corridor performance:...

LAGOS-KANO-JIBIYA (LAKAJI) CORRIDOR
PERFORMANCE: BASELINE ASSESSMENT
REPORT ON THE TIME AND COST TO
TRANSPORT GOODS
NIGERIA EXPANDED TRADE AND TRANSPORT PROJECT (NEXTT)
June 2013
This report is made possible by the generous support of the American people through the United States
Agency for International Development (USAID). It was prepared by CARANA Corporation.

LAGOS-KANO-JIBIYA (LAKAJI) CORRIDOR
PERFORMANCE: BASELINE ASSESSMENT
REPORT ON THE TIME AND COST TO
TRANSPORT GOODS
NIGERIA EXPANDED TRADE AND TRANSPORT PROJECT (NEXTT)
JUNE 2013
DISCLAIMER
The author’s views expressed in this publication do not necessarily reflect the views of the United States
Agency for International Development or the United States Government.

iii
CONTENTS Acronyms and Abbreviations ......................................................................................................................................... iv
Chapter 1: Executive Summary ...................................................................................................................................... 1
Chapter 2: Summary of Findings and Recommendations......................................................................................... 3
Chapter 3: Introduction and Methodology ................................................................................................................. 9
Chapter 4: Overview of LAKAJI Corridor and Lagos Port Complex ................................................................ 12
Chapter 5: Imports: Logistics Processes, Costs, and Delays ................................................................................ 25
Chapter 6: Exports: Logistics Processes, Costs, and Delays ................................................................................ 47
Chapter 7: Next Steps .................................................................................................................................................... 63
Annex 1: Interviews Conducted in Person ............................................................................................................... 64
Annex 2: Export and Import Basket Methodology .................................................................................................. 66
Annex 3: Institutions Involved in Transport and Logistics ..................................................................................... 69
Annex 4: Import and Export Steps .............................................................................................................................. 72
Annex 5: Calculations of Shipping Line Costs Passed onto the Shipper ............................................................ 75
Annex 6: Lilypond Container Terminal Tariffs 2011 ............................................................................................... 79

iv
ACRONYMS AND ABBREVIATIONS APMT APM Terminal Apapa
CCI Clean Certificate of Inspection
CIF Cost, insurance & freight
CISS Comprehensive Import Supervision Scheme
CMG Corridor Management Group
FOB Free on board
GON Government of Nigeria
ICD Inland Container Depot
LAKAJI Lagos-Kano-Jibiya
MARKETS Maximizing Agricultural Revenues and Key Enterprises in Targeted States
MT Metric ton
NAFDAC National Agency for Food and Drug Administration
NARTO Nigerian Association of Road Transport Owners
NIWA Nigerian Inland Waterways Authority (NIWA)
NCS Nigerian Customs Service
NEPC Nigerian Export Promotion Council
NESS Nigeria Export Supervision Scheme
NPA Nigerian Port Authority
NRC Nigerian Railway Corporation
NSC Nigerian Shippers Council
NEXTT Nigerian Expanded Trade and Transport Project
RAR Risk Assessment Report
SON Standards Organization of Nigeria
TEU Twenty-foot equivalent unit
TCICT Tin Can Island Container Terminal
USAID United States Agency for International Development
USD United States Dollars

1
CHAPTER 1: EXECUTIVE SUMMARY As part of the U.S. Agency for International Development’s Nigeria Expanded Trade and Transport
(NEXTT) project, CARANA Corporation and its implementing partners conducted a corridor
performance review focusing on the time and cost to import and export goods along the Lagos-Kano-
Jibiya (LAKAJI) Corridor. This baseline assessment report is an update to an earlier version of this
report conducted by USAID in 2010, with the goal of providing shippers, transporters, forwarders and
government agencies operating along the Corridor an objective snapshot of the current situation in
terms of cost and time of moving goods, so that issues impacting corridor efficiency may be
appropriately addressed via improved corridor governance and appropriate investments.
On-site data collection research for this report was conducted by a core team of five researchers who
traveled the length of the LAKAJI Corridor in a series of visits during February, March and April of 2013.
The team collected data from different sites in the eight major Corridor states of Kaduna, Kano,
Katsina, Kwara, Lagos, Niger, Ogun and Oyo, by interviewing over one hundred representatives of
shipping companies, freight forwarders, transportation companies, truckers, train operators, dry port
operators, rail operators, and numerous state and federal government representatives.
Major findings of the report include:
It costs $3,041 and takes approximately 12.5 days to export a 20 foot container along the
LAKAJI Corridor.
It costs $4,737 and takes approximately 19.5 days to import a 20 foot container along the
LAKAJI Corridor.
Over 60% of the time required to import and export goods via the LAKAJI corridor is
attributable to delays.
Approximately 50% of the cost to import and 40% of the cost to export is attributable to
inefficiencies or informal payments.
For imports, 15 out of 19.5 days required to import a 20’ container are attributable to delays in
the port (due to border clearance procedures), as well as the short transport segment from the
port to Lagos warehouses.
Transport from Lagos to Kano ($1,548) and freight forwarding fees ($885) incurred at the ports
are the largest components of costs to import.
Export costs are lower than import costs, but similarly distributed, with transport from Kano to
Lagos ($837) and freight forwarding ($587) comprising the largest components.
For imports, extra costs related to yard handling fees (including demurrage and storage)
represent 78% of the total cost, driven by lengthy border clearance times. Extra costs related to
transport from the port to Lagos warehouses represent 97% of the total cost.
For exports, the major driver of extra costs is also transport between Lagos warehouses and
the ports ($548), presenting 95% of the total cost of this part of the export process.
Informal costs (non-receipted) represent approximately 3% of the total cost to import, or $162
per 20 foot container, with the majority incurred during border clearance and transport from
Lagos warehouses to Kano.
Informal costs from Kano to Jibiya are lower in absolute terms ($32), but higher in relative
terms, and are reported to be positively correlated with the number of checkpoints on this
stretch of the Corridor.
Informal costs represent approximately 5% of total costs to export, and are valued at $139 per
20 foot container, accumulated at border clearance and checkpoints during road transport.

2
Use of the Kano Inland Container Depot (ICD) and rail could potentially save $1,195 of the
costs to import, and $816 of the costs to export.
Recommendations to improve LAKAJI Corridor performance and reduce costs of export and import
include:
At Ports
To streamline border clearance and yard handling procedures:
Implement Single Window and/or electronic dashboard for customs to enable monitoring of
clearance processes
Reform of Customs Risk Valuation system
Support development of new (or replicate existing) container tracking systems
During Transportation
To reduce congestion and delays:
Improve use of multimodal transport systems
Extend rail lines into port terminals, requiring private concessions of rail lines
Develop and use of ICDs in Ibadan and Kano encouraged
Consider investment in loading parks
Consider policies to encourage use of containers for transport to final destination point,
skipping unloading stage
Revisit truck movement policies in Lagos
Look into development/implementation of container deposit insurance
Consider improved or incentive-based trucking safety standards regulation and enforcement
Encourage GPS monitoring systems for trucks
Issue mandates to eliminate unauthorized/unnecessary checkpoints & appropriate enforcement
of these
At a National Level
To improve transparency and efficiency of transport and logistics value chain:
Encourage leadership to conduct more frequent data collection of costs and delays (including
informal fees) along the Corridor
Identify and communicate locations/sources of informal fees to address these appropriately
Increase private sector involvement to advocate for improved transparency in the transport and
logistics industry (i.e. Corridor Management Group, Nigerian Chapter of Borderless Alliance)
Improve outreach on the legal processes and fees for import and export among transport and
logistics value chain actors (i.e. Replicate West Africa Trade Hub experiences)
Develop policies (public and private) to encourage more efficient use of trucks and backhauling
Improve coordination of cargo movements (via freight exchange or similar mechanism)
Revisit policies related to registration and operation of freight forwarders
Encourage transparency through increased use of platforms for sharing data (i.e. websites,
reports, etc.)
Review and replicate international “best practices” in corridor management.

3
CHAPTER 2: SUMMARY OF FINDINGS
AND RECOMMENDATIONS In terms of the cost and time to trade goods along the corridor:
It costs $3,041 and takes approximately 12.5 days to export a 20 foot container
It costs $4,737 and takes approximately 19.5 days to import a 20 foot container
As shown in the figure below, the costs and time observed for both imports and exports in Nigeria
compare unfavorably to corridors of similar length elsewhere in West Africa and in North America.
Costs are nearly 25% higher for exports via the LAKAJI corridor as compared to the Ougadougou-
Tema corridor and almost 100% higher than the Chicago-Newark corridor. And, while the corridor is
only about 10-15% longer in distance, the time required is over 150% greater than for exporters using
the Ouagadougou-Tema corridor and 300% greater as compared to Chicago-New York. This is even
more remarkable when one considers that exporters using the Ouagadougou-Tema corridor are
required to cross an international border, whereas LAKAJI is purely a domestic corridor.
Figure 1: Comparison of Transport Costs
Approximately 60% of the time required to import and export goods via the LAKAJI corridor is
attributable to delays, while approximately 50% of the cost to import and 40% of the cost to export is
attributable to inefficiencies or informal payments. For imports, a staggering 15 out of 19.5 days are
attributable to delays in the port (most of which have to do with border clearance procedures), and the
short transport segment from the port to Lagos warehouses, where goods are typically transferred to
trucks destined for all points north. The study team looked at scenarios for goods moving through both
Apapa and Tin Can Island container terminals and differences were minimal. There are longer delays at
anchor in Apapa (16 hours) than Tin Can Island (5 hours), but both ports performed similarly against all
other metrics.
In terms of cost, transport from Lagos to Kano ($1,548) and freight forwarding fees ($885) incurred at
the ports are the largest components. Export costs are lower, but similarly distributed, with transport
from Kano to Lagos ($837) and freight forwarding ($587) also comprising the largest components.

4
The research team looked at observed costs and segmented those into “extra costs” and “optimized
costs” categories. Extra costs represent inefficiencies in both the import and export processes, as well
as informal costs. Optimized costs represent the portion of observed costs that are comparable to a
reasonable benchmark.1 On the import side, extra costs related to yard handling fees (which include
demurrage and storage) represent an extraordinary 78% of the total cost, driven by lengthy border
clearance times of customs and other government entities and yard handling procedures by terminal
operators. Extra costs related to transport from the port to Lagos warehouses represent 97% of the
total cost, driven by congestion, transportation policy (such as limiting truck movement only to night
hours), and limited reliance on containers for shipments once in-country. The major driver of extra
costs on the export side is also transport between Lagos warehouses and the ports ($548), due to the
same reasons (congestion, transportation policy, limited reliance on containers for export
transportation) presenting 95% of the total cost of this part of the export process.
Informal costs (non-receipted) to import via Apapa and Tin Can Island are estimated at $162 per 20
foot container, with the majority of informal costs incurred during border clearance and transport from
Lagos warehouses to Kano. Informal costs from Kano to Jibiya are lower in absolute terms ($32), but
given the relatively short distance from Kano to Jibiya, this is a higher cost in relative terms. In total,
informal costs represent approximately 3% of the total cost to import.
Informal costs related to exports are approximately $139 per 20 foot container, with the majority of
costs accumulated at border clearance and from checkpoints encountered during road transport. These
costs represent approximately 5% of total costs to export.
Tables 1-3 summarize all data collected as part of this baseline analysis, substantiating the findings
discussed above.
Table 1: Import, Apapa, 20’ Container
1 Benchmarks are used to provide a measure of comparison of Nigeria’s corridor performance with other countries.
African countries with similar GDP per capita are used as benchmarks whenever possible to provide comparisons
from an African context, and to assist Nigeria to compare its metrics to other countries that have implemented
corridor performance or transport and logistics reform efforts (such as Durban and the Trans-Kalahari Corridor). In
cases where data from a preferred source is not available, we use other countries for comparison.

5
Table 2: Import, Tin Can Island 20’ Container
Table 3: Export, Apapa and Tin Can Island, 20’ Container
Recommendations to Improve Corridor Performance
We have organized the most frequently cited drivers of cost and the most significant costs and delays,
the implications of these, and a list of preliminary recommendations to address these, into a table below
for easy reference. These recommendations will be reviewed and discussed by stakeholders as part of
the exercise to validate data collected for this study in late June 2013, in Nigeria.
6
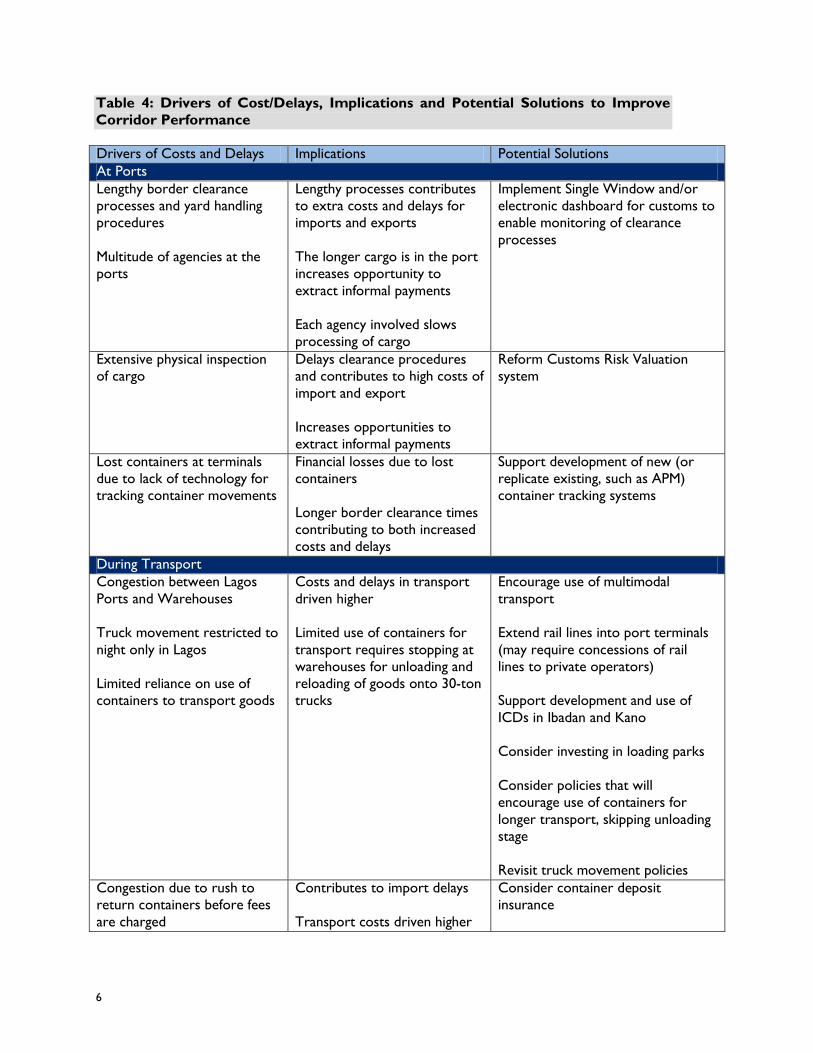
Table 4: Drivers of Cost/Delays, Implications and Potential Solutions to Improve
Corridor Performance
Drivers of Costs and Delays Implications Potential Solutions
At Ports
Lengthy border clearance
processes and yard handling
procedures
Multitude of agencies at the
ports
Lengthy processes contributes
to extra costs and delays for
imports and exports
The longer cargo is in the port
increases opportunity to
extract informal payments
Each agency involved slows
processing of cargo
Implement Single Window and/or
electronic dashboard for customs to
enable monitoring of clearance
processes
Extensive physical inspection
of cargo
Delays clearance procedures
and contributes to high costs of
import and export
Increases opportunities to
extract informal payments
Reform Customs Risk Valuation
system
Lost containers at terminals
due to lack of technology for
tracking container movements
Financial losses due to lost
containers
Longer border clearance times
contributing to both increased
costs and delays
Support development of new (or
replicate existing, such as APM)
container tracking systems
During Transport
Congestion between Lagos
Ports and Warehouses
Truck movement restricted to
night only in Lagos
Limited reliance on use of
containers to transport goods
Costs and delays in transport
driven higher
Limited use of containers for
transport requires stopping at
warehouses for unloading and
reloading of goods onto 30-ton
trucks
Encourage use of multimodal
transport
Extend rail lines into port terminals
(may require concessions of rail
lines to private operators)
Support development and use of
ICDs in Ibadan and Kano
Consider investing in loading parks
Consider policies that will
encourage use of containers for
longer transport, skipping unloading
stage
Revisit truck movement policies
Congestion due to rush to
return containers before fees
are charged
Contributes to import delays
Transport costs driven higher
Consider container deposit
insurance

7
Drivers of Costs and Delays Implications Potential Solutions
Trucks breaking down on
roads
Delay of shipments, increasing
costs
Increases congestion
Improve trucking safety standards
regulation and enforcement
Lack of control over cargo
once it is handed to truckers
Encourages use of escorts to
accompany cargo, increasing
logistics costs
Limited information on location
of cargo
Encourage GPS monitoring systems
for trucks
High number of checkpoints
along the corridor, manned by
official and unofficial agencies
Contributes to delays in
transport
Increases costs of transport
Increases opportunities to
extract informal payments
Issue mandates to eliminate
unauthorized/unnecessary
checkpoints & conduct appropriate
enforcement of these
National Level
Lack of transparency in the
transport and logistics value
chain with regards to informal
fees
Unwillingness to share data
Each actor remains ignorant of
the informal fees extracted by
others in the value chain. If no
one is knowledgeable, no one
is implicated
Contributes to costs of
imports and exports
Contributes to acceptance of
status quo of informal
payments
Conduct more frequent data
collection of informal fees along the
Corridor (i.e. Expand GIZ’ TRIMS
project to the LAKAJI Corridor)
Identify and communicate
transparently the locations/sources
of informal fees to address these
appropriately
Improve outreach on the legal
processes and fees for import and
export among the transport and
logistics value chain actors (i.e.
Replicate West Africa Trade Hub
information campaigns)
Limited controls on trucker
movements
Efficiency in trucking remains
limited
Lack of transparency on
trucker movements
contributes to costs and delays
Encourage more efficient use of
trucks to encourage backhauling
Improve coordination of cargo
movements (via freight exchange or
similar mechanism)
Informality in provision of
freight forwarding services
Increases the opportunity to
extract informal fees, increasing
costs of import and export
Reduced tax income for the
Nigerian government
Uncompetitive playing field for
registered freight forwarders
Revisit policies related to
registration and operation of freight
forwarders

8
Drivers of Costs and Delays Implications Potential Solutions
Limited data availability to
easily track time/cost to trade
Unwillingness to share data,
among public and private
entities for fear of reprisal
Continued difficulty in fully
understanding the causes of
transport and logistics
inefficiencies
Costs and delays that could be
rectified are not, increasing
these
Increase leadership in establishing
set data points to collect and
collecting these
Improve data collection techniques
and processes
Develop and roll out platforms for
sharing data (i.e. websites, etc.)
No one organization or
institution currently serving as
a strong voice for the
transport and logistics industry
Inefficiencies in transport and
logistics will not be addressed;
costs and delays will remain
higher than necessary
Increase private sector involvement
to advocate for improved
transparency in the transport and
logistics industry
Strengthen and expand Nigerian
Chapter of the Borderless Alliance,
with a working group on transport
and logistics
Strengthen and expand Corridor
Management Group with private
sector involvement focused on
replicating “best practices” in
corridor management.

9
CHAPTER 3: INTRODUCTION AND
METHODOLOGY
3.1. BACKGROUND
In an effort to understand the dynamics of corridor performance, members of the NEXTT team
conducted a series of on-site interviews between March and June 2013 to quantify the costs and time
associated with trade along the LAKAJI Corridor. Data collection efforts continued after the Nigerian
field work concluded from CARANA and Crown Agents offices in Arlington, London, Lagos and Abuja,
in the lead up to writing this report. A total of 74 people were interviewed in person, and another three
dozen were interviewed remotely or contacted via email to collect data for this study. The assessment
was a collaborative effort between CARANA Corporation and Crown Agents USA, with strategic
oversight and guidance provided by Nathan Van Dusen, and field research conducted by Amanda
Grevey, Chris Starns, Osita Aniemeka, Solomon Ogunleye, and Ndaya Yelwa. The final report is
authored principally by Amanda Grevey, with editing and research support from Amanda Fernandez,
Anne Szender and Martina Fongyen. CARANA’s Cynthia Almansi also contributed to the layout and
editing of the report.
3.2. OBJECTIVE AND RATIONALE
The specific objective of the assessment is to: i) quantify transport and logistics inefficiencies along the
LAKAJI Corridor relative to overall transport and logistics costs, and; ii) recommend and prioritize
public and private strategies to address these problems.
Inefficiencies in transport and logistics systems are major obstacles to economic growth and
development in West Africa. Inefficiencies increase supply chain costs directly, through high formal and
informal prices, and indirectly, through opportunity costs and financial costs of delay. These costs
reduce the competitiveness of exporting firms and increase prices paid by domestic consumers.
The benefits of improved flow of goods along the LAKAJI Corridor are numerous: exporters will be
better positioned to compete in world markets; efficiency savings by importing companies and traders
will be passed onto consumers in the form of lower prices; and reduced cost of food products in the
domestic market will have a positive impact on food security. Improved official channels for cross-
border trade will also incentivize formalization, benefitting informal traders through improved access to
credit, as well as the broader economy, through the government’s better capture of revenue lost due to
smuggling.
Infrastructure deficits are recognized constraints to trade in Nigeria as elsewhere in the region.
However, private sector and policy-related institutional solutions can be used to address the most
pressing sources of inefficiency which compound infrastructure challenges. Through this study, we aim
to provide recommendations on such solutions for reducing the cost of trade transactions.
3.3. METHODOLOGY
The assessment team traveled the length of the LAKAJI Corridor to catalogue transport and logistics
conditions and conduct field interviews with various private sector and public sector stakeholders.
Interviewees included trucking companies, freight forwarders/customs brokers, representatives of

10
shipping lines, terminal operators, business associations, unions, and private exporting and importing
companies. Institutional and government stakeholders interviewed included the Nigerian Customs
Service, the Ministry of Trade and Investment, the Nigerian Shippers Council, and the Nigerian Railway
Commission. Interviews were used to collect data on the average values for formal and informal costs,
as well as the time and delays taken for various procedures. Results are based on simple averages of data
provided in interviews, screened for trustworthiness and credibility.
3.3.1. ARTICULATION OF RELEVANT COSTS
This study uses as its unit of analysis a standard 20 foot container of goods, and develops an estimate of
the time (observed time) and costs (observed costs) of transporting a 20 foot container of goods along
the LAKAJI Corridor. The study further identifies inefficiencies (or “extra costs”) within the transport
and logistics by comparing the existing, observed costs to international benchmarks, and also collects
information on indirect costs that do not involve the disbursement of fees, but are generated through
delays in the transport and logistics process. Observed time and observed costs are calculated for each
stage in the transport and logistics process, including port yard procedures, customs, checkpoints and
transport. Delays are also measured, and are considered extra time (within observed time) that is
unnecessary or unjustified based on comparisons to international benchmarks.
Observed costs for imports include direct costs, which encompass both formal and informal costs.
Formal costs are official fees and legitimate charges for handling and transport. Informal costs include
bribes and un-receipted administrative charges.
Observed cost for exports is the average cost to move southbound exports from producer markets in
the north of the corridor to clearing and loading at Lagos ports. Observed costs for exports are
comprised of direct costs and indirect (financial) costs of delay.2
Extra costs include all informal charges and all indirect financial costs of delay, and any other observed
costs deemed unnecessary, unjustified, or too expensive, in comparison to international benchmarks.3
Optimized costs are the residual of the observed cost minus the extra cost.4
Table 5: Definitions of Time and Cost Categories
Time and cost
categories Definition
Observed time Average time that was spent on an activity, assuming all things were working as
usual.
Delays Extra time (within the observed time) that is considered unnecessary or
unjustified based on a variety of factors for each activity, including comparison
to international benchmarks.
2 The project’s principal focus on export competitiveness and agriculture has led the team to arrive at a basket of
export goods that we valued and then can derive an average financial cost of immobilized inventory as it concerns
exporters of those goods. Given the project focus, inventory and financial costs are not similarly applied to imports
for purposes of this study. 3 As an example of an international benchmark, Teravinthorn and Raballand provide per ton kilometer charges for
transport costs, which can be used as a proxy for what a more competitive transport sector could achieve. 4 Product loss was not included in this analysis, which is an additional significant cost of inefficient transport and
logistics.

11
Time and cost
categories Definition
Direct costs
(as part of
observed costs)5
Average fees actually paid for activities carried out, assuming that all things were
working as usual. Includes formal (receipted) and informal (un-receipted) costs.
Indirect costs
(financial cost)
Indirect costs are those do not involve the disbursement of fees. Financial cost
is an indirect cost applied to exports. It is the financial cost due to delays in the
transport and logistics process, and is calculated by multiplying the prevailing
interest rate by time of delay by the value of the shipment.
Extra costs
(direct and
indirect)
Extra costs are calculated throughout all of the processes of exportation and
importation, and include unnecessary direct costs (fees) applied to imports and
exports, in addition to all unnecessary indirect costs applied to exports.
Optimized cost The cost that would be experienced by the shipper if extra costs were
removed. It is calculated by subtracting the extra cost from the observed cost.
A more detailed discussion on the methodology of developing baskets of goods for import and export
are included in Annex 2.
5 For imports, Observed Costs equal Direct Costs. For exports, Observed Costs include Direct Costs and Indirect
Costs, or the Financial Cost.
12
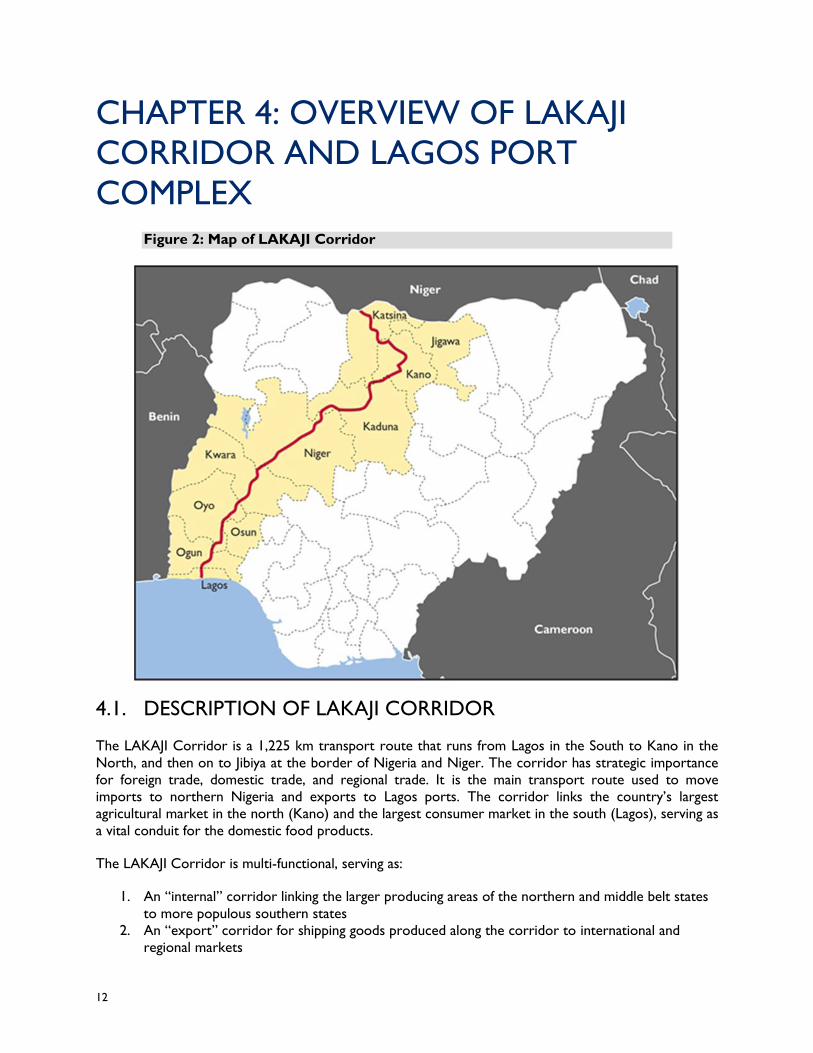
CHAPTER 4: OVERVIEW OF LAKAJI
CORRIDOR AND LAGOS PORT
COMPLEX Figure 2: Map of LAKAJI Corridor
4.1. DESCRIPTION OF LAKAJI CORRIDOR
The LAKAJI Corridor is a 1,225 km transport route that runs from Lagos in the South to Kano in the
North, and then on to Jibiya at the border of Nigeria and Niger. The corridor has strategic importance
for foreign trade, domestic trade, and regional trade. It is the main transport route used to move
imports to northern Nigeria and exports to Lagos ports. The corridor links the country’s largest
agricultural market in the north (Kano) and the largest consumer market in the south (Lagos), serving as
a vital conduit for the domestic food products.
The LAKAJI Corridor is multi-functional, serving as:
1. An “internal” corridor linking the larger producing areas of the northern and middle belt states
to more populous southern states
2. An “export” corridor for shipping goods produced along the corridor to international and
regional markets

13
3. An “import” corridor for food and other products destined for the middle and northern states
and the Republic of Niger.
In the north, Kano serves as the trans-shipment hub linking Nigeria to the West African regional market.
Time and costs identified in the transport segment for imports and exports can also be applied to goods
traded in the domestic market, as these goods travel the same route.
According to data provided by the NPA, 80% of cargo passing through Apapa Port is destined for the
Lagos Area, and only around 1% is destined for Kano.6 Shippers expressed that the actual volume is
much higher, however, because the majority of cargo that is shipped to Kano is transshipped at
warehouses in Lagos, or changes hands at Lagos markets before moving north.
Official data on export origin for corridor states was more evenly split, with around 20% of exports
originating in Lagos, 7% in Kano, 7% in Ogun, 7% in Oyo, and 1% in Kaduna. Again, these statistics likely
underestimate cargo flows and follow on research is needed to paint a more realistic picture of cargo
volumes on the LAKAJI Corridor.
The assessment team observed that the majority of products traveling north along the Corridor are
imported consumer staples, intermediate goods such as construction materials, and fuel originating at
the Lagos or Cotonou port complexes. Southbound shipments consist of mostly unprocessed or semi-
processed agricultural commodities that are being processed in the south for both human consumption
and, in the case of maize, for the rapidly growing poultry and aquaculture sectors. Key agricultural
exports, such as cocoa and sesame, are also flowing south, for the most part in unprocessed form.
Table 6: Major Commodity Flows Along the LAKAJI Corridor
Major commodity flows along the LAKAJI corridor
Northbound Southbound
Rice
Sugar
Palm oil
Fish
Packaged foods
Fuel
Fertilizer
Cement
Construction material
Live cattle
Maize
Sorghum
Millet
Groundnuts
Cashews
Shea butter
Cocoa
Cotton
Sesame
6 Data was not provided for Tin Can Island.

14
4.2. TRANSPORT AND LOGISTICS INSTITUTIONAL
FRAMEWORK7
A number of institutions are involved in the management of the ports and the transport and logistics
sectors, listed below. A description of each institution is provided in Annex 3.
Federal Ministry of Transport is responsible for marine transport (ports and inland
waterways), railways, and federal mass transit.
Nigerian Ports Authority (NPA) was created under the Nigerian Ports Authority Act No.
38, giving it powers and duties to manage and administer Nigerian ports.
Nigerian Maritime Administration and Safety Agency is responsible for regulatory and
promotional maritime mandates.
Nigerian Shippers Council was established by the Nigerian Shippers Council Act of 1977 to
promote and defend Nigerian shippers’ interests in matters affecting the shipment of imports
and exports to and from Nigeria.
Establishment of the National Transport Commission is part of a Bill that continues to
undergo consideration before passage into law.
The Nigerian Customs Services is the government agency responsible for collecting
Customs and excise duties and other fees, charges, and levies associated with international
trade.
4.3. ROAD CONDITIONS8
The Lagos–Kano–Jibiya corridor is the major route for moving goods to the north of the country, for
moving import and export commodities and supplying local markets, and for intrastate movement of
cargo. Average annual daily traffic in the corridor ranges from 17,000 vehicles between Lagos and Ibadan
in the south to 5,000 vehicles between Abuja and Kano in the north (in both directions). Heavy vehicles
account for 10% to 14% of traffic.
Members of the study team traveled along the LAKAJI Corridor, observing the conditions of roads. For
analytical purposes the corridor was divided into the following segments:
Lagos Ports to the Lagos Metropolitan Area (25 km)9
Lagos Metropolitan Area to Ibadan (115 km)
Ibadan to Illorin (155 km)
Illorin to Kaduna (485 km)
Kaduna to Kano (230 km)
Kano to Jibiya (215 km)
7 Information in this section is taken directly from the USAID MARKETS Transport Corridor Performance
Analysis Final Report of 2010. 8 Information in this section relies heavily on the USAID MARKETS Transport Corridor Performance Analysis
Final Report of 2010. 9 Researchers used Ikeja as the distance market to determine the location of the Lagos Metropolitan Area, as many
shippers have warehouses in this area.

15
LAGOS PORTS TO THE LAGOS METROPOLITAN AREA (25 KM)
Road into Lagos Ports
The road network in the Lagos metropolitan area is characterized by poor conditions and heavy and
disorganized traffic, with the arteries to the ports constantly blocked. Cargo traffic volume in the
metropolitan area can be divided in two categories: trucks that deliver the cargo to a destination within
the city limits, and trucks that cross the city for hinterland destinations. In the first group, some trucks
are responsible for the transfer of containers between the port and ICD. The rush to return containers
to port to avoid losing one’s container deposit (worth an estimated $478 for a 20’ container) often
causes significant blockages.
Some transport companies making container transfers prefer to work at night rather than spend time
stuck in traffic during the day. Congestion is due mostly to the many trucks parked on the access roads
to the ports waiting for business. Some drivers even conduct repairs on the road while waiting. Other
non-port-related activities that contribute to congestion are collection of fees from loaded trucks by
local government officials outside the port, harassment by law enforcement agencies collecting unofficial
fees, mechanics repairing broken trucks, and public transportation vehicles partially blocking lanes.
Additionally, road conditions are so poor that at times there is only one lane available for travel because
of potholes, broken vehicles, or flooding (due to burst water pipes and the absence of gutters to control
water).
LAGOS METROPOLITAN AREA TO IBADAN (115KM)
An estimated 20 million people live in the Lagos Metropolitan Area. The distance between Lagos and
Ibadan is 115 km on a dual carriageway in fair condition, with two lanes and a very narrow emergency
lane in each direction. Trucks park inappropriately on both sides of the route near small urban areas,
causing congestion and sometimes leaving only one lane operational in each direction. Drainage along
this segment seems inadequate, and when rainfall is heavy sections of the road flood. The team observed
no major traffic disruption during their trip. However, researchers report that this segment of the road
is often subject to increased traffic on religious holidays and floods, which when severe, can cause traffic
stoppage for periods up to 24 hours.

16
IBADAN TO ILLORIN (155 KM)
Road between Ibadan and Illorin
In terms of congestion in the Ibadan urban area—and all urban areas along the corridor—the road
between Ibadan and Illorin is heavily congested, disabled vehicles constantly block the road, and informal
commercial activities abound on the roadside. However, leaving Ibadan, the Government of Nigeria
recently completed the Dualization Project, linking Ibadan to Ilorin, and significantly reducing traffic
volume on the main road.
ILLORIN TO KADUNA (485 KM)
Road conditions deteriorate between Illorin and Kaduna. This segment is reportedly the worst
maintained stretch of road along the length of the LAKAJI Corridor. It is a single carriageway, with one
lane in each direction, no emergency lane, with surfacing mainly of paved gravel and dirt.
After Ilorin, surface quality worsens and many segments are gravel in poor condition. Pavement, albeit in
very poor condition, is found again after the junction that diverts traffic to Abuja or to Kaduna, 290 km
after Ibadan. The gravel and paved segments are both heavily congested, and the entire route is
vulnerable to flooding from heavy rain and inadequate sewerage overpasses that permit passage of only
one vehicle at a time and are easily covered by rising storm waters.
A poorly maintained truck fleet also affects road transport in this segment. Most trucks using the
Corridor are at least 10 years old and poorly maintained. Disabled trucks are common and block one of
the two available lanes. When the disabled truck is also a fuel tanker that has caught fire, both lanes can
be blocked for days at a time, during which time cargo movement is stalled. In some cases, when both
traffic lanes are blocked, trucks and cargo owners cause more blockage as they transfer time-sensitive
cargo to other trucks.
Heavy military roadblocks and checkpoints are found in Niger state, slowing traffic as vehicles are
checked for security. The frequency of military roadblocks and checkpoints increases as travelers
continue north.

17
KADUNA TO KANO (230 KM)
The road from Kaduna and Kano is a dual carriageway in good condition, with two lanes and an
adequate emergency lane. A bypass 58 km from Kaduna allows drivers to avoid entering the urban area
of Zaria. The bypass had no major delay or congestion. However, road and traffic conditions in and
around Kano are poor. The roads are heavily congested and the main routes are visibly deteriorated.
Kano has approximately 12 million inhabitants and is the main point of destination or origin for cargo in
the northern part of the country. Kano’s International Airport is a main point of origin of cargo headed
for all northern Nigeria destinations.
Military checkpoints are a frequent sight in both Kaduna and Kano states, as the military stops and
checks cars for security infractions, slowing traffic.
KANO TO JIBIYA (215 KM)
The road from Kano to Jibiya is a single carriageway with one lane in each direction and an emergency
lane big enough for disabled vehicles to stop without blocking traffic. This segment has a paved surface in
fair condition. Although there is a sparse flow of trucks and cargo, traveling this segment took far longer
than the Kaduna to Kano segment in terms of travel time given the high number of security checkpoints.
The team encountered 21 checkpoints between Katsina town and Jibiya, almost one checkpoint per
every two kilometers of road. Most cargo is moved informally in passenger vehicles; overloaded
minivans and medium- to heavy-duty trucks are the main users of this portion of the corridor. In
interviews, local drivers indicated that trucks move mainly at night on secondary gravel roads to cross
the border and avoid customs.
4.4. RAIL
Nigeria’s rail service from Lagos to Kano re-launched in early 2013, after improvements costing $166m.
Once an efficient and cost-effective mode of haulage and passenger transport, Nigeria’s rail system fell
into disrepair after decades of decay and mismanagement. According to the Nigerian Railway
Corporation (NRC), there are now 27-30 round-trip trains currently operating per day, which move
both people and freight, although researchers involved in this study were unable to obtain accurate data
on volume. Commodities moving north by rail include wheat (which comes direct from flour mills in
Lagos), salt, sugar, fertilizer and cement. Commodity types moving south by rail are mainly livestock and
agricultural produce, such as grains, maize, millet, beans and sorghum. The trip takes 30-48 hours on
average, with trains traveling at speeds between 40-50 km/h. Demand for freight service is high, as is the
demand for passenger service, and the NRC’s target is to achieve 80-120 trains per day.
The government has contracted China Civil Engineering Construction Company Nigeria Ltd. to
construct a standard gauge double track between Lagos and Ibadan, under the modernization of Lagos-
Kano railway project. The NRC emphasized that they are investing in upgrading the rail system, as they
prepare for public-private partnership (PPP) concessioning of the rail system into four autonomous
railways:
Western Railway: Lagos to Kano, including all branch lines when completed.
Eastern Railway: Port Harcourt to Maiduguri, including Kaduna to Kafanchan link and all branch
lines along the route.
Central Railway: From Itakpe to Warri (through Ajaokuta); and
Lagos Urban Rail Mass Transit

18
Before concessioning can happen, the 1955 Nigerian Railways Act, which confers exclusive right of
ownership of the railways to the NRC, must be repealed. Though some opine that the NRC will not
relinquish control of the rail system to the private sector, as of April 2013 a proposed bill to repeal the
act prepared by the Minister of Transport was making its way through the office of the Attorney-
General of the Federation.
4.5. INLAND CONTAINER DEPOTS
During a peak of congestion in the Lagos Port Complex in 2008, the Ministry of Transport was forced
to take extreme action to decongest the port.10 One action was the creation of Customs-bonded
storage facilities known in Nigeria as ICDs. There are cost considerations to using ICDs; an earlier study
commissioned by USAID found that the transfer from a marine terminal to an ICD cost as much as
US$400 for one 40-ft container or US$300 for one 20-ft container, taking several days when trucks are
not available. More than 20 ICDs were operational near the Lagos Port Complex in 2010, however the
efficiency of these are questioned by most interviewed as part of this study given that they have not
alleviated the transportation challenges surrounding Lagos.
However, there are six Inland Container Depots (ICDs) in the country located in Ibadan, Kano, Isiala-
Ngwa, Jos, Maiduguri and Funtua. Two of these are located on the LAKAJI Corridor (Ibadan and Kano).
Researchers found a functioning ICD in Kano, but shippers interviewed had little knowledge of the
criteria for its usage. Shippers had higher hopes for the Ibadan ICD, concessioned to Catamaran
Logistics, although not yet functional. If the improvements to the rail line come to fruition, containers
could avoid Lagos congestion and travel under Nigerian Customs Service control by rail to Kano and
Ibadan ICD sites.
The rail line needs to be extended at the ports in order for the rail and ICD system to be effective. At
the time of publishing, APM Terminal was in discussion with the NRC to extend the line into their
terminal, and expected the construction to be completed within the next year.
Single track rail line leading into Ibadan ICD Ibadan ICD under construction
10
In Nigeria, the term ICD has a broader definition than elsewhere. What is referred to in Nigeria as an ICD is
simply a Customs-bonded storage facility. Goods travel under customs control to designated ICDs, where they are
cleared by customs and picked up by transporters for delivery to their final destination.

19
4.6. LAGOS PORT COMPLEX: TERMINAL MAPS, TERMINAL
OPERATORS11
The Port of Lagos is Nigeria’s leading port. It has two main sections:
Apapa Port, site of the main container terminal
Tin Can Island Port
Apapa and Tin Can Island ports are located in Badagry Creek, which flows into Lagos Harbor from the
west.
The port complex is administered by the Nigeria Ports Authority (NPA). The National Council on
Privatization is responsible for sector reform and privatization of government enterprises, and through
its implementing agency, the Bureau of Public Enterprises (BPE), implemented port restructuring and
concessions for terminal management and operations. The concession program subdivided Apapa and
Tin Can Island ports into five terminals each and concessioned all marine terminals in both ports in
2006.
APAPA PORT
NPA manages the main Apapa entrance and grants access to all terminals.
Figure 3: Apapa Port Facilities Layout
Source: EXAF
11
As the infrastructure has not changed significantly since 2010, this section relies heavily on the same information
included in the Lagos-Kano-Jibiya Transport Corridor Performance Analysis Final Report conducted by USAID’s
MARKETS project in June 2010.
20
The original terminals were concessioned as follows:
Apapa Bulk Terminal Ltd. is the concessionaire in areas designated Terminals A and B and
using Berths 1–5. It handles bulk and general cargo, including commodities such as cement,
clincker, wheat, and fertilizer. The terminal uses hydropneumatic unloaders and a conveying
system around the clock in three shifts to move bulk cargo from ships’ holds to silos and
processing plants.
ENL Consortium is the concessionaire for Terminals C and D (Figure 2-4), which include
Berths 6–14. ENL handles and stores all types of cargo, including bulk, break-bulk, and
containerized product. Major commodities serviced include bulk cement, bulk salt, frozen fish,
steel products, bulk fertilizer, bagged rice, line and shipper’s own containers, rolling vehicles, and
all other break bulk12 products, including liquid bulk.
APM Terminal is the concessionaire for the container terminal and Berths 15–18. This
terminal is the largest dedicated container terminal in West Africa. It started operating in 2006
but was not formally commissioned until June 2008. It can operate four vessels of up to 250-
meter length overall at the same time. It operates at the berth and can serve geared and gearless
vessels. It is the largest mobile crane-operated facility in West Africa and one of the only
facilities able to accommodate the West Africa-Max (Wafmax) vessels.
Green View Development Nigeria Limited, a subsidiary of the Dangote Group, acquired
the management of Terminal E and Berths 19-20. The terminal handles bulk and general cargo.
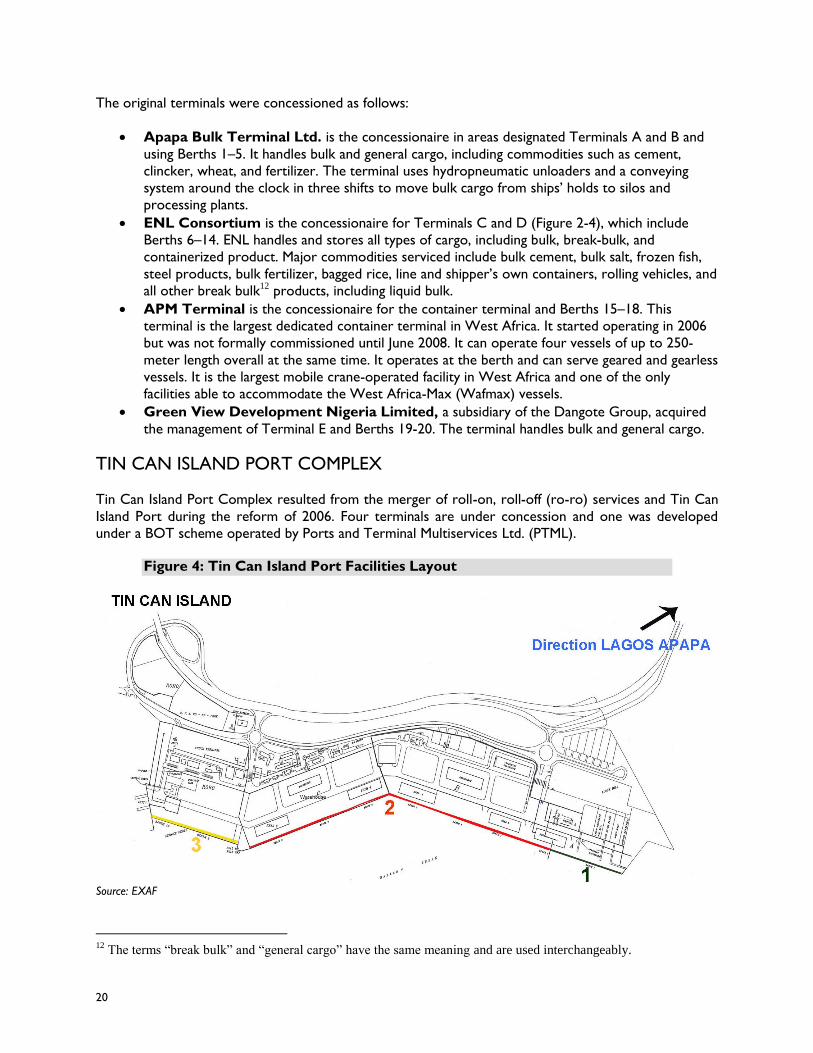
TIN CAN ISLAND PORT COMPLEX
Tin Can Island Port Complex resulted from the merger of roll-on, roll-off (ro-ro) services and Tin Can
Island Port during the reform of 2006. Four terminals are under concession and one was developed
under a BOT scheme operated by Ports and Terminal Multiservices Ltd. (PTML).
Figure 4: Tin Can Island Port Facilities Layout
Source: EXAF
12
The terms “break bulk” and “general cargo” have the same meaning and are used interchangeably.

21
Under a 10-year concession, Joseph Dam and Sons Nigeria Limited handle bulk and general cargo at
Berths 1 and 2 with about 480 m of quay length and a terminal area of about 6 hectares.
Tin Can Island Container Terminal operates containers at Berths 3–5 with a total quay
length of 770 m (of which only 550 m are operational) and a terminal area of 25 hectares. The
terminal operates mainly geared vessels. The concession to operate the terminal was granted
for 15 years.
Ports and Cargo Logistics, a subsidiary of Sifax Group, operates containers and general
cargo at Berths 6–8 with more than 790 m of quay deck and about 17 hectares of terminal area.
The concession was awarded for 10 years.
Five Star Logistics Ltd, a consortium of Comet Shipping Agencies Nigeria Ltd and its
partners, operates the ro-ro terminal using Berths 9–10 with a total length of 440 m and a
terminal area of 19 hectares. The terminal handles vehicles, containers, and break bulk cargo.
Five Star Logistics will operate it for 15 years.
PTML, a subsidiary of the Italian company Grimaldi Lines, agreed with the government of
Nigeria to build, operate, and transfer a new terminal in Tin Can Island. PTML funded terminal
construction, and in return it will operate the terminal for 25 years before transferring the
concession to the NPA. Construction included one new berth of 220 m, the paving of 220,000
sq m, a second 200-meter berth, the reclamation of 40,000 sq m of terminal area, and the
provision of all other necessary infrastructure. The multipurpose facilities handle vehicles,
containers, project cargo, and less-than-container-load cargo.
4.6.1. CARGO THROUGHPUT AND VOLUMES FOR BOTH PORTS
This section describes the volume of all exports and imports passing through both Apapa and Tin Can
ports. Below we provide a bar graph of this volume between 2007 and 2011, the latest year data is
available.
Figure 5: Port of Lagos Containerized Cargo Throughput (Thousand TEU)
Source: NPA
0
200
400
600
800
1000
1200
2007 2008 2009 2010 2011
APAPA
TCI

22
As is demonstrated by the above bar graph, throughput has increased for both ports between 2007 and
2011. Although no official data is available to confirm this assertion, a number of participants interviewed
as part of this study reported that in their opinion, throughput has decreased in 2012 given increased
security concerns. Another opinion shared with researchers is that levies on staple goods (both real and
anticipated) are also affecting total import and export traffic.
4.6.2. CONTAINER TRAFFIC 2011 FOR BOTH PORTS
To measure the volume of container traffic to Nigeria’s Apapa and Tin Can ports, the table below
provides a quick reference to each port, the flow of container traffic at each, and inward and outward
traffic.
Table 7: Container Flows at Apapa and Tin Can Island Ports
Port
Inward (imported) Outward (exported)
No.
empties
Laden T.E.U.
No.
empties
Laden T.E.U.
No. Tonn. No. Tonn.
Apapa 2 211,149 2,898,596 297,504 183,290 31,055 584,116 39,360
Tin Can
Island 6 266,629 5,129,619 376,728 203,323 32,244 616,083 44,141 Source: NPA
As can be seen from the above chart, almost no containers are imported empty to either Apapa or Tin
Can, but hundreds of thousands of containers leave Nigeria empty from both ports, demonstrating the
trade imbalance that Nigeria maintains between imports and non-oil exports of containerized goods.
Lack of ability of shipping lines to reutilize empty containers at other hub ports or key points of cargo
origin once discharged is one of the factors driving high freight rates to countries such as Nigeria.
Another metric to measure volume passing through ports and efficiency of this is to measure cargo
throughput. In terms of total cargo throughput by handling mode at these ports, Apapa Port handles
mostly bulk imports, while Tin Can Island handles mostly general cargo and containers.

23
Figure 6: Cargo Throughput by Handling Mode, Apapa Port and Tin Can
Island Port, 2011 (Tons)
Source: Nigerian Ports Authority
General Cargo is break bulk cargo that is loose and must be loaded individually rather than in bulk or in
containers. Bulk cargo is commodity cargo that is transported unpackaged in large quantities. Given
improved security, easier cargo handling, increased options for transport, protection of cargo, limited
ability to tamper with contents, ease in shipping on standard/regular shipping services, and easier cargo
tallying, international best practices suggest that countries should rely more heavily on containers to
transport goods, versus general cargo or bulk cargo. Increased use of containers would reduce the costs
related to both imports and exports to and from Nigeria. However, not all high-volume cargo is suitable
for containers (i.e. oil).
The capacity of a port terminal is defined as the maximum traffic it can handle in a given scenario. There
are various concepts of capacity, determined by the economic optimization of facilities, facility
saturation, and the minimum acceptable quality of service perceived by clients. Capacity calculation is an
important port terminal planning tool. There are a number of ways to measure capacity calculation,
including berth capacity and storage capacity. Regarding berth capacity, having an acceptable berth
occupancy ratio is an important metric to measure port capacity and efficiency.13
13
UNCTAD Presentation on The Capacity in Container Port Terminals, December 12, 2012.
ContainerGeneral
CargoBulk
Export 584,116 747,883 6,300
Import 2,898,596 5,506,145 7,632,041
0
1
2
3
4
5
6
7
8
Millio
n T
on
s
Apapa Port
ContainerGeneral
CargoBulk
Export 616,083 627,331 6,149
Import 5,129,619 7,076,072 1,647,012
0
1
2
3
4
5
6
7
8
Millio
n T
on
s
Tin Can Island Port

24
Table 8: Berth Occupancy Rates (%) at Nigerian ports in 2010 and 2011
Port / terminal 2011 2010
Occupancy Vacancy Occupancy Vacancy
Apapa 64.14 35.86 61.87 38.13
Tin Can Island 69.00 31.00 70.76 29.24
The berth occupancy rate is frequently used in port project appraisals. The term indicates the degree of
utilization of available berths. It is calculated simply by including the number of ship arrivals each year
divided by the number of berths times 100. The port’s utilization will increase if the average number of
ships each berth can service per day increases (or the average time per ship decreases) and/or the
number of berths increases. Countries should strive for the occupancy rate to be as high as possible,
without negatively affecting berth wait time, maximizing the ports’ throughput.14
14
From The Optimum Port Capacity, by World Bank Economists Jan de Weille and Anandarup Ray.

25
CHAPTER 5: IMPORTS: LOGISTICS
PROCESSES, COSTS, AND DELAYS This section analyzes the import process and all of the costs incurred, as they apply to the import basket
previously established. Time and cost are reported from the port through distribution markets in Kano,
and onto Jibiya at the Niger border.
5.1. IMPORT PROCESS
The following is a flow chart of the process to import items from the moment the ship enters Nigerian
waters to the point of distribution in the destination city. A detailed description of the steps required in
the import (and export) process is provided in Annex 4.
Figure 7: Flow Chart of Import Processes

26
5.2. SEGMENT 1: PORT
5.2.1. SCENARIO 1: APAPA, 20’ CONTAINER
The following scenario measures the time and cost related to importing a 20 foot container at Apapa
port. Data for APM Terminal is used as a proxy for all containers at Apapa Port.
5.2.1.1. OBSERVED TIME AND DELAY
Observed time to import is the average time that was spent each component of the port segment,
assuming all things were working as usual. Time is measured from when the vessel arrives at anchor
until the truck carrying the cargo passes through the port gates. Delays are extra time within the
observed time that is considered unnecessary or unjustified based on a variety of factors for each
activity, including comparison to international benchmarks.
Table 9: Observed time and delay to the shipper in the port segment of the
import logistics chain: 20’ Container, Apapa Port15
Component Observed time (hours) Delay (hours)
Anchorage and berthing 24 16
Unloading at berth 29 8.5
Anchorage and berthing total 53 24.5
Yard handling and storage
240 192 Border clearance
Forwarding
Shipping line release and delivery 48 24
Port yard operations total 288 216
Total 341 240.5
Anchorage and Berthing
Anchorage and berthing time includes a vessel’s waiting time at anchor, channel navigation time and
berthing time. At Apapa Port anchorage and berthing time is primarily comprised of the average waiting
time at anchor, since channel navigation time is negligible.
According to statistics provided by NPA, average waiting time at anchor was one day at APM Terminal
in 2012.16 This represents a significant improvement in container ship wait time since the terminal was
concessioned in 2006, when vessel waiting time was close to 24 days. APM Terminal also had the lowest
vessel waiting time of all terminals at Apapa. In 2012, the average waiting time was 3 days for ABTL,
ENL, APMT, and GDNL, with the highest wait time at ENL (see figure below).
15
Data for Anchorage and berthing and unloading at berth at APM Terminal was provided by NPA. Data on border
clearance was provided in interviews with freight forwarders, shippers, terminals and shipping lines. Average dwell
time was provided by APMT. Yard handling and storage is calculated as a residual of dwell time minus border
clearance and storage time. 16
NPA official statistics are used in the analysis, however these conflict with the current estimated wait time
provided by APM Terminal (5 hours).

27
Figure 8: Apapa Port Turnaround Time (Waiting Time + Berth Time),
January - December 2012 (days)
Source: Nigerian Ports Authority
Apapa already performs better than other West African countries on waiting time at anchor. In 2010,
waiting time at anchor for Tema was 41 hours.17 Ideally vessel waiting time should be as low as possible.
Using the 8 hour waiting time experienced at the Port of Maputo as a benchmark for what could be
obtained with even greater efficiency gains, the delay at Apapa is 16 hours.18
Unloading at Berth
Unloading at berth is approximately half the average berth time for container ships, since empty
containers are loaded onto the ship in near equal numbers as the number of imports. The average berth
time at APMT was 58 hours in 2012. Therefore the average unloading time for container vessels calling
Apapa Port is estimated to be 29 hours.
In comparison to the 20.5 hrs it takes to unload a container vessel at Tema Port, the delay at Apapa is
8.5 hours.19 The source of delay may be due to productivity of ship to shore operations. APM Terminal
did not provide operational productivity data so we are unable to pinpoint the cause of longer unloading
time at Apapa.
Yard Handling, Border Clearance, and Forwarding
We have a single time figure for yard handling, border clearance, and forwarding, since these processes
overlap. The entire border clearance process takes 240 hours (10 days), beginning when cargo is moved
from the terminal to the yard, and ending when customs release is issued. Included in these 10 days are
time spent completing the Single Goods Declaration, customs identification of the level of inspection
17
USAID “West Africa Transport Logistics Analysis Using FastPath: Tema-Ouagadougou Corridor (January 2010). 18
USAID MARKETS Lagos-Kano-Jibiya Transport Corridor Analysis (2010) 19
USAID “West Africa Transport Logistics Analysis Using FastPath: Tema-Ouagadougou Corridor (January 2010).
ABTL ENL APMT GDNL
Waiting time 2 5 1 4
Berth time 6.5 6.8 2.4 6.1
0
2
4
6
8
10
12
14D
ays

28
required, booking and waiting for a window for physical inspection, and the inspection process itself,
which usually takes several days. Customs clearance processes for imports are detailed in Annex 4.
Benchmarking against Nigeria’s 48 hour clearance goal, delay in clearance is considered to be 192 hours.
According to APM Terminal, the average dwell time for import containers is currently 12.5 days. This is
a considerable improvement from the 20 day average dwell time experienced in 2008.20 This includes 12
days of operational dwell time (time to unload the vessel and store containers in the yard), and
transactional dwell time (the time it takes to complete transactions between the importers, port
services and customs). The remaining half a day is considered to be discretionary storage time.21
Figure 9: Container Dwell Time at Apapa Port: 12.5 days
Regarding delays, customs officials emphasized the need for adequate safety checks, and blamed the
private sector’s non-compliance with trading requirements as the reason for delays in border clearance.
Freight forwarders and compliant shippers pointed to the high-level of physical inspection, estimated to
be 70% of all imports, as a major source of delays.22 They also maintained that physical inspection of
cargo creates more opportunities for customs and other government agency officials to obtain bribes.
One terminal operator said that they experienced an increased level of physical examinations when
cargo volumes dropped 20% from the peak volumes the previous year. This was believed to have
occurred due to a fear of loss of payments.
In recent years, more cargo has been routed through scanners, and the percent of physical inspections
has been reduced from 100%. Initially, this had good results: interviewees said that in the latter half of
2012, customs clearance time had fallen to 48 hours for scanned cargo. However, terminal operators
expressed the need for more investment in scanning equipment, as queues for scanning now create
bottlenecks which can perversely create longer delays than physical examinations.
Also slowing the border clearance process is a multitude of agencies at the ports, each with their own
administrative requirements and fees. Freight forwarders noted that containers can be re-examined
multiple times by different agencies, and although customs is the most visible, other agencies are often
holding up the process. In 2011, the Minister of Finance reduced the number of Agencies at the port
from fourteen to six, in order to facilitate faster clearance. Still, interfacing with the remaining six
agencies delays procedures, and some of the eight removed agencies, including National Agency for
Food and Drug Administration and Control (NAFDAC) and the Standards Organization of Nigeria
20
USAID MARKETS Lagos-Kano-Jibiya Transport Corridor Analysis (2010) 21
Discretionary storage is calculated by subtracting the operational and transactional dwell time from total dwell
time. 22
According to NCS approximately 60% of containers are physically examined, 30% are scanned, and 10 percent
are Fast Tracked. However, interviews with freight forwarders suggested that at least an additional 10% are re-
routed for physical examination after being scanned. Some respondents suggested that nearly all containers are
physically examined. We have interpreted this to mean that at a meaning that at a minimum, 70% of containers at
Apapa are physically examined.
10 2 0.50
Border Clearance
Release and Delivery
Storage

29
(SON), continue interest in operating at the ports. A single window environment could potentially assist
in facilitating smoother import procedures.
Shippers also point to the lack of automation used at the ports and a major bottleneck. Despite the
implementation of ASYCUDA, which is viewed as a great success in speeding up the clearance process,
often times processes are still conducted manually. When the server crashes, which was estimated to be
3-4 times a month, generally for a matter of hours, operations are grounded.
Lost or misplaced containers were also said to be a cause of delay during border clearance. APM
Terminal is introducing GPS tracking for containers to address this bottleneck.
Shipping Line Release and Delivery
It generally takes around 2 days for a freight forwarder to pay shipping agent and terminal invoices and
obtain delivery of their cargo. In comparison to regional best practice, delay is considered to be 24
hours. At Tema port it takes 6 hours including delays.23 At the port of Durban, it takes one day for
shippers to arrange land transport and complete exit procedures.24
5.2.1.2. DIRECT COST
Direct costs are the average fees actually paid for import activities carried out, assuming that all things
are working as usual. Direct costs include all formal (receipted) and informal (un-receipted costs).
Table 10: Direct cost to the shipper in the port segment of the import
logistics chain: 20’ Container Apapa Port
Component Formal Cost
(USD/TEU)
Informal cost
(US$/TEU)
Direct Cost to
Shipper (US$/TEU)
Anchorage and berthing 185 0 185
Unloading at berth
Anchorage and berthing total 185 0 185
Yard handling 677 20 697
Border Clearance 311 50 361
Forwarding 955 Included above 885
Shipping line release and delivery 99 0 99
Port yard operations total 2042 70 2042
TOTAL: 2228
Anchorage and Berthing
Anchorage, berthing, and unloading costs to the shipping line are passed on to the exporter in sea
freight, and to the consignee in the shipping agency’s $185 Destination Handling Charge (DHC).
Table 11: Anchorage and Berthing Costs
Anchorage and Berthing Costs 185
Shipping Agency charge 185
23
USAID “West Africa Transport Logistics Analysis Using FastPath: Tema-Ouagadougou Corridor (January 2010). 24
Kagare, Raballand and Ittmann “Cargo Dwell Time in Durban,” World Bank, September 2011.

30
Yard Handling
Yard handling for a 20’ container at Apapa Port and Tin Can Island costs $697. Within this amount are
fees charged by terminal operators, including a $290 terminal handling charge (THC), a fee for
positioning the container for customs examination, and a storage fee, which is charged until the
container is removed from the ports.25 Fees charged by the shipping agency include administrative fees
such as a documentation fee, and a fee for container cleaning. Shippers are also charged demurrage by
the Shipping Line. In Nigeria, demurrage and detention are wrapped into a single fee, which is charged
until the container is returned to the ports. Storage and demurrage are a major cost component of
containerized imports, with high fees caused by long delays in border clearance.
Interviews with freight forwarders and clearing agents identified that approximately $20 per TEU is paid
in un-receipted facilitation fees to equipment operators at the terminal, in order to ensure that their
cargo is moved quickly into the yard. Failing to provide such “tips” can mean that your cargo will be
transferred more slowly.
Table 12: Yard Handling Charges
Detail of Yard Handling Charges 697
Terminal handling charge 290
Informal fees terminal/yard 20
Positioning customs exam 65
Shipping line administrative 48
Terminal storage fees 43
Demurrage/detention 231
Shipping lines charge a deposit for containers ($478 for a 20 foot container and $955 for a 40 foot
container. Some have higher deposits for goods shipped outside Lagos). This charge is not included in
the analysis, since the deposit is returned to the shipper upon return of the container. It should be
recognized, however, that the deposit fee does affect logistics decisions made by the shipper as it
represents working capital tied up until the container is returned. High container deposits and high
transport time makes importers more likely to transship their goods in Lagos instead of transporting
containerized.
Although not included in the analysis, cargo stemmed to ICDs, including Lily Pond Terminal, are subject
to additional transfer charges. Please refer to Annex 6 for a list of additional charges.
Border Clearance
The observed cost for border clearance is $361. This includes a destination inspection fee from the
Comprehensive Import Supervision Scheme (CISS) of 1% the FOB value of the shipment. Destination
inspection programs are scheduled to expire in 2013, in which case this fee will no longer be applied.
25
The fee for positioning for customs examination depends on whether the container is physically examined,
scanned, or “Fast Tracked,” and is included here as a weighted average based on the level of inspection typically
experienced by shippers. Storage fees are charged on a two-tier scale, with days 1-3 free to the shipper. This analysis
takes into consideration storage charged up until goods are available to be loaded to exit the truck. Demurrage is
charged on a three-tier scale, with days 1-5 free to the shipper. The analysis takes into consideration demurrage
charged until the consignee takes physical delivery of the goods, plus an additional 3 days, in order to include the
average truck turnaround time for a container destined for a warehouse in the Lagos area.

31
Imports in Nigeria are also subject to a host of import duties based on the HS Code of the goods, a
Port Surcharge of 7% on top of the CIF and duty, levies on certain imports (such as sugar, rice, and
cigarettes), and 5% VAT on top of the CIF, Duty, and all other charges. Although these are significant
costs to the shipper and increase the cost of doing business in Nigeria, these costs are not included in
the analysis because they are not transport and logistics costs. Nonetheless, it should be recognized that
these fees, while viewed as an important source of government revenue, also increase the cost of
compliance and create incentives for traders to engage in bribes and smuggling.
Clearing Agents pay $50 on average in informal, “facilitation” fees (unreceipted) to customs and other
government agencies. Some use mobile phone air time cards instead of cash, which they slip on top of
their documents in the long room to ensure their shipment gets processed quickly. Although these
informal fees are paid by the freight forwarder, and are not directly billable to their client, it is assumed
that these fees are passed onto shippers within freight forwarding fees. In practice, a variety of informal
fees are paid to customs beyond these “facilitation fees,” including payments used to negotiate the
lowering of tariff duties and thus the cost of importing. Importers and clearing agents expressed that
these practices are more common at Tin Can Island than Apapa Port, however they were reluctant to
quantify these types of payments. Several interviewees said these additional informal fees could be as
much as US$318 (NGN 50,000) for a 20’ container. Other administrative fees include a MOWCA levy
and NIPOST charge.
Table 13: Border Clearance Costs
Border Clearance Total Costs 361
CISS Destination Inspection 299
Informal customs fees 50
Other admin fees 12
Forwarding
Freight Forwarders and Clearing Agents charge on average US$955 (NGN 150,000) for customs
clearance for a 20’ container. This service includes processing the importer’s Form M and handling
issuance of the Risk Assessment Report (RAR) (NGN 50,000), handling all administrative processes, and
arranging for transport (NGN 100,000). It does not include trucking costs, which are passed onto the
shipper directly. Although the freight forwarder pays informal fees at the port directly, these informal
fees are included above and thus subtracted from the average freight forwarding fee, resulting in an
average fee of $885.
Table 14: Freight Forwarding Costs
Freight Forwarding Total Costs 885
Freight Forwarding fees (less informal fees) 885
Shipping Line Release and Delivery
Importers pay an Electronic Cargo Release fee to the shipping line, also known as Bill of Lading
surrender /express release. The release process is now electronic, which allows shipper requests for
cargo to be released at destination without the presentation of original Bill of Lading.
Importers must also pay a terminal delivery charge to the terminal operator.

32
Table 15: Shipping Line Release and Delivery Costs
Release and Delivery, incl: 99
Cargo release fee 64
Terminal delivery fee 36
5.3.1.3. EXTRA COST
In this scenario we consider the cost savings to the importer if extra costs at Apapa Port were
eliminated.
Extra costs of $1,216 represent 55% of the total $2,227 incurred by importers of containerized cargo at
Apapa Port.
Table 16: Apapa Port Extra Costs
Component Observed Cost
(U$S/TEU)
Observed Cost
(% Total Port
Costs)
Extra Cost
(US$/TEU)
Extra Cost
(% Observed
Cost)
Anchorage and berthing 185 8% 18 10%
Yard handling 697 31% 544 78%
Border clearance 361 16% 50 14%
Forwarding 885 40% 604 68%
Shipping line release and delivery 99 4% 0 0%
Total 2227 100% 1216 55%
The largest absolute contributors to extra cost are the cost of freight forwarding and high fees incurred
during yard handling, such as storage and demurrage fees driven by slow border clearance. Extra costs
are also experienced during anchorage and berthing due to delays at anchor; during yard handling due to
informal fees and high destination handling charges; and during border clearance due to informal fees
paid to customs and other government agencies.
Figure 10: Extra Costs in the Port Segment for a 20’ Container
0
100
200
300
400
500
600
700
800
900
1000
Extra Cost (USD/TEU)
Optimized Cost (USD/TEU

33
Table 17: Extra Costs for Anchorage and Berthing
Extra cost: Anchorage and berthing Observed cost
(US$/TEU
Optimized cost
(US$/TEU)
Extra cost
(US$/TEU)
Total: 185 167 18
Agency DHC 185 167 18
Vessel waiting time has significantly improved in the last few years. Nonetheless, a full day waiting at
anchor is above what is considered global good practice. Using the 8 hour waiting time experienced in
the Port of Maputo, Mozambique, as a benchmark,26 the over cost per TEU for 16 additional hours at
anchor are calculated to be $18 per TEU.
Shipping Lines pass the cost of waiting at anchor to the importer in their destination handling charge.
The cost of keeping a vessel waiting at anchor is comprised of daily charter rate and operating costs.
Using the Hamburg Shipbroker's Association (VHSS) New ConTex indicator, the daily charter rate is
estimated to be $9,060 per day.27 The average operating costs for a container vessel is estimated to be
$9,583 per day.28 With an estimated 700 full TEUs moved per stay of the ship, the average cost per TEU
due to delays at anchor is calculated as $26.6 day, or $18 for 16 hours.
Also contributing to the shipping line fees are costs paid by the shipping line to the terminal operators
and to NPA. Since the shipping line must recover these costs, we assume that they are passed onto the
importer in the Agency DHC. These include Ship Dues (also referred to as “Port Dues”) which are paid
to NPA, Berth Rent, which is paid to NPA, Cargo Dues, paid to terminal operators, and additional
charges for Port Infrastructure, including harbor dues and an environmental protection levy. For the
purpose of the analysis, we assume that all shipping line fees are allocated evenly between importers and
exporters. The calculation of these fees is detailed in Annex 5. As is evident by the $180 in total fees,
these charges substantially contribute to the high agency fee charged to importers.
Table 18: Costs Paid by the Shipping Line
Ship Dues 5.97
Berth Rent 0.21
Cargo Dues 90
Harbour Dues 80
Environmental Protection 3.63
Total 179.81
26
USAID MARKETS Lagos-Kano-Jibiya Transport Corridor Analysis of 2010. 27
The New ConTex is a company-independent Index of time charter rates for container ships. It is based
on assessments of the current day charter rates of six selected container ship types, which are representative
of their size categories: Type 1.100 TEU and Type 1.700 TEU with a charter period of one year, and the Types
2.500, 2.700, 3.500 and 4.250 TEU all with a charter period of two years. Ships calling Apapa range in size from
1800 TEU to 4500 TEU. The quoted figure is an average for the months of April and May 2013, and includes all
New ConTex ship categories. 28
Source: US Department of Transportation Marine Administration, “Comparison of US and Foreign Flag
Operating Costs.” In 2011 the majority of vessels calling Lagos were foreign flag carriers. Therefore cost figures
used are for foreign ships.

34
Table 19: Extra Cost of Yard Handling
Extra cost: Yard handling Observed cost
(US$/TEU
Optimized cost
(US$/TEU)
Extra cost
(US$/TEU)
Total 697 153 544
Terminal handling 290 40 250
Terminal storage fees 43 0 43
Demurrage detention 231 0 231
Informal fees 20 0 20
Terminal handling charges are significantly higher in Nigeria than elsewhere in West Africa. At Tema
Port in Ghana, the handling charge is $40 per TEU. We have benchmarked against this $40 fee to
illustrate the extra expenses incurred at Apapa. Factors causing these high charges may include high fees
payable to NPA by the terminal operators, although we were unable to confirm this information.
Productivity of ship to shore operations may be driving costs upwards.
Regarding terminal storage and demurrage, if Apapa were to meet the stated goal of 48 hour clearance,
shippers would experience significant cost savings due to eliminated storage and demurrage fees.
The Port of Durban undertook a major customs reform effort, which effectively eliminated transactional
dwell time by making it easier for companies trying to comply with regulations, and making it harder and
more expensive for those who did not want to comply.29 It is possible to apply for an authorized
economic operator status by completing detailed interviews and supplying transparent information on
supply operations. These companies, which account for approximately 70-80% of total cargo, qualify for
a ‘green channel,’ meaning they are able to remove cargo as soon as it is handled at the port. Total dwell
time in Durban has been reduced to 4 days, with only 1 day taken for border clearance.
If Apapa Port were able to undertake similar reforms as those initiated at the Port of Durban, including
risk valuation reform, implementation of a single window environment, and increased use of IT in border
clearance, and thereby reduce clearing time to 48 hours, shippers would avoid paying $274 per TEU in
storage and demurrage alone.
Informal fees paid to terminal equipment operators for preferential unloading and transitioning of cargo
are also included as extra costs.
Table 20: Extra Costs of Border Clearance
Extra cost: Border clearance Observed cost
(US$/TEU
Optimized cost
(US$/TEU)
Extra cost
(US$/TEU)
Total 361 311 50
Informal customs fee 50 0 50
Informal fees paid to customs and other agencies are included as extra cost. As noted above, this is
likely underestimated due to the underreporting of informal fees beyond “facilitation fees.”
29
Kagare, Raballand and Ittmann “Cargo Dwell Time in Durban,” World Bank, September 2011

35
The CISS fee for imports is not included as an extra cost, but it is also not necessarily charged according
to best practice. So called "user fees" can be a good way for developing countries to finance Customs
and port operations. Ideally, however, they should meet the approximate cost of services rendered test.
World Trade Organization (WTO) members such as Nigeria must meet the requirements of GATT
Article VIII (1) which states that all administrative fees must be limited to the approximate cost of the
services rendered. It is difficult for a flat percentage fee to meet this test because a flat percentage fee
undercharges small value shipments and overcharges large value shipments.
Table 21: Extra Costs of Forwarding
Extra cost: Forwarding Observed cost
(US$/TEU
Optimized cost
(US$/TEU)
Extra cost
(US$/TEU)
Total 885 281 604
Freight Forwarding Fee 885 281 604
Freight forwarding rates are market rates for services. There is a vast supply of freight forwarders in
Lagos, which puts downward pressure on prices and keeps rates competitive. Nonetheless, rates are
higher in Lagos than elsewhere in West Africa. This may be due to complicated procedures, lack of
transparency of procedures, and high turnaround time for shipments, which means that forwarders have
to charge higher rates for handling fewer shipments.
According to the West Africa Trade Hub’s 2010 report on Tema-Ouagadougu corridor, freight
forwarding fees in Ghana were $281 (excluding informal payments) for the clearance of a 20’ container
of cooking oil. We use this as a benchmark for freight forwarding rates elsewhere in West Africa,
although further research is needed on what is causing such high freight forwarding rates in Nigeria.
Table 22: Extra Costs of Release and Delivery
Extra cost: Release and delivery Observed cost
(US$/TEU
Optimized cost
(US$/TEU)
Extra cost
(US$/TEU)
Total 99 99 0
There are no extra costs identified during release and delivery. The shipping lines’ telex electronic
release charge has made the release faster and process more efficient, and the terminal delivery charge
is competitive with regional rates.

36
5.2.2. SCENARIO 2: TIN CAN ISLAND 20’ CONTAINER
5.2.2.1. OBSERVED TIME AND DELAY
Table 23: Observed Time and Delay at Tin Can Island30
Observed time and cost of delay Hours Delay
Anchorage and berthing 13 5
Unloading at berth 31.5 11
Anchorage and berthing total 44.5 16
Yard handling and storage 240 192
Border clearance
Delivery and gate processing 48 24
Port yard operations total 288 216
Total 332.5 232
Anchorage and Berthing
Average anchorage and berthing time for containerized cargo at Tin Can Island is 13 hours.31. Using the
8 hour waiting time experienced at the Port of Maputo, Mozambique as a benchmark, the delay at Tin
Can Island is 5 hours.
Unloading at Berth
Average berth time at Tin Can Island is 63 hours. Therefore average unloading time is 31.5 hours.
Yard Handling, Storage, and Border Clearance
According to estimates provided by TICT, PCHS and 5-Star Logistics, the weighted average dwell time
by throughput at Tin Can Island is 25 days. This is nearly twice the dwell time of containerized cargo at
APMT. The 25 day dwell time includes 10 days (240 hours) of yard handling and border clearance, and
two days for shipping line release and delivery. The remainder is understood to be storage time.
Benchmarking against Nigeria’s 48 hour clearance goal, 192 hours are identified as delay.
Figure 11: Container Dwell Time at Tin Can Island (12 days)
30
Data on anchorage and berthing, berth time, and dwell time was provided by TICT, PCHS, and 5 Star Logistics.
Data on border clearance was provided by freight forwarders, shippers, terminals and shipping lines. Yard handling
and storage is calculated as a residual of dwell time minus border clearance and storage time. 31
NPA statistics on the average anchorage time for Tin Can Island for all handling modes (including Ro-Ro, bulk
and liquid bulk) is 1 day
10 2 13
Border Clearance
Release and Delivery
Storage

37
According to data provided by the terminal operators, the average dwell times for Tin Can Island are as
follows: Tin Can Island Container Terminal, 25 days; Ports and Cargo Handling Services, 28 days; and 5
Star Logistics, 17 days. Total dwell time for Tin Can Island is calculated as a weighted average for these
terminals based on container volumes.
Studies on high container dwell time in Sub-Saharan Africa suggest that high levels of discretionary
storage are often due to terminal tariff structures which encourage use of the port as warehouse space.
In Nigeria, terminal operators have introduced progressive storage rates to discourage this practice.
Rates jump from approximately $5 USD per-day for days 4-14, to $25 USD per-day at day 15, which is
around the observed time that border clearance procedures are completed. Some shippers expressed
that it does not make business sense to keep a container at port in Lagos longer than necessary, and the
reason for additional storage time may be due to lack of funds to clear goods and inadequate access to
credit facilities. Others suggested that the high figure for discretionary storage may be due to small and
medium sized enterprises which do not have well-developed supply chain management strategies or
their own warehouse facilities.
Nonetheless, it is unclear what is causing a higher dwell time at Tin Can than Apapa. Importers face
approximately the same storage and demurrage fees as Tin Can as they do at Apapa, and these fees
appear to be an effective deterrent against storage at APMT. If customs clearance is in fact the same
amount of time at TCI as Apapa, the longer dwell time may be due to an operational productivity issue
at the Tin Can Island terminals. Storage rates should also be compared to market rates for warehouse
space in Lagos in order to better identify whether high discretionary storage is caused by operational
backlog, or whether it is a cost-minimizing business decision made by importers.
5.2.2.2. DIRECT COST
Table 24: Direct Cost to Import at Tin Can Island
Direct Costs Formal Cost
(USD/TEU)
Informal cost
(US$/TEU)
Direct Cost to
Shipper (US$/TEU)
Anchorage and berthing 185 0 185
Unloading at berth
Anchorage and berthing total 185 0 185
Yard handling 677 20 697
Border Clearance 311 50 361
Forwarding 955 Included above 885
Shipping line release and delivery 99 0 99
Port yard operations total 2042 70 2042
Total 2228
Costs incurred at Tin Can Island are the same as the costs incurred at Apapa Port.
This study takes into consideration storage and demurrage fees charged until goods are available to be
picked up for removal from the ports, as discretionary storage time is understood to be a business
decision made by the shipper. While not included as a cost for yard handling, keeping a container the full
25 average days of dwell time at Tin Can dramatically increases the demurrage and detention fees
charged by the shipping line and the storage fees charged by the terminal operator. The demurrage and
storage costs for a 20’ container picked up after 12 days at Tin Can Island port are $274. These costs
escalate to $989 after 25 days.

38
5.2.2.3. EXTRA COST
Extra costs of $1,204 represent 39 % of the total $2227 incurred by importers of containerized cargo at
Tin Can Island.
Table 25: Extra Costs to Import at Tin Can Island
Component Observed Cost
(U$S/TEU)
Observed Cost (%
Total Port Costs)
Extra Cost
(US$/TEU)
Extra Cost (%
Observed Cost)
Anchorage and berthing 185 8% 6 3%
Yard handling 697 30% 544 78%
Border clearance 361 17% 50 14%
Forwarding 885 41% 604 68%
Release and delivery 99 5% 0 0%
Total 2227 100% 1204 54%
As was observed at Apapa Port, the largest absolute contributors to extra cost are the cost of freight
forwarding and high fees incurred during yard handling, such as storage and demurrage fees driven by
slow border clearance. Extra costs are also experienced during anchorage and berthing due to delays at
anchor, during yard handling due to informal fees and high destination handling charges, and during
border clearance due to informal fees paid to customs and other government agencies. These costs are
the same at Tin Can Island as at Apapa Port, with the exception of anchorage and berthing cost, which is
lower due to lower waiting time at anchor at Tin Can Island.
Figure 12: Extra Cost in the Port Segment for a 20’ Container at Tin Can
Island
0
100
200
300
400
500
600
700
800
900
1000
Extra Cost (USD/TEU)
Optimized Cost (USD/TEU

39
Anchorage and Berthing
Table 26: Extra Costs for Anchorage and Berthing, Tin Can Island
Extra cost: Anchorage and
berthing
Observed cost
(US$/TEU
Optimized cost
(US$/TEU)
Extra cost
(US$/TEU)
Total 185 179 6
Agency DHC 185 179 6
Given the average cost per container per day of waiting at anchor ($26.6/day) the cost for 9 hours of
delay passed onto the shipper is $6 per TEU.
5.3. SEGMENT 2: TRANSPORT
5.3.1. OBSERVED TIME AND DELAY
Table 27: Transport Time and Delays from Lagos Port to Jibiya
Component Observed time (hours) Delay (hours)
Transport Ports to Lagos Area 24 22
Transloading Lagos 6 0
Transport Lagos Area to Kano 96 84
Transport Kano to Jibiya 4 1
Total 130 107
It takes approximately 130 hours (5.4 days) for the transport segment for an imported container.
Ports to Lagos Area
The majority of shippers surveyed transport goods to warehouses and loading areas in the Lagos area,
where they unload the cargo and re-load it into a 30 ton truck. This is often the case for goods that
travel North on the corridor, due to the high demurrage charges that would be incurred for an 11 day
round trip to Jibiya and back. It takes on average one day to transport goods from Lagos Ports to
warehouses 25 km away in the Lagos area. The average truck turn-around time is currently three days
when shipping to a warehouse at this distance, with longer delays entering the ports than exiting.
Interviewees said in the first quarter of 2012, turnaround time reached as high as five days. Delay is
considered to be 22 hours, as it should take no longer than two hours to travel a distance of 25 km.
The primary source of delay is the extreme congestion near the ports, owing to high volume of traffic
and dilapidated road infrastructure, among other issues. Abandoned trucks clog the Apapa/Oshodi
Expressway and the access road to Tin Can Island Port and Apapa Port, posing safety risks to passersby
and increasing the cost of doing business.
Transloading Lagos Area
Freight forwarders and shippers estimate that it takes six hours to unload a container and re-load it
onto a 30 ton truck, using six people at a loading park. It takes half the time and double the cost to use
12 loaders.

40
Lagos Area to Kano
Transporting goods from a warehouse in the Lagos Area to Kano takes on average four full days, with
the majority of shippers estimating somewhere between 3 and 5 days. Transport time varied widely
however, and interviewees said that it can often take long as a week or more.
A multitude of road checkpoints and poor road conditions, particularly between Illorin and Kaduna,
contribute to the high transport time. However, shippers express that poor safety regulation of the
trucking industry and trucker unresponsiveness are the most important sources of delay. Trucking
standards are not enforced (despite many road safety checkpoints along the journey) which allows poor
quality trucks with frequent breakdowns to stay in use. Shippers complain that truckers take many
breaks along the journey, and that they have no way of monitoring their cargo or verifying claims of
blown out tires and other breakdowns. For their part, truckers are often not able to drive at night, due
to insecurity on the roads.
If truckers were able to travel the highway speed limit of 120km per hour, it would only take 8 hours to
drive from Lagos to Kano. Building in an extra 4 hours, the optimized journey should take no more than
12 hours. Therefore the delay is considered to be 84 hours, or 3.5 days.
Kano to Jibiya
The journey from Kano to Jibiya takes on average 4 hours. Freight forwarders and truckers said that
drivers unwilling to pay informal fees at checkpoints experience additional delays beyond the average 4
hours. Benchmarking against the 3 hours it took the assessment team to travel this segment in a
government convoy without having to stop at checkpoints, the average delay is identified as one hour.
5.3.2. DIRECT COST
Table 28: Direct Costs for the Transport Segment
Component Formal cost
(USD/TEU)
Informal cost
(US$/TEU)
Direct cost to
shipper (US$/TEU)
Cost per
tkm
Transport Ports to Lagos Area 541 10 541 1.20
Transloading Lagos 153 0 153 N/A
Transport Lagos Area to Kano 1548 50 1548 0.09
Transport Kano to Jibiya 268 32 268 0.07
Total 2510 92 2510 0.11
The total observed cost for the transport segment is $2510 per TEU, including $92 paid in informal fees
along the way. Informal fees are not invoiced to the freight forwarder or shipper, and are therefore
passed onto the shipper in trucking rates.

41
Table 29: Trucking Rates for Transport Segment
2013 2008
Trucking Rates Vehicle cost (US$) Cost per km (US$) Cot per km (US$)
Transport Lagos to Ports 541 21.64 22.14
Transport Lagos to Kano 2420 2.46 2.48
Transport Kano to Jibiya 446 2.07 1.29 Source: 2013 data obtained in interviews with freight forwarders, truckers, and shippers. 2008 data is from USAID Markets LAKAJI
Corridor Performance Analysis32
The above costs represent trucking fees per vehicle and are used to calculate the cost per TEU. While
cost per tkm is the most precise benchmark for transport prices, it is also instructive to examine vehicle
cost per km, since overloading practices vary in countries with minimal trucking regulation, such as
Nigeria.
Table 30: Informal Fees per Transport Segment
Length
(km) Segment Checkpoints
Informal fees
(US$)
Informal fees
per 100 km
Checkpoints
per 100 km
115 Lagos to Ibadan 1 3 2.6 0.9
155 Ibadan to Ilorin 2 5 3.2 1.3
485 Illorin to Kaduna 20 51 10.5 4.1
230 Kaduna to Kano 10 25 10.9 4.3
215 Kano to Jibiya 21 54 25.1 9.8
1200 TOTAL Lagos Area to Jibiya 54 138 11.5 4.5
Approximately $138 in informal fees are paid on the long haul of the corridor from Lagos Area to Kano
and on to Jibiya. Researchers found an average of 4.5 checkpoints per 100 km for the whole distance,
with 11.5 paid every 100 km. Truckers report paying on average $2.5 per checkpoint (NGN 400). The
highest number of checkpoints per km were reported between Kano and Jibiya.
Poorer quality roads reportedly have higher numbers of checkpoints, such as the stretch north of Illorin.
Truckers from Kano report paying higher fees in the south and vice versa (truckers from the south
report paying higher fees in the north).
The most frequently cited agencies and other parties collecting informal fees were local police and road
safety, but more research is needed to refine this conclusion.
Laying nails in the road so cars cannot pass is another frequent tactic used to extract informal payments.
Types of informal charges extracted included fees as varied as “waste basket charge”, “radio charge”,
and “safety enforcement.” Interviewees report that expensive cars and nicer trucks get stopped more
frequently, therefore incentivizing use of older, or poorer quality trucks.
32
The USAID MARKETS LAKAJI Corridor rates are cost per TEU km. Since the study assumed a 20’ container
weighs 30 tons, the costs per TEU are comparable to the costs per vehicle in this study.
Based on web mapping technology and the research team’s observations, we understand the distance from Jibiya to
Kano to be 215km and the distance from Kano to Lagos to be 985 km. The USAID MARKETS LAKAJI Corridor
report uses slightly different distance estimates for these two segments (205 km from Jibiya to Kano and 955 km
from Kano to Lagos). This variation does not substantially affect cost analysis.

42
Ports to Lagos Area
The observed costs for transporting a 20’ container from Lagos ports to a warehouse in the Lagos area
is on average $541. Included in this amount is $10 in un-receipted fees paid by truckers to gate
operators. Freight forwarders and truckers noted that gate fees vary depending upon a multitude of
factors, including the personal relationship between the freight forwarder and the gate operator.
Transloading Lagos Area
Unloading the container and loading the shipment into a 30 ton truck costs on average $153 if the
shipper is using six loaders. Loaders are paid per container, not per hour, which incentivizes faster
loading. Each loader is paid NGN 4,000.33
Lagos Area to Kano
The trucking rate for a 30 ton truck from Lagos to Kano is $2,420, which is equivalent to $1,452 for an
18 ton container load. Many shippers and freight forwarders said that they pay to have an escort
accompany their shipment, particularly on the long haul from Kano to Lagos. Lacking another method of
monitoring and tracking, such as an electronic GPS system, this provides shippers with a point of contact
who protect their shipment and notify them in case of any wrongful activity.
In a sample over 30 truckers, the average trucker experienced 44 checkpoints between Lagos and Kano,
paying on average $3 (NGN 400) per checkpoint. The estimated informal fees for this segment of the
journey is $84 per vehicle, or $50 per TEU. Some shippers avoid paying fees at checkpoints by paying
for an additional police escort at state borders, where shippers are more likely to incur fees, which
costs around $32 (NGN 5000) per escort.
Kano to Jibiya
Due to the low volume of trucks going all the way from Lagos to Jibiya, the assessment team obtained
the cost of a truck from Kano to Jibiya, and uses this as a proxy for the transport cost for the final
segment of the import journey. A 30 ton truck transporting cargo from Kano to Jibiya costs on average
$446, which is equivalent to $268 per TEU. This segment of the corridor experienced the highest
number of checkpoints per km, which is unsurprising due to cross-border security concerns. Given the
average $3 paid per checkpoint, the total informal fees for this segment is estimated to be $21.
5.3.3. EXTRA COST
SCENARIO 1: IMPROVED ROAD TRANSPORT
In this scenario we consider the cost savings to the importer if extra costs on transport segment were
eliminated. Extra costs of $1279 represent 51% of the total cost of the transport segment of the import
logistics chain.
33
If the shipper uses 12 loaders in order to reduce loading time, the cost of loading would be $306.

43
Table 31: Summary of Extra Cost Analysis
Component Observed cost
(U$S/TEU)
Observed cost (as
% of total transport
segment)
Extra cost
(US$/TEU)
Extra cost (as %
of total
observed cost)
Transport Ports to Lagos Area 541 22% 524 97%
Unloading/Loading Lagos 153 6% 153 100%
Transport Lagos Area to Kano 1548 62% 534 35%
Transport Kano to Jibiya 268 11% 68 25%
Total 2510 100% 1279 51%
The greatest inefficiencies are evident in the Lagos area, particularly in transport costs for containers
moving from Port to warehouses in Lagos, and during transshipment in Lagos, when the container is
unstuffed and cargo is loaded into a bucket truck for transport to the north.
Figure 13: Extra Cost in the Transport Segment for a 20’ Container
Full Corridor Summary
Table 32: Extra Costs for the Full Corridor
Extra cost: Full corridor Observed cost
(US$/TEU
Optimized cost
(US$/TEU) Extra cost (US$/TEU)
Total: 2510 1323 1279
Transport prices 2261 1323 938
Transloading Lagos 153 0 153
Informal fees 92 0 92
Cargo escort 96 0 96
Trucking costs for transporting a 20’ container from the Ports to Jibiya, including the cost of a cargo
escort, is $2,357, or $.11 per ton km. This is more than twice the cost observed in transport corridors
in Western Europe, and $.04 more than the cost of transport in other West African corridors, such as
-200
0
200
400
600
800
1000
1200
1400
1600
1800
Transport Ports
to Lagos
Transloading
Lagos
Transport Lagos
to Kano
Transport Kano
to Jibiya
Extra Cost (US$/TEU)
Optimized Cost (USD/TEU)
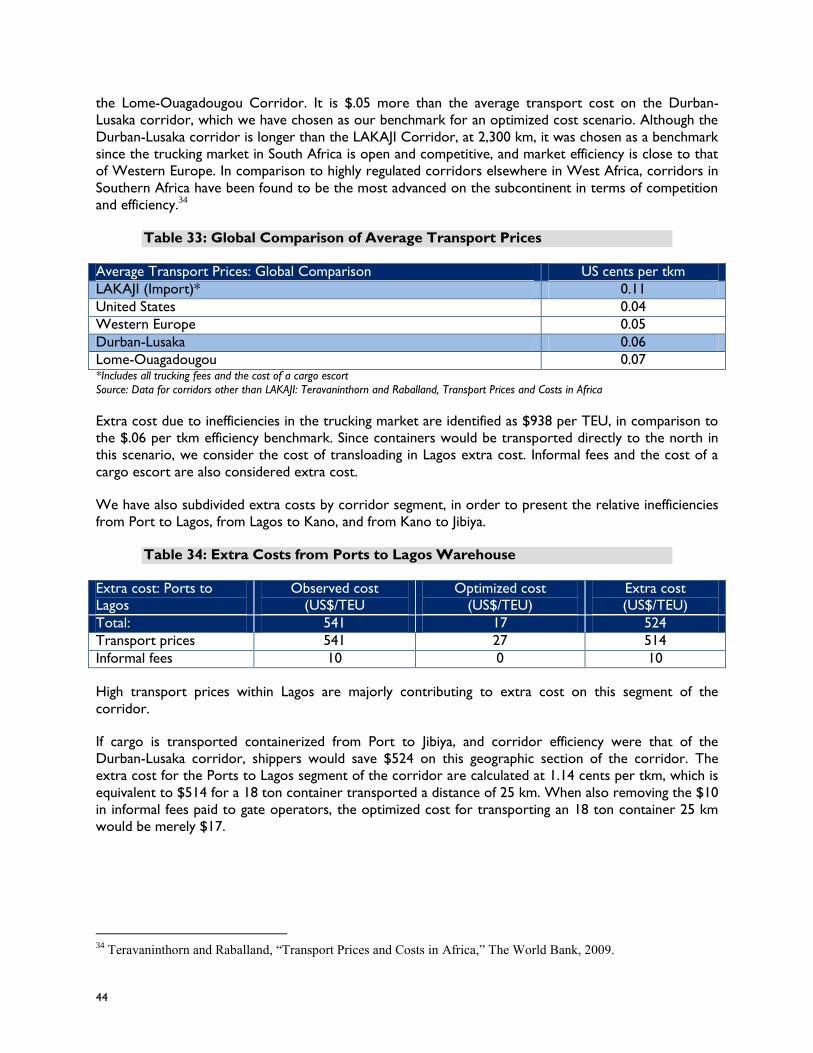
44
the Lome-Ouagadougou Corridor. It is $.05 more than the average transport cost on the Durban-
Lusaka corridor, which we have chosen as our benchmark for an optimized cost scenario. Although the
Durban-Lusaka corridor is longer than the LAKAJI Corridor, at 2,300 km, it was chosen as a benchmark
since the trucking market in South Africa is open and competitive, and market efficiency is close to that
of Western Europe. In comparison to highly regulated corridors elsewhere in West Africa, corridors in
Southern Africa have been found to be the most advanced on the subcontinent in terms of competition
and efficiency.34
Table 33: Global Comparison of Average Transport Prices
Average Transport Prices: Global Comparison US cents per tkm
LAKAJI (Import)* 0.11
United States 0.04
Western Europe 0.05
Durban-Lusaka 0.06
Lome-Ouagadougou 0.07 *Includes all trucking fees and the cost of a cargo escort
Source: Data for corridors other than LAKAJI: Teravaninthorn and Raballand, Transport Prices and Costs in Africa
Extra cost due to inefficiencies in the trucking market are identified as $938 per TEU, in comparison to
the $.06 per tkm efficiency benchmark. Since containers would be transported directly to the north in
this scenario, we consider the cost of transloading in Lagos extra cost. Informal fees and the cost of a
cargo escort are also considered extra cost.
We have also subdivided extra costs by corridor segment, in order to present the relative inefficiencies
from Port to Lagos, from Lagos to Kano, and from Kano to Jibiya.
Table 34: Extra Costs from Ports to Lagos Warehouse
Extra cost: Ports to
Lagos
Observed cost
(US$/TEU
Optimized cost
(US$/TEU)
Extra cost
(US$/TEU)
Total: 541 17 524
Transport prices 541 27 514
Informal fees 10 0 10
High transport prices within Lagos are majorly contributing to extra cost on this segment of the
corridor.
If cargo is transported containerized from Port to Jibiya, and corridor efficiency were that of the
Durban-Lusaka corridor, shippers would save $524 on this geographic section of the corridor. The
extra cost for the Ports to Lagos segment of the corridor are calculated at 1.14 cents per tkm, which is
equivalent to $514 for a 18 ton container transported a distance of 25 km. When also removing the $10
in informal fees paid to gate operators, the optimized cost for transporting an 18 ton container 25 km
would be merely $17.
34
Teravaninthorn and Raballand, “Transport Prices and Costs in Africa,” The World Bank, 2009.

45
Table 35: Extra Costs for Transloading in Lagos
Extra cost: Transloading
Lagos
Observed cost
(US$/TEU
Optimized cost
(US$/TEU)
Extra cost
(US$/TEU)
Total 153 0 153
Transloading Lagos 153 0 153
The cost of loading and unloading in the Lagos area is considered an extra cost, due to the inefficiency
associated with transshipping goods instead of transporting directly to the north containerized. If border
clearance time is reduced to 48 hours and transport time is reduced to benchmark times identified in
the time and delay section, there would be no demurrage charges incurred by the shipper, and therefore
no necessity for transshipping in Lagos. Doing so would be a business decision by the shipper, rather
than a decision driven by transport and logistics costs.
Table 36: Extra Costs from Lagos to Kano
Extra cost: Lagos to
Kano
Observed cost
(US$/TEU
Optimized cost
(US$/TEU)
Extra cost
(US$/TEU)
Total 1548 1014 534
Transport prices 1452 1064 388
Informal fees 50 0 50
Cost of Cargo Escort 96 0 96
The greatest contributor to extra cost on this segment of the corridor is trucking inefficiency. Again
benchmarking against the cost of transport on the Durban corridor (.06 cents per tkm), the extra cost
due to inefficiencies in the transport market is considered to be $388. Unofficial fees paid at checkpoints
are considered extra costs, as is the cost of a cargo escort.
Table 37: Extra Transport Costs from Kano to Jibiya
Extra cost: Kano to
Jibiya
Observed cost
(US$/TEU
Optimized cost
(US$/TEU) Extra cost (US$/TEU)
Total 268 232 68
Transport prices 268 232 35
Informal fees 32 0 32
Informal costs have a greater relative contribution to extra costs on this segment of the corridor, as
compared to other segments of the corridor. If a container were shipped straight through to Jibiya
without any transloading, and efficiency levels were the same as the Durban-Lusaka corridor, shippers
would save $35 on this segment of the corridor. With the additional $32 saved in informal fees, the
overall extra cost for this segment is $68.
SCENARIO 2: USE OF RAIL
In this scenario, we identify cost savings to the shipper when using rail and the Kano ICD. If the rail lines
are extended into the terminals, and trains begin to run more regularly allowing shippers to take
advantage of rail, the cost to the shipper would be $1,315, saving the shipper $1,195 in extra cost.

46
Table 38: Extra Costs, Road vs. Rail
Extra cost: Road vs.
rail
Observed cost
(US$/TEU
Optimized cost
(US$/TEU)
Extra cost
(US$/TEU)
Total 2510 1315 1195
Transport prices 2261 1365 896
Unloading/loading 153 0 153
Informal fees 82 32 50
Cargo escort 96 0 96
The NRC said that the cost of rail transport from Lagos to Kano is currently $.045 per tkm (NGN 7.1
per tkm), plus cost of insurance at .25% consignment value. Keeping all other conditions constant on the
corridor, including the vehicle transport cost from Kano to Jibiya and the informal fees along the way,
using rail from Lagos to Kano would save the shipper $1195.35 The cost savings would come from the
reduced transport fee, in addition to savings incurred by not transshipping in Lagos, and avoiding
informal fees on the long haul to Kano.
Shippers would also experience additional time savings. NRC estimates that it takes 30-48 hours on
average, and 72 hours at maximum. Even the worst case scenario is a day shorter than current road
travel time.
Additionally, intermodal competition would have an impact on trucking rates: the absence of rail
services creates opportunities for the trucking industry to inflate prices. In their study on transport
prices and costs on international corridors in Africa, Teravaninthorn and Raballand found that in
countries where a competitive transport market exists, rail competition plays a role in setting transport
prices. Likewise, actual or potential competition from road operators also limits the railways’ pricing
power. This is the case on the Mombasa-Nairobi and Mombasa-Kampala corridors, where rail prices are
comparable to road prices.36 We expect that the same phenomenon would occur in Nigeria if rail lines
are concessioned to private operators, since Nigeria has a competitive trucking market (unlike most
other West African countries, such as Ghana, which are heavily regulated).
35
This figure does not include VAT which is extra. Transport cost to Kano calculated to be $972. Insurance for the
import basket calculated to be $125. Cost to transport from Kano to Jibiya: $268. 36
Teravaninthorn and Raballand, “Transport Prices and Costs in Africa,” The World Bank, 2009.

47
CHAPTER 6: EXPORTS: LOGISTICS
PROCESSES, COSTS, AND DELAYS This section analyzes the export process and all of the costs incurred, as they apply to the export basket
previously established, from Jibiya through Kano, Lagos and to the Lagos port gates.
6.1. EXPORT PROCESS
The following is a flow chart of the process to export items from the point of departure in Jibiya to the
Lagos gates.
Figure 14: Flow Chart of Export Processes
6.2. SEGMENT 1: TRANSPORT
6.2.1. OBSERVED TIME, DELAY AND INDIRECT COST OF DELAY
Observed time is the average time spent on each component of the export transport segment, assuming
all things were working as usual. Time is measured from departure in Jibiya until delivery of cargo at the
port gates. Delays are extra time within the observed time that is considered unnecessary or unjustified

48
based on a variety of factors for each component, including comparison to international benchmarks.
The indirect cost of delay is the financial cost to the exporter due to delays in the transport process.
Table 39: Observed Time and Delay of Exports
Component Observed time
(hours) Delay (hours)
Indirect Cost of
Delay (USD)
Transport Jibiya to Kano 4 1 1
Transport Kano to Lagos 96 84 61
Transloading Lagos 72 0 0
Transport Lagos to Ports 48 46 34
Total 220 131 96
Transport times for southbound cargo on the LAKAJI Corridor are the same as transport times for
northbound cargo, with the exception of time for transloading in Lagos.
JIBIYA TO KANO
Transport from Jibiya to Kano takes 4 hours in a 30 ton bucket truck, with 1 hour identified as delay
due to time spent at checkpoints. We estimate the indirect financial cost of delay to the exporter as
minimal ($1) as part of this segment of the export process.
KANO TO LAGOS
Transport from Kano to Lagos takes 96 hours (4 days) in a 30 ton bucket truck, with 84 hours (3.5
days) identified as delay, benchmarking against 12 hours as the optimized travel time.37 The indirect cost
of delay is calculated at $61.
TRANSLOADING AND CONSOLIDATION IN LAGOS
Most export shipments are consolidated at Lagos warehouses before being transported to the ports.
Based on data collected, his transloading and consolidation segment takes an average of 72 hours (3
days) to complete. Steps included in this stage include unloading, inspection, reloading (a.k.a. stuffing),
and inspection for issuance of a clean certificate, all steps required before goods can be transported to
the port.
Some exporters exceed this three day average of time spent in this stage, if the export good or
commodity they are exporting requires additional processing and/or drying procedures at this stage.
However, for purposes of this study, these additional processing steps are commodity/product specific,
and are not considered a logistical issue, so time involved in completing these steps is not included in
this baseline study.
In a typical case of this segment of the export process, on day one, unloading takes place. Depending on
the number of loaders employed, unloading and re-loading goods (stuffing) can take between 3 hours
and a day and a half. Based on the average case using six people, we estimate that it takes 6 hours to
37
This is the same benchmark used for this segment of the corridor for imports. If truckers were able to travel the
highway speed limit of 120km per hour, it would only take 8 hours to drive from Lagos to Kano. Building in an
extra 4 hours, the optimized journey should take no more than 12 hours

49
unload one truck. One day is estimated for the time required to complete pre-shipment export
procedures. The third day is spent stuffing the container, completing quality inspection, and loading.
Regarding quality inspection, pursuant to the Nigerian Export Supervision Scheme (NESS),
representatives from Cobalt International Services Limited, a privately contracted pre-shipment
inspection agent contracted in October 2004 for the inspection of all non-oil exports, must be present
for the stuffing and sealing of the container. NESS requires the inspection of all products intended for
export to ensure that the quality of products meets the standards of quality required by the
international market. In order to minimize delays and avoid multiple examinations, representatives from
other organizations, including NCS, SON, NAFDAC, and NDLEA are encouraged to also attend the
inspection and stuffing. In practice, shippers said that sometimes these organizations are not present.
Once the container has left this stage and is at the port, the shipper will wait for Cobalt to issue the
Clean Certificate of Inspection (CCI), which certifies that quality, price, and quantity of the goods being
shipped are the same as what is contained in the contract document. The CCI is generally issued within
3 days of the original inspection, which takes place during the stage described above.
No delays emerged from interviews when conducting research for this stage of the export process,
which is why none are reported in the above table.
LAGOS TO PORTS
Based on data collected, transport from the point of container pick-up at Lagos warehouses to drop off
at the port takes an average of 2 days (48 hours). Delays are longer entering the port than exiting the
port, which shippers and freight forwarders attribute to the restrictions on truck movements during the
daytime. In early 2012, due to heavy congestion, the Lagos state governor placed a ban on trucks
entering the Lagos metropolitan area from 6 am to 9 pm. This has led to a practice where trucks queue
to enter the port, all at the same time.
The delay for this segment of the export process is estimated at 46 hours (1.92 days), which is
calculated by subtracting the 2 hours of optimal time to drive a distance of 25 km (the same benchmark
utilized for imports on this segment) from the observed time of 48 hours it takes to complete this
segment of the export process. The indirect cost of this delay is calculated at $34.
6.2.2. DIRECT COST
Direct costs are average fees actually paid for export activities carried out, assuming all things are
working as usual. Direct costs include all formal (receipted) and informal (un-receipted) costs.
Based on data collected, exporting goods from Jibiya to the Lagos Ports has a calculated direct cost to
the shipper of $1,570 per TEU. This direct cost of $1,570 includes the $79 of informal fees per TEU that
are paid by truckers in informal fees. The direct cost per ton kilometer for the entire Corridor is
calculated at $.08 (this represents the formal cost divided by tonnage, divided by total kilometers).

50
Table 40: Direct cost to the shipper in the transport segment of the export
logistics chain
Component Formal cost
(USD/TEU)
Informal cost
(US$/TEU)
Direct cost to shipper
(US$/TEU)
Cost per ton
kilometer
Transport Jibiya to Kano 253 31 253 0.07
Transport Kano to Lagos 776 48 776 0.045
Transloading Lagos 318 0 318 N/A
Transport Lagos to Ports 541 10 541 1.20
Total 1570 79 2414 0.08
JIBIYA TO KANO
The transport cost per 17 ton TEU from Jibiya to Kano is $253. This cost is based on a trucking rate of
$446 for a 30 ton truck (see Table 42 below), which was found to be the same rate for a truck going in
the opposite direction from Kano to Jibiya. Truckers pay an estimated $31 per TEU in informal fees at
checkpoints along the way. The cost per tkm for this specific segment of the Corridor is $.07.
While cost per tkm is the most precise benchmark for transport prices, it is also instructive to examine
vehicle cost per km, since overloading practices vary in countries with minimal trucking regulation, such
as Nigeria. The direct cost per vehicle km for this segment of the corridor is currently $2.07, which is
over three times the cost observed in 2008 (Table 41) This cost increase may be due to increased
insecurity in the north.
Table 41: Trucking Rates and Cost per Km in 2008 and 2013
2013 2008
Trucking rates Vehicle cost
(US$) Cost per km (US$)
Cost per km
(US$)
Jibiya to Kano 445.86 2.07 0.59
Transport Kano to Lagos 1210.0 1.23 1.08
Transport Lagos to Port 541 21.64 22.14 Source: 2013 data obtained in interviews with freight forwarders, truckers, and shippers. 2008 data is from USAID Markets LAKAJI
Corridor Performance Analysis38
KANO TO LAGOS
As seen in Table 40, the transport cost per TEU for the long haul from Kano to Lagos is $776, which is
about half the cost for an imported container on the same segment of the corridor. This figure includes
the vehicle cost and the cost of a cargo escort, appointed to ensure cargo safety. Informal fees in this
segment of the corridor are equivalent to $48 per TEU, based on $84 paid per 30 ton truck. The cost
per tkm is $.045, which is $.04 less than the cost of transporting imports the same distance. The
reduced cost of transport for southbound trucks is attributed to the fact that these trucks are able to
find loads in Lagos to backhaul to Kano, while northbound trucks generally return to Lagos empty.
The vehicle cost per km in 2013 is slightly more than the cost observed in 2008, although still quite
close, with a difference of only $.15 per km.
38
The USAID MARKETS LAKAJI Corridor rates are cost per TEU km. Since the study assumed a 20’ container
weighs 30 tons, the costs per TEU are comparable to the costs per vehicle in this study.

51
TRANSLOADING LAGOS
Shippers and freight forwarders estimated the cost of transloading in Lagos to be $318. This amount
includes the cost of labor for unloading the cargo from the first truck for storage at the warehouse, and
the cost of labor for stuffing the cargo into a container for final delivery to the port. Although the NESS
quality inspection occurs at this stage, the associated fee is included in the port segment of the analysis
since it is an official control procedure.
LAGOS TO PORT
To transport a 20’ container from the Lagos area to the port is $541 per TEU, with $10 in informal fees
paid at the port gate. The cost per TEU and vehicle cost are the same, since the shipment is transported
containerized on a flat platform truck. The cost per km observed here is slightly less than the cost per
km observed in 2008 for the same type of truck.
6.2.3. EXTRA COST
SCENARIO 1: IMPROVED ROAD TRANSPORT
In this scenario we consider the cost savings to the exporter if extra costs on transport segment were
eliminated. Extra costs in the transport segment for export containers include the indirect costs of delay
and direct costs identified as extra cost. Extra costs of $787 represent 41% of the total cost of the
transport segment of the export logistics chain.
Table 42: Extra Costs of Transport for Export Containers
Component Observed cost
(U$S/TEU)
Observed cost (as %
of total transport
segment)
Extra cost
(US$/TEU)
Extra cost (as %
of total
observed cost)
Transport Jibiya to Kano 254 13% 66 26%
Transport Kano to Lagos 837 42% 173 21%
Transloading Lagos 318 16% 0 0%
Transport Lagos to Ports 575 29% 548 95%
Total 1984 100% 787 40%
The most significant inefficiencies in the transport segment are observed between Lagos and the ports.
While this segment encompasses 29% of the total cost on the corridor, approximately 95% of this cost
component is identified as extra cost. The calculation of extra costs is elaborated below.

52
Figure 15: Extra Cost in the Transport Segment for a 20’ Container
Jibiya to Kano
Table 43: Extra Costs of Transport from Jibiya to Kano
Extra cost: Jibiya to Kano Observed cost
(US$/TEU)
Optimized cost
(US$/TEU)
Extra cost
(US$/TEU)
Total 254 188 66
Indirect cost of delay 1 0 1
Transport prices 253 219 34
Informal fees 31 0 31
If transport efficiency were improved on this segment of the corridor, one hour of delay and the
associated $1 per TEU in indirect cost (see table above) would be eliminated.
If we compare the cost per tkm for this segment of the corridor (.07) to an international benchmark,
such as the cost per tkm on the Durban-Lusaka corridor (.06), we could assume potential savings to the
shipper in an optimized scenario, and then estimate the extra cost per TEU as $66. These extra costs
may not be caused solely by inefficiencies in the transport and logistics system: insecurity may be driving
up the cost of transport on this segment of the LAKAJI corridor.
Truckers report paying an average of $31 per TEU at checkpoints on this segment of the corridor,
which are passed onto the shipper in trucking rates. The high number of security checkpoints on this
segment presents more opportunities for collection of un-receipted fees.
0
100
200
300
400
500
600
700
800
900
Transport Jibiya
to Kano
Transport Kano
to Lagos
Transloading
Lagos
Transport Lagos
to Ports
Extra Cost (US$/TEU)
Optimized Cost (USD/TEU)

53
Kano to Lagos
Table 44: Extra Costs of transport from Kano to Lagos
Extra cost: Kano to Lagos Observed cost
(US$/TEU)
Optimized cost
(US$/TEU)
Extra cost
(US$/TEU)
Total 837 664 173
Indirect cost of delay 61 0 61
Informal fees 48 0 48
Cost of Cargo Escort 64 0 64
The high indirect cost of delay for cargo traveling from Kano to Lagos area is essentially an extra cost to
the shipper.
We do not include transport prices as an extra cost for this segment of the corridor, since transport
costs for southbound cargo are quite competitive in comparison to international benchmarks. The $.046
cost per tkm is not only lower than the cost experienced on the Durban-Lusaka Corridor, it is slightly
lower than the cost of transport in Western Europe ($.05). The cost for import cargo traveling the
same distance from Lagos to Kano costs around twice this amount ($.09).This is a clear indication of the
benefits to shippers when using trucks that backhaul.
However, a low cost per tkm is not necessarily indicative of an optimally functioning transport market.
Many trucks on the road are in poor condition, and should not be carrying 30 ton loads. Overloading
beyond truck capacity makes the corridor appear to have higher freight-carrying performance despite
slower speeds, and higher road provision costs. Clearly, overloading has other negative consequences
which we were unable fully monetize in this study: one major shipper reported that 20% of product
losses were attributed breakdowns and missing trucks.
As is seen in table 45, an average of $48 per TEU is paid in informal fees at checkpoints, and $64 per
TEU goes toward the cost of a cargo escort. In this study, these are considered inefficiencies which
increase the cost of conducting trade in Nigeria.
Transloading Lagos
Table 45: Extra Costs Transloading Lagos
Extra cost: Transloading Lagos Observed cost
(US$/TEU)
Optimized cost
(US$/TEU)
Extra cost
(US$/TEU)
Total 318 318 0
There were no extra costs reported at the loading stage, however additional research could be
undertaken to identify best practices in unstuffing and truck loading in order to determine where
shippers can minimize costs.

54
Lagos to Ports
Table 46: Extra Costs from Lagos to Ports
Extra cost: Lagos to Ports Observed cost
(US$/TEU)
Optimized cost
(US$/TEU)
Extra cost
(US$/TEU)
Total 575 27 548
Indirect cost of delay 34 0 34
Transport prices 541 27 514
Informal fees 10 0 10
As per the above, the financial cost of delay to the exporter is calculated to be $34.
Using the same benchmark from the import section on transport efficiency, the cost per tkm in Durban
(.06), transport prices include extra costs of $514. This should be understood as a theoretical cost of
improved transport: actual transport costs for the short-haul in the Lagos area would likely be greater
than the optimized cost on the Durban long-haul. Nonetheless, the analysis highlights the relative
inefficiencies in Lagos versus the rest of the corridor.
Informal fees paid by the trucker at the port gate ($10) also represent extra costs which ultimately
increase transport costs to the shipper.
SCENARIO 2: RAIL AND KANO ICD
We estimate that shippers would save $816 on this segment of the export logistics chain if they were
able to complete export procedures in the north (including pre-shipment inspection), and ship their
cargo containerized by rail through the Kano ICD to Lagos Ports. In other words, instead of paying the
current estimated $1,957 for the entire trip, they would pay $1,162, assuming the journey from Jibiya to
Kano stays the same and the associated indirect fees and inefficiencies untouched.
In this scenario, the observed cost is the current cost that exporters experience, the optimized cost is
the cost of rail transport, and the extra cost is the difference between the two.
Jibiya to Kano
Table 47: Extra Costs from Jibiya to Kano
Extra cost: Jibiya to Kano Observed cost
(US$/TEU)
Optimized cost
(US$/TEU)
Extra cost
(US$/TEU)
Total 254 254 0
Indirect cost of delay 1 1 0
Transport prices 253 253 0
informal fees 31 31 0
For the purposes of demonstrating the cost savings of rail transport alone, we have kept the costs
associated with the journey from Jibiya to Kano constant. Reducing inefficiencies on this segment would
result in additional cost savings to the shipper (as identified above in scenario 1: improved road
transport).

55
Kano to Ports
Table 48: Extra Costs from Kano to Ports
Extra cost: Kano to ports Observed cost
(US$/TEU)
Optimized cost
(US$/TEU)
Extra cost
(US$/TEU)
Total 1730 913 816
Indirect cost of delay 95 25 70
Transport prices 1317 1000 317
Informal fees 58 0 48
Cost of Cargo Escort 64 0 64
Transloading Lagos 318 0 318
It takes a maximum of 48 hours for cargo to travel by rail from Kano to Lagos Ports. If we use 14 hours
as the benchmark for optimized time for road travel between Kano and Lagos Ports (12 hours from
Kano to Lagos and 2 hours from Lagos to Lagos Ports), the delay associated with rail transport (48-12-2
hours) is 34 hours. The indirect cost of delay for the rail (the optimized scenario) is therefore calculated
at $25.
Observed transport prices include the cost of transport from Kano to Lagos and Lagos to Ports. With
the rail cost of $.05 per tkm, there are no savings to the shipper between Kano and the Lagos Area. The
cost of rail is higher when you take into account added insurance costs. However, large savings are
incurred between Lagos and the Ports. On this segment, using rail saves the shipper $315. This indicates
that the rail extension into the port terminals is a necessary condition for transport savings – it does not
make business sense for a shipper to use rail unless they can eliminate the need for additional transport
in Lagos.
Other cost advantages of the rail scenario are the savings associated with not having to pay informal fees
at checkpoints, not having to use a cargo escort, and not having to transload cargo in Lagos.
6.3. SEGMENT 2: PORT
Since average time and cost are approximately the same for exports leaving Apapa and Tin Can Island
ports, and since export volumes are significantly lower than import volumes, we have included one time
and cost scenario for exports leaving both Apapa and Tin Can Island. Where time and cost are different,
they are averaged to create a single value for both ports.
6.3.1. OBSERVED TIME, DELAY, AND INDIRECT COST OF DELAY
Observed time is the average time spent on each component of the port segment for exports, assuming
all things were working as usual. Time is measured from the transfer of the container from truck to
yard, through the vessels departure at the port. Delays are extra time within the observed time that is
considered unnecessary or unjustified based on a variety of factors, including comparison to
international benchmarks. The indirect cost of delay is the financial cost to the exporter due to delays in
the port process.

56
Table 49: Summary of Observed Time, Delay and Indirect Costs to Shippers
Component Observed time
(hours) Delay (hours)
Indirect Cost to
Shipper (US$/TEU)
Border clearance
48 44.5 32 Forwarding
Yard handling
Port yard operations total 48 44.5 32
Loading at berth 30 9.5 7
Channel operations 3 0 0
Anchorage and berthing total 33 9.5 7
Total: 81 54 39
Border Clearance, Forwarding and Yard Handling
Time for border clearance, forwarding and yard handling at the port is measured together, since these
processes occur simultaneously.
Border clearance procedures at the port take on average two days for a proactive shipper who
completes all processes as early as possible (we observed a range between one and three days). The
majority of export procedures are completed before the shipment arrives at port, including registration
with the Nigerian Export Promotion Council (NEPC), completing the Nigerian Export Proceeds Form
(Form NXP), and undergoing quality certification inspection. These processes are further elaborated in
Annex 4. After goods are moved to the port of shipment, the goods will undergo NCS documentation
and examination. Documentation is carried out at the customs processing units (CPUs) at the port,
where the Single Goods Declaration form is completed by the freight forwarder and endorsed by
customs. At the same time, the shipper will wait for the CCI to be issued by Cobalt.
The time for clearance processes for exports is faster than the same for imports. Nonetheless, there is
room for improvement: benchmarking against the observed time for export processes at the Port of
Tema, where it took 3.5 hours for all border clearance processes, the delay is considered to be 44.5
hours.39 The indirect financial cost to the shipper for border clearance therefore, is calculated at $32.
Yard handling time is included only for time outside of the shippers control (i.e. border clearance time).
However, it is interesting to note that according to APM Terminal, the average storage time for exports
is 9 days.40 Export cargo begins incurring storage charges after day 7 of NGN 750 per day, so the typical
shipper would incur 2 days of storage fees, totaling around $10. Storage time of 9 days is beyond what is
necessary for shippers to complete export processes, so one could potentially assume that shippers are
considering the 7 free days of storage as free warehousing. As export volumes are limited, terminal
operators do not report being concerned with this practice.
Loading at Berth
The average time at berth for Apapa and Tin Can Island is 60 hours. Loading time, which represents half
of total berth time, is therefore calculated as 30 hours. Using the average 20.5 hour loading time at
39
USAID “West Africa Transport Logistics Analysis Using FastPath: Tema-Ouagadougou Corridor (January 2010). 40
We were not able to obtain data for export storage time for Tin Can Island terminals.

57
Tema as a benchmark, delay in loading at berth is identified as 9.5 hours, and the financial cost to the
exporter is estimated at $7.41
Channel Operations
Interviews with Tin Can Island terminals found that the average waiting time for the ship to depart after
cargo is loaded is just 3 hours. APM declined to provide information on this indicator, so we have based
our figure on Tin Can Island data.
We consider the three hours of observed waiting time as minimal, so we have not included the cost of
delay for this segment.
DIRECT COST TO EXPORT
Direct costs in the port segment of the export logistics chain are the average fees actually paid for
component activities, assuming that all things are working as usual. Direct costs include both formal
(receipted) and informal (un-receipted) costs.
Table 50: Summary of Direct Costs to Export
Component Formal cost
(USD/TEU)
Informal cost
(US$/TEU)
Direct cost to
shipper (US$/TEU)
Border clearance 137 50 187
Forwarding 637 Included above 587
Yard handling 153 0 153
Port yard operations total 927 50 927
Loading at berth 124 0 124
Channel operations 6 0 6
Anchorage and berthing total 130 0 130
Total: 1057 50 1057
Border clearance
Costs in the border clearance segment include the NESS fee of .5% FOB value of the export container,
and informal facilitation fees paid to customs and other government agencies by freight forwarders.
Results of interviews demonstrate that informal fees in the export process are not only paid to customs
agents; they are paid to representatives of a variety of agencies depending on the nature of the goods
and the related organization which oversees inspection for those goods (examples of other recipients of
informal fees from interviews included NAFDAC and SON). Some shippers expressed that informal fees
paid as part of the export process were actually lower than informal fees paid for the import process,
since there are fewer steps and inspections involved. Nonetheless, the average informal cost for
exporting was calculated at $50 per container, which is the same observed on the import side.
41
USAID “West Africa Transport Logistics Analysis Using FastPath: Tema-Ouagadougou Corridor (January 2010).

58
Table 51: Average Informal Cost for Exporting a Container
Border Clearance, incl: 187
NESS Inspection fee 137
Informal fees 50
Forwarding
Freight forwarders charge an average of $637 for clearing exports, which is lower than fees paid for
imports since imports have an added charge for customs processes which occur before cargo arrives at
vessel, including processing the Form M and the risk assessment report (RAR). In the table above we
have deducted the informal fees paid by freight forwarders to customs from the observed freight
forwarding cost, in order to prevent double counting.
Table 52: Cost of Forwarding
Forwarding, incl: 587
Freight forwarding (less informal fees) 587
Yard Handling
The cost for yard handling and storage is calculated at $153, with all associated fees are paid to the
shipping line. These include an export delivery charge, an outside stuffing fee, and an administrative
charge for export documentation. Shipping lines charge a higher fee for inside stuffing, which deters
shippers from using this service.42 We have therefore included outside stuffing as the typical case.
Table 53: Cost of Yard Handling and Storage for Exports
Yard handling and storage, incl: 153
Export delivery charge 25
Outside stuffing fee 96
Export doc fee 32
Loading at Berth
There are no direct charges invoiced to the shipper for loading at berth or for channel operations.
However, we have included charges that the shipping line must pay to terminal operators and to NPA,
since these charges are passed onto the shipper in sea freight rates. The average sea freight for a 20’
container of agricultural products weighing 17 tons from Lagos to Newark is: $2584.43 Within this
amount is $124 that goes to costs for loading at berth. We include a detailed explanation of how we
calculated these charges in Annex 5.
Berth rent is paid by the shipping line to NPA, and takes into consideration the length of a ship and the
days the vessel is at berth. Based on an average ship length of 209 m and an average stay of 58 hours at
42
Inside stuffing is loading the container inside of the terminal yard, and outside stuffing is loading the container
outside of the terminal yard. Shippers pay an inside stuffing fee to be able to stuff their container inside the yard,
instead of picking up the container at the yard, transporting it a warehouse for loading, and then transporting the
loaded container back to the yard. Maersk charges US$268 (NGN 42000) for inside stuffing. 43 Rate quoted by Maersk Line

59
Apapa Port, the dues per vessel are $1,003, or $0.40 per TEU. We assume that this cost is shared
between exporters and importers. The cost to the exporter, therefore, is $.20 per TEU.
Cargo dues are also referred to as Yard Handling or Stevedoring fees. These fees are paid by the
shipping line to the terminal operators for handling cargo at berth, and a standard fee of $70 per 20’
container is applied.
Shipping lines also pay the following charges for the use of port infrastructure: Harbor dues, an
environmental protection levy, and a MOWCA levy. Together, these fees add $124 to the cost paid by
the shipping line, and thus passed onto the exporter.
Table 54: Costs to Exporter of Loading at Berth
Loading at berth (component of sea
freight), incl: 124
Berth rent 0.2
Cargo dues 70
Harbour dues 47
Enviromental Protection Levy 3.6
MOWCA 3
Channel Operations
Again, there are no direct charges invoiced to the shipper for channel operations. However, we have
included Port Dues as a cost paid by the shipping line, which is passed onto the exporter in sea freight.
Port dues passed onto the exporter are estimated to be $6 per TEU, and are paid per call of the vessel.
Charges vary depending on whether the vessel is a foreign flag carrier, and whether it is the vessel’s first
call in Nigeria or in Lagos. Some vessels shift between Lagos and Apapa (this was observed by Maersk
vessels, for instance), but since the majority appear to call once in Lagos, we assume for this study that it
is the vessel’s first and only call.
Table 55: Costs of Channel Operations
Channel Operations (component of sea
freight), incl: 6
Port dues 6

60
EXTRA COSTS FOR EXPORT
Extra costs in the port segment for export containers include the indirect costs of delay and direct costs
identified as extra cost.
Table 56: Summary of Observed Costs, Extra Costs and Extra Costs as a %
of Observed Costs
Component Observed cost
(U$S/TEU)
Observed cost
(% total port costs)
Extra cost
(US$/TEU)
Extra cost
(% observed cost)
Border clearance 187 18% 82 44%
Forwarding 587 56% 239 41%
Yard handling 153 14% 96 63%
Loading at berth 124 12% 7 6%
Channel operations 6 1% 0 0%
TOTAL: 1057 100% 424 40%
Inefficiencies and extra costs are observed during border clearance due to informal fees and delays,
during forwarding due to high freight forwarding rates, during yard handling due to administrative
charges without service rendered, and during loading due to high harbor dues paid by the shipping lines
and then passed onto shippers in sea freight.
Figure 16: Extra Cost in the Port Segment for a 20’ Container
0
100
200
300
400
500
600
700
Border
clearance
Forwarding Yard handling Loading at
berth
Channel
operations
Extra Cost (US$/TEU)
Optimized Cost (USD/TEU)

61
Border Clearance
Table 57: Extra Costs of Border Clearance
Extra cost: Border clearance Observed cost
(US$/TEU)
Optimized cost
(US$/TEU)
Extra cost
(US$/TEU)
Total 187 105 82
Informal customs fee 50 0 50
Indirect cost of delay 32 0 32
Extra costs during border clearance include informal fees paid to customs and other government
agencies, and the indirect cost of 44.5 hours of delay. If Lagos ports were able to reduce border
clearance time to the time experienced at Tema they would save $32 in indirect financial cost.
Forwarding
Table 58: Extra Costs of Forwarding
Extrac: Forwarding Observed cost
(US$/TEU)
Optimized cost
(US$/TEU)
Extra cost
(US$/TEU)
Total 587 348 239
Forwarding 587 348 239
As was observed for imports, freight forwarding fees for exports are higher in Nigeria than in
neighboring West African countries. The USAID West Africa Trade Hub’s 2010 report, “Transport and
Logistics Costs on the Tema-Ouagadougou Corridor” found that freight forwarder fees in Ghana (not
including informal fees) averaged $347.78 per TEU for the export of a 16 ton container of cashew nuts.
Although further research is needed to identify the drivers of higher freight forwarding rates in Nigeria,
it is interesting to note that shippers in Nigeria pay an extra $239 on average for forwarding services.
Yard Handling
Table 59: Extra Costs of Yard Handling
Extra cost: Yard handling Observed cost
(US$/TEU)
Optimized cost
(US$/TEU)
Extra cost
(US$/TEU)
Total 153 57 96
Outside stuffing fee 96 0 96
The outside stuffing fee charged by shipping lines is considered an extra cost, since it is an administrative
charge with no service rendered. If a shipper is stuffing their container at their warehouse outside the
port, they will still pay for the labor for stuffing in addition to the outside stuffing fee charged by the
shipping line.

62
Loading at Berth
Table 60: Extra Costs of Loading at Berth
Extra cost: Loading at berth Observed cost
(US$/TEU)
Optimized cost
(US$/TEU)
Extra cost
(US$/TEU)
Total 124 117 7
Indirect cost of delay 7 0 7
Extra costs during loading only the indirect cost of delay.
Other yard handling costs appear to be minimal and appropriate when compared to regional
benchmarks, and are therefore not included as extra costs. Harbour dues in Nigeria are close to those
charged in Ghana, for instance.
Berth rent is not a substantial cost to the shipper, and is therefore not considered in this analysis as an
extra cost. Improving time at berth to the time experienced at Tema (41 hours) would only save the
shipper $.10. Incidentally, berth rent rates are also less expensive in Nigeria than in Tema.
Stevedoring rates of $70 per 20’ container and 100’ per 40’ container are competitive with regional
rates. In Ghana the cost per 20’ container is $82.69 and $156.19 for a 40’ container.44
Channel Operations
Table 61: Extra Costs of Channel Operations
Extra cost: Channel operations Observed cost
(US$/TEU)
Optimized cost
(US$/TEU)
Extra cost
(US$/TEU)
Total 6 6 0
There are no extra costs identified during channel operations for exports. Terminal operators have
significantly reduced vessel waiting time at anchor, which led to the removal of the port surcharge for
delays upon arrival to ships in channel. Subsequently, costs to the shipper have fallen in the last few
years.
44
West Africa Trade Hub, Ghana Port Authority Port Tariffs 2011.

63
CHAPTER 7: NEXT STEPS The attached Baseline Assessment Report provides an updated set of indicators to assist the Nigerian
public and private sectors in measuring corridor performance. This data will be discussed and validated
at a workshop among corridor stakeholders that will take place in Nigeria in June 2013. The stakeholder
workshop will provide an opportunity to gather the members of Nigeria’s Corridor Management
Group, an initiative that began in 2010 to improve corridor performance, to discuss where Nigeria is
versus international benchmarks, and agree on steps to take to improve Nigeria’s LAKAJI Corridor
performance indicators.

64
ANNEX 1: INTERVIEWS CONDUCTED
IN PERSON
Location Firm/Institution Type of Stakeholder
Abuja Jabi Transport Park Truckers/Unions
Abuja Dei Dei Transport Park Truckers/Unions
Abuja CTN Express Trucking Company
Ilorin Oriana Transport Park Truckers
Ogbomosho Truckers Truckers
Ibadan Oyo State Shippers Assocation Association
Ibadan Ibadan ICD Site Visit
Lagos Olam Exporter
Lagos NCS Customs
Lagos Nigerian Flour Mills Importer/Exporter
Lagos Vintage Concept Ltd Freight Forwarder
Lagos K Marine Freight Forwarder
Lagos Maersk line Shipping line
Lagos Mid Ocean company Limited Freight forwarder
Lagos A.C.E.T. Nigeria Ltd Cashew exporter
Lagos First Diamond Shipping Agency Shipper
Lagos XPT Logistics Exporter/Freight Forwarder
Lagos DAMCO/Lillypond ICD Logistics arm of Maersk
Lagos Nigerian Shippers Council Association
Lagos Fortune Global Shipping Freight Forwarder
Lagos Jon Tudy Exporter
Lagos Peak River Logistics Freight Forwarder
Lagos Dizengoff Importer
Lagos Dangote Exporter
Lagos Grimaldi/PTML Shipping line
Lagos Cargo Land Freight Forwarder
Lagos NPA Ports Manager, RTD, Tin Can
Lagos APMT Terminal Operator
Lagos Baxwells Express Solution Ltd Freight Forwarders
Lagos Swift Freight Freight Forwarders
Abuja Ministry of Trade and Investment Institution
Lagos 5 Star Logistics Terminal Operators
Lagos Tincan Island Container Terminal Terminal Operators
Lagos Port & Cargo Handling Services Terminal Operators Lagos International Network of Transit and Transport Logistics Lagos Multimix Global Logistics & Supply
Chain Lagos Nexportrade Houses Export Lagos Nigerian Railway Corporation Transport Lagos Nigerian Shippers' Council Transport Lagos Manufacturer’s Association of Nigeria Trade Group

65
Lagos Ketu/Mile 12 Tomato Market Traders/Transporters
Lagos Daleko Rice Market Mushin Traders/Transporters Lagos Marina Aggregation Park Traders/Transporters
Lagos Ebute Ero Aggregation Park Traders/Transporters Lagos Iddo Terminal Truck Park Traders/Transporters Lagos ENL Consortium Limited Terminal Operators
Lagos Swift Cargo Freight Forwarders Lagos Wadoye CK Cargo Freight Forwarders
Kaduna Mando Heavy Truck Park Transport Kaduna Mando Heavy Truck Park Transport
Kaduna Kaduna Railway Station Transport
Kaduna Inland Containers (Nigeria) Limited Terminal Operator
Kaduna Kaduna Railway Fruit Market Transport
Kaduna Kaduna Railway Fruit Market Transport
Kaduna Antemma Venture limited
Kaduna Janccre Investment Limited
Kaduna Zichonix Logistics Nigeria Limited (Agro-logistics) Logistics
Kano Inland Containers (Nigeria) Limited Terminal Operators
Kano S.G.International
Kano Dawanau Market Traders/Transporters
Kano Dawanau Market Traders/Transporters
Kano E.T.C. Agro
Kastina Office of the senior Special Asst Government
Kastina Service to Humanity
Kastina Youth Craft Village
Kastina Nigeria Custom Service Customs/Government
Kastina Cotecna
Kastina Usman Isyaku Ventures Limited
Niger Lambata Truck Park Transport
Niger Bida Tuck Park Transport
Niger Bida Tuck Park Transport
Kwara Ilorin Truck Park Transport
Niger Mokwa Truck Park Transport
Niger Mokwa Truck Park Transport
Niger Mokwa Truck Park Transport

66
ANNEX 2: EXPORT AND IMPORT
BASKET METHODOLOGY Choice of studied commodities
The assessment team selected three products to be included in baskets of goods for import and export,
in order to establish a proxy for the average cost and time to ship a 20’ container along the corridor.
Goods were chosen by relative contribution to overall trade, volume passing through Lagos Ports,
relevance to NEXTT value chains (agricultural products for export), and mode of handling.[1]
Import Basket
Commodity Weight (tons)
(MT/TEU)
Unit value
(CIF/MT)
TEU value
(CIF/TEU)
Trade value
(USD)
Rice (rice milled equivalent) 15 3,744 56,161.66 1,652,948,082
Paper 24 1,137 27,296.87 287,072,905
Powdered milk 16 10,491 167,855.91 1,582,252,968 Source: UNCOMTRADE, FAO Stat, Interviews with Traders, Trade Map
In 2011, Rice, Paper and Powdered Milk account for 6% of overall trade in Nigeria.[2] Nigeria imported
441,479 tons of rice in 2011, and according to statistics provided by the Nigerian Ports Authority
(NPA), 60% of imported rice via Nigerian Ports passed through Lagos Ports. Bagged rice accounted for
7% of all non-bulk imports at Lagos Ports. Nigeria imported 252,401 tons of paper in 2011, 98% of
which passed through Lagos Ports, and which accounted for 3% of total non-bulk imports at Apapa and
Tin Can.[3] In 2011, powdered milk was the top agricultural import per unit value, with an estimated
volume of 150,821 tons.
Trade Map was consulted to obtain data on FOB and MT values of these imports. Weighted averages of
these products were used to calculate the CIF/TEU ratio.
Based on the above containerized weights and CIF values per TEU, the import basket is calculated to
weigh 18 tons with a CIF/TEU of 76,058.70.
Export Basket
Commodity Weight (tons) Unit value
(FOB/MT)
TEU value
(FOB/TEU)
Trade value
(USD)
Cashews (raw) 16 MT 800 12,800 4,804,000
Sesame 19 MT 1,276 24,244 139,000,000
Cocoa 15 MT 3,000 45,000 659,886,000 Source: UNCOMTRADE, FAO Stat, NCS, Interviews with Traders
[1]
The top imports in Nigeria are not containerized: in 2012 boilers, machinery and appliances accounted for 23% of
total imports and vehicles and aircrafts accounted for 20%. [2]
UN Comtrade. Total FOB imported value for 2011: $47,265,753,572 [3]
NPA

67
Cashews, sesame and cocoa are export sectors of interest for the Nigerian government, and have been
supported by USAID via the MARKETS I and II projects. Cocoa is Nigeria’s second biggest foreign
exchange earner after crude oil, producing an estimated 400,000 MT per year, and exporting 96% of its
production. Nigeria is the region’s third largest cocoa producer, following Cote d’Ivoire and Ghana.
Nigeria exports 50% of West Africa’s sesame exports, or an estimated amount of 140,800 MT annually.
Nigeria produces cashews in most of its Southern states, producing an estimated 125,000 MT of raw
cashews per year, exporting the large majority of this (FAOSTAT, 2012). An estimated 90,751 tons of
cashews and 265,721 cocoa beans are exported annually through Apapa port. As per the Nigerian Port
Authority, over 95% of trade in these products passed through Lagos Ports.
Trade Map was consulted to obtain data on FOB and MT values of these exports. Weighted averages of
these commodities were used to calculate the FOB/TEU ratio.
The export basket is calculated to weigh 17 tons with a FOB/TEU of 26,808.72.
Scope of the Analysis
The time and cost to import and export goods is divided into two sub-segments for measurement: The
Port/Yard Interface and Transport. Below is a description of each:
Segment 1: Port/Yard Interface
The Port/Yard Interface (hereinafter referred to as the Port Segment), is essentially what
happens to import cargo as it arrives and is transported through ports in Nigeria, or as it arrives
at the port and leaves Nigeria as an export. The study analyzes two scenarios of the Port
Segment of time and cost for imports: 20’ container at Apapa Port and 20’ container at Tin Can
Island. Since time and cost data for exports was the same for Apapa and Tin Can Island, we
analyze one scenario: the time and cost to export a 20’ container for all of Lagos Ports. Where
there was minor variation between the two ports, we averaged the data together to obtain one
overall figure.
Segment 2: Transport
For imports, transport refers to all fees incurred for a container of goods once it leaves
Nigeria’s ports. For exports, transport refers to all fees incurred for a container of goods from
departure in Jibiya until it reaches Nigeria’s ports.
Assumptions underlying calculations
The following assumptions inform the analysis and calculations made in this study:
Terminal Data:
As APMT handles 45% of Nigeria’s total container traffic, and 50% of all imports to the country,
data for APMT is used to estimate the time and cost for an average container imported at
Apapa Port.
Time, cost and operational performance for containerized imports at Tin Can Island Port are
calculated using data on Tin Can Island Container Terminal, Ports and Cargo Logistics Terminal,
68
and 5-Star Logistics. Averages are calculated as a weighted average by volume of containerized
cargo passing through each terminal.45
Average Truckload:
Based on information provided by truckers and freight forwarders, the most common used
truck to transport cargo in Nigeria is the 30 ton truck. Therefore, we assume the average truck
load carries 30 tons. To obtain the cost of a TEU (twenty-foot container equivalent), we
calculated the cost of one ton of a 30 ton truck, and then multiplied this by the weight of the
import basket (18 tons) to get the cost per TEU for imports. To obtain the TEU cost for
exports, we calculated the cost of one ton of a 30 ton truck, and then multiplied this by the
weight of the export basket (17 tons).
Duties and Taxes:
The analysis excludes commodity specific duties and taxes. Although they represent a significant
portion of the importe total costs, they are not transportation or logistics-related costs. The
only duty included in the analysis therefore is the Customs Inspection Supervision Scheme
(CISS) fee, because it covers a logistics service provided by destination inspection companies.
Exchange Rates Used:
The exchange rate used for purposes of this study is 1 USD = 157 NGN.
Interest Rate Utilized to Calculate the Financial Cost of Delay:
The interest rate utilized to calculate the financial cost of delay was arrived at by using an average of the
maximum interest rate (as consolidated by the Central Bank of Nigeria) for January, February and March
2013, which comes to = 23.82%.
The calculation used to determine the indirect financial cost per hour of delay is therefore, the value of
the export container, times the hourly delay, times the interest rate, divided by 365 (the number of days
in a year), divided by 24 (the number of hours in a day).
Indirect financial cost per hour of delay = value of export container x hourly delay x
[(interest rate/365)/24]
45TICT and 5 Star provided data for 2011. PCHS provided current average figures for 2012-2013. Weighted
average by volume is estimated to be: TICT: 60%; PCHS 30%; and Ports and Cargo 10%.
69
ANNEX 3: INSTITUTIONS INVOLVED IN
TRANSPORT AND LOGISTICS Federal Ministry of Transport
The Federal Ministry of Transport is responsible for marine transport (ports and inland waterways),
railways, and federal mass transit. Its mandate includes formulating policies, setting guidelines, supervising
the provision of infrastructure, overseeing the development of management and professional manpower,
ensuring security and standards, and working with domestic stakeholders and international organizations
in developing the transport sector. The ministry has two service departments, one for maritime and the
other for land transport, and three technical departments providing transport planning and coordination,
human resources management, and finance and accounts management. Other units are dedicated to
press, legal, internal audit, servicom (social contract between the federal government and its people) and
anticorruption matters.
The Maritime Services Department (MSD) is responsible for coastal and inland waterways and all
aspects of marine transportation. It is headed by a director and has four divisions: : Maritime Services,
Ports, Shipping Development and Management, and Marine Pollution. The MSD is responsible for coastal
and inland waterways and all aspects of marine transportation. The MSD supervises the five maritime
parastatals, including the Nigerian Port Authority (NPA), Nigerian Maritime Administration and Safety
Agency (NIMASA), National Inland Waterways Authority (NIWA), Nigeria Shipping Council (NSC), and
the Maritime Academy of Nigeria (MAN).
Additional transport and logistics institutions relevant for the LAKAJI corridor include the following:
Nigerian Ports Authority (NPA)
The Nigerian Port System is regulated by the Nigerian Ports Authority Act No. 38 of 1999. The act
created the NPA and gave it powers and duties to manage and administer Nigerian ports. According to
the act, the NPA’s functions are to:
Provide and operate port facilities and services;
Maintain, improve, and regulate (technically and economically) the use of ports; and
Ensure efficient management of port operations.
NPA is a public entity which owns and administers land and water within port limits and is responsible
for planning and development of port operational infrastructure, leasing and concession of port
infrastructure, making recommendations on tariffs, nautical and harbor operations and hydrographic
surveys, marine incidents and pollution, safety and security in common areas, port regulation and bylaw
enactment and enforcement, day-to-day monitoring of operations, and enforcement of sections of the
concession agreements.
Although NPA is responsible for regulation and operation of the port system, the Federal Ministry of
Transport is still in charge of national policy formulation and planning for basic marine infrastructure and

70
for the development of related marine legislation. Although the NPA Act did not envision landlord
ports,46 it does provide for “concessions.”
The NPA determines and sets the tariffs for all port services, subject to approval by the Minister of
Transport. After a tariff is approved, it is published in the booklet “Simplified Tariff Structure” for port
stakeholders.
Nigerian Maritime Administration and Safety Agency
NIMASA was created by the merger of National Maritime Authority and Joint Maritime Labour
Industrial Council (former parastatals of the Ministry of Transport) in 2006. The agency’s mandate
derives from the Nigerian Maritime Administration and Safety Agency Act of 2007, the Merchant
shipping Act of 2007, and the Coastal and Inland Shipping (Cabotage) Act of 2003. The responsibilities of
NIMASA combine regulatory and promotional maritime mandates. NIMASA has three divisions: Finance
and Administration, Maritime Labour and Cabotage Services, and Maritime Safety and Shipping
Development.
Nigerian Shippers Council
The NSC, was established by the Nigerian Shippers Council Act of 1977 to promote and defend
Nigerian shippers’ interests in matters affecting the shipment of imports and exports to and from
Nigeria. NSC is a corporate body with an 11-member board with representatives from the Ministry of
Transport, the commodity Board, the Nigerian National Petroleum Company, the Nigeria Chamber of
Commerce, the Nigeria Export Merchants Association, and the Manufacturers’ Association of Nigeria. It
also carries out a form of economic regulation by determining and approving tariff and rates in the port
industry.
National Transport Commission
The reform of the transport sector entails introduction of the landlord model in one form or another in
the various modes of transport, including ports. The landlord model allows for continued ownership of
infrastructure assets by the government while commercial operations are ceded to private operators in
a deregulated tariff regime.
The legal framework calls for a National Transport Commission under supervision of the Federal
Ministry of Transport. The National Transport Commission Bill was drafted and reviewed by
stakeholders and quality control, and is now awaiting the consideration and approval of the Federal
Executive Council before being forwarded to the National Assembly for deliberation and passage into
law.
Customs
NCS is the government agency responsible for collecting Customs and excise duties and other fees,
charges, and levies associated with international trade. It is also responsible for the implementation and
enforcement of some government trade and fiscal policies. NCS is headed by a comptroller-general who
is assisted by five deputies, who head the departments of Tariff and Trade, Enforcement and Inspection
46
In a landlord port the port authority owns the land and regulates the port while private companies carry
out day-to-day operations.

71
Department, Service Support, Strategic Research and Policy, Human Resources and Development. Four
of the five deputies are also zonal coordinators.

72
ANNEX 4: IMPORT AND EXPORT STEPS

73

74

75
ANNEX 5: CALCULATIONS OF
SHIPPING LINE COSTS PASSED ONTO
THE SHIPPER The cost analysis utilized in this baseline assessment is from the perspective of the shipper, who pays
itemized fees to the following parties for import:
Shipping Line/Agency
Terminal Operator
National and Regional Institutions
Freight Forwarders/Clearing Agents
Control bodies for inspection services – i.e. CISS fee for imports
And the following parties for export:
Shipping Agency charges
Shipping Line (Sea Freight)
Control bodies for inspection services – i.e. NESS for exports
The shipping lines, in turn, pay fees to the terminal operators and to NPA. The shipping lines must
recover these fees, and therefore pass them on to the shipper in Shipping Agency charges and freight
rates. Fees paid by the shipping line include:
Ship Dues or “Port Dues,” paid to NPA
Berth Rent, paid to NPA
Cargo Dues, paid to terminal operators
Other charges for use of port infrastructure: Harbor Dues, Environmental Protection Levys,
MOWCA Levy, NIMASA levy, paid to NPA
We explain how we obtained the cost per TEU for each of these fees below, as well as our assumptions
on how they are passed onto the shipper.
1. “Ship Dues,” also referred to as “Port Dues.” Paid to NPA:
Description of charge
These are charged per vessel, and are calculated based on the gross registered tonnage (GRT) of the
vessel, the flag of the ship, and whether the vessel has already made a call in the port or country on the
current voyage or not. Included in Port dues are pilotage charges and towage charges, which are
compulsory. Charges are as outlined below:
Foreign Vessels, first call Nigeria = ($1.28*GRT) + $1176
Foreign Vessels, second call Nigeria, first in Lagos = ($0.938*GRT) + $1176

76
Foreign Vessels, second call in Nigeria, calling both Apapa and Tin Can = ($0.07*GRT) + $1176. The fee
is charged per call of the vessel.
Since the shipping line must recover these charges, we assume that these charges are passed onto
importers in shipping agency charges and are passed onto exporters in sea freight.
Calculation of charge
Since we were unable to obtain disaggregated data from NPA on average TEU capacity and GRT of
container ships at Tin Can Island and Apapa, we calculated the average ship dues using a sample of ships
that called Tin Can Island (2011), and the total number of all types of vessels that called Apapa and Tin
Can Island, and the total GRT of those vessels.
Table 1: Sample of container vessels that called Tin Can Island Container
Terminal (2011)
SHIP LINE TEU CAPACITY
MV MICHAELA S MAERSK 2,500
MV WIDUKIND CMA CGM 3,100
BUXSAILOR ZIM 1,599
MOL Volta MOL 2,135
MOL Valparaiso MOL 2,135
MOL Sassandra MOL 2,135
KING BYRON MAERSK 1,674
MARK TWAIN CMA CGM 3,398
MOL HONO MOL 1,618
MCC JAKARTA MAERSK 2,506
2,280 Source: List of ships provided by TICT. TEU Capacity obtained through online research of ship names.
Tin Can Island Container Terminal (TICT) provided us with a list of container ships that called Tin Can
Island Port in 2011. Using a sample of 10 ships, the average TEU capacity is estimated to be 2,280. Since
we were not able to obtain a similar list from APM, for the purposes of analysis, we estimate that ships
calling Apapa are approximately the same size. Our interviews suggest that this is a fair assumption.
Table 2: Number of Vessels and average GRT of vessels that called Lagos
Ports in 2011
PORT VESSELS GRT GRT per Vessel Apapa 1,594 32,869,251 20,620.61 Tincan Island 1,628 32,702,604 20,087.59
Average 1,611 32,785,928 20,354.10 Source: NPA
NPA provided data on the number of vessels that called Apapa and Tin Can Island, and the total GRT of
those vessels. We averaged these figures together to calculate the GRT per vessel calling Lagos Ports
(20,354).

77
Based on this average and the formula above of (1.28*GRT) + $1,176, Based we estimate that the
average dues per vessel are $27,229. With an average TEU per vessel of 2,280, the average unit cost per
TEU is $11.94 ($27,229/$2,280).
This unit cost per TEU is divided by two to get the unit cost paid by the importer ($5.97) and the unit
cost paid by the exporter ($5.97).
2. Berth Rent Paid to NPA
Description of charge
Berth rent is calculated based on the length of the ship and the number of days that the ship is at berth:
Rent = $2*Length of ship * Number of days
The shipping line must recover these charges, so we assume that rent charges are passed onto the
importer in the shipping agency’s destination handling charge (DHC) and onto the exporter in the ocean
freight rate.
Calculation of charge
Table 3: Ports, Average Calls and Dues Paid per Vessel
Port Average
Length Average call
Dues per
Vessel
Unit cost
(US$/TEU)
Cost to
importer
Cost to
exporter
Apapa 209 58 1003.2 0.401 0.20 0.20
Tin Can
Island 209 63 1086.8 0.435 0.22 0.22
Average 209 60.5 1053.71 0.421 0.21 0.21 Source: Average Length – VHSS New Contex. Average call Apapa – NPA. Average Call TCI – interviews with terminal operators.
The Hamburg Shippers Association New Contex database classifies the average length of a Type 2500
TEU container vessel to be 209 meters. This type of ship is the closest approximation to the average
TEU capacity observed in the sample of Tin Can Island ships above. Dues per vessel are calculated using
the above formula, and then divided by TEUs per vessel to obtain the unit cost/TEU. Since costs are
passed onto both importers and exporters, the unit cost per TEU observed by the shipping line is
divided by two, to get the unit cost per TEU observed by the shipper.
3. Cargo Dues, also referred to as Yard Handling or Stevedoring fees. These are fees for handling
the cargo at berth. Shipping Lines pay cargo dues to terminal operators. Fees are outlined
below:
Table 4: Dues paid on Foreign Vessels
Cargo Dues
Foreign Vessels
Import Export
20' 40' 20' 40'
Containers 90 130 70 100
General Cargo (per ton) 6.1 4 Source: NPA Schedule of Tariff

78
We assume that the shipping line recovers these charges in the importers destination handling charge
and the exporter’s freight rate.
4. Charges for Port Infrastructure: Harbor Dues, Environmental Protection Levy, and MOWCA
Levy. MOWCA levy is paid through NPA and passed onto the regional organization. Fees are
outlined below:
Table 5: Charges for Port Infrastructure
Charge Import Export
20' 40' General 20' 40' General
Harbour Dues 80 160 2.5/ton 47 93 1.7
Environmental Protection 3.63 7.68 0.1/ton 3.63 7.68 0.1/ton
MOWCA Levy* 3 4 .10/ton 3 4 .10/ton Source: NPA Schedule of Tariff. *The assessment team was unable to obtain MOWCA Levy charges for exports directly, so calculations
are pulled from USAID MARKETS LAKAJI Corridor Analysis.
We assume that these fees are passed on to the importer in the agency destination handling charge and
the exporter in sea freight rates.

79
ANNEX 6: LILYPOND CONTAINER
TERMINAL TARIFFS 2011
Rates in Naira
Charges 20ft (NGN) 40ft (NGN)
Terminal Delivery Charges(All-in-rates) Import 40,000 60,000
Container Unstuffing 42,000 55,000
Export Stuffing (Excluding stuffing Materials) 40,000 52,000
Empty Handling (All-in rate) 18,300 33,200
Equipment Maintenance and Repair 20ft (NGN) 40ft (NGN)
Man-hour Rate 3,000 /per hour
Material Rate 5,000 PTI "run"
Reefer Examination/Month 250,000
Electricity -Daily 6,000 7,000
Storage Days (Imports) 20ft (NGN) 40ft (NGN)
0-3 Free Free
4-14 1,250 2,500
15+ 3,250 6,500
Storage Days (Exports) 20ft (NGN) 40ft (NGN)
0 -7 Free Free
8days onward 400 800
Storage Days (Empty) 20ft (NGN) 40ft (NGN)
0-3 Free Free
4days onward 400 800
Storage Days (Reefer) 20ft (NGN) 40ft (NGN)
1st Period (0-3days) Free Free
2nd Period (4-14days) 1,300 2,600
3rd Period (15+days) 6,500 13,000 Rates excludes 5% Vat
Import rates are billed to Consignees/Importers directly
Exports and Empty rates are billed to Shipping Lines
Tariff valid for 6months