LAFARGE WAPCO PLC. - nse.com.ng · Lafarge Africa Plc Contents Directors' and Other Corporate...
25
Lafarge Africa Plc Unaudited Financial Statements 30 June 2018
Transcript of LAFARGE WAPCO PLC. - nse.com.ng · Lafarge Africa Plc Contents Directors' and Other Corporate...

Lafarge Africa PlcUnaudited Financial Statements
30 June 2018

Lafarge Africa PlcContents
Directors' and Other Corporate Information 2
Consolidated and Separate Statements of Profit or Loss and Other Comprehensive Income 4
Consolidated and Separate Statements of Financial Position 5
Consolidated and Separate Statements of Changes in Equity 6
Consolidated and Separate Statements of Cash Flows 8
Notes to the Consolidated and Separate Financial Statements 9
2

Lafarge Africa PlcDirectors' and Other Corporate Information
Company registration numberRC 1858
DirectorsMr. Mobolaji Balogun ChairmanMr. Guillaume Roux (resigned w.e.f. 6th April 2018) Vice ChairmanMr. Michel Puchercos Group Managing Director/CEODr. Adebayo Jimoh (resigned w.e.f. 6th April 2018) Non-Executive DirectorMs. Sylvie Rochier Non-Executive DirectorMr. Adebode Adefioye Non-Executive DirectorMr. Jean-Carlos Angulo Non-Executive DirectorAlhaji Umaru Kwairanga (resigned w.e.f. 6th April 2018) Non-Executive DirectorDr. Shamsuddeen Usman CON, OFR Non-Executive DirectorMrs. Elenda Giwa-Amu Non-Executive DirectorMrs. Adenike Ogunlesi Non-Executive DirectorMs. Geraldine Picaud (Appointed 7th April 2018) Non-Executive DirectorMr. Christof Hassig (Appointed 7th April 2018) Non-Executive DirectorMr. Grant Earnshaw (Appointed 7th April 2018) Non-Executive Director
Company secretaryMrs. Adewunmi Alode
Independent auditorsKPMG Professional ServicesKPMG Tower,Bishop Aboyade Cole Street,Victoria Island,Lagos
Registered office Lafarge Africa PlcNo 27B, Gerrard Road,IkoyiLagos
RegistrarCardinal Stone (Registrars) Limited[formerly City Securities (Registrars) Limited]No 358, Herbert Macaulay Road,Yaba, Lagos
Principal bankers
Access Bank PlcCitibank Nigeria LimitedDiamond Bank PlcEcobank Nigeria LimitedFirst Bank of Nigeria LimitedGuaranty Trust Bank PlcStandard Chartered Bank PlcStanbic IBTC Bank LimitedUnited Bank for Africa PlcWema Bank PlcZenith Bank Plc
3

Lafarge Africa Plc
Q2-3months 30/06/2018
Q2-3months 30/06/2017
YTD 30/06/2018
YTD 30/06/2017
Q2-3months
30/06/2018
Q2-3months 30/06/2017
YTD 30/06/2018
YTD 30/06/2017
Notes N'000 N'000 N'000 N'000 N'000 N'000 N'000 N'000
Revenue 6 81,648,871 73,529,434 162,291,526 154,839,943 51,653,988 24,068,981 100,449,724 52,090,479 Cost of sales 7 (60,687,601) (49,974,244) (123,329,554) (110,390,462) (30,910,513) (11,766,364) (62,336,689) (29,401,688)Gross profit 20,961,270 23,555,190 38,961,972 44,449,481 20,743,475 12,302,617 38,113,035 22,688,791
Selling and marketing expenses 8 (1,264,201) (783,872) (2,769,986) (2,177,797) (232,897) (47,260) (667,896) (777,830)Administrative expenses 9 (9,697,171) (9,437,990) (19,956,303) (16,016,321) (6,647,122) (3,769,669) (13,474,053) (4,885,441)Other income 10 86,464 - 106,638 2,899,195 83,076 - 96,294 3,032,125 Other operating expenses 11 (5,542) - (5,542) (15,277) (4,020) - (4,020) - Operating profit 10,080,820 13,333,328 16,336,779 29,139,281 13,942,512 8,485,688 24,063,360 20,057,645
Finance income 11 725,366 239,503 1,033,522 553,271 652,468 6,838,008 885,401 10,941,786 Finance costs 11 (14,205,767) (4,858,477) (23,715,808) (11,532,148) (13,136,903) (8,794,254) (22,180,279) (14,111,643)(Loss)/Profit before minimum tax 13 (3,399,581) 8,714,354 (6,345,507) 18,160,404 1,458,077 6,529,442 2,768,482 16,887,788
(Loss)/Profit after minimum tax (3,399,581) 8,714,354 (6,345,507) 18,160,404 1,458,077 6,529,442 2,768,482 16,887,788
Income tax (expense)/credit 12 1,499,191 5,856,951 2,443,220 1,571,985 (818,984) (706,509) (677,601) (4,176,316)
(Loss)/Profit after tax (1,900,390) 14,571,305 (3,902,287) 19,732,389 639,093 5,822,933 2,090,881 12,711,472
Earnings per share attributable to the ordinary equity holders of the Company:
Basic earnings per share (Naira) 24 (22) 276 (45) 368 7 110 24 241
Group Company*
Consolidated and Separate Statements of Profit or Loss and Other Comprehensive Income for the year ended 30 June 2018
4

Lafarge Africa Plc
Q2-3months 30/06/2018
Q2-3months 30/06/2017
YTD 30/06/2018
YTD 30/06/2017
Q2-3months
30/06/2018
Q2-3months 30/06/2017
YTD 30/06/2018
YTD 30/06/2017
Notes N'000 N'000 N'000 N'000 N'000 N'000 N'000 N'000
Group Company*
Consolidated and Separate Statements of Profit or Loss and Other Comprehensive Income for the year ended 30 June 2018
(Loss)/Profit after tax (1,900,390) 14,571,305 (3,902,287) 19,732,389 639,093 5,822,933 2,090,881 12,711,472 Other comprehensive income:Items that may be reclassified to profit or loss:Exchange differences on translation of foreign operations
26 (1,812,044) 5,585,878 (645,011) 14,892,720 -
(1,812,044) 5,585,878 (645,011) 14,892,720 - - - -
Items that will not be subsequently reclassified into profit or loss:Remeasurements of defined benefit obligations
31.2 (4,566) 177,402 (4,566) 177,402 - - Income tax relating to these items 12 1,282 1,282 -
177,402 (3,284) 177,402 - - - -
Other comprehensive income for the year, net of tax (1,812,044) 5,763,280 (648,295) 15,070,122 - - - - Total comprehensive (loss)/income for the year (3,712,434) 20,334,585 (4,550,582) 34,802,511 639,093 5,822,933 2,090,881 12,711,472 (Loss)/Profit attributable to :- Owners of Lafarge Africa Plc (1,900,390) 14,570,326 (3,902,287) 19,406,926 639,093 5,822,933 2,090,881 12,711,472 - Non-controlling interests 16 - 978 325,465 - - - -
(1,900,390) 14,571,304 (3,902,287) 19,732,391 639,093 5,822,933 2,090,881 12,711,472 Total comprehensive (loss)/income for the year is attributable to:- Owners of Lafarge Africa Plc (3,712,434) 20,333,607 (4,550,582) 34,477,046 639,093 5,822,933 2,090,881 12,711,472 - Non-controlling interests - 978 - 325,465 - - - -
(3,712,434) 20,334,585 (4,550,582) 34,802,511 639,093 5,822,933 2,090,881 12,711,472
The accompanying notes and significant accounting policies on pages 10 to 25 form an integral part of these financial statements.
*Due to the merger of the Company with two subsidiaries and the liquidation of two subsidiaries into the Company in December 2017, the 2018 Company numbers are those of the merged and liquidated entities while the 2017 numbers as of June 2017 are those of the Company prior to the merger and liquidation.
5

Lafarge Africa Plc
30/06/2018 31/12/2017 30/06/2018 31/12/2017 Notes N'000 N'000 N'000 N'000
ASSETSNon-current assetsProperty, plant and equipment 14 388,121,941 393,651,934 288,840,337 292,872,779 Intangible assets 15 3,333,756 2,634,326 - - Investment in subsidiaries 16.1 - 182,088,406 182,088,406 Other financial assets 17 1,972,044 1,582,622 1,961,058 1,556,738 Other assets 19 21,359,031 20,803,113 15,523,516 14,984,747 Deferred tax assets 12.5 10,243,642 7,951,595 15,923,298 16,333,384 Total non-current assets 425,030,414 426,623,590 504,336,615 507,836,054
Current assetsInventories 20 58,350,524 58,266,466 39,937,059 39,057,831 Trade and other receivables 21 25,603,186 25,110,116 11,302,454 15,930,970 Current tax asset 12.3 789,727 917,797 - - Other assets 19 16,253,586 15,162,092 14,121,825 10,679,505 Other financial assets 17 585,684 592,538 347,236 326,635 Derivative assets 18 - 640,091 - 640,091 Cash and cash equivalents 22 19,544,843 50,414,757 17,860,430 41,698,854 Total current assets 121,127,549 151,103,857 83,569,004 108,333,886
Total assets 546,157,963 577,727,447 587,905,619 616,169,940
LIABILITIES Non-current liabilitiesLoans and borrowings 28 95,171,709 68,715,378 64,701,948 64,900,757 Deferred tax liabilities 12.5 - 1,463,106 - - Provisions 29 3,646,326 3,472,388 969,486 909,320 Deferred revenue 30 1,463,101 1,518,467 1,463,101 1,518,467 Employee benefit obligations 5,005,325 4,916,931 1,758,571 1,616,733 Total non-current liabilities 105,286,461 80,086,270 68,893,106 68,945,277
Current liabilitiesTrade and other payables 31 117,452,127 113,000,180 84,432,248 69,930,054 Loans and borrowings 28 166,768,931 187,831,582 178,670,531 190,724,579 Current tax liabilities 12.4 2,817,522 3,251,525 1,229,773 1,544,949 Provisions 29 841,284 1,166,217 588,922 895,268 Derivative liabilities 18 174,138 4,212,406 174,138 4,212,406 Deferred revenue 30 110,732 110,732 110,732 110,732 Bank overdrafts 22.2 13,324,200 31,081,780 - 15,037,780 Total current liabilities 301,488,933 340,654,422 265,206,344 282,455,768
Total liabilities 406,775,394 420,740,692 334,099,450 351,401,045
EQUITYShare capital 23.1 4,336,714 2,787,888 4,336,714 2,787,888 Share premium 23.2 351,096,692 222,272,108 351,096,693 222,272,108 Retained earnings 143,341,842 160,257,556 90,051,726 100,970,988 Deposit for shares 25 - 130,416,872 - 130,416,872 Foreign currency translation reserve 26 9,290,632 9,935,643 39,103 39,103 Other reserves arising on business combination and re-organisations 27 (368,683,312) (368,683,312) (191,718,068) (191,718,064) Total equity 139,382,569 156,986,755 253,806,169 264,768,895
Total equity and liabilities 546,157,963 577,727,447 587,905,618 616,169,940
Mobolaji Balogun Michel Puchercos Bruno BayetChairman Group Managing Director Group Chief Financial OfficerFRC/2013/CISN/00000004945 FRC/2017/IODN/00000015919 FRC/2014/MULTI/00000009554
These financial statements were approved and authorised for issue by the board of directors on 23 July 2018 and were signed on its behalf by:
Consolidated and Separate Statements of Financial Position as at 30 June 2018
Group Company*
The accompanying notes and significant accounting policies on pages 10 to 25 form an integral part of these financial statements.
6

Lafarge Africa PlcConsolidated and Separate Statements of Changes in Equity for the year ended 30 June 2018
Group
Sharecapital
Sharepremium
Retainedearnings Deposit for shares
Foreign currencytranslation
reserve
Other reserves arising on business
combination and re-organisations Total
Non-controlling interests Total equity
Notes N'000 N'000 N'000 N'000 N'000 N'000 N'000 N'000 N'000
Balance at 1 January 2017 2,740,367 217,528,456 102,842,886 - (8,660,486) (256,899,951) 57,551,272 191,401,276 248,952,548 (Loss)/Profit for the period 1st Jan. - 30 Jun. 2017
- - 19,406,926 - - - 19,406,926
325,465 19,732,391
Exchange differences on translating foreign operations
14,892,720 14,892,720 14,892,720
Remeasurement gain of defined benefit obligation, net of tax
177,402 177,402 177,402
Dividend (5,754,771) (5,754,771) (47,062) (5,801,833) ECH Equity taken over (9,321,487) (9,321,487) (9,321,487) Quasi Equity Repaid - (78,714,288) (78,714,288)
Balance at 30 June, 2017 2,740,367 217,528,456 116,672,443 - 6,232,234 (266,221,438) 76,952,062 112,965,391 189,917,453
Profit for the period 1 July - 31 December 2017
(54,416,333)(54,416,333)
82,533 (54,333,800)
Remeasurement gain of defined benefit obligation, net of tax
45,501 45,501 45,501
Exchange differences on translating foreign operations
3,703,409 3,703,409 3,703,409
Deposit for shares 130,416,872 130,416,872 130,416,872 Movement in reserves arising from re-organisation
97,955,945 50,050,810 148,006,755
148,006,755
Net movement of Quasi-Equity loan (199,453,879) (199,453,879) (199,453,879) Quasi-equity loan taken over by Parent - (60,647,349) (60,647,349) ECH and NCH equity taken over - - - Quasi equity repayment - - Dividends paid to NCI 31.3 - - - - - - - 5,199 5,199 Acquisition of NCI in Ashaka 47,521 4,743,652 - - 46,941,195 51,732,368 (52,405,774) (673,406) Total transaction with owners 47,521 4,743,652 43,585,113 130,416,872 3,703,409 (102,461,874) 80,034,694 (112,965,391) (32,930,697)
Balance at 31 December 2017 2,787,888 222,272,108 160,257,556 130,416,872 9,935,643 (368,683,312) 156,986,755 - 156,986,755
At 1 January 2018 2,787,888 222,272,108 160,257,556 130,416,872 9,935,643 (368,683,312) 156,986,755 - 156,986,755 (Loss)/profit for the year - - (3,902,287) - - - (3,902,287) - (3,902,287)Exchange differences on translating foreign operations - - (3,284) - (645,011) - (648,295) - (648,295)Total comprehensive income for the period
- - (3,905,571) - (645,011) - (4,550,582) - (4,550,582)
Transaction with owners:
Issue of shares23
1,548,826 130,101,427 - - - 131,650,253 - 131,650,253
Deposit for shares now allotted 25 - - - (130,416,872) - - (130,416,872) - (130,416,872)Dividends paid 31.3 - - (13,010,143) - - - (13,010,143) - (13,010,143)Right issue costs - (1,276,843) - - - - (1,276,843) (1,276,843)Total transaction with owners 1,548,826 128,824,584 (13,010,143) (130,416,872) - - (13,053,604) - (13,053,604)Balance at 30 June 2018 4,336,714 351,096,692 143,341,842 - 9,290,632 (368,683,312) 139,382,569 - 139,382,569
Attributable to equity holders of the parent
The accompanying notes and significant accounting policies on pages 10 to 25 form an integral part of these financial statements.
7

Lafarge Africa PlcConsolidated and Separate Statements of Changes in Equity for the year ended 30 June 2018
Company*
Share capital
Share premium Retained earnings Deposit for shares
Foreign currency
translationreserve
Other reserves arising on business combination and
re-organisations Total equity Notes N'000 N'000 N'000 N'000 N'000 N'000 N'000
Balance at 1 January 2017 2,740,367 217,528,456 119,825,320 - - - 340,094,143 Profit for 1 January - 30 June 2017 - - 12,711,472 - - - 12,711,472 Other comprehensive income (Net of tax) - - - - - - Dividend (5,754,771) (5,754,771)Balance as at 30 June 2017 2,740,367 217,528,456 126,782,021 - - - 347,050,844
Loss for the period 1 July - 31 December 2017 (25,935,098) (25,935,098)Other comprehensive income for the year, net of tax
124,065 39,103 163,168 Transaction with owners:
Issue of shares 27 47,521 4,743,653 - - - 4,791,174 Deposit for shares 23.2 - - - 130,416,872 - - 130,416,872 Movement in reserves arising from re-organisation 7,735,815 7,735,815 Net movement of Quasi-Equity loan 17.2 - - - - - (199,453,879) (199,453,879)Total transaction with owners 47,521 4,743,653 (25,811,033) 130,416,872 39,103 (191,718,064) (82,281,948)
Balance at 31 December 2017 2,787,888 222,272,109 100,970,988 130,416,872 39,103 (191,718,064) 264,768,896
At 1 January 2018 2,787,888 222,272,109 100,970,988 130,416,872 39,103 (191,718,064) 264,768,896 Loss for the year - - 2,090,881 - - - 2,090,881 Other comprehensive income (Net of tax) - - - - - - - Total comprehensive income for the period - - 2,090,881 - - - 2,090,881
Transaction with owners:Issue of shares 23 1,548,826 130,101,427 - - - - 131,650,253 Deposit for shares now alloted 25 - - - (130,416,872) - - (130,416,872)
Right issue costs 15.2 - (1,276,843) - - - - (1,276,843)
Dividends declared 31.2 - - (13,010,143) - - - (13,010,143)Total transaction with owners 1,548,826 128,824,584 (13,010,143) (130,416,872) - - (13,053,604)
Balance at 30 June 2018 4,336,714 351,096,693 90,051,726 - 39,103 (191,718,064) 253,806,173
Attributable to equity holders of the parent
The accompanying notes and significant accounting policies form an integral part of these financial statements.
8

Lafarge Africa Plc
30/06/2018 30 Jun. 2017 31 Dec. 2017 30/06/2018 30 Jun. 2017 31 Dec. 2017Notes N'000 N'000 N'000 N'000
Cash flows from operating activities:(Loss)/Profit for the year (3,902,287) 18,160,406 (34,601,409) 2,090,881 16,887,788 (13,223,626)Adjustments to reconcile (Loss)/Profit for the year to net cash flows:Depreciation, Amortisation & Impairment losses on PPE 14 11,405,905 10,732,608 22,181,159 8,259,767 2,733,939 16,304,267 Impairment losses on property, plant and equipment - - 19,178,254 - - 12,394,270 Amortization of intangible asset 15 59,556 - 166,023 - - Impairment of intangible asset 15 - - 226,670 - - Other non cash movements (33,027) (810,498) (1,262,945) (86,474) (1,326,121) (1,725,648)Net unrealized foreign exchange loss 3,551,691 (7,675,602) 1,677,899 3,285,615 (1,410,067) 1,416,442 Finance costs 11 18,822,011 10,924,569 29,740,993 17,735,029 9,927,022 28,956,601 Finance & investment income 11, 10 (1,033,522) (603,561) (1,438,980) (885,401) (11,230,642) (1,107,476)Dividend income - - (1,767) - (294,055)Share of loss from joint venture - - 140,263 - - 112,236 Income tax expense/(credit) 12.1 (2,443,220) - 281,460 677,601 5,837,763 Minimum tax - - 287,672 - 287,672 Provisions and net movement on employee benefits 29 (150,995) - (409,279) (246,180) (408,231)Change in net working capital 523,933 (33,009,059) (42,516,757) 11,620,698 (2,765,258) (45,318,450)Cash flow (used in)/generated from operations 26,800,046 (2,281,137) (6,350,744) 42,451,537 12,816,661 3,231,765
Other non cash movementsIncome taxes paid (1,799,030) (1,039,996) (772,057) (582,687) (44,534) (307,000)Net cash flow (used in)/generated from operating activities
25,001,016 (3,321,133) (7,122,801) 41,868,850 12,772,127 2,924,765
Cash flows from investing activitiesAcquisition of property, plant and equipment 14,15 (6,641,341) (5,769,257) (15,278,494) (2,321,446) (1,359,805) (10,360,055)Acquisition of intangible assets (50,481) (228,192) - - Interest received 10 50,290 1,380,523 288,856 1,049,045 Acquisition of subsidiary, net of cash acquired (673,406) - (673,406)Finance income 11 596,771 - - 465,051 - - Dividend received from unlisted investments - - 1,767 - - - Dividend received from subsidiaries - - - - - 294,055 Net movement in other financial assets 17 (389,422) (709,244) (1,158,701) (404,320) - (1,146,194)Proceeds from sale of property, plant and equipment - 3,157,587 3,129,895 - 3,065,320 2,983,969 Net cash flow (used in)/generated from investing activities
(6,484,473) (3,270,624) (12,826,608) (2,260,715) 1,994,371 (7,852,586)
Cash flows from financing activitiesInterest paid 11, 28 (19,383,780) (5,105,265) (23,698,165) (16,768,609) (4,359,035) (18,739,561)Net movement in other financial assets - (68,687,462) - - (104,813,444) - Dividend paid to equity holders of the company 32.3 (11,845,264) (1,577,413) (16,280,825) (11,845,264) (1,577,413) (16,280,825)Dividend paid to Non Controlling Interest 32.3 - (47,062) (41,863) - - Proceed from right issue 18,705,446 - 18,705,446 - Transaction cost on rights issue - (574,743) - (574,743)Cash received from futures contract 7,661,124 7,661,124 Proceeds from loans and borrowings 28 33,179,397 156,118,436 195,099,306 13,520,617 94,046,408 187,310,535 Repayment of loans and borrowings 28 (32,927,525) (80,731,726) (138,981,397) (32,663,439) (138,646,769)Net cash inflow generated from/(used in) financing activities
(12,271,726) (30,492) 23,183,437 (29,051,249) (16,703,484) 20,729,761
Net increase/(decrease) in cash and cash equivalents
6,244,817 (6,622,249) 3,234,028 10,556,886 (1,936,986) 15,801,940
Cash and cash equivalents at the beginning of the year (1,148,616) (3,730,386) (3,730,386) 6,179,481 (7,783,026) (7,783,026)
Cash and cash equivalents arising from merger - - - - (1,882,466)Effects of exchange rate changes on cash and cash equivalents
58,068 (2,734,660) (652,258) 57,686 369,561 43,033
Cash and cash equivalents at the end of the year 5,154,269 (13,087,295) (1,148,616) 16,794,053 (9,350,451) 6,179,481
Group Company*
Consolidated and Separate Statement of Cash Flows for the year ended 30 June 2018
The accompanying notes and significant accounting policies on pages 10 to 25 form an integral part of these financial statements.
*Due to the merger of the Company with two subsidiaries and the liquidation of two subsidiaries into the Company in December 2017, the 2018 Company numbers are those of the merged and liquidated entities while the 2017 numbers as of June 2017 are those of the Company prior to the merger and liquidation.
9

Lafarge Africa Plc
1 Business description
30th June 2018 30th June 2017 31st Dec. 2017
Lafarge Ready Mix Nigeria Limited Lafarge Ready Mix Nigeria
Limited
Lafarge Ready Mix Nigeria
Limited Lafarge South Africa Holdings (PTY) Limited Egyptian Cement Holdings Lafarge South Africa
Holdings (PTY) LimitedAshaka Cement PLC Atlas Cement Company
Limited.
Ashaka Cement PLC
Lafarge South Africa
Holdings (PTY) LimitedAshaka Cement PLC
2
2 Basis of preparation
i) Compliance with IFRS
ii) Basis of measurement
- defined benefit pension plans - plan assets measured at fair value - inventory - lower of cost and net realisable value
The Group financial statements of Lafarge Africa Plc for the year ended 31 December 2017 have been prepared in accordance with International FinancialReporting Standards ("IFRS") and interpretations issued by the IFRS Interpretations Committee (IFRS IC) applicable to companies reporting under IFRS andthe requirements of the Companies and Allied Matters Act CAP C.20 Laws of the Federation of Nigeria, 2004 and the Financial Reporting Council of NigeriaAct, 2011.
The financial statements comprise the statement of profit or loss and other comprehensive income, the statement of financial position, the statement of changesin equity, the statement of cash flows and the notes to the financial statements.
- non-derivative financial instruments – initially at fair value and subsequently at amortized cost using effective interest rate
Summary of significant accounting policies
These interim condensed consolidated and separate financial statements of Lafarge Africa Plc Group have been prepared in accordance with IAS 34 InterimFinancial Reporting. They do not include all disclosures that would otherwise required in a complete set of financial statements and should be read inconjuction with 2017 annual report. The financial statements which were prepared on a going concern basis, were authorized for issue by the Company's boardof directors on July 23, 2018.
The financial statements have been prepared in accordance with the going concern assumption under the historical cost concept except for the following:
The historical financial information is presented in Naira and all values are rounded to the nearest thousand (N'000), except where otherwise indicated. Theaccounting policies are applicable to both the Company and Group.
- derivative financial instruments – measured at fair value
Lafarge Africa Plc Group has consistently appllied the same accounting policies and methods of computation in its interim condensed consolidated andseparate financial statements as in its 2017 annual financial statements. None of the new standards, interpretations and ammendments , effective for the firsttime from 1st January 2018, have had a material effect on the financial statements.
Lafarge Africa PLC (Lafarge Africa) was incorporated in Nigeria on 26 February, 1959 and commenced business on 10 January 1961. The Company formerlyknown as Lafarge Cement WAPCO Nigeria Plc changed its name after a special resolution was passed by the shareholders at an Annual General Meeting held onWednesday 9 July 2014. The change of name became effective with the acquisition of shares in Lafarge South Africa Holdings (Proprietary) Limited (LSAH),United Cement Company of Nigeria Limited (UNICEM), AshakaCem PLC (AshakaCem) and Atlas Cement Company Limited (Atlas). The Company’s corporatehead office is situated at 27B Gerrard Road, Ikoyi, Lagos which is same as the registered office.
These consolidated and separate financial statements cover the financial period from 1 January 2018 to 30 June 2018. The comparatives for 2017 have not beenadjusted to suit the new Group and Company structure.
Lafarge Africa is in the business of manufacturing and marketing of cement and other cementitious products such as Ready-Mix Concrete, Aggregates, Fly-Ashetc. On July 15, 2016, Lafarge S.A. France and Holcim Limited, Switzerland two large global players merged to form LafargeHolcim Group based in Zurich,Switzerland. Consequently Lafarge Africa is now a subsidiary company of Lafarge Holcim. The term ‘Group’ as used in this report refers to Lafarge Africa, itssubsidiaries and investment in joint operations.
The Group's subsidiaries are as stated below;
Notes to the Consolidated and Separate Financial Statements for the year ended 30 June2018
10

Lafarge Africa Plc
30 Jun2018
30 Jun. 2017 30 Jun2018
30 Jun. 2017
N'000 N'000 N'000 N'0006 Revenue
Sale of goods 162,291,526 154,839,943 100,449,724 52,090,479
The following is an analysis of revenue by product:
Cement 132,216,270 124,313,987 98,835,653 50,334,405 Aggregate and concrete 27,744,188 28,019,259 - - Admixtures and other products (Note 6.1) 2,331,068 2,506,697 - - Revenue-Related party - - 1,614,071 1,756,074
162,291,526 154,839,943 100,449,724 52,090,479
6.1
-
30 Jun2018
30 Jun 2017 30 Jun2018
30 Jun 2017
N'000 N'000 N'000 N'0007 Cost of sales by nature
Variable costs (Note 7.1) 76,219,282 70,398,004 37,361,554 18,553,812 Production costs (Note 7.2) 12,250,278 15,474,470 5,244,142 2,378,575 Maintenance costs 9,853,326 9,017,288 4,338,264 2,595,261 Distribution costs 5,923,994 2,980,262 3,229,416 641,710 Depreciation 11,000,032 10,638,024 8,174,090 2,689,405 Impairment of property, plant and equipment
69,958 - -
Amortisation and impairment of intangible assets
59,557 - - -
General costs 8,023,085 1,812,456 3,989,223 2,542,925
123,329,554 110,390,462 62,336,689 29,401,688
7.1 Variable costsDistribution variable cost 29,024,354 26,393,787 15,028,907 7,181,075 Gas 13,139,562 11,967,454 8,247,828 4,531,370 Power 9,617,332 10,746,962 5,718,476 5,305,831 Raw materials and consumables 24,438,034 21,289,801 8,366,343 1,535,536
76,219,282 70,398,004 37,361,554 18,553,812
7.2 Production costs
30 Jun2018
30 Jun. 2017
30 Jun2018
30 Jun. 2017
N'000 N'000 N'000 N'0008 Selling and marketing expenses
Advertising expenses 227,214 361,028 227,214 220,026 Campaign and innovation expenses 361,581 125,653 81,870 125,653 Other selling and marketing expenses 2,181,191 1,691,116 358,812 432,151
2,769,986 2,177,797 667,896 777,830
30 Jun2018
30 Jun. 2017
30 Jun2018
30 Jun. 2017
N'000 N'000 N'000 N'0009 Administrative expenses by nature
Administrative expenses* 15,022,577 11,122,987 10,162,035 3,272,610 Depreciation 405,873 94,584 85,677 44,534 Technical service fees 4,527,854 4,798,750 3,226,341 1,568,297
19,956,303 16,016,321 13,474,053 4,885,441
*During 2017, Lafarge Africa Plc modified the classification of bank charges to be consistent with the Group's policy. Comparative amounts in the statement ofprofit or loss were reclassified for consistency. As a result, N381 million for the Group and N272 million for the Company were reclassified from administrativeexpenses to finance costs.
Notes to the Consolidated and Separate Financial Statements for the year ended 30 June 2018
Group Company
Group Company
Group
Admixtures and other products represent revenue earned from the sale of fly ash, ready-mix pump sales and other mineral components from South African operations.
Company
Included in the production costs are personnel expenses, by-products costs, inventory write-offs and electrical energy expenses.
Company Group
11
Lafarge Africa Plc
Notes to the Consolidated and Separate Financial Statements for the year ended 30 June 2018
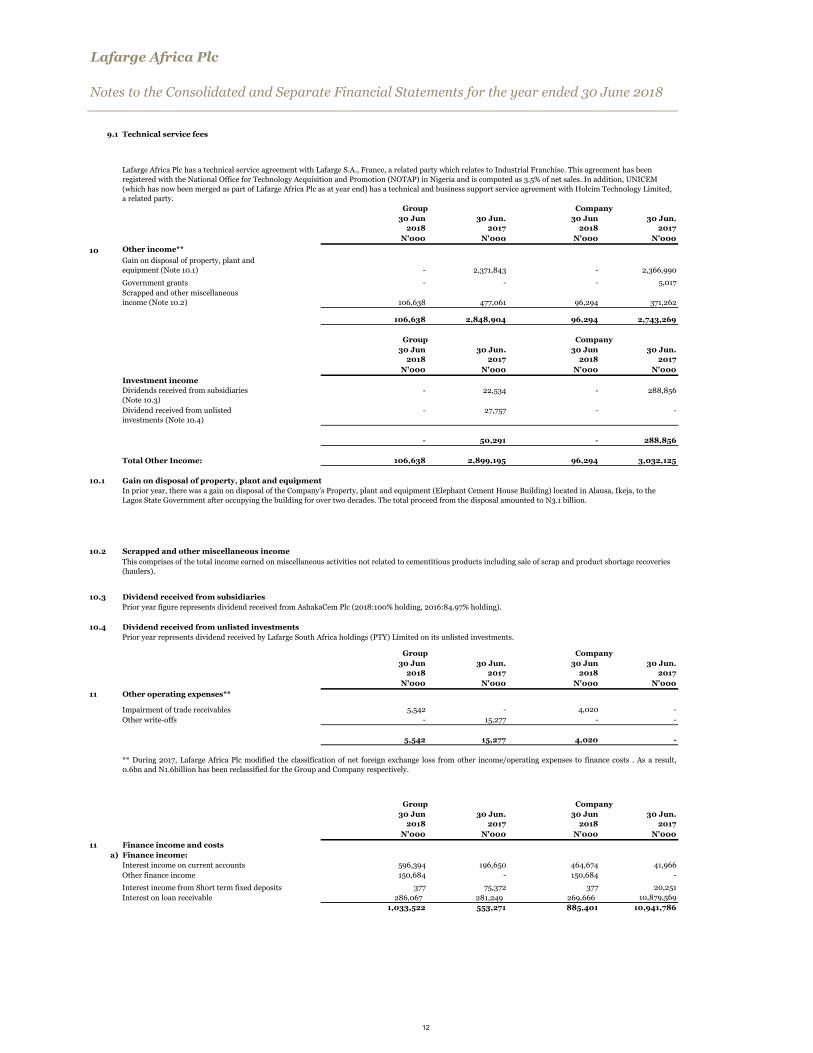
9.1 Technical service fees
30 Jun2018
30 Jun. 2017
30 Jun2018
30 Jun. 2017
N'000 N'000 N'000 N'00010 Other income**
Gain on disposal of property, plant and equipment (Note 10.1) - 2,371,843 - 2,366,990
Government grants - - - 5,017 Scrapped and other miscellaneous income (Note 10.2) 106,638 477,061 96,294 371,262
106,638 2,848,904 96,294 2,743,269
30 Jun2018
30 Jun. 2017
30 Jun2018
30 Jun. 2017
N'000 N'000 N'000 N'000Investment incomeDividends received from subsidiaries (Note 10.3)
- 22,534 - 288,856
Dividend received from unlisted investments (Note 10.4)
- 27,757 - -
- 50,291 - 288,856
Total Other Income: 106,638 2,899,195 96,294 3,032,125
10.1 Gain on disposal of property, plant and equipment
10.2 Scrapped and other miscellaneous income
10.3 Dividend received from subsidiariesPrior year figure represents dividend received from AshakaCem Plc (2018:100% holding, 2016:84.97% holding).
10.4 Dividend received from unlisted investmentsPrior year represents dividend received by Lafarge South Africa holdings (PTY) Limited on its unlisted investments.
30 Jun2018
30 Jun. 2017
30 Jun2018
30 Jun. 2017
N'000 N'000 N'000 N'00011 Other operating expenses**
Impairment of trade receivables 5,542 - 4,020 - Other write-offs - 15,277 - -
5,542 15,277 4,020 -
30 Jun2018
30 Jun. 2017
30 Jun2018
30 Jun. 2017
N'000 N'000 N'000 N'00011 Finance income and costs
a) Finance income:Interest income on current accounts 596,394 196,650 464,674 41,966 Other finance income 150,684 - 150,684 -
Interest income from Short term fixed deposits 377 75,372 377 20,251 Interest on loan receivable 286,067 281,249 269,666 10,879,569
1,033,522 553,271 885,401 10,941,786
In prior year, there was a gain on disposal of the Company’s Property, plant and equipment (Elephant Cement House Building) located in Alausa, Ikeja, to the Lagos State Government after occupying the building for over two decades. The total proceed from the disposal amounted to N3.1 billion.
This comprises of the total income earned on miscellaneous activities not related to cementitious products including sale of scrap and product shortage recoveries (haulers).
Group
Lafarge Africa Plc has a technical service agreement with Lafarge S.A., France, a related party which relates to Industrial Franchise. This agreement has been registered with the National Office for Technology Acquisition and Promotion (NOTAP) in Nigeria and is computed as 3.5% of net sales. In addition, UNICEM (which has now been merged as part of Lafarge Africa Plc as at year end) has a technical and business support service agreement with Holcim Technology Limited, a related party.
Group Company
Company
** During 2017, Lafarge Africa Plc modified the classification of net foreign exchange loss from other income/operating expenses to finance costs . As a result,0.6bn and N1.6billion has been reclassified for the Group and Company respectively.
Company
Group Company
Group
12

Lafarge Africa Plc
Notes to the Consolidated and Separate Financial Statements for the year ended 30 June 2018
30 Jun2018
30 Jun. 2017
30 Jun2018
30 Jun. 2017
N'000 N'000 N'000 N'000
b) Finance costs:Interest on bank overdraft (1,489,002) (1,379,754) (639,458) (482,134)Interest on borrowings (Note 28 b) (16,041,925) (8,940,646) (16,066,682) (9,104,040)Unwinding of discount on provisions (Note 29.1) (44,781) (40,884) - (15,690)Interest cost on employee's long service award (Note 31.1)
(93,609) - (69,938) -
Interest cost on defined benefit (Note 31.2) (189,773) (200,077) (38,256) (58,007)Bank charges (962,921) (381,433) (920,695) (272,168)Finance cost per statement of cash flows (18,822,011) (10,942,794) (17,735,029) (9,932,039)Foreign exchange loss (net) (4,893,797) (589,354) (4,445,250) (4,179,604)Finance costs (23,715,808) (11,532,148) (22,180,279) (14,111,643)
Net finance (costs)/ income recognised in the profit or loss
(22,682,286) (10,978,877) (21,294,878) (3,169,857)
12 Income tax (credit)/ expense
12.1 Income tax (credit)/ expense recognised in profit or loss
30 Jun2018
30 Jun. 2017
30 Jun2018
30 Jun. 2017
N'000 N'000 N'000 N'000Current income taxCompany income tax 1,174,927 1,498,438 - 412,499 Education tax 353,011 64,824 267,514 - Prior year over provision - - -
Capital gains tax - 116,326 - 116,326 Total current tax expense 1,527,938 1,679,588 267,514 528,825
Deferred income taxDeferred income tax (credit)/charge to profit or loss (Note 12.5)
(3,971,158) (3,251,573) 410,087 3,647,491
Income tax (credit)/charge (2,443,220) (1,571,985) 677,601 4,176,316
Income tax (credit)/ expense (2,443,220) (1,571,985) 677,601 4,176,316
12.2 Reconciliation of effective tax to statutory tax
30 Jun2018
30 Jun. 2017
30 Jun2018
30 Jun. 2017
N'000 N'000 N'000 N'000
(6,345,507) 18,160,404 2,768,482 16,887,788
(1,903,651) 5,448,122 830,544 5,066,336
Impact of disallowable expenses for tax purpose 59,282 129,115 7,636 64,562 Impact of non taxable income (897,568) (987,012) (428,093) (1,444,198)
Changes in estimate relating to prior year (283,332) (428,204) - -
Impact of education tax rule 353,011 438,114 267,514 373,289 Impact of unrecognised tax losses - - - - Effect of tax exemption - Netherlands - (6,465,296) - - Effect of pioneer status - - - - Impact of minimum tax - 142,469 - -
- - - -
Impact of capital gains tax - 116,326 - 116,326 Share of profit of equity accounted investees - - - - Impact of changes in pioneer status - - - - Effect of lower tax rates in South Africa 229,038 34,383 - -
(2,443,220) (1,571,985) 677,601 4,176,316
Effective tax rate 39% -9% 24% 25%
The tax on the Company’s loss before income tax differs from the theoretical amount that would arise using the statutory income tax rate as follows:
Group
Income tax expense/ (credit) recognised in profit or loss
Tax calculated at statutory tax rate of 32%, 28% for LSAH (2016: 30%, 28% for LSAH)
(Loss) / profit before tax from continuing operations before income tax credit
Company
Company
Group
Company
Recognition of previously unrecognised deductible temporary differences
This note provides an analysis of the Group and Company's income tax expense. It shows what amounts are recognised directly in equity and how the tax expense is affected by non-assessable and non-deductible items. It also explains significant estimates made if any, in relation to the Group and Company's tax position.
Group
13

Lafarge Africa Plc
Notes to the Consolidated and Separate Financial Statements for the year ended 30 June 2018
12.3 Current tax asset
30 Jun2018
31 Dec 2017
30 Jun2018
31 Dec 2017
N'000 N'000 N'000 N'000
At 1 January 917,797 487,279 - - Company income tax (162,957) (209,878) - - Prior year over-provision - (16,228) - - Charge for the period (162,957) (226,106) - -
30 Jun 2018
31 Dec 2017
30 Jun 2018
31 Dec 2017
N'000 N'000 N'000 N'000
Effect of Pioneer statusPayments during the year 87,141 203,127 - - Exchange rate difference (52,254) 453,497 - - Closing Bal. 789,727 917,797 - -
12.4 Current income tax liabilities
30 Jun2018
31 Dec 2017
30 Jun2018
31 Dec 2017
N'000 N'000 N'000 N'000Balance at 1 January 3,251,525 1,311,906 1,544,949 363,625
Transfer through internal merger - - - 271,163 Charge for the year:Company income tax 1,011,972 1,177,335 - - Education tax 353,011 935,459 267,514 821,406 Capital gains tax - 116,326 - 116,326 Minimum tax - 287,672 - 287,672 Prior year over-provision - - - -
1,364,983 2,516,792 267,514 1,496,567 Payment during the year (1,798,986) (568,930) (582,690) (307,000)Witholding tax utilised - (8,243) - (8,243)
Closing Bal. 2,817,522 3,251,525 1,229,773 1,544,949
12.5 Deferred income tax
The analysis of deferred tax assets/(liabilities) is as follows:
30 Jun2018
31 Dec 2017
30 Jun2018
31 Dec 2017
N'000 N'000 N'000 N'000
Deferred tax assets 10,243,642 7,951,595 15,923,298 16,333,384 Deferred tax liabilities - (1,463,106) - -
Deferred tax assets/(liabilities) net 10,243,642 6,488,489 15,923,298 16,333,384
GroupDeferred tax liabilities/(assets): At 1 January
2018 (Credit)/ charge to P/L (Credit)/ charge to
OCI Exchange rate
differences 31 Jun
2018 N'000 N'000 N'000 N'000 N'000
Property, plant and equipment 24,725,234 (3,565,366) - (646,382) 20,513,486 Provisions and other liabilities (6,407,725) (22,843) - 170,041 (6,260,527) Unutilised tax losses (19,038,136) 630,129 - 695,247 (17,712,760) Employment benefit obligation (131,065) 194,653 - (3,805) 59,783 Prepayments 83776 (71,457) - 930 13,249 Unrealised exchange differences (5,720,573) (1,136,280) - - (6,856,853)
Total deferred tax liabilities/(assets) (6,488,489) (3,971,164) 0 216,031 (10,243,622)
Group Company
Group Company
Company Group
Group Company
14

Lafarge Africa Plc
Notes to the Consolidated and Separate Financial Statements for the year ended 30 June 2018
Deferred tax liabilities/(assets): At 1 January 2017
(Credit)/ charge to P/L (Credit)/ charge to OCI
Exchange rate differences
At 31 December 2017
N'000 N'000 N'000 N'000 N'000Property, plant and equipment 19,524,049 (455,042) - 5,656,227 24,725,234 Provisions and other liabilities (5,445,108) 389,449 - (1,352,066) (6,407,725)Unutilised tax losses (2,567,337) (15,333,984) - (1,136,815) (19,038,136)Employment benefit obligation (211,050) (41,987) 96,854 25,118 (131,065)Prepayments 38,737 8,102 - 36,937 83,776 Operating lease liabilityUnrealised exchange differences (18,980,294) 13,259,721 - - (5,720,573)
OthersTotal deferred tax liabilities/(assets) (7,641,003) (2,173,741) 96,854 3,229,401 (6,488,489)
Company
Deferred tax assets/(liabilities):
At 1 January 2018
Arising from reorganisation
(Credit)/ charge to P/L
(Credit)/ charge to OCI
31 Jun 2018
N'000 N'000 N'000 N'000 N'000Property, plant and equipment 3,756,535 - (3,167,088) - 589,447 Unutilised tax losses (11,684,826) - 4,012,703 - (7,672,123) Provisions and other liabilities (2,699,231) - 421,215 - (2,278,016) Unrealised exchange differences (5,511,209) - (1,051,396) - (6,562,605) Employment benefit obligation (194,653) - 194,653 - - Total deferred tax liabilities/(assets) (16,333,384) - 410,086 - (15,923,298)
Deferred tax liabilities/ (assets): At 1 January 2017
Arising from reorganisation
(Credit)/ charge to P/L
(Credit)/ charge to OCI
At 31 December 2017
N'000 N'000 N'000 N'000 N'000Property, plant and equipment 19,400,045 (16,958,882) 1,315,372 - 3,756,535 Unutilised tax losses (69,671) (1,504,625) (10,110,530) - (11,684,826) Provisions and other liabilities (1,736,816) (1,230,691) 268,276 - (2,699,231) Unrealised exchange differences 581,825 (19,561,934) 13,468,900 - (5,511,209) Employment benefit obligation (144,050) (67,000) (41,987) 58,384 (194,653) OthersTotal deferred tax liabilities/(assets) 18,031,333 (39,323,132) 4,900,031 58,384 (16,333,384)
Deferred tax assets are recognised to the extent that it is probable that taxable profit will be available against which the deductible temporary differences and unutilized tax losses can be utilised.
15

Lafarge Africa Plc
14 Property, plant and equipment
Group Leasehold Land Buildings Production Plant Capitalised Spares
Furniture Motor Vehicles Computer Equipment
Ancillary Plant & Machinery
Construction Work in Progress
Total
N'000 N'000 N'000 N'000 N'000 N'000 N'000 N'000 N'000 N'000
Cost:As at 1 January 2017 7,957,750 108,053,194 339,148,428 2,365,440 6,528,639 2,744,347 1,450,221 556,533 42,121,744 510,926,296 Capital expenditure - 550,721 - - - - - 19,800,622 20,351,343 Construction expenditure capitalised (Note 14.1)
- 1,860,054 18,977,437 2,304,142 3,774,003 209,104 153,987 457,414 (27,736,141) -
Reclassification - 178,541 - - 22,901 - 1,649 357,856 (560,947) - Disposals - (1,802,191) (19,554) - (157,846) (5,894) (20,595) - - (2,006,080)Write-offs - (517,655) (207,183) - (7,747) (517,917) (1,267) - - (1,251,769)Exchange difference - 4,456,516 40,612,793 - 835,841 - - - 505,012 46,410,162
As at 31 December 2017 7,957,750 112,228,459 399,062,642 4,669,582 10,995,791 2,429,640 1,583,995 1,371,803 34,130,290 574,429,952
Cost: - 3,469,807 As at 1 January 2018 7,957,750 112,228,459 - 4,669,582 10,995,791 2,429,640 1,583,995 1,371,803 34,130,290 574,429,952 Capital expenditure - - - - - - - - 8,547,220 8,547,220 Construction expenditure capitalised
- 725,310 2,333,262 - 130,646 235,143 19,162 104,000 (3,547,523) -
Reclassification - - 80,341 - - - - - (103,942) (23,601)Exchange difference - (577,741) (5,024,882) - (302,113) - - - (67,230) (5,971,966)
As at 30 June 2018 7,957,750 112,376,029 (2,611,280) 4,669,582 10,824,324 2,664,783 1,603,157 1,475,803 38,958,815 576,981,604
Depreciation Accumulated depreciation and impairment losses:As at 1 January 2017 3,674,163 17,560,487 89,508,679 1,267,225 4,763,802 2,599,559 1,055,561 256,004 - 120,685,480 Charge for the year 411,161 3,210,468 15,819,837 523,415 1,809,362 184,276 93,401 129,239 - 22,181,159 On disposals - (1,142,990) (40,065) - (40,478) (5,894) (20,595) - - (1,250,022)Write-offs - (170,768) (68,601) - (7,703) (446,774) (1,108) - - (694,954)Impairment loss - 212,210 3,007,891 - 186,285 - - - 15,771,868 19,178,254 Exchange difference - 1,519,952 19,471,713 - (319,077) - - - 5,513 20,678,101
As at 31 December 2017 4,085,324 21,189,359 127,699,454 1,790,640 6,392,191 2,331,167 1,127,259 385,243 15,777,381 180,778,018
As at 1 January 2018 4,085,324 21,189,359 127,699,454 1,790,640 6,392,191 2,331,167 1,127,259 385,243 15,777,381 180,778,018 Charge for the year 124,141 1,682,957 8,468,427 250,121 484,523 110,040 46,510 239,186 - 11,405,906 Reclassification (5,976) - 6,320 - (2,149) 3,043 529 - - 1,767 Exchange difference - (239,897) (1,987,532) - (1,094,995) - - - (3,605) (3,326,028)
As at 30 June 2018 4,203,489 22,632,420 134,186,669 2,040,761 5,779,570 2,444,250 1,174,298 624,429 15,773,776 188,859,663
Carrying amountAs at 30 June 2018 3,754,261 89,743,609 (136,797,949) 2,628,821 5,044,754 220,533 428,859 851,374 23,185,038 388,121,941
At 31 December 2017 3,872,426 91,039,100 271,363,188 2,878,942 4,603,600 98,473 456,736 986,560 18,352,909 393,651,934
Notes to the Consolidated and Separate Financial Statements for the year ended 30 June 2018
16

Lafarge Africa Plc
Notes to the Consolidated and Separate Financial Statements for the year ended 30 June 2018
Company Leasehold Land Buildings Production Plant Capitalised Spares
Furniture Motor Vehicles Computer Equipment
Ancillary Plant & Machinery
Construction Expenditure
Total
N'000 N'000 N'000 N'000 N'000 N'000 N'000 N'000 N'000 N'000Cost:
As at 1 January 2017 2,370,573 3,021,987 137,112,353 2,365,440 2,430,011 1,322,156 1,450,221 556,533 5,163,670 155,792,944 Capital expenditure - - 550,721 - - - - - 11,984,645 12,535,366 Construction expenditure capitalised
- 1,203,917 19,607,018 2,304,142 9,412 163,670 152,338 99,557 (23,540,054) -
Internal merger through business combinations
5,436,994 74,973,776 126,621,618 - 2,352,169 897,922 119,428 - 28,144,907 238,546,814
Disposals - (1,802,191) (5,388) - (43,737) (5,894) (20,595) - - (1,877,805)Write-offs - (517,655) (207,183) - (7,747) (517,917) (1,267) - - (1,251,769)
As at 31 December 2017 7,807,567 76,879,834 283,679,139 4,669,582 4,740,108 1,859,937 1,700,125 656,090 21,753,168 403,745,550
Leasehold Land Buildings Production Plant Capitalised Spares
Furniture Motor Vehicles Computer Equipment
Ancillary Plant & Machinery
Construction Expenditure
Total
N'000 N'000 N'000 N'000 N'000 N'000 N'000 N'000 N'000 N'000Cost: 116,625 116,625 As at 1 January 2018 7,807,567 76,879,834 59,276 4,669,582 59,276 1,859,937 1,700,125 656,090 21,753,168 403,745,550 Capital expenditure - - - - - - - - 4,227,325 4,227,325 Construction expenditure capitalised
- 725,310 1,179,870 - (23,978) 126,073 19,162 104,000 (2,130,438) -
- As at 30 June 2018 7,807,567 77,605,144 1,239,146 4,669,582 35,299 1,986,010 1,719,287 760,090 23,850,055 407,972,875
Accumulated depreciation and impairment losses:
As at 1 January 2017 19,171 1,033,734 34,081,776 1,267,225 2,359,612 1,102,561 1,055,561 256,004 - 41,175,644 Internal merger through business combinations
3,614,460 10,784,642 26,461,517 - 1,048,764 891,741 107,655 - - 42,908,779
Charge for the year 400,916 2,160,386 12,747,784 523,415 81,807 171,010 89,710 129,239 - 16,304,267 Impairment loss - - - - - - - - 12,394,270 12,394,270 On disposals - (1,142,990) (5,278) - (40,478) (5,894) (20,595) - - (1,215,235)Write-offs - (170,768) (68,601) - (7,703) (446,774) (1,108) - - (694,954)
As at 31 December 2017 4,034,547 12,665,004 73,217,198 1,790,640 3,442,002 1,712,644 1,231,223 385,243 12,394,270 110,872,771
As at 1 January 2018 4,034,547 12,665,004 73,217,198 1,790,640 3,442,002 1,712,644 1,231,223 385,243 12,394,270 110,872,771 Charge for the year 117,811 1,128,225 6,235,885 250,121 143,281 99,722 45,534 239,186 - 8,259,767 As at 30 June 2018 4,152,358 13,793,229 79,453,083 2,040,761 3,585,283 1,812,366 1,276,757 624,429 12,394,270 119,132,538
Carrying amountAs at 30 June 2018 3,655,209 63,811,916 (78,213,938) 2,628,821 (3,549,985) 173,644 442,530 135,661 11,455,785 288,840,337
At 31 December 2017 3,773,020 64,214,830 210,461,941 2,878,942 1,298,106 147,293 468,902 270,847 9,358,898 292,872,779
14.12 Depreciation
2018 2017 2018 2017N'000 N'000 N'000 N'000
Cost of sales 11,000,032 21,447,285 8,174,090 15,815,377 Administrative expenses 405,873 733,874 85,677 488,890
11,405,905 22,181,159 8,259,767 16,304,267
Depreciation for the year has been charged as follows: Group Company
17

Lafarge Africa Plc
15 Intangible assets
30 Jun2018
31 Dec 2017
N'000 N'000
CostAt 1 January 5,102,341 2,914,806 Addition 50,481 228,192 Reclassification 23,601 Exchange difference 790,008 1,959,343
5,966,431 5,102,341
Accumulated amortisationAt 1 January 2,468,015 1,351,307 Charge for the year 59,556 166,023 Reclassification 1,767 Impairment - 226,670 Exchange difference 103,337 724,015
2,632,675 2,468,015
Carrying amount 3,333,756 2,634,326
15
15.1 Merger of UNICEM and Atlas with Lafarge Africa Plc
15.2
Intangible assets represents mineral rights, good will and computer software in the Group's operations. The Company does not have intangible assets.
Prior to the liquidation of Nigerian Cement Holdings (NCH), included in other reserves was Quasi equity instrument amounting to a sum of NGN 139billion which represented USD 493 million loans originally due to Holderfin B.V. but later assigned to Caricement B.V. This instrument was initially carriedas loans in prior years but was converted to an equity instrument in July 2016, with amendments made to the existing loan agreements. Amendments to theloan agreements showed that repayment of the loans was at the discretion of the Company and due on liquidation of the borrower.
In 2017 and upon the liquidation of NCH, the outstanding Quasi-Equity instrument of USD344 million (inclusive of accrued interest of USD17.2 million)was converted to loan in the books of Lafarge Africa. Subsequently, loans payable to Caricement B.V were used in subscribing for rights taken up byCaricement B.V in respect of the rights issue via a debt to equity conversion as at 31 December 2017.
Liquidation of ECH and NCH
On 11 December 2017, in order to streamline the Group structure, Egyptian Cement Holdings (ECH) and Nigerian Cement Holdings (NCH) were liquidatedand their assets and liabilities assumed by Lafarge Africa. This was done in order for Lafarge Africa to have direct ownership of UNICEM.
Business CombinationThe Group applies the pooling of interest method for its business combination under common control. The difference between the net assets acquired at their carrying value and the consideration paid is recognised in equity. In the reporting period, Lafarge Africa Plc acquired the remaining non-controlling interest in AshakaCem; merged UNICEM and Atlas into Lafarge Africa Plc and also liquidated ECH and NCH.
In 2017, the Company sought and obtained shareholders' and regulatory approval to merge with two wholly owned subsidiaries, UNICEM and Atlas, effective on 22 December 2017.The merger was effected in 2017 and the operational integration of the entities has been finalised. The subsidiaries which were merged were ultimately controlled by the same party before and after the merger and Common control is therefore not transitory. Consequently, this is a business combination of entities under common control.
The Directors have elected not to restate the comparatives in the Separate Statement of profit or loss and other comprehensive income as this is not explicitly required by the standards.
The net assets of these subsidiaries were transferred to the Company at no purchase consideration and recognised in other reserves in accordance with the Group's accounting policy.
Notes to the Consolidated and Separate Financial Statements for the year ended 30 June 2018
Group
18

Lafarge Africa PlcNotes to the Consolidated and Separate Financial Statements for the year ended 30 June 2018
16 Interests in other entities
16.1 Investment in subsidiaries
30 June2018
Name of entity Principal activities Place of
Incorporation Proportion Cost
% N'000Lafarge Ready Mix Nigeria Limited Aggregate and Concrete Nigeria 100 50,000 Lafarge South Africa Holdings (PTY) Limited Building
Materials South Africa 100 118,141,539
Ashaka Cement PLC Cement Nigeria 100 63,896,867 182,088,406
31 December 2017
Name of entity Principal Activities Place of Incorporation
Proportion Cost
% N'000Lafarge Ready Mix Nigeria Limited Aggregate and Concrete Nigeria 100 50,000
Lafarge South Africa Holdings (PTY) Limited Building Materials
South Africa
100 118,141,539
Ashaka Cement PLC Cement Nigeria 100 63,896,867 182,088,406
30 Jun2018
31 Dec 2017
30 Jun2018
31 Dec 2017
17 Other financial assets N'000 N'000 N'000 N'000 Non currentAvailable for sale - 11,471 - - Other financial assets (Note 17.1) 1,972,044 1,571,151 1,961,058 1,556,738
1,972,044 1,582,622 1,961,058 1,556,738
Current:Other financial assets (Note 17.2) 585,684 592,538 347,236 326,635
2,557,728 2,175,160 2,308,294 1,883,373
30 Jun2018
31 Dec 2017
30 Jun2018
31 Dec 2017
17.1 Other financial assets - Non current N'000 N'000 N'000 N'000 Loan to CBI Ghana 1,328,019 1,370,832 1,328,019 1,370,832
Receivable from third parties 644,025 200,319 633,039 185,906 1,972,044 1,571,151 1,961,058 1,556,738
17.2 Other financial assets - Current
30 Jun2018
31 Dec 2017
30 Jun2018
31 Dec 2017
N'000 N'000 N'000 N'000 Loan to related company " 230,143 - - - Staff loans 5,192 15,334 5,192 15,334 Short term receivables 350,348 362,406 342,044 96,503 Loan to CBI Ghana 214,798 - 214,798
585,684 592,538 347,236 326,635
Group Company
Group
Group
The Group’s principal subsidiaries at 30 June 2018 are set out below. Unless otherwise stated, they have share capital consisting solely of ordinary sharesthat are held directly by the Group, and the proportion of ownership interests held equals the voting rights held by the Group. The place of incorporation isalso their principal place of business.
Company
Company
19

Lafarge Africa PlcNotes to the Consolidated and Separate Financial Statements for the year ended 30 June 2018
18 Derivative financial instruments
Assets Liabilities Assets Liabilities N'000 N'000 N'000 N'000
Caricement B.V 174,138 640,091 4,212,406
- 174,138 640,091 4,212,406 19 Other assets
30 Jun2018
31 Dec 2017
30 Jun2018
31 Dec 2017
N'000 N'000 N'000 N'000
Non current 21,359,031 20,803,113 15,523,516 14,984,747 Current 16,253,586 15,162,092 14,121,825 10,679,505
37,612,617 35,965,205 29,645,341 25,664,252
Advance payment to suppliers 6,322,377 3,960,699 5,686,591 2,820,447 Prepaid medical - 23,293 - 23,293 Defered charges 12,000 16188 12,000 16,188 Prepayment for Gas 11,838,578 9,833,096 11,838,578 9,833,096 Rental lease 718,946 709,244 - - Prepaid rent 432,573 581,164 370,614 510,291 Prepaid insurance 99,218 297,719 75,864 221,161 Prepaid expenses 1,394,539 1,087,127 1,123,840 536,960 Advance payment to transporters 6,360,489 8,538,932 6,360,489 8,538,932
Advance payment of taxes and levies 2,100,000 1,052,287 2,100,000 1,052,287
Letters of credit 6,103,940 7,645,483 - - Long term prepayments - 34,232 - 34,232 Deposit for imports 2,077,365 2,077,365 2,077,365 2,077,365 Other assets 152,592 108,376 - -
37,612,616 35,965,205 29,645,341 25,664,252
20 Inventories
30 Jun2018
31 Dec 2017
30 Jun2018
31 Dec 2017
N'000 N'000 N'000 N'000
Raw materials 12,140,718 12,702,259 9,967,665 10,653,843 Work in progress 8,835,613 10,860,537 252,832 435,337 Finished goods 12,106,805 12,357,522 11,689,045 11,787,460 Spare parts 21,580,449 19,115,915 15,962,335 14,146,953 Other supplies 3,686,939 3,230,233 2,065,182 2,034,238
58,350,524 58,266,466 39,937,059 39,057,831
21 Trade and other receivables
30 Jun2018
31 Dec 2017
30 Jun2018
31 Dec 2017
N'000 N'000 N'000 N'000
Trade receivables:Third party sales 18,716,382 20,123,998 3,087,410 2,458,322 Related party sales 377,256 814,668 418,542 1,301,250
19,093,638 20,938,666 3,505,952 3,759,572 Impairment on trade receivables (616,284) (954,963) (113,428) (127,621) Net trade receivables 18,477,354 19,983,703 3,392,524 3,631,951
Other receivables 3,478,644 3,479,803 763,441 1,411,158 Due from related parties 3,647,188 1,646,610 7146489 10,887,861
7,125,832 5,126,413 7,909,930 12,299,019 Net other receivables 7,125,832 5,126,413 7,909,930 12,299,019
Total trade and other receivables 25,603,186 25,110,116 11,302,454 15,930,970
Group
Group Company
Group Company
The Group/Company's derivative financial instruments arose from Non-deliverable foreign exchange forward (NDF) contracts with commercial banks thatwere yet to mature as at reporting date, and includes:
30-Jun-18 31-Dec-17
Company
20

Lafarge Africa PlcNotes to the Consolidated and Separate Financial Statements for the year ended 30 June 2018
30 Jun2018
31 Dec 2017
30 Jun2018
31 Dec 2017
N'000 N'000 N'000 N'00022 Cash and cash equivalents
Restricted cash (Note 22.1) 1,066,377 20,481,593 1,066,377 20,481,593 Cash in hand and at bank (Note 22.2) 18,478,466 29,933,164 16,794,053 21,217,261
Cash and cash equivalents in the statement of financial position 19,544,843 50,414,757 17,860,430 41,698,854
22.1 Restricted cash
22.2 Cash and cash equivalents in the statement of cash flowsFor the purpose of cash flow statement, cash and cash equivalents comprises:
30 Jun2018
31 Dec 2017
30 Jun2018
31 Dec 2017
N'000 N'000 N'000 N'000
Cash in hand and at bank 18,478,466 29,933,164 16,794,053 21,217,261 Less: bank overdrafts (13,324,200) (31,081,780) - (15,037,780)
Cash and cash equivalents in statement of cash flows
5,154,266 (1,148,616) 16,794,053 6,179,481
23 Share capital and Share premium23.1 Share capital
30 Jun2018
31 Dec 2017
30 Jun2018
31 Dec 2017
N'000 N'000 N'000 N'000Authorised:10,000,000,000 ordinary shares of 50k each 5,000,000 5,000,000 5,000,000 5,000,000
Issued and fully paidOrdinary shares of 50k each
No of shares Share capital '000 N'000
At 1 January 2018 5,575,776 2,787,888 Issued during the year 3,097,653 1,548,826 At 30 June 2018 8,673,429 4,336,714
At 1 January 2017 5,480,734 2,740,367 Issued during the year 95,042 47,521 At 31 December 2017 5,575,776 2,787,888
23.2 Share premium No of shares Share premium
'000 N'000
At 1 January 2018 5,575,776 222,272,108 Issued during the year 3,097,653 130,101,427 Transactional share issue costs -1,276,843 At 30 June 2018 8,673,429 351,096,692
At 1 January 2017 5,480,734 217,528,456 Issued during the year 95,042 4,743,652 At 31 December 2017 5,575,776 222,272,108
Group
Group
Company
As at period end, cash and cash equivalents comprised of restricted cash which represents unclaimed dividend amounting to N1.07 billion (2017: N20billion).
Company
Company
Group
21

Lafarge Africa PlcNotes to the Consolidated and Separate Financial Statements for the year ended 30 June 2018
24 Basic earnings per share
30 Jun2018
31 Dec 2017
30 Jun2018
31 Dec 2017
N'000 N'000 N'000 N'000
(Loss) /profit attributable to equity holders of the Company
(3,902,287) 4,836,600 2,090,881 6,888,539
Average number of ordinary shares in issue (Basic) 8,673,429 5,269,745 8,673,429 5,269,745
Basic earnings per share (Kobo) (45) 92 24 131
25 Deposit for shares
30 Jun2018
31 Dec 2017
30 Jun2018
31 Dec 2017
N'000 N'000 N'000 N'000Cash received for rights issue - 19,415,289 - 19,415,289 Quasi equity loan converted for right issue 112,234,964 - 112,234,964 Right issue costs (1,233,381) (1,233,381)
- 130,416,872 - 130,416,872
26 Foreign currency translation reserve
27 Other reserves arising on business combination and re-organisations
Basic earnings per share is calculated by dividing the (loss)/profit attributable to equity holders of the Company by the weighted average number ofordinary shares outstanding at the end of the reporting period.
Group
Group Company
The other reserves arising on business combination and re-organisation is used to recognise the adjustments arising from business combination/re-organisation for entities under common control, when the pooling of interest method has been used.
Company
When the recently concluded Rights Issue was opened, both Associated International Cement UK and Lafarge Associated Nigeria Ltd traded their Rights;431,433,751 units and 906,656,548 units respectively to Caricement BV. Including its own Rights (872,151,809 units), Caricement BV subscribed to a totalof 2,210, 242,107 units. Additional 430,580,572 units of shares, not taken up by the minority shareholders, was also taken up by Caricement B.V, resultingto a total of 2,640,822,679 rights taken up.Quasi-Equity loan due to Caricement B.V. was converted for the purchase of these rights in a debt-for-equity conversion amounting to N112.23 billion.Cash received for rights issue represents proceeds from right issue of shares to minority shareholders who took up 456,830,344 rights out of the totalavailable rights of 3,097,653,023 at the rights issue price of N42.50 amounting to N19.42billion.
In 2017, the Company allotted N131.6 billion by way of a Rights Issue of 3,097,653,023 ordinary shares of 50 kobo each at N42.50 per share to existingshareholders on the basis of five (5) new ordinary shares for every nine (9) existing ordinary shares held. At the conclusion of the offer, the Rights Issuewas 100% subscribed and the Board of Directors on 28th December, 2017 passed a resolution to approve the basis of allotment ad this was approved inMarch 2018 and thereby allotted. In 2017, LafargeHolcim Group, majority shareholder, re-organised its shareholding in the Company. Prior to this re-organisation, LafargeHolcim equityinterest is held via six (6) of its subsidiaries i.e Associated International Cement UK, Financiere Lafarge SAS, Holcibel SA, Lafarge Nigeria UK Ltd, LafargeAssociated Nigeria Ltd and Lafarge Cement International BV. At the conclusion of the re-organisation via the nominal transfer window of the NigerianStock Exchange (NSE), the shares held by Lafarge Nigeria UK Ltd (427,453,603 units) were transferred to Associated International Cement UK while theshares held by Financiere Lafarge SAS (797,234,683 units), Holcibel S.A (454,493,279 units) and Lafarge Cement International B.V (318,145,295 units)were transferred to Caricement BV, a subsidiary company of LafargeHolcim Group.
This represents exchange differences arising from the translation of the financial statements of Lafarge South Africa to the Group’s reporting currency which is Naira.
22

Lafarge Africa Plc
28 Loans and borrowings
(a) 30 Jun2018
31 Dec 2017
30 Jun2018
31 Dec 2017
N'000 5161086 N'000 N'000
Non-current 95,171,709 68,715,378 64,701,948 64,900,757 Current 166,768,931 187,831,582 178,670,531 190,724,579 Total loans and borrowings 261,940,640 256,546,960 243,372,479 255,625,336
Split into:Power fund 13,658,598 7,698,505 6,887,217 7,698,505 Bond 60,004,044 59,842,611 60,004,044 59,842,611 Due to FBN 40,377,241 44,275,864 40,694,581 44,275,864 Related party loan 147,582,585 144,391,559 135,786,637 143,808,356 Lafarge Gypsum S.A Pty Ltd 318,172 338,421 - Total loans and borrowings 261,940,640 256,546,960 243,372,479 255,625,336
(b) Movement in loans and borrowings 30 Jun
2018 31 Dec
2017 30 Jun
2018 31 Dec
2017 N'000 N'000 N'000 N'000
At 1 January 256,546,960 104,873,120 255,625,336 106,380,681 Transfer through business re-organisation - 2,781,482 Additions:Loan received 33,179,397 195,099,306 13,520,617 187,310,535
289,726,357 299,972,426 269,145,953 296,472,698
Interest expensed 16,041,925 22,067,619 16,066,682 24,782,932 Interest paid (16,931,857) (16,746,868) (15,208,456) (14,919,980)Principal repaid (25,699,113) (138,981,397) (26,302,381) (138,646,769)Conversion of Quasi-equity - 199,453,879 - 199,453,879 Reclassification - (1,698,932) - (1,250,365)Converted for Right Issue - (112,234,964) - (112,234,964)Exchange (gain) / loss (1,196,672) 4,715,197 (329,318) 1,967,905 Closing Bal. 261,940,640 256,546,960 243,372,479 255,625,336
29 Provisions
30 Jun2018
31 Dec 2017
30 Jun2018
31 Dec 2017
N'000 N'000 N'000 N'000
Non current (Note 29.1) 3,646,326 3,472,388 969,486 909,320 Current (Note 29.2) 841,284 1,166,217 588,922 895,268
4,487,610 4,638,605 1,558,408 1,804,588
29.1 Non current 30 Jun
2018 31 Dec
2017 30 Jun
2018 31 Dec
2017 Site restoration cost N'000 N'000 N'000 N'000At 1 January 3,472,388 2,200,640 909,320 563,468 Transfer through business re-organisation - - - 104,053 Provision made during the year 140,166 297,192 60,166 311,000 Utilised (2,871) (14,470) - - Change in estimate - (390,479) - (187,613)Reclassification 135,840 (40,753) - - Unwinding of discount 44,781 182,154 - 118,412 Exchange difference (143,978) 1,238,104 - - Closing Balance 3,646,326 3,472,388 969,486 909,320
Notes to the Consolidated and Separate Financial Statements for the year ended 30 June 2018
The provision for site restoration represents an estimate of the costs involved in restoring production sites at the end of the expected life ofthe quarries. The provision is an estimate based on reclamation closure expert valuation and management's re-assessment. The cost would be unwound for a period of 5-15 years for the Group and Company. The long term inflation and discount rates used in the estimate for Nigerianentities was 8.0% and 8.1% respectively while for South African entities the long term inflation and discount rates used was 2.0% and 6.6%respectively.
Group Company
Group Company
Group Company
Group Company
23

Lafarge Africa PlcNotes to the Consolidated and Separate Financial Statements for the year ended 30 June 2018
29.2 CurrentGroup Employee profit
share scheme Productivity
bonus Total
N'000 N'000 N'000At January 2017 - 1,176,910 1,176,910 Reclassification - (34,544) (34,544)Provision made during the year - 2,384,904 2,384,904 Payment (2,361,053) (2,361,053)Exchange differences - - At 31 December 2017 - 1,166,217 1,166,217 Reclassification (55,304) (55,304)Provision made during the year - 1,122,837 1,122,837 Payment in the year - (1,392,466) (1,392,466)Exchange differences - - - At 30 Jun. 2018 - 841,284 841,284
Company Employee profit share scheme
Productivity bonus
Total
N'000 N'000 N'000 At January 2017 - 841,526 841,526 Transfer through business re-organisation - 124,479 124,479 Provision made during the year 1,989,016 1,989,016 Payment - (2,059,753) (2,059,753)At 31 December 2017 - 895,268 895,268 Transfer through business re-organisation - 876,588 876,588 Provision made during the year - - Payment in the year - (1,182,934) (1,182,934)At 30 Jun. 2018 - 588,922 588,922
30 Deferred revenue 30 Jun2018
31 Dec 2017
30 Jun2018
31 Dec 2017
N'000 N'000 N'000 N'000Non-current 1,463,101 1,518,467 1,463,101 1,518,467 Current 110,732 110,732 110,732 110,732
1,573,833 1,629,199 1,573,833 1,629,199
30 Jun2018
31 Dec 2017
30 Jun2018
31 Dec 2017
N'000 N'000 N'000 N'000
Opening balance 1,629,199 1,789,391 1,629,199 752,600 Transfer through business re-organisation - - - 1,036,791 Grant released to profit or loss (55,366) (160,192) (55,366) (160,192)Closing balance 1,573,833 1,629,199 1,573,833 1,629,199
The provision for productivity bonus is based on employee performance during the year. It is payable in the year 2018.
Company
Group Company
Group
24

Lafarge Africa PlcNotes to the Consolidated and Separate Financial Statements for the year ended 30 June 2018
31 Trade and other payables
Trade payables 30 Jun
2018 31 Dec
2017 30 Jun
2018 31 Dec
2017 N'000 N'000 N'000 N'000
Trade payables 41,507,523 40,149,875 17,622,581 19,777,538 Related party - technical service fee (Note 31.1)
29,491,724 27,981,758 25,224,938 18,273,023
70,999,247 68,131,633 42,847,519 38,050,561 Other payables: - - - Customers' deposits 3,626,001 3,804,619 2,570,830 2,750,491 Related companies 8,389,851 10,264,271 7,883,090 7,226,888 Withholding tax payable 656,755 1,185,171 642,580 1,071,661 Value added tax payable 1,806,987 1,592,063 1,612,282 1,574,929 Accrued interest 428,684 451,799 - - Employee provisions and other liabilities 167,661 143,149 38,764 108,619 Rent received in advance 1,729 1,729 1,729 1,729
Professional fees 86,212 94,870 66,062 85,870 Accruals 22,691,819 20,499,103 21,331,554 13,075,698 Other creditors 4,279,685 3,679,146 3,120,341 2,830,981 Dividend payable (Note 31.2) 4,317,497 3,152,627 4,317,497 3,152,627
46,452,880 44,868,547 41,584,729 31,879,493
117,452,127 113,000,180 84,432,248 69,930,054
31.1 LafargeHolcim Technical service fees
-
-
-
-
31.2 Dividend payable
30 Jun2018
31 Dec 2017
30 Jun2018
31 Dec 2017
N'000 N'000 N'000 N'000
At 1 January 3,152,627 13,459,412 3,152,627 13,459,412 Dividend declared 13,010,134 5,754,771 13,010,134 5,754,771 Payment to the equity holders of the parent (11,845,264) (16,280,825) (11,845,264) (16,280,825) Dividend to be refunded by registrars - 219,269 - 219,269 Closing Balance 4,317,497 3,152,627 4,317,497 3,152,627
31.3 Dividend paid
30 Jun2018
31 Dec 2017
30 Jun2018
31 Dec 2017
N'000 N'000 N'000 N'000
Lafarge Africa Plc 11,845,264 16,280,825 11,845,264 16,280,825 Paid to Non Controlling Interest - 41,863 - - Total 11,845,264 16,322,688 11,845,264 16,280,825
Group Company
The guarantee by LafargeHolcim of the achievement of raw material reserves and production targets by Lafarge Africa Plc.
The following dividend were approved by the shareholders and subsequently paid during the year:
The Industrial Franchise Agreement has been registered with National Office for Technology Acquisition and Promotion (NOTAP) inNigeria. It represents 2% (AshakaCem) and 3.5% (WAPCO) of net sales and 2% of profit before tax if greater than zero for technicalknowhow, business support and licencing arrangement.
The balance on dividend payable is due to Lafarge Associated Nigeria Limited for the years 2015 to 2017.
This represents the outstanding liability on the Industrial Franchise Agreement with LafargeHolcim of Switzerland. The terms of theagreements include:
Group Company
The right for Lafarge Africa Plc to use technical research and development information relating to production and distribution of cementproducts;
The provision by LafargeHolcim of technical and operational support through the secondment of suitably qualified expatriate personnel, asrequested by Lafarge Africa Plc and approved by the Federal Government of Nigeria.
Group Company
25