Lafarge – Raw Materials and Shipping -...
20
Lafarge – Raw Materials and Shipping September 2014 © AUBERTSTORCH - Getty
Transcript of Lafarge – Raw Materials and Shipping -...

Lafarge – Raw Materials and ShippingSeptember 2014
© A
UB
ER
TS
TO
RC
H -
Get
ty

Lafarge profile 2013
� A World leader in building materials
� Major player in the cement , aggregatesand concrete businesses
� We contribute to the construction of cities throughout the world with innovative solutions, providing cities with more housing, and ensuring that they are more compact, more durable, more beautiful and better connected
� Operating in 62 countries
� 64,000 employees
� €15.198 billion of annual sales
� 1,636 production sites
� Listed on the Paris Stock Exchange
|April 2014||Building Better Cities| 2
© L
afar
ge m
edia
libra
ry-
A.D
etie
nne
-C
AP
A P
ictu
res
A well-balanced geographical portfolio
North America
€3,137m 7,752
Latin America
€869m 2,669
Middle East and Africa
€4,067m 19,055
Western Europe
€3,256m 14,431
Central and Eastern Europe
€1,145m 6,086
Annual sales Employees
|April 2014||Building Better Cities| 3
Asia
€2,724m 14,094

Cement: key figuresCement | A world leader
Sales
€9,657m
Employees
38,000
Production sites
155
Operatingin
56 countries
14 %
34 %
7 %
9 %
12 %
24 %
Sales by region
Western Europe Middle East and Africa
Latin America Central and Eastern Europe
North America Asia
|April 2014||Building Better Cities| 4
Cement , a hydraulic binder and a key ingredient in concretes and mortars, is mainly used by the building and public construction industries

Aggregates and Concrete: key figuresAggregates and Concrete | World no.2 and World no.4
Sales
€5,451m
Employees
25,000
Production sites
1,481
Operatingin
37 countries
|April 2014||Building Better Cities| 5
41.1%
2.8%
1.0%9.9 %
45.7%
1.8 %Aggregates sales by region
34.6%
16.5%3.8%3.4%
32.1%
9.6%Concrete sales by region
Western EuropeLatin AmericaNorth America
Middle East and AfricaCentral and Eastern EuropeAsia

Our strategy
© L
afar
ge M
edia
libra
ry-C
harle
s P
lum
ey-F
aye
-R
udy
Ric
ciot
ti (a
rchi
tect
)
Solid foundations for growth (1/2)
� A geographical portfolio with well-balanced positio ns and a strong presence in emerging countries. � Share of sales in emerging markets: from 32 % in 2005 to 58 % in 2013
� None of these countries account for more than 5% of our sales
� Focusing on our core businesses� Cement , aggregates and concrete
� High potential for development and significant prospects of synergies
� A country-based organization� To be close to our markets and customers
|April 2014||Building Better Cities| 7
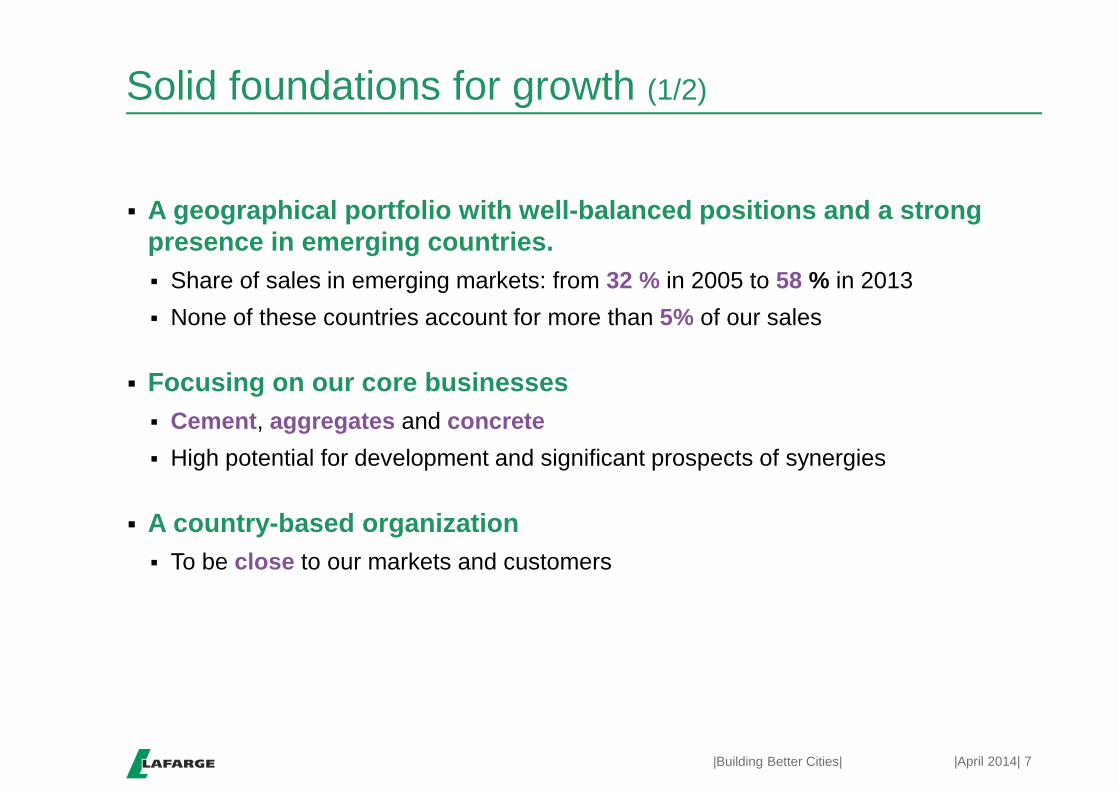
Solid foundations for growth (2/2)
71%Of sales outside Europe
A geographical portfolio with well-balanced positionsBreakdown of sales by region
Focusing on our core businessesBreakdown of sales by business
A strong presence in emerging markets
21.4 %
26.9%
5.7 %7,5 %
20.6 %
17.9%
Western Europe Middle East and AfricaLatin America Central and Eastern EuropeNorth America Asia
63.5%
35.9 %
0.6 %
Cement Aggregates & concrete Others
68 %
42%32 %
58 %
2005 2013Sales in developed marketsSales in emerging markets
|April 2014||Building Better Cities| 8

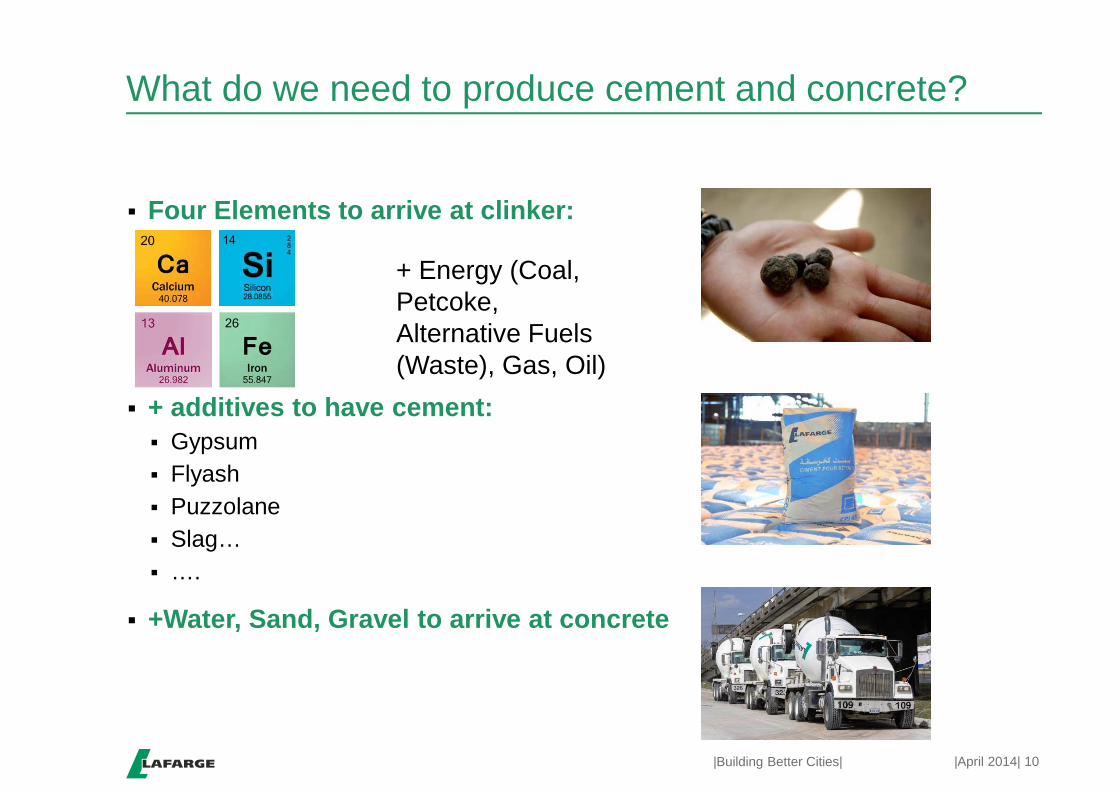
What do we need to produce cement and concrete?
� Four Elements to arrive at clinker:
� + additives to have cement:� Gypsum� Flyash� Puzzolane� Slag…� ….
� +Water, Sand, Gravel to arrive at concrete
10|Building Better Cities| |April 2014|
+ Energy (Coal, Petcoke, Alternative Fuels (Waste), Gas, Oil)

Logisitcs is a Key Factor for the Raw Materials
� Raw Material Consumption of Lafarge� 470 Mmt of Raw Materials� 10 Mmt of Coal and Petcoke
� Production of Lafarge� 136.8 Mmt of Cement
� Means of transportation:� Pneumatic vessels (Cement, Cementicious Materials)� Dry bulk vessels (Iron Ore, Bauxite, Slag, Gypsum, Coal, Petcoke, Limestone….)
from small coasters up to small capesize vessels� Barging (River and Ocean)
11|Building Better Cities|
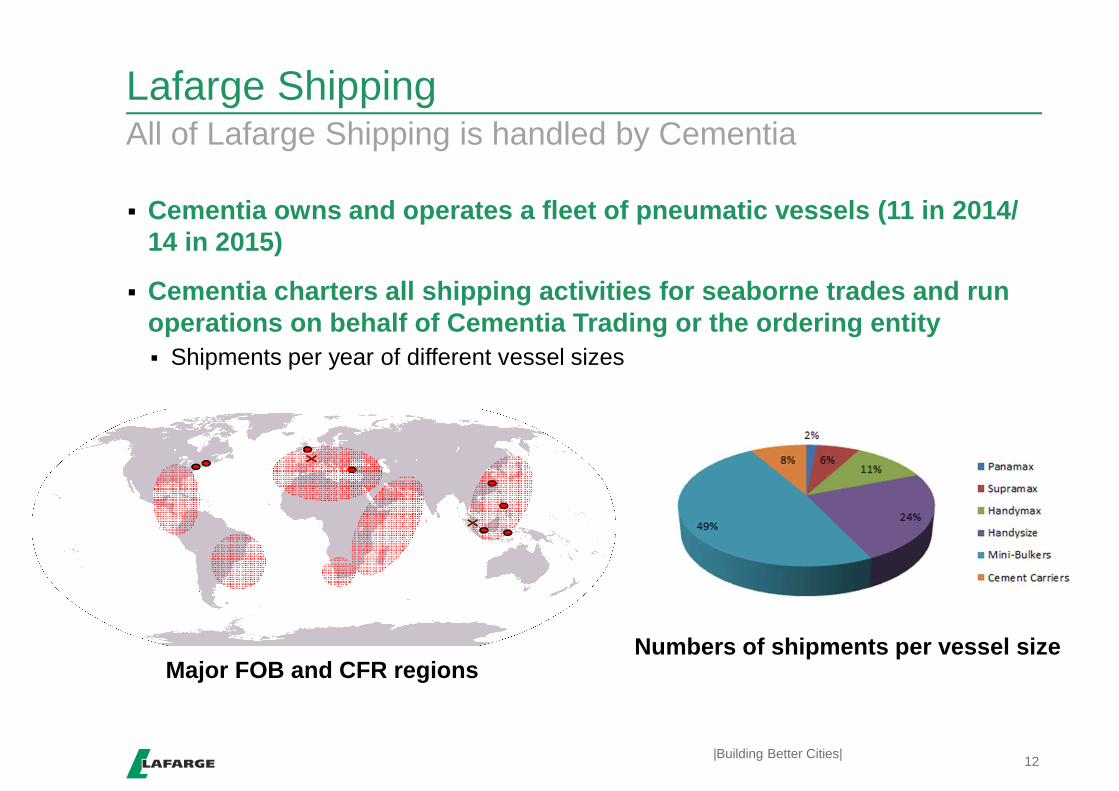
Lafarge Shipping
� Cementia owns and operates a fleet of pneumatic vess els (11 in 2014/ 14 in 2015)
� Cementia charters all shipping activities for seabor ne trades and run operations on behalf of Cementia Trading or the orde ring entity � Shipments per year of different vessel sizes
12
All of Lafarge Shipping is handled by Cementia
|Building Better Cities|
Numbers of shipments per vessel sizeMajor FOB and CFR regions

Solid Fuels - Petcoke
CEMENTIA

Lafarge Solid Fuels
� In 2013 Lafarge founded Lafarge Energy Solutions to look after all seaborne trades.
14
Ocean freight based Solid Fuel Activity
|Building Better Cities|
2013 2014 2015
1.4 Mmt
3.8 Mmt4.5 Mmt
2016
35%
22%
15%
9%
19%Europe/Med
Africa
Americas
Indian Basin
Asia
Ocean freight based Solid Fuel Activity
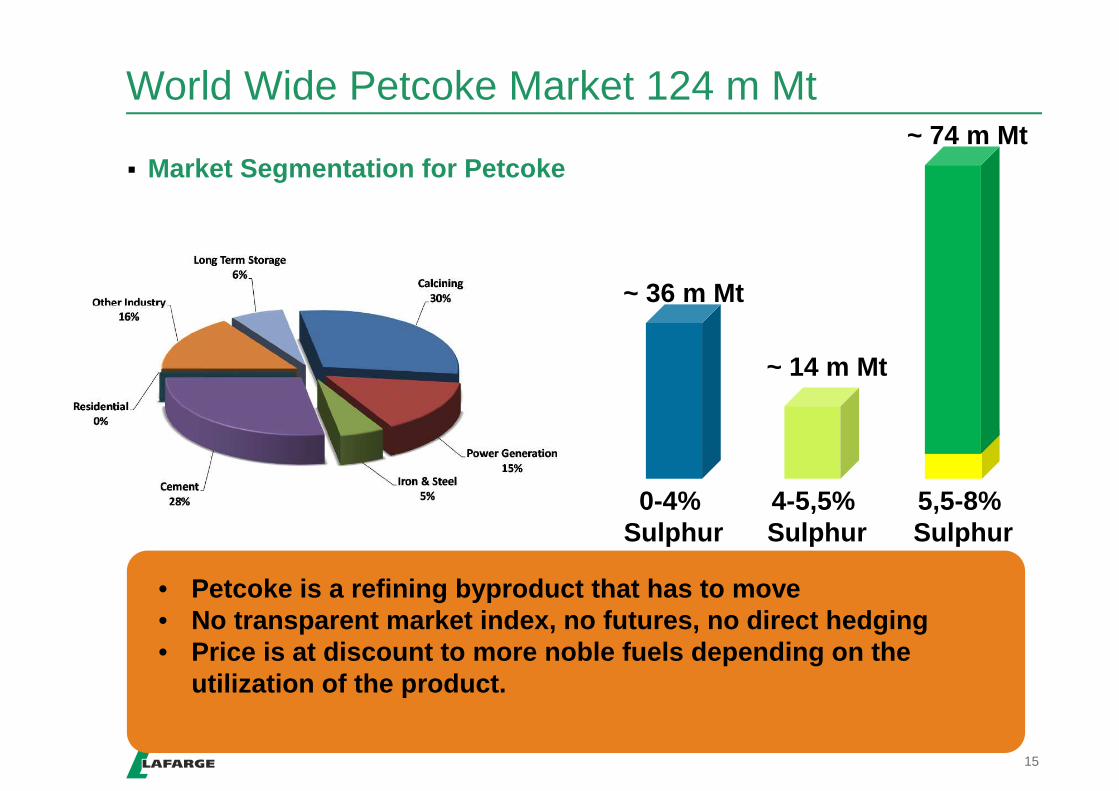
World Wide Petcoke Market 124 m Mt
� Market Segmentation for Petcoke
15
• Petcoke is a refining byproduct that has to move• No transparent market index, no futures, no direct hedging• Price is at discount to more noble fuels depending on the
utilization of the product.
~ 36 m Mt
0-4% Sulphur
~ 14 m Mt
4-5,5% Sulphur
~ 74 m Mt
5,5-8% Sulphur

Leading Commodity is Coal
� Prices on Index basis (FOB Petcoke, NEWC, API4, CFR for API2)
16
Petcoke traces coal, but with poor correlation
|Building Better Cities|
0.0
50.0
100.0
150.0
200.0
250.0Ja
n-01
May
-01
Sep
-01
Jan-
02M
ay-0
2S
ep-0
2Ja
n-03
May
-03
Sep
-03
Jan-
04M
ay-0
4S
ep-0
4Ja
n-05
May
-05
Sep
-05
Jan-
06M
ay-0
6S
ep-0
6Ja
n-07
May
-07
Sep
-07
Jan-
08M
ay-0
8S
ep-0
8Ja
n-09
May
-09
Sep
-09
Jan-
10M
ay-1
0S
ep-1
0Ja
n-11
May
-11
Sep
-11
Jan-
12M
ay-1
2S
ep-1
2Ja
n-13
May
-13
Sep
-13
Jan-
14M
ay-1
4
+50 HIGH actual API2 API4 NEWC

Importance of Freight
World Wide Petcoke Market Trade Flows
17
4
361
9
10
3
12
Major Producing, Exporting and Consuming Markets
1
1
“Spezialized”Market
“Conventional”Market
“Swinging Market”Market

Petcoke Benchmark vs NEWC Coal (thermal)
� Calculated Graphs based on average Pace +Fixed frei ght portions
18|Building Better Cities|
0.00
50.00
100.00
150.00
200.00
250.00
Jul-0
2
Nov
-02
Mar
-03
Jul-0
3
Nov
-03
Mar
-04
Jul-0
4
Nov
-04
Mar
-05
Jul-0
5
Nov
-05
Mar
-06
Jul-0
6
Nov
-06
Mar
-07
Jul-0
7
Nov
-07
Mar
-08
Jul-0
8
Nov
-08
Mar
-09
Jul-0
9
Nov
-09
Mar
-10
Jul-1
0
Nov
-10
Mar
-11
Jul-1
1
Nov
-11
Mar
-12
Jul-1
2
Nov
-12
Mar
-13
Jul-1
3
Nov
-13
Mar
-14
Jul-1
4
Average Pace+Freight NEWC CFR China
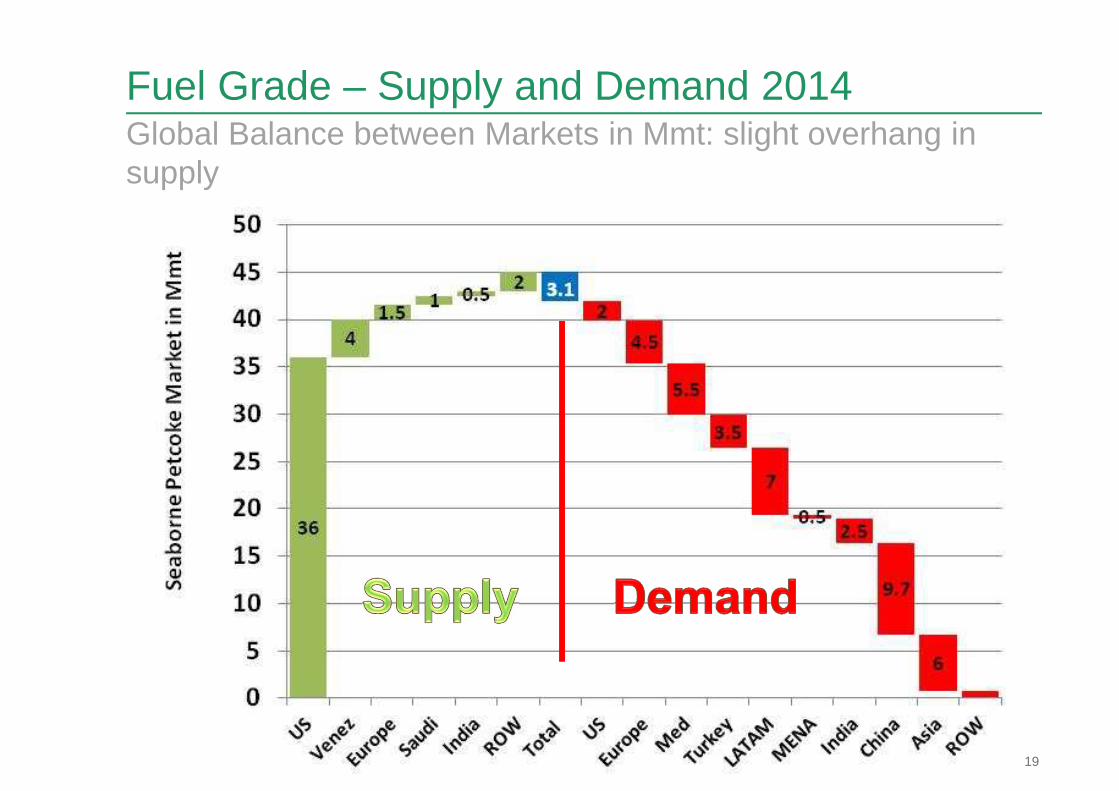
Fuel Grade – Supply and Demand 2014
19
Global Balance between Markets in Mmt: slight overhang in supply
Conclusion
� The times where we were only looking at shipping as a simple part of a supply chain are over.
� Deciding Strategies for Trading or Raw Material Sup plies goes hand in hand with proper planning and a proper shipping str ategy, including hedging strategies
� Shipping decides where Petcoke can go and where not, and whether trades can happen or not. Fluctuation in FOB pricin g is lacking behind freight evolution.
20|Building Better Cities| |April 2014|