Lachlan Keown January 16, 2001
157
Virtual 3D Worlds for Enhanced Software Visualization Lachlan Keown January 16, 2001
Transcript of Lachlan Keown January 16, 2001

Virtual 3D Worlds for Enhanced Software Visualization
Lachlan Keown
January 16, 2001

Abstract
3D visualizations of software can be used to highlight relationships between system compo-
nents, and also allow focussing on the internals of software, particularly when applied to
object oriented software. Such visualizations allow software engineers to comprehend larger
software systems, due to more information being available through the use of a third dimen-
sion. An architecture has been designed to carry out such visualizations. Major features
of this architecture are a meta language to describe object oriented systems, a description
language to generate generic visualizations, and an automated pipeline for generating visual-
izations. Using this architecture, several visualizations have been generated and analysed, to
demonstrate advantages of this particular means of visualization.

Contents
1 Introduction 7
1.0.1 Thesis Layout . . . . . . . . . . . . . . . . . . . . . . . . . . . . . . . . 10
2 Software Visualization 12
2.1 What is Visualization . . . . . . . . . . . . . . . . . . . . . . . . . . . . . . . 12
2.2 Why do we need Software Visualisation? . . . . . . . . . . . . . . . . . . . . . 13
3 3D Software Visualization 16
3.1 Previous Work . . . . . . . . . . . . . . . . . . . . . . . . . . . . . . . . . . . 16
3.2 Advantages of 3D for software visualization . . . . . . . . . . . . . . . . . . . 19
3.3 Potential 3D engines . . . . . . . . . . . . . . . . . . . . . . . . . . . . . . . . 23
3.4 What is VRML? . . . . . . . . . . . . . . . . . . . . . . . . . . . . . . . . . . 24
3.5 Why use VRML for this project? . . . . . . . . . . . . . . . . . . . . . . . . . 30
4 Mapping attributes of OO to 3D 31
4.1 Object Orientation . . . . . . . . . . . . . . . . . . . . . . . . . . . . . . . . . 31
4.2 Variations on mapping attributes of OO to 3D . . . . . . . . . . . . . . . . . 33
4.2.1 Attributes of OO systems which have a scalar value . . . . . . . . . . 33
4.2.2 Attributes of methods or constructors . . . . . . . . . . . . . . . . . . 34
4.2.3 Attributes of properties . . . . . . . . . . . . . . . . . . . . . . . . . . 34
4.2.4 Relationship Attributes . . . . . . . . . . . . . . . . . . . . . . . . . . 35
4.2.5 Means of portraying attributes . . . . . . . . . . . . . . . . . . . . . . 35
4.3 Mapping Scalar Values . . . . . . . . . . . . . . . . . . . . . . . . . . . . . . . 37
4.4 Links . . . . . . . . . . . . . . . . . . . . . . . . . . . . . . . . . . . . . . . . . 39
1

4.5 Integration with Web Browser . . . . . . . . . . . . . . . . . . . . . . . . . . . 40
4.5.1 Web Browser Integration Implementation Details . . . . . . . . . . . . 41
5 Model Frameworks 44
5.1 Introduction . . . . . . . . . . . . . . . . . . . . . . . . . . . . . . . . . . . . . 44
5.2 Hierarchy-centric framework . . . . . . . . . . . . . . . . . . . . . . . . . . . . 45
5.3 Inheritance-centric framework . . . . . . . . . . . . . . . . . . . . . . . . . . . 45
5.4 Method-centric framework . . . . . . . . . . . . . . . . . . . . . . . . . . . . . 47
5.5 Property-centric framework . . . . . . . . . . . . . . . . . . . . . . . . . . . . 49
5.6 Metric-centric framework . . . . . . . . . . . . . . . . . . . . . . . . . . . . . 51
5.7 Single class-centric view . . . . . . . . . . . . . . . . . . . . . . . . . . . . . . 51
5.8 Framework Additions . . . . . . . . . . . . . . . . . . . . . . . . . . . . . . . 52
6 Architecture 53
6.1 Introduction . . . . . . . . . . . . . . . . . . . . . . . . . . . . . . . . . . . . . 53
6.2 An OO Meta Language . . . . . . . . . . . . . . . . . . . . . . . . . . . . . . 53
6.2.1 The Format of OODL . . . . . . . . . . . . . . . . . . . . . . . . . . . 55
6.2.2 OODL in use . . . . . . . . . . . . . . . . . . . . . . . . . . . . . . . . 59
6.2.3 How OODL is generated from Javadoc . . . . . . . . . . . . . . . . . . 62
6.3 How to Represent Models . . . . . . . . . . . . . . . . . . . . . . . . . . . . . 62
6.3.1 A language to represent a VRML model . . . . . . . . . . . . . . . . . 63
6.3.2 The form of the mappings . . . . . . . . . . . . . . . . . . . . . . . . . 65
6.3.3 Architecture of Mappings . . . . . . . . . . . . . . . . . . . . . . . . . 66
6.3.4 The mappings in use . . . . . . . . . . . . . . . . . . . . . . . . . . . . 67
6.3.5 Example Mappings . . . . . . . . . . . . . . . . . . . . . . . . . . . . . 70
6.4 The Final Architecture . . . . . . . . . . . . . . . . . . . . . . . . . . . . . . . 73
6.5 Modifying the Architecture . . . . . . . . . . . . . . . . . . . . . . . . . . . . 73
6.5.1 Overview of the Architecture . . . . . . . . . . . . . . . . . . . . . . . 73
6.5.2 Converter . . . . . . . . . . . . . . . . . . . . . . . . . . . . . . . . . . 75
6.5.3 Internal Representation Builder . . . . . . . . . . . . . . . . . . . . . . 75
6.5.4 Mappings Reader . . . . . . . . . . . . . . . . . . . . . . . . . . . . . . 83
6.5.5 Model Builder . . . . . . . . . . . . . . . . . . . . . . . . . . . . . . . 85
2
6.5.6 Document Linker . . . . . . . . . . . . . . . . . . . . . . . . . . . . . . 89
6.5.7 Summary . . . . . . . . . . . . . . . . . . . . . . . . . . . . . . . . . . 90
7 Experiments and Findings 92
7.1 Various Frameworks Modelled . . . . . . . . . . . . . . . . . . . . . . . . . . . 92
7.1.1 A Property Centric View . . . . . . . . . . . . . . . . . . . . . . . . . 93
7.1.2 The Inheritance-centric Model . . . . . . . . . . . . . . . . . . . . . . 103
7.1.3 Hierarchy-centric models . . . . . . . . . . . . . . . . . . . . . . . . . . 109
7.2 Modelling a real system . . . . . . . . . . . . . . . . . . . . . . . . . . . . . . 115
7.2.1 OO Brewery . . . . . . . . . . . . . . . . . . . . . . . . . . . . . . . . 115
7.3 Large Case Study . . . . . . . . . . . . . . . . . . . . . . . . . . . . . . . . . . 116
8 Future Work 125
8.1 Overview . . . . . . . . . . . . . . . . . . . . . . . . . . . . . . . . . . . . . . 125
8.2 Further Experiments . . . . . . . . . . . . . . . . . . . . . . . . . . . . . . . . 125
8.2.1 Model types and layouts . . . . . . . . . . . . . . . . . . . . . . . . . . 126
8.2.2 User Trials . . . . . . . . . . . . . . . . . . . . . . . . . . . . . . . . . 126
8.3 CGI Interface . . . . . . . . . . . . . . . . . . . . . . . . . . . . . . . . . . . . 127
8.3.1 Fisheye Views . . . . . . . . . . . . . . . . . . . . . . . . . . . . . . . . 130
8.4 Architecture refinements . . . . . . . . . . . . . . . . . . . . . . . . . . . . . . 130
8.4.1 Version control of architecture . . . . . . . . . . . . . . . . . . . . . . 131
9 Conclusions 133
9.1 Goals Revisited . . . . . . . . . . . . . . . . . . . . . . . . . . . . . . . . . . . 133
A Glossary 139
B Program Excerpts 140
B.1 Conversion of OO Database . . . . . . . . . . . . . . . . . . . . . . . . . . . . 140
B.2 Code to link objects . . . . . . . . . . . . . . . . . . . . . . . . . . . . . . . . 143
B.3 Mappings . . . . . . . . . . . . . . . . . . . . . . . . . . . . . . . . . . . . . . 145
B.3.1 getMappings Method . . . . . . . . . . . . . . . . . . . . . . . . . . . . 145
B.3.2 get Method . . . . . . . . . . . . . . . . . . . . . . . . . . . . . . . . . 146
3

B.3.3 More Complex get Methods . . . . . . . . . . . . . . . . . . . . . . . . 146
B.3.4 insertVar Methods . . . . . . . . . . . . . . . . . . . . . . . . . . . . . 148
B.3.5 Class to generate 3D inheritance hierarchy . . . . . . . . . . . . . . . . 149
B.4 Functions associated with hyperbolic tangent conversions . . . . . . . . . . . 155
4

List of Figures
1.1 High Level view of Visualization . . . . . . . . . . . . . . . . . . . . . . . . . 9
2.1 The Rich Structure of OO Architecture . . . . . . . . . . . . . . . . . . . . . 14
3.1 Visualization(1) from 3-D Visualization of Software Structure . . . . . . . . . 18
3.2 Visualization(2) from 3-D Visualization of Software Structure . . . . . . . . . 18
3.3 2 dimensional map of the world. . . . . . . . . . . . . . . . . . . . . . . . . . 19
3.4 Map of the world, mapped onto a cylinder. . . . . . . . . . . . . . . . . . . . 20
3.5 Representation in 2D . . . . . . . . . . . . . . . . . . . . . . . . . . . . . . . . 20
3.6 Representation in 3D . . . . . . . . . . . . . . . . . . . . . . . . . . . . . . . . 21
3.7 Routing of a click event to a visibility input. . . . . . . . . . . . . . . . . . . . 24
3.8 VRML world before proximity trigger. . . . . . . . . . . . . . . . . . . . . . . 29
3.9 VRML world after proximity trigger. . . . . . . . . . . . . . . . . . . . . . . . 29
4.1 Hyperbolic Tangent Function. . . . . . . . . . . . . . . . . . . . . . . . . . . . 39
4.2 HTML and VRML in frames. . . . . . . . . . . . . . . . . . . . . . . . . . . . 43
5.1 Sketch of Hierarchy-centric Model . . . . . . . . . . . . . . . . . . . . . . . . 46
5.2 Sketch of Inheritance-centric Model . . . . . . . . . . . . . . . . . . . . . . . . 48
5.3 Sketch of method-centric Model . . . . . . . . . . . . . . . . . . . . . . . . . . 50
6.1 Generating OODL . . . . . . . . . . . . . . . . . . . . . . . . . . . . . . . . . 55
6.2 Two possible mappings to class shape. . . . . . . . . . . . . . . . . . . . . . . 64
6.3 Four possible mappings to class shape, and property arrangement. . . . . . . 64
6.4 Complete Architecture . . . . . . . . . . . . . . . . . . . . . . . . . . . . . . . 74
6.5 Classes used in Internal Representation. . . . . . . . . . . . . . . . . . . . . . 76
5

7.1 The Organisation of the Property-Centric Model . . . . . . . . . . . . . . . . 96
7.2 Generating two new points, given two existing points on the surface of a sphere.100
7.3 Wire Frame view of Spherical placement model with 12 entities. . . . . . . . . 101
7.4 Conical placement of properties. . . . . . . . . . . . . . . . . . . . . . . . . . 101
7.5 Conical placement of properties. . . . . . . . . . . . . . . . . . . . . . . . . . 102
7.6 Spiralling placement of properties. . . . . . . . . . . . . . . . . . . . . . . . . 103
7.7 Solid representation of classes arranged in shells. . . . . . . . . . . . . . . . . 105
7.8 Wireframe representation of classes arranged in shells. . . . . . . . . . . . . . 105
7.9 Possible arrangements of tree groups in 2D. . . . . . . . . . . . . . . . . . . . 107
7.10 Inheritance-centric model generated with Tree Groups. . . . . . . . . . . . . . 108
7.11 The layout of a fanning tree. . . . . . . . . . . . . . . . . . . . . . . . . . . . 111
7.12 The layout of an indent tree. . . . . . . . . . . . . . . . . . . . . . . . . . . . 111
7.13 A 2D indent tree. . . . . . . . . . . . . . . . . . . . . . . . . . . . . . . . . . . 112
7.14 A 2D indent tree expanded to show properties and methods. . . . . . . . . . 113
7.15 Means by which 3D tree is built using bounding boxes. . . . . . . . . . . . . . 114
7.16 2D Data Driven Brewery Hierarchy . . . . . . . . . . . . . . . . . . . . . . . . 117
7.17 3D Data Driven Brewery Hierarchy . . . . . . . . . . . . . . . . . . . . . . . . 117
7.18 2D Responsibility Driven Brewery Hierarchy . . . . . . . . . . . . . . . . . . . 118
7.19 3D Responsibility Driven Brewery Hierarchy . . . . . . . . . . . . . . . . . . . 119
7.20 Conversion of C++ to OODL . . . . . . . . . . . . . . . . . . . . . . . . . . . 120
7.21 Package sizes in the large case study system . . . . . . . . . . . . . . . . . . . 121
7.22 Database to store OO information . . . . . . . . . . . . . . . . . . . . . . . . 122
7.23 Cone Tree model of Lib1 package . . . . . . . . . . . . . . . . . . . . . . . . . 124
8.1 A Possible CGI Interface to the System . . . . . . . . . . . . . . . . . . . . . 128
8.2 Possible Result of a CGI System . . . . . . . . . . . . . . . . . . . . . . . . . 129
8.3 Architecture uses a script to generate VRML. . . . . . . . . . . . . . . . . . . 132
8.4 Architecture uses a Java program to generate VRML. . . . . . . . . . . . . . 132
6

Chapter 1
Introduction
Software visualization (SV) has been around in many forms for some time [35]. It has been
used for various purposes, common ones being program debugging and program structure
visualization. The goal of this thesis is to explore virtual worlds as a means of visualizing the
structure of a software system. Virtual worlds, in this case, being three dimensional models
which are navigable in some way.
The specific area within which experiments will occur, then, is as follows: Software Visu-
alization being a broad field, we have narrowed our area of particular interest to be confined
by the following parameters:
• Systems to be visualized are representable as object oriented, as represented by the
UML language [2]
• Only a static analysis of software systems shall be performed. That is, any information
that can be derived from a system’s source (or by reflection) may be visualized. Any
information that may be gleaned from an execution trace we are not primarily concerned
with. This is in part due to a desire for replicable worlds.
• Visualizations shall be 3 dimensional in nature, and viewable using some type of inter-
active browser
These paramteres provide us with an interesting subset of visualization, which is particu-
larly relevant to modern computing. Object orientation is now a common principle, and 3D
graphics are becoming more and more common.
7
The description “Virtual Worlds” implies 3D graphics. Virtual Worlds are more than
simply 3D diagrams, however. Virtual worlds must be interactive and navigable, like the real
world. This sense of immersion has many beneficial side effects for users as described in later
chapters.
This particular area of visualization has not, to our knowledge, been investigated to any
degree in the past. However, related work is discussed in Chapter 3.1 on page 16. Preliminary
work relating to this thesis has been published previously ([7]). The area of research defined
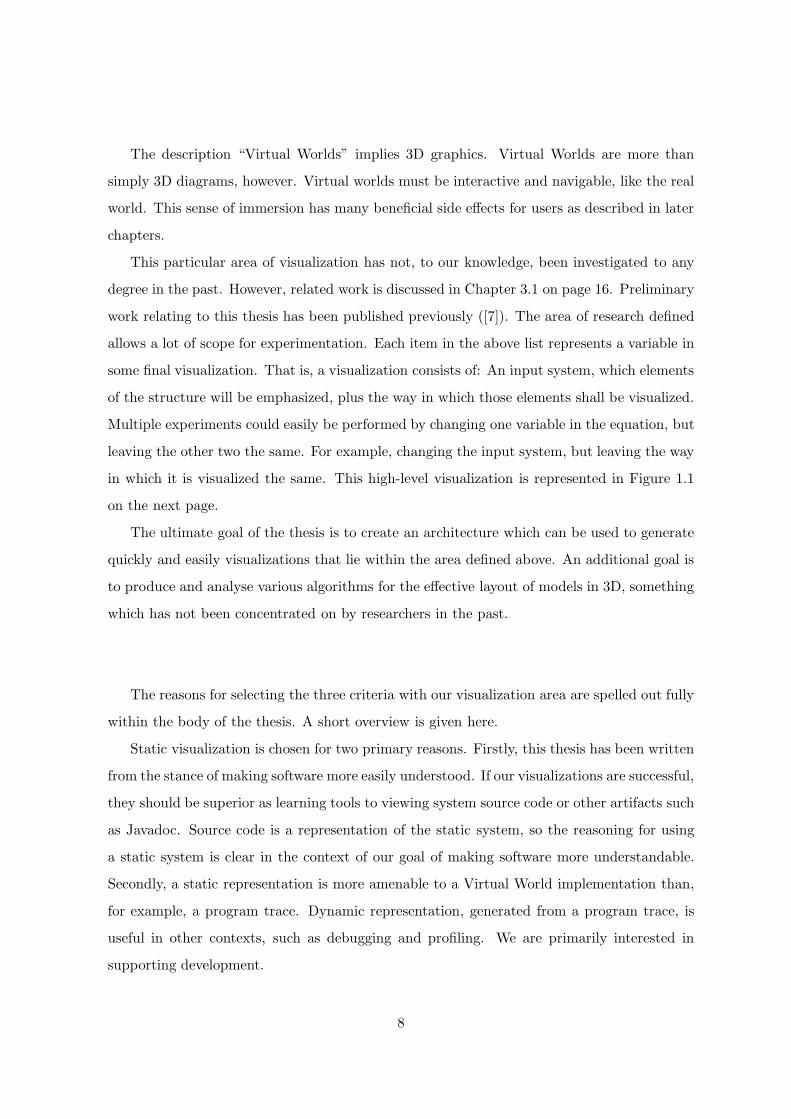
allows a lot of scope for experimentation. Each item in the above list represents a variable in
some final visualization. That is, a visualization consists of: An input system, which elements
of the structure will be emphasized, plus the way in which those elements shall be visualized.
Multiple experiments could easily be performed by changing one variable in the equation, but
leaving the other two the same. For example, changing the input system, but leaving the way
in which it is visualized the same. This high-level visualization is represented in Figure 1.1
on the next page.
The ultimate goal of the thesis is to create an architecture which can be used to generate
quickly and easily visualizations that lie within the area defined above. An additional goal is
to produce and analyse various algorithms for the effective layout of models in 3D, something
which has not been concentrated on by researchers in the past.
The reasons for selecting the three criteria with our visualization area are spelled out fully
within the body of the thesis. A short overview is given here.
Static visualization is chosen for two primary reasons. Firstly, this thesis has been written
from the stance of making software more easily understood. If our visualizations are successful,
they should be superior as learning tools to viewing system source code or other artifacts such
as Javadoc. Source code is a representation of the static system, so the reasoning for using
a static system is clear in the context of our goal of making software more understandable.
Secondly, a static representation is more amenable to a Virtual World implementation than,
for example, a program trace. Dynamic representation, generated from a program trace, is
useful in other contexts, such as debugging and profiling. We are primarily interested in
supporting development.
8

Figure 1.1: High Level view of Visualization
9

A three dimensional approach is taken to allow more information to be available to a user,
without compromising clarity. The reasoning being that a traditional two dimensional visu-
alization can easily become cluttered with too much information. 3D also has the advantage
of providing a more immersive environment for the user to explore. We expect that this will
lead to more useful visualizations.
Our area of research is restricted to object oriented systems to allow some degree of
consistency between visualizations, and to allow multiple languages with common architec-
tures to be visualized in the same way. OO also has a lot of structural components which
lend themselves well to visualizing. Elements such as composition relationships, ownership
relationships, member relationships and the like provide opportunities for rich visualizations.
1.0.1 Thesis Layout
The layout of the thesis is intended to introduce ideas to the reader such that they are
prepared for each subsequent chapter.
The following chapter deals with software visualization. Questions such as “what is soft-
ware visualization?”, and, “what is its history?” will be addressed there. Subsequently, 3D
visualization, and why it has been used by us, is dealt with more specifically.
The mapping of properties of an OO system to 3D are detailed next. This includes an
overview of OO, and the types of structures we would like to map from OO to 3D. Some more
specific types of visualizations are given which may be considered as “skeleton” visualizations.
These are visualizations which focus on specific aspects of OO.
The third chapter of the thesis deals with the architecture of the system which I have
designed to generate visualizations. The architecture is of a pipeline form, with specialised
tools used for processes along the pipeline. The implementation of the architecture is also
dealt with, and a section is included on modifying and extending the architecture.
Experiments and findings constitute the fourth chapter. This chapter outlines hypotheti-
cal visualizations, and then proceeds to test them for usefulness. Such things as the scalability
of visualizations are also examined. That is, can a visualization of a system with, for example,
3 classes, also be useful when we ask it to visualize 300 classes in the same way?
Future work is the final main chapter of the thesis. This details experiments that may have
been done had time permitted, and follow-ups to existing experiments that may be performed.
10
Modifications to the architecture are also suggested. This chapter suggests only directions
that may be explored by users, it is in no way putting limitations on other directions that
users may wish to pursue.
Finally conclusions are offered, and an effort is made to sum up the success of the thesis.
This primarily consists of answering our question: Can visualizations within our specific area
aid software understanding? Obviously the conclusion is unlikely to be a clear yes or no, so
successful elements will be discussed, and unsuccessful.
Conclusions will be drawn about the perceived usefulness of the models generated within
our framework.
Also assessed will be the success of the architecture itself, as a tool for generating visual-
izations in a logical manner. Is it as flexible as originally intended, and is at is as extensible
as required?
11

Chapter 2
Software Visualization
2.1 What is Visualization
Visualization is defined by the Oxford Dictionary as the act or process of interpreting, in
visual terms, or of putting into visible form. This is a very broad definition, non-specific to
any particular discipline. Although it captures the essence of visualization, we would prefer
a more scientific definition. As far as this thesis is concerned, we shall define visualization as
a mapping from programs to graphical representations.
We would like to take some program, defined by its source code, or some other standard
form, such as a UML diagram, and produce from this some graphical images which represent,
or show some aspect of, the original program.
In the paper Program Visualization: The Art of Mapping Programs to Pictures [35], the
authors discuss a taxonomy for classifying program visualizations. They describe four axes
along which visualizations can be classified. These axes are:
Scope What aspect of the program is being visualized? For example structure, inheritance,
or methods.
Abstraction To what degree is the visualization an abstraction of the underlying system.
For example, a pretty printing (lgrind being one example) is only a mild abstraction
of the underlying system. Conversely, a flow diagram is a considerably more abstract
means of representing a program.
Specification Method How flexible is the visualization? Does it allow alteration of map-
12

pings to provide varying models, which may be advantageous to a user?
Technique This is concerned with visual communication, that is, the effectiveness of the vi-
sualization as a communicator of information. Such things as the use of visual elements,
and the order in which material is presented determine this.
The work done by ourselves fits well with the above ”axes of visualization”. We have pro-
vided scope for a user to easily focus on some point in the four dimensional space represented
by these axes. The user has considerable control over scope through the use of mappings as
described in Section 6.3.1 on page 63.
Abstraction can be controlled to a degree also through the use of mappings. Objects may
be mapped in such a way that is very abstract, or in a very direct manner. For instance. classes
may be represented as solid cubes (direct), or as ethereal “spaces” occupied by components,
which is a very abstract representation.
The Specification Method is obviously the strength of our architecture, since a great
range of variation in visualization is under user control.
Technique is an area in which we, as the designers of the architecture, have less control.
It is up to the user to specify how they would like their Virtual World (VW) to look and
behave. Thus, a user has the power to generate a very ineffective visualization, or a very
useful one. Although, we have attempted within to provide users with some guidelines for
producing meaningful visualizations.
Visualization in our context is not to be confused with visual programming, which involves
the use of such technologies as drag and drop to facilitate the authoring of programs, as
opposed to the traditional means of using a text editor. An example of a visual programming
tool is Microsoft’s Visual Basic.
2.2 Why do we need Software Visualisation?
When approaching an unknown piece of software for the first time, human beings find anything
but the most trivial software something of a challenge to comprehend. Understanding software
is a major problem in industry and research. It costs millions of dollars each year to employ
people to analyse software for modification, alteration, bug fixing, and myriad other tasks.
Certain measures such as meaningful comments in code can go some way to remedying this
13

problem. The recent rise in popularity of object orientation was supposed by many to be a
solution to the problem of software understandability (see Section 4.1 on page 31 for a brief
overview of object orientation). OO brought a richer model to programming. However, it is
not a total solution to the problem. Software is now too large and complex for a single human
to digest in a practical amount of time. Microsoft Word is comprised of well over 1.5 million
lines of code (http://www.microsoft.com), and this is but a word processor. Traditional means
of navigating software (e.g. text editors) have not aided the learning process.
Procedural languages, such as C, have functions and data structures, and that is the
extent of their structure. Simple diagrams could be produced showing what functions call, and
are called, by other functions, but ultimately there is little high level complexity, compared
to OO ( See Figure 2.1). OO brings with it many features designed to make program writing
and maintenance simpler, and, in general, this is the case. We can make OO an even better
tool though by using visualisation to learn about the high level structure of programs.
��������������������������������������������������
��������������������������������������������������
Inherits From...
Calls...Class X
Has methods...
Has Properties...
Figure 2.1: The Rich Structure of OO Architecture
Software visualisation should be considered, at its best, equivalent to having the software’s
original author available to discuss the program structure. That is, if a user new to a piece
of software has some some confusion over part of the software, or needs clarification of some
process, the quickest solution would, in general, be to consult the original author. The goal
of visualisation is to provide a tool which to the user seams analogous to having the author
available — to focus on the particular part of a program the user wishes to know about, and
perhaps to give less emphasis to parts which are irrelevant to the user’s current requirements.
The ultimate aim of visualisation is to speed up and improve the production and mainte-
14

nance of software. Software is very expensive to create and maintain, so obviously the more
efficient these processes are, the better. Also, from a more academic perspective, development
should progress faster if programs are easier to comprehend.
The type of visualization we are dealing with here is static, as mentioned in the intro-
duction. Dynamic visualizations are more likely to be used by a user who is already familiar
with a system, but requires debugging or profiling information. This distinction is crucial to
the design of our architecture. This does not mean we are dealing with a static system in the
sense that it is not evolving as a piece of software, but, to reiterate, as a definition of a system.
This is as opposed to a dynamic system which could be considered as an instantiation of an
OO system, to use the OO parlay. We do not visualize run-time behaviour of software, others
have done much work in this field, see [41].
Noteworthy here is a definition of the term “user”. This term has thus far been used rather
loosely, and may conjure images of a single programmer dealing with an OO system. This is
not the case; when “user” is mentioned, it could entail any one or many persons involved in
the development, design, or implementation roles of a system. It may also be the case that
the job of creating visualizations is a specialised task, and is not handled by the person who
will be analysing the visualizations at all.
One advantage of our architecture (described in Chapter 6 on page 53), we believe, is that
it is accessible by any person in the software development process. That is, a programmer
will not necessarily have to delegate an expert, or experts, to generate visualizations. The
process should be straightforward enough that any member of a system development / main-
tenance team can do it, be they designers, implementers, testers, or whatever. Traditionally,
visualizations as an aid to system understanding may have gone through multiple experts:
The system designer requiring the visualization, the visualization designer, implementor,and
tester, then finally back to the original user.
15
Chapter 3
3D Software Visualization
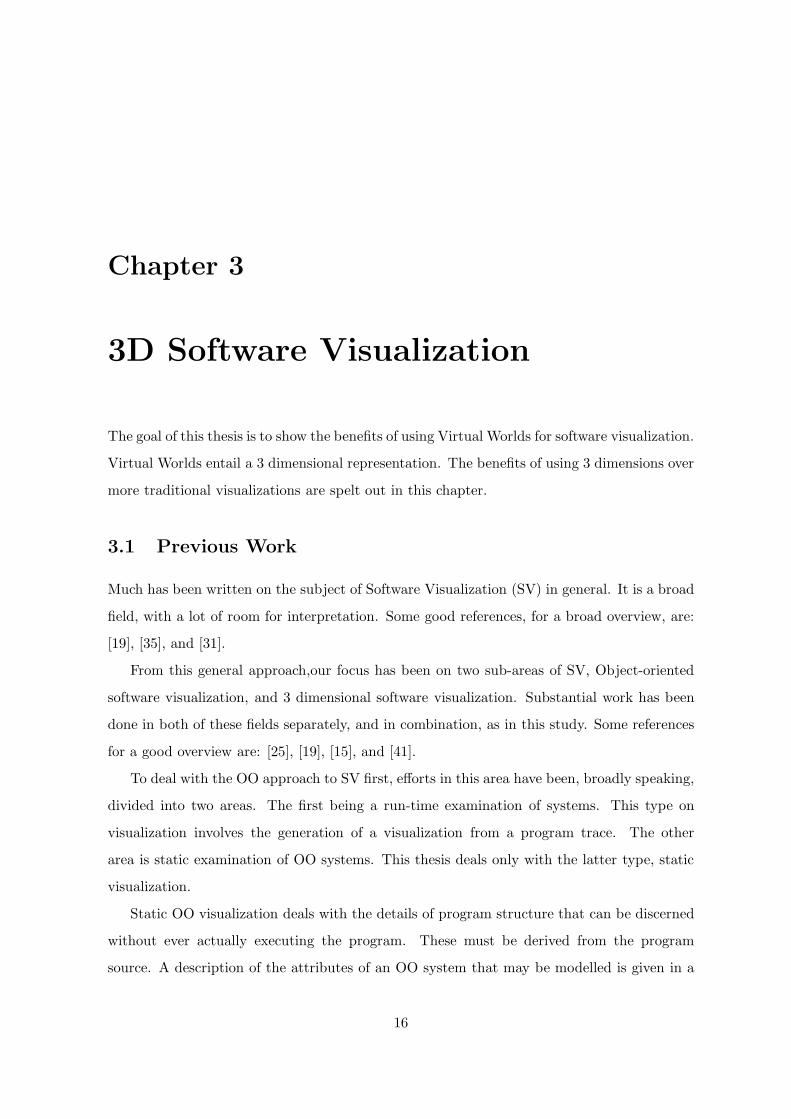
The goal of this thesis is to show the benefits of using Virtual Worlds for software visualization.
Virtual Worlds entail a 3 dimensional representation. The benefits of using 3 dimensions over
more traditional visualizations are spelt out in this chapter.
3.1 Previous Work
Much has been written on the subject of Software Visualization (SV) in general. It is a broad
field, with a lot of room for interpretation. Some good references, for a broad overview, are:
[19], [35], and [31].
From this general approach,our focus has been on two sub-areas of SV, Object-oriented
software visualization, and 3 dimensional software visualization. Substantial work has been
done in both of these fields separately, and in combination, as in this study. Some references
for a good overview are: [25], [19], [15], and [41].
To deal with the OO approach to SV first, efforts in this area have been, broadly speaking,
divided into two areas. The first being a run-time examination of systems. This type on
visualization involves the generation of a visualization from a program trace. The other
area is static examination of OO systems. This thesis deals only with the latter type, static
visualization.
Static OO visualization deals with the details of program structure that can be discerned
without ever actually executing the program. These must be derived from the program
source. A description of the attributes of an OO system that may be modelled is given in a
16

later section.
Work done in the field of static OO visualization is rather thinner on the ground than
that on dynamic visualization. Languages such as UML (Unified Modelling Language) have
symbols defined for visualizing an OO program’s structure. There exist tools to generate a
UML diagram, given a system. The software development tool, Rational Rose, allows OO
systems to be designed in a graphical way, and turned into class skeletons. UML can also be
output. A good overview of both UML and Rational Rose can be found in the book Mastering
UML with Rational Rose [2].
For an overview of work done in the area of static OO visualization, see the aforementioned
Visualisations of Large Object Oriented Systems [15].
Much work has been undertaken in the field of dynamic OO visualization. This type
of visualization is usually done for debugging scenarios and algorithm visualization, rather
than program understanding, so is not really of relevance to this thesis. This work usually
focuses on tracing program execution through classes and method calls. A good reference
to compare this form of visualization to static visualization is Using Visualization to Foster
Object-Oriented Program Understanding [19]. As stated in the abstract of this paper, “... We
then describe the implementation of a prototypical tool for visualizing the execution of C++
programs.”. The goal is to trace execution, not visualize program structure.
The 3 dimensional aspect of SV is covered in numerous papers. Some deal simply with
the potential of having an added spatial dimension [25], whilst others become more involved,
and discuss the advantages offered by having an immersive environment, as has been done in
this thesis ([40], for example). None apparently use the 3rd dimension to its full potential,
only using it as an extra dimension into which to move objects, rather than take advantage
of its other possibilities. For example, see Figures 3.1 on the following page and 3.2 on the
next page below, from the aforementioned paper 3-D Visualization of Software Structure [40].
They show a collection of entities. The latter, Figure 3.2 on the following page, simply uses
the 3rd dimension to show functions in a file (the squares on the flat represent C files). This
varies largely from our approach.
Our approach is not to use the 3rd dimension for any one variable as in the previous work
mentioned above, but to allow it to be used for any number of variables, or just to aid clarity
in a model.
17

Figure 3.1: Visualization(1) from 3-D Visualization of Software Structure
Figure 3.2: Visualization(2) from 3-D Visualization of Software Structure
18

3.2 Advantages of 3D for software visualization
Although there are potential disadvantages, three dimensions offer numerous advantages over
a traditional two dimensional style of visualisation.
Potential Advantages of 3D:
• The average distance between entities in 3D space would be less than in an equivalent
2D space. This is due to the fact that 2D diagrams are forced to be spread out, whereas
3D has the potential to be more compact. As an example, consider a map of the world.
The distance between countries on opposite sides of the map would be significant if the
map were to be displayed in detail on a computer screen. A user would be forced to
scroll for some time to move from one country to the other. Now imagine if this map
were rolled up to make a cylinder. That is, the two most distant edges were brought
together. By doing this the average distance between countries is reduced. A globe of
the world is a practical example of this, being a sphere rather than a cylinder. Consider
Figures 3.3 and 3.4 on the following page as an example of a flat surface being rolled
into a cylinder. In a similar way, a 3D visualisation browsing should theoretically be
faster and simpler due to the density of entities.
Figure 3.3: 2 dimensional map of the world.
19

Figure 3.4: Map of the world, mapped onto a cylinder.
A
B
C
D
E
F
G
H
Figure 3.5: Representation in 2D
The obvious downside to having a densely packed diagram is that it may become clut-
tered so some balance must be struck between spread and space saving.
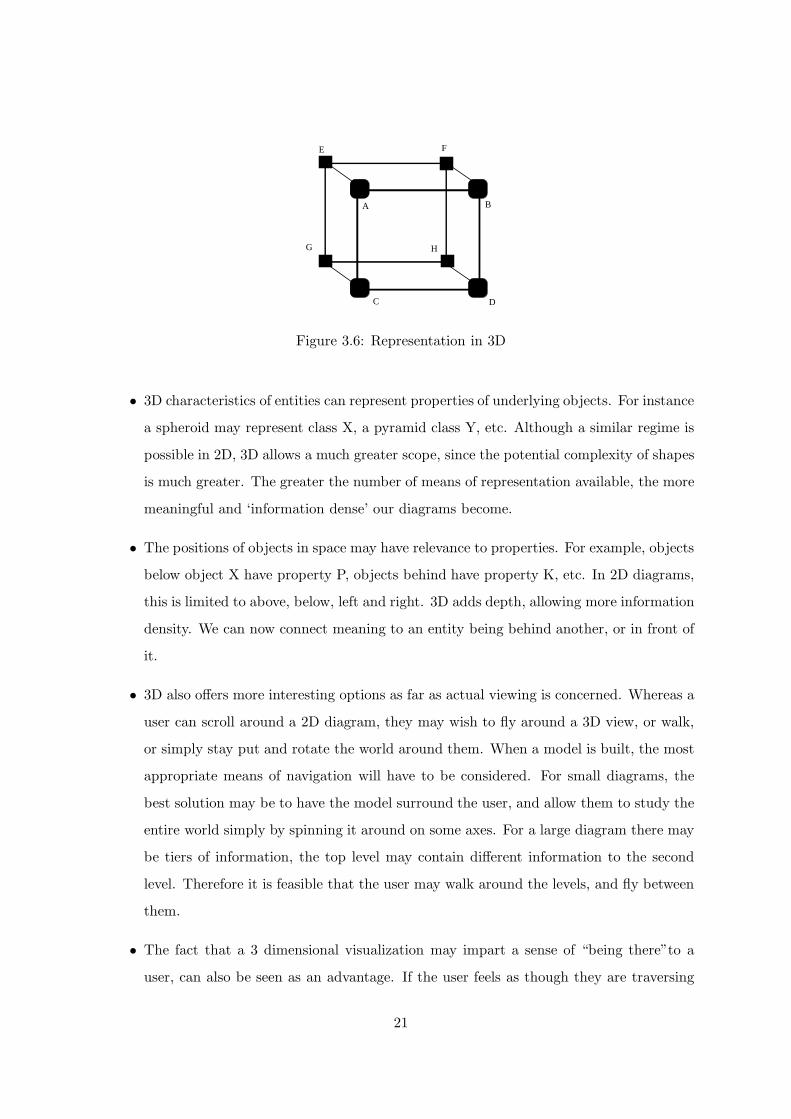
• Links are less likely to cross (or come close) than in 2D diagrams. In a complex 2D
diagram, in which entities may be linked to other entities to show relationships, it is
often impossible to avoid the crossing of links. If this happens often enough diagrams
can become very confusing and virtually unreadable. 3D diagrams avoid this potential
problem entirely. There is no single plane that links are restricted to; links can travel
in any direction. It is relatively rare for links to need to cross in a 3D diagram. See
Figures 3.5 and 3.6 on the next page.
20
A B
C D
E F
G H
Figure 3.6: Representation in 3D
• 3D characteristics of entities can represent properties of underlying objects. For instance
a spheroid may represent class X, a pyramid class Y, etc. Although a similar regime is
possible in 2D, 3D allows a much greater scope, since the potential complexity of shapes
is much greater. The greater the number of means of representation available, the more
meaningful and ‘information dense’ our diagrams become.
• The positions of objects in space may have relevance to properties. For example, objects
below object X have property P, objects behind have property K, etc. In 2D diagrams,
this is limited to above, below, left and right. 3D adds depth, allowing more information
density. We can now connect meaning to an entity being behind another, or in front of
it.
• 3D also offers more interesting options as far as actual viewing is concerned. Whereas a
user can scroll around a 2D diagram, they may wish to fly around a 3D view, or walk,
or simply stay put and rotate the world around them. When a model is built, the most
appropriate means of navigation will have to be considered. For small diagrams, the
best solution may be to have the model surround the user, and allow them to study the
entire world simply by spinning it around on some axes. For a large diagram there may
be tiers of information, the top level may contain different information to the second
level. Therefore it is feasible that the user may walk around the levels, and fly between
them.
• The fact that a 3 dimensional visualization may impart a sense of “being there”to a
user, can also be seen as an advantage. If the user feels as though they are traversing
21

a virtual world, they are more likely to become immersed in the world, and be more
receptive to details portrayed in the world.
Potential disadvantages of 3D diagrams are conceivable.
• Firstly, the frame rate (the rate at which a browser displaying a virtual world can
update its screen) must be considered as a potential disadvantage if it cannot be kept
to a realistically high rate. Reasons for a low frame rate are predominantly technological,
however, and must be counted as the major factor as to why little research has been
done historically in the 3D field when 2D has sufficed. If a diagram is unpleasant for
users to navigate then they are unlikely to gain anything from it. They are also unlikely
to want to use it again. Fortunately, 3D on the average desktop is now quite feasible.
• Disorientation is another potential shortcoming of 3D. A user may become lost within a
diagram, by facing in an inappropriate direction, or by moving too close to some object
or too far from the model in general. Disorientation problems are preventable, however,
with sensible model design. A user can be prevented from getting too far away from a
model by encasing it in walls. Signposts can also be positioned to give the user an idea
of where they are. Other more complex help aids may also be devised. For instance, one
may imagine programmed help agents which appear to inform the user of their current
location. Similar problems also exist in 2 dimensions - these are being addressed by
such techniques as fish eye views.
• Text labels pose a problem in 3D. In a 2D diagram entities are labelled and there is no
issue of the angle at which they are being viewed, or the distance at which they are being
viewed (unless zooming is allowed). It is assumed that labels are readable no matter
where a user should scroll too. However in 3D there are some important considerations.
Should entity labels always face the user? Should they scale as the user moves towards
or away from them? Should they appear only when the user comes within proximity?
Label density is also an issue. If text is too densely packed it may obscure objects in the
background or make the entire display confusing. This issue is addressed in this thesis
in part by the use of a simultaneous interactive web-page(See chapter 4.5 on page 40).
Text labels in 3D also have the disadvantage of being geometrically complex, which can
lead to a reduction in frame rate. This is another reason to try and minimise their
22

use. We would like to avoid using large amounts of text wherever possible for the above
reasons, but another important consideration is that we would like to avoid information
overload of the user. The user should never be faced with an overly complex screen
brimming with information.
3.3 Potential 3D engines
There exist numerous tools, libraries, and languages which we could use to generate 3D worlds.
The advantages and disadvantages of some of these are discussed below:
3D from Code This would entail writing our own 3D libraries from scratch. Advantages of
this would be customizability, and easy integration with other software in the system.
The primary disadvantage to this approach would be the time and effort required to
build such a library from scratch. It is not practical in todays software engineering
environment where good, well documented libraries are available.
Java 3D There now exists for Java an API specifically for 3D development. An advantage
of this would be easy integration with other Java programs, and portability across
platforms, including the Internet. A disadvantage is the speed of the 3D engine, since
it is written in interpreted Java. See [39] for an overview of the Java 3D API.
VRML VRML is composed of stand alone scripts which dictate how a world is built, and
how it interacts with a user. The focus is on the world as the description of a scene,
rather than the current GUI state of a program. It is not tied to any particular program-
ming language, however scripting can be performed in VRML using Java or Javascript.
VRML is highly portable, with many browsers existing, most of which are Internet
browser plug-ins. This ensures that VRML is compatible with the World Wide Web, in
fact VRML was designed primarily with the World Wide Web in mind. VRML is also
fast, assuming that a good browser is used. The main advantage of VRML is that it is
easily generated from within any program.
For reasons given above, VRML was chosen as the platform on which to base all 3D work.
This, we believe, was a good decision in hindsight, with VRML never being found lacking
when required to perform any task.
23

3.4 What is VRML?
VRML — Virtual Reality Modelling Language - is, as the name implies, a language for the
modelling of virtual reality. Virtual reality, in this case, meaning some 3 dimensional model.
VRML was created in 1994, based on SGI’s Inventor language for defining 3D worlds. It
has gone through one major revision since, to become VRML v2.0. VRML version 2 has
attained popularity on the Internet as a portable means of sharing 3D graphics, with plug-
ins available for most browsers. Currently, popular browsers inlcude Cosmoplayer, I3D,
Live3D, Vrealm, Webview, and Worldview. For a comparison of the popular browsers,
see www.construct.net/tools/vrml/browsers.html. Users can now download a VRML world
to browse as easily as they can download a page of HTML. For more information on the
history and development of VRML, see [6], or you may visit the official VRML website at
www.vrml.com.
VRML is a modelling language as opposed to a programming language. A VRML world
consists of definitions of nodes and a list of routes between nodes. The VRML model can
be thought of as a circuit with, for instance, the act of a user clicking on some object being
wired to the visibility of some other object, as in Figure 3.7, where by a user clicking on a
shape triggers a light.
Figure 3.7: Routing of a click event to a visibility input.
The collection of nodes which constitute physical entities, shapes, textures, and the like,
are collectively known as a scene graph. The routing which allows nodes to communicate and
influence one another, is known as a wiring diagram. These are terms which are commonly
used in the 3D / VRML world.
Nodes are the physical objects within the 3D world as well as the Interpolators, Timers,
24

Program scripts and other computational devices. They are the basic building blocks of a
VRML world. Many nodes allow children, which are collections of more nodes. This is how
complex shapes are built up. Any node can also have an identifier attached to it, which can
be used later to reference the node, or to produce a copy of it. For instance, a group of basic
shapes may be created to form an aeroplane. The simple shapes which constitute the plane
can be grouped together under a single identifier. This has useful effects, such as being able
to rotate or scale the entire object, or attach, for instance, a proximity sensor ( a node to
detect when a user is close to some object) to the whole object instead of repetitively doing
it for each sub-item.
A node is composed of three main parts: Attributes, Inputs and Outputs. Attributes
are the physical properties of a node, and can be thought of as variables in a programming
language. For example, a Sphere has a radius attribute. Inputs allow a node to be altered
from the outside, or cause it to perform some action. An interpolator, used to generate inter-
lying points between a start and end point, requires an input between one and zero in order
to calculate an inter-lying point. This same interpolator can then use one of its outputs to
send this point to some object. Outputs being responses to some event which can be routed
to other nodes’ inputs. For example, the behaviour of a clock node may be that every second
the current time is generated at the clock’s output. This output may then be routed to some
device which takes this time and uses it in some further computation.
To make the connections between nodes that allow interaction to occur, a list of routes
are included in a VRML script file. Routes define a connection between the output of some
node and the input of another. As in the previous example of an Interpolator which generates
inter lying points, we may define the connections to and from that node thus:
ROUTE clock.outTime TO interpolator.fractionIn
ROUTE interpolator.pointOut TO square.positionIn
This routing will take the output from some clock as a decimal, route it to the interpolator
which generates a point, and then route this point to some object square whose position will
be altered accordingly.
One of the most useful features of VRML is that it has a type of node Script which may
contain a program script in Java or Javascript. The basic VRML language on its own is
limited in what it can do, using just the built in nodes. However by using the script nodes
25

virtually anything is possible since the user has the ability to program behaviour using Java or
Javascript. Scripts can be triggered by events in the world and may have persistent variables,
which make them powerful tools.
An example of a VRML script is now given, together with its output. This example
incorporates many features common to a VRML script. These are:
Node Grouping The first Transform node, on line 14, has two child nodes. One is a Shape
node, the other is a Proximity Sensor.
Proximity Sensor This is defined on line 17. If the user comes within some distance of the
Transform node which contains this proximity sensor, an isActive event is generated
(line 78). The range of the Proximity Sensor is give by the field size, and is represented
by a cube.
Embedded Java script A Javascript node is included on line 57. This script takes input
from the Proximity Sensor, and, based on this input, adjusts the scale of the Transform
node myObject.
Routing An example of a ROUTE statement is shown on line 78.
Background node A background node is used in the example to ensure a white background.
Both sky and ground colours are the same. The Background node is at the beginning
of the script.
Texture mapping The cylinder used in the example has an image mapped onto it. This is
achieved through the texture field, of the Appearance node (Line 42).
#VRML V2.0 utf8
Background {groundColor [ 1.0 1.0 1.0]
skyColor [1 1 1]
}10
26

Group {children [
# Create a Transform for proximity sensor and sphere. . .
Transform {translation 0 0 0
children [
DEF mySensor ProximitySensor {size 150 150 150
}DEF myShape Shape { 20
appearance Appearance {material Material {
diffuseColor 0.0 1.0 0.0
}}geometry Sphere {
radius 6
}}
30
]
}#Create a Transform that may be scaled for the cylinder. . .
DEF myObject Transform {translation 0 0 0
children [
Shape {appearance Appearance {
material Material {diffuseColor 0.5 0.0 0.0 40
}texture ImageTexture {
url "picture.jpg"
}}geometry Cylinder {
radius 5
height 10
27

}} 50
]
}]
}
DEF myScript Script {directOutput TRUE
field SFNode objectVar USE myObject
field SFVec3f small 1 1 1 60
field SFVec3f big 1 2 1
eventIn SFBool inRange
url "javascript:
function inRange(value, timestamp) {
if (value) {
objectVar.set_scale = big;
} else {
objectVar.set_scale = small;
}
}" 70
}
ROUTE mySensor.isActive TO myScript.inRange
80
The two figures, Figure 3.8 on the following page and 3.9 on the next page, show the
effect of the proximity sensor on the scale of the transform containing the cylinder. In the
first figure, the cylinder is short, meaning the user is not triggering the proximity sensor. In
the second figure, the cylinder has elongated, meaning the user has triggered the proximity
28

sensor, which has routed its output to the script, which has directly effected the scale of the
transform node containing the cylinder.
This effect is used in visualizations we have produced, to prevent text labels from appearing
until the user comes with some distance of them. This prevents large numbers of labels from
cluttering the model, and slowing down the 3D rendering.
Figure 3.8: VRML world before proximity trigger.
Figure 3.9: VRML world after proximity trigger.
29

3.5 Why use VRML for this project?
The main reason for using VRML is that it is relatively simple to generate. VRML scripts are
straightforward but allow the creation of complex structures. The ability to assign identifiers
to nodes is also a necessity, since each object we generate may need to be referenced else-
where. Having the model represented entirely by a text file allows files to be easily generated
automatically and the output to be human-readable.
VRML has features which allow the simplification or automation of certain functions that
would normally be hand coded, reducing the need for scripting, which is time consuming and
requires additional processor power. For instance, as mentioned previously, VRML includes a
type of node, an interpolator, which will automatically compute values intermediate of some
given points or values. This allows complex animation with little effort.
Another major benefit of using VRML is that it is platform independent. Theoretically,
anyone with a browser which has a VRML plug-in can browse a VRML world. Another
beneficial side effect of this is that VRML authors are not restricted by any piece of VRML
browsing software. The speed at which your VRML world is updated is as much a function of
the software displaying it as the machine on which it is being viewed. Hopefully this means
we will continue to see better and faster VRML browsers. In the future we may also see
VRML compilers. These would take a VRML script and convert it into code native to the
machine being compiled upon. This compilation should lead to large improvements in frame
rate.
From preliminary work done, it appears that the speed of VRML is acceptable for our
purposes, even though it is the equivalent of an interpreted language. For a world generated
from a large Java system, a VRML script was produced which contained 31,801 lines of code.
This is a substantial amount of information to process, yet frame rates rarely drop below one
per second (on standard PC hardware as at 1999, with no special graphics acceleration), and
when a subset of all objects is being viewed, as would normally be the case, a respectable four
or five frames per second is obtainable. For small scripts the update is very smooth and fast.
There exist techniques for improving the efficiency of VRML. If we were to use these we could
expect to see large improvements in the update speed of our models. However, our emphasis
has been on the design of the architecture which generates the models, not the optimization
of the models, which may be considered as future work, or as a task for the user.
30

Chapter 4
Mapping attributes of OO to 3D
We have designed an architecture which allows rapid visualization development. A major
part of this architecture revolves around mappings from the underlying attributes of an OO
system to features of a Virtual World. These mappings are outlined in this chapter.
4.1 Object Orientation
Object orientation, as a concept, has been around for some time. Simula was the first object-
oriented language providing objects, classes, inheritance, and dynamic typing in 1967. [29]
contains a brief summary and history of Simula and Smalltalk, among other OO languages.
However, OO has only relatively recently become popular with mainstream software engi-
neers. This began with Smalltalk in the 1980s. C++, Bjarne Stroustrop’s addition to the
C programming language, added to the popularity of OO by making it readily learnable by
programmers already familiar with C.
OO is now well and truly established. Almost all languages now are OO, or have overtones
of OO. Basic, which was once considered a strictly procedural programming language, has
now adopted OO with recent versions of Microsoft Visual Basic. Procedural languages are
those which consist of functions (procedures), as opposed to objects.
OO systems can best be described as a a collection of classes, and instances (or objects)
of those classes. Classes represent the definition of an object, its interface and information it
may encapsulate. Instances are created from classes. Instances which are of the same class
share interface and functionality (methods), but not data (properties). Each instance has its
31

own properties, although these must all be of the same type for like classes.
OO also allows inheritance among classes. This means that some class may be used as a
base class, providing some general purpose data or functionality which may be required by
several derived classes. In this way, hierarchies of classes are developed. In addition, multiple
inheritance is available in some languages, such as C++ and Smalltalk. This allows a class
to inherit from two or more parent classes.
OO allows “polymorphism”. This is a feature whereby a class inherits a method from a
parent class, but overrides it with its own redefinition. This is useful in that a method can
be called on some object, and depending on the exact type of the object different code may
be executed. The emphasis is on the interface.
With the advent of Java, from Sun Microsystems (www.java.sun.com), OO has come of
age, and is now accessible to the masses through the World Wide Web (WWW). Java con-
tains the majority of standard OO features, and adds a few special features of its own. For
instance, Java disallows multiple inheritance. It has, however, a new type of semi-inheritance,
this is called an interface. If a class specifies an interface in its definition, then a specific set
of methods or properties must be supplied by the class, as defined in the interface. This can
be thought of as inheritance in which all methods are over-ridden (or virtual, in the C++
terminology).
The following components are common to most OO systems and languages:
Classes These are the templates for objects, from which OO systems are built. Here we are
talking about the definitions of classes. These will not be instantiated until the system
is executed. Classes contain the following components:
Constructors These are a special type of method which are executed when a class is
first instantiated. There may be multiple constructors defined for one class, but
all must be differentiable by their arguments.
Methods These are the services that a class makes available. They may be available
only within that class (private), or to any other classes (public).
Properties Properties are the variables that a class encapsulates. Again, these may
32
be public or private in a similar way to methods.
Objects These are instantiated during the execution of a program, so are not a component
of a static system as such. However, it is worth noting that they are the product of a
class, through instantiation.
Additionally, it is worth noting the difference between class properties / methods, and
instance properties / methods. Class components can be considered as global variables. For
any one class, there is only one set of class components. New instance properties are created
along with every new instance of a class. Instance methods may act on instance properties,
whereas class methods may not.
4.2 Variations on mapping attributes of OO to 3D
We wish to map attributes of an OO system to some 3D model to create a useful visualisation
tool. As discussed previously there may be no single best mapping which is appropriate in all
circumstances. Certain situations or user requirements may dictate what the best mappings
are.
For example, a user may wish to view a system with the emphasis on class content rather
than, say, class hierarchy. In this situation, the best mapping may involve using many of the
available 3D properties to represent methods, whereas the class hierarchy may be only very
basic, or not portrayed at all.
4.2.1 Attributes of OO systems which have a scalar value
These attributes are of a fixed nature and can be expressed numerically, using integers.
Number of methods Within a class, or a package.
Number of properties As above.
Number of constructors As above.
Number of children The number of children a class has. That is, how many classes inherit
from it. May represent only direct descendants, or perhaps all descendants.
33

Number of parents As above, may represent only parents one generation back, or all an-
cestors.
Lines of code Could be scoped in numerous ways. Entire system, single classes, or class
sub-hierarchies, for example.
Age of code The time elapsed since the code was last altered. Could be taken as a repre-
sentation of how reliable or “finished” code is. Could be scoped in numerous ways, as
above, to methods, classes, or hierarchies.
Number of modifications to code The number of times a section of code has been altered
over its lifetime. Could also give some indication of the robustness of the code.
4.2.2 Attributes of methods or constructors
Listed are the individual attributes we may wish to model.
• Static / instance
• Type (this may be fundamental, such as an integer, a library class, or a user-defined
class)
• Protection (the class may be public or private)
• Number of arguments
• Types of arguments
• Metrics statistics (for example, lines of code)
4.2.3 Attributes of properties
As for above, the various attributes of properties whic may wish to model.
• Static/ instance
• Type
• Protection
34
• Is the property a collection type? For example, a Vector in Java.
• Is the property an array type?
4.2.4 Relationship Attributes
The previous paragraphs describe discrete value type attributes. We also wish to model
relationships. The possible relationships between entities we may wish to represent are:
Inheritance hierarchy Embodies the relationship between classes and those classes that
inherit from them. This relationship is one of the more prominent in OO systems.
Constructor - owner class relationship Relates a constructor to its owner class.
Method - owner class relationship Relates a method to its owner class.
Method - arguments relationship Relates a method to all the classes which are argu-
ments of the method.
Method - type relationship Relates a method to the class which is its return type.
Property - owner class relationship Relates a property to its owner class.
Property - type relationship Relates a property to the class which is its type.
Class - components relationship Relates a class to its components through the types of
properties.
Method calls method relationship Relates a method to all external methods that are
called by it.
Class uses class relationship An extension of the method calls method relationship. Re-
lates a class to all other classes which encapsulate methods that are called by any
methods in the former class.
4.2.5 Means of portraying attributes
The above collections of attributes represent a set. When generating a model, we wish to
select some number of these attributes and portray them in a meaningful way. Some attributes
35
are of a scalar nature, others represent relationships. For both of these types, possible means
of representation in 3D are listed below:
Means of portraying scalar attributes
Shape / geometry An infinite number of shapes are possible. Most plausible are the regular
shapes, such as cubes, spheres, pyramids, and n-sided objects with low n values.
Colour The actual colour, as an RGB value may be useful in distinguishing between at-
tributes with a small number of possible discrete values. For example, protection of a
method can only be public, protected, or private. These may be represented by red,
green and blue respectively.
Hue The actual brightness of a colour.
Size Physical size of a 3D entity.
Transparency
Texture Textures may be applied to 3D surfaces. These could be used to convey attributes.
For instance, if a bumpy texture were used, the height of the bumps may represent
something.
Bitmap Bitmaps may be applied to 3D surfaces. These may be used to show a number of
different attributes, not necessarily scalar ones. For instance, code could be projected
onto a surface.
Animation Certain animations may show certain attributes.
Size The size of entities may be related to some attribute.
Period For some animation, period of rotation, or orbit, may be related to some attribute.
Means of portraying relationships
Proximity The closeness of entities may reflect the nature of their relationship.
Physical links Likely to be the most common way to show relationships. Physical links
are defined between entities. These may be widely varied in style. For instance, the
36

cross-sectional shape and the thickness of the link are attributes of a link which may
reflect some detail about the relationship being shown.
Containers Entities containing other entities may show some relationship. Obvious candi-
dates are ownership type relationships, or parent - child relationships. Containers may
make use of transparency.
Neighbours Is similar concept to proximity above, an entity’s neighbours may be more
closely related than more distant entities.
Spatial placement This refers to above/below type relations. Within the three dimensions,
each of these may bring a different meaning. For instance, an entity being below another
may mean it inherits from the above entity.
Orientation The direction an entity is facing, if it is non-symmetrical, may be of use in
showing relationships. For instance, entities shaped like arrows may be used to show a
method calls method style relationship.
HyperLinks Within an interactive 3D world, HyperLinks may be available. These would
allow the user to click on some entity and be transported to some other location, or have
some re-organising of the world take place. This could be useful when related entities
are forced by other circumstances to be far apart spatially.
4.3 Mapping Scalar Values
Given the former list of possible scalar attributes which may each be mapped in some way to
features of a Virtual World, we need to examine the method by which these attributes may
be mapped. In some simple cases, it will be simply a matter of scaling the input attribute to
get the output attribute. For example, if the input is number of properties, then the output
may be represented by the height of a cylinder (a choice is made between a cylinder and other
geometric shapes, and the height is chosen over the width). A possible scale factor would be
2. Therefore, if, in this case, there were 10 properties, then the resulting cylinder would have
a height of 20 units.
A distinction to make among scalar type attributes is whether they are of the bounded
or limitless type. That is, could values for these attributes possibly stretch to infinity, or do
37

we know of a specific bounding value. For example, number of properties is a (theoretically)
boundless attribute. However, the binding of a property, whether it is static or dynamic, is a
bounded attribute, since it can only take on two possible values.
Limitless attributes, those which can carry an upwardly infinite value, can lead to complex
problems when we wish them to be mapped to some bounded range. Imagine instead of
mapping to the height of a cylinder, as in the example above, we rather want to map to
the opacity of the cylinder. Opacity is represented by a range from one to one hundred. So
somehow we have to convert from our infinite range to a finite value representing opacity.
The difficulty lies in being able to make all possible values for number of properties map to a
different value in the range 0 – 100, whilst at the same time making sure that differences are
visible to the human eye.
One possible solution to this problem is to determine a ceiling point in our limitless input
attribute, where we judge that some value represents a ceiling, and any value above this
ceiling will be treated as equivalent to the ceiling value. For our number of properties, we
may decide that 100 is the ceiling. This way number of properties maps exactly to opacity.
This is not always the best solution though, since values above 100 will never be visible in
the output, and in normal situations where number of properties is in the range, say, 1 –
10, there will be very little to distinguish in opacity.
The preferable situation is one where common values map more significantly than un-
common values. For instance, in the ongoing example, we may prefer that 5 properties be
represented by 50% opacity, while 1000 properties are represented by 9% opacity. Some
formula is needed to fairly and simply generate these values.
After consideration of various functions, it was decided that a hyperbolic tangent function
would be suitable. This produces values between 0 and 1 when fed positive values. These
values between 0 and 1 can easily be scaled to some bounded range. If incoming values are
scaled so that their average is 0.55, a function is given which has good symmetry. tanh of
0.55 gives a value of 0.5, which means that half our input values will lie on one side of the
centre, and the other half will be above.
For example, consider, once again, the case of number of properties. Assume we will
be mapping this to opacity, which is bounded between 0 and 100. Evaluation of many OO
systems has shown us that the average number of properties a class has is about 5. Given
38

this initial information, we can now take any values for number of properties, and generate a
corresponding opacity value. Table 4.3 shows some possible input and output values together
with intermediate steps. The hyperbolic tangent function is shown in Figure 4.1.
Input(number of properties) Scaled on Average(5) Tanh Scaled to range(0-100)
2 0.22 0.22 22
5 0.55 0.5 50
10 1.10 0.8 80
50 5.5 0.99 99
Table 4.1: Conversion of unbounded inputs to bounded outputs via hyperbolic tangent func-
tion.
Figure 4.1: Hyperbolic Tangent Function.
Given in Appendix B.4 on page 155, is the code associated with performing hyperbolic
tangent conversions.
4.4 Links
Links in this context are any type of connection between two entities within a diagram, the
simplest being a straight line. In this section ways of making better use of links, and increasing
their information content, are discussed.
39

In early prototypes of the architecture, no form of links were used. The first type to be
implemented were links between classes in the inheritance hierarchy. These make the diagram
a lot more clear. This type of link is relatively straightforward to implement, as the link does
not need to convey any additional information with its appearance, so a simple representation
will suffice.
Links between classes, and their properties and methods would allow the class to appear
more of a single entity composed of parts rather than a group of unconnected objects in
space. The links could be different colours or sizes, for example, to show such things as
private, public, static, etc.
Links between properties and the class which is their type are also a possibility. In practice
this may prove difficult to implement, however. This may involve having the user perform
some action to make the required link visible, lest the model become cluttered with many
such links.
4.5 Integration with Web Browser
A useful side effect of using a web browser to view Virtual Worlds is the ability to use frames
which can interact with each other. This allows text to be confined to a single frame, separate
from the VRML pane. This vastly reduces the amount of text which needs to be displayed
within the world. This has benefits in areas such as frame rate, and reducing information
overload of the user. More specific means of actually implementing such a scheme are outlined
below.
The most obvious use would be to integrate Javadoc (described in Section 6.2.3 on page 62)
with the VRML generated from it. That is, have a Javadoc page occupying half of a web
browser’s window, whilst a VRML representation occupies the other half. VRML allows
linking of actions to objects, so we may wish to link the action of clicking on a class, to the
display of that class’s Javadoc entry in another frame of the web browser.
In a similar vein we may have a VRML diagram which represents only a single class, but
perhaps focuses on its properties and/or methods. In this case we may display a single page
of Javadoc for the single class we are focusing on. When a user selects some property or
method of this class, anchors within the Javadoc are used to direct the browser to specific
points within the single page of HTML. In this manner we can show property and method
40

definitions. Clicking on a property representation in the VRML view will cause the HTML
view to scroll so that the property definition is shown at the top of the page.
The implementation of the Javadoc case is a simple one, since the Javadoc already exists
in an HTML form, and has built in anchors which can be used to navigate within the files.
However there are other situations, which may also be useful but may require some sort of
pre-processing to generate a useful HTML file. For instance, source code would be useless on
its own in a frame.
To display source code together with a VRML representation it would be sensible to run
the source through some sort of HTML converter first. There are two reasons for this, firstly
we can attempt some form of pretty printing. It is relatively difficult to read source code in
a plain text format. If the source were run through a pretty printer such as lgrind, with the
output set to HTML this would enhance its readablilty.
Secondly, processing of the source would allow the insertion of anchors into the final
HTML. In this way we could have the text respond to actions within the VRML world. As
in the Javadoc example, we could have the browser jump to the appropriate place in the text
when, for example, a property representation is clicked on. But in this case we may actually
be jumping to the part of the source code where the property is defined.
4.5.1 Web Browser Integration Implementation Details
Creating a web page containing a VRML part and a separate HTML part involves the use of
frames. Frames allow a web page to be split into parts, each distinct from the other(s); each
having its own source file. So for our situation we will need at least three files, (1) A web
page to be loaded, (For example, ClassPage.HTML) (2) A VRML .wrl file which will occupy
one frame, (Class.wrl) (3) An HTML file which will occupy the other frame (Class.HTML).
To create a web page which incorporates a VRML frame and an HTML frame which can
interact is a complex task. When generating the web page to be loaded we must consider
the relative sizes and placements of the two frames, and be sure that where handles are used
from the VRML to move the focus of the HTML, that names match up. For example if in
the original program we have a property called Person1, then we must be sure that in the
VRML command which reloads the HTML code the exact same name is used; Person1.
To cause the HTML view to jump to another section, or have it show another file entirely
41

from within VRML, requires the use of the VRML Anchor node. An anchor node has a set of
children and the definition of a URL as its main properties. If any of the children are clicked
on, the URL in the URL property is loaded. This would not be much use if it were not for
an additional property of this node called Target. The target is the destination frame of the
loaded material.
Using this anchor node we can create parts of our VRML world which, when clicked upon,
load some HTML file into some frame of the current web browser. Of course we do not want
to load it in the current frame, or our present VRML session would be overwritten. Further-
more, by using HTML bookmarks (the # notation), it is possible to direct the web browser to
a point within a file. For instance, an anchor node such as the following would load the page
Person.HTML in the frame named text and then scroll the window to the section tagged head.
Anchor { ...
url http://www.myVRML.com/Person.html#head parameter target=text
}
The final integrated article, in a simplistic form, can be seen illustrated in Figure 4.2 on
the following page. In this example the user has just clicked on the object buffer in the centre
of the VRML frame (on the right), which has caused the Javadoc (in the left frame) to jump
to the description of the buffer property.
A related way of utilising the web browser to add value to our Virtual Worlds is to embed
VRML directly in a web page. This would work in a similar way to that outlined for frames
above. However, instead of having documentaion separate, it would surround the model.
42

Figure 4.2: HTML and VRML in frames.
43

Chapter 5
Model Frameworks
5.1 Introduction
When considering how best to represent an object oriented system in 3D it becomes obvious
that just one all-encompassing representation will not be sufficient. Different views are re-
quired depending on which area of a system a user wishes to focus on, and how they would
like that area presented. This section discusses some hypothetical representations for various
requirements that users may have.
These representations we have dubbed model frameworks. They are the general type of
a model. Theoretically there are an infinite number of different models that could be produced
from a given OO system. However, there exists within this huge variation a taxonomy of
models. These various families of models are the frameworks. They represent the general
focus of a model, be it the hierarchy structure, or the encapsulation structure. For example,
in the inheritance hierarchy framework, there are many different ways we may wish to view
the hierarchy, but always the hierarchy is the focus of the model.
The advantage of this system of frameworks becomes clear when seen in the context of the
general architecture of our visualization system. A user need not know exactly the type of
model required to clarify some feature of a system. Multiple models are easily generated, by
means of mappings, as discussed in Section 6.3.1 on page 63. With a little experimentation,
a meaningful model will be arrived at.
Users can try various combinations of mappings, until a meaningful model is found. This
is not to say that the process of selecting an appropriate model is confusing to the user, only
44

that they have the scope to experiment, if they should wish to do so, without a significant
wasting of time generating models.
5.2 Hierarchy-centric framework
Focuses on the hierarchy and uses the majority of available 3D properties to rep-
resent properties of the hierarchy.
The root of all classes is shown at some point in space, and linked to this are its children,
and from them their children. The emphasis should be on ease of navigation and the ability
for the user to get a sense of the overall hierarchy without undue effort. That is, if the user
were to zoom out there should be some sense of viewing an hierarchical diagram, rather than
just a jumble of class representations.
There are various variables that can be manipulated in this type of representation in
order to get the most effective representation possible. Probably the most obvious is spatial
placement. How do we arrange the classes for the most effective browsabililty and clarity?
There are several options, such as a flat representation in 2D, a sphere style with the root in
the centre and children spanning outward, or a pyramid style with the root at the top. Each
type may offer certain advantages and/or disadvantages.
Also of importance will be how classes are linked. It may be enough to assume that if
some class is below another then it is a child in a simple representation. However, in more
complex situations it may be necessary to show explicit links between classes to show the
parent-child relationship. Different styles (colours, textures, thickness...) of links could be
used to represent different types of relationships, i.e. interfaces, or virtual classes.
A simplistic 2D view of a hierarchy-centric model is shown in Figure 5.1 on the following
page.
5.3 Inheritance-centric framework
Allows a class to be viewed in the context of all classes from which it is derived.
This framework allows the user to get an instant overview of a class and which methods and
properties it has available from parent classes, without an excessive amount of navigation.
45

Figure 5.1: Sketch of Hierarchy-centric Model
46

Objects would be arranged in such a way that for any class representation, its parent class
representations would be instantly accessible. This may mean having multiple representations
of some classes (those with more than one child).
Numerous variations are possible within this framework. Some may be more beneficial
than others. The nature of systems being visualized may also dictate the best layout. For
instance, a system with a very deep inheritance hierarchy (that is, a relatively large number
of ancestors per class) may be better suited to a model in which all parent classes are shown
in conglomerate form, so as less navigation is required. Those with perhaps only one or
two generations behind them may, conversely, be more suited to a model showing each class
individually, to emphasise which classes contribute which members.
Another factor which must be considered for this type of framework is the layout of
classes. Should the model focus on a single class and show its ancestors, or display all classes
from a system together with ancestors? If the latter approach is taken, then the question of
organising classes for ease of navigating must be a consideration. For example, alphabetical
order may be a sensible choice.
Which details of classes to show must also be a factor. The obvious ones to include should
be methods, properties, and constructors, since these can be inherited and over-ridden. In
some situations it may be useful to show in the model where a member has been overridden
through use of colour or some other means.
A quick sketch of how an inheritance-centric model may look is shown in Figure 5.2 on the
next page. It shows the class being studied in the foreground, with its single parent behind,
and that class’s two parents behind it.
5.4 Method-centric framework
Show a class representation together with representations of its methods. For
each of these methods show some detail about the class which is their return-
type.
The models generated from this framework could be useful for analysing the interface of a
class, that is, its methods. There are two facets to a method-centric framework.The first is a
representation of method return types, the second is a representation of argument types. By
types, we mean the classes that are returned, or used as arguments.
47

Figure 5.2: Sketch of Inheritance-centric Model
48

In the first instance, where return types from methods are shown, this could be useful to
see what the interfaces to these returned classes look like. Given some class, that we have
no prior knowledge of, we would like to see what classes are made available as return values
from methods, and how we interact with these returned classes.
In the second instance, where methods’ arguments are represented, the usefulness lies in
being able to see which interfaces are available when setting up objects to pass to methods.
When these two means of visualization are combined, a theoretically useful tool should
be available for making calls to methods and handling results.
There are several intuitive ways to lay out our method-centric model. One would be to
have the class being focused on central to the model, surrounded by representations of its
methods. When clicked upon these methods may expand to show the classes which comprise
their arguments and return types. Another model may involve having separate representations
for the various classes which are arguments and return types, and having links to these from
the central class. It may be sensible in some situations (i.e. a large number of classes) to
make these HyperLinks.
A simple sketch of how a method-centric model may appear is shown in Figure 5.3 on
the following page. The main method being visualized is central, with representations of its
methods hanging off it. One of these, on the right, has been expanded to show more detail.
This sketch could also apply to the following property-centric model.
5.5 Property-centric framework
A central class is visualized together with representations of the properties that
compose the class.
This type of model focuses on a class, and its associations with its properties.
The type of model generated by this framework could be useful in two cases. Firstly, by
showing the types of public properties, some information is made available to the user about
the interface of the class being focused on. Secondly, the combination of private and public
properties gives a the user a good indication of the composition of the class, the data which
it encapsulates.
The layout of such a model would need to be similar to that of a method-centric model,
with the focused-on class central, surrounded by representations of its properties. Alternative
49

Figure 5.3: Sketch of method-centric Model
50

forms of layout are however, possible. One could imagine a situation where the central class is
represented by some large transparent entity, and within this are representations of properties.
5.6 Metric-centric framework
Show representations of metrics information within a visualization.
A lot of metrics information can be generated from a system’s source code. Some of this
may be useful as part of a visualization to aid a user in maintaining code. There now also
exist, in addition to standard metrics for procedural languages, specialised metrics for OO
systems. These are outlined in [16]. [10] includes a good overall account of software metrics.
The types of metrics worth including are those such as “Lines of Code”, and “Age of
Code”. These can be applied with various scopes to add meaning to a visualization. For
instance, they may be scoped to a branch of the inheritance hierarchy, a single class, or a
method. There needs to some trade-off between information quantity, and cluttering of the
3D world.
Means of representing these metrics have been spelt out above, in Section 4.2 on page 33.
The advantage of including metrics information within visualizations is that they need not
be intrusive. They can be supplementary to the main focus of a model. That is, we may
have principally an inheritance hierarchy-centric model, with elements of metrics playing a
supplementary role. A metric-centric model would be rare as a stand-alone, but makes sense
when combined with another type of model.
5.7 Single class-centric view
Visualize a single class from a system, showing as much detail as required
Models generated from this framework would be useful when a single class embodies the
majority of a system, or is particularly complex. It should allow as much detail as possible
about the class, without producing information overload.
This kind of model would amalgamate features from all previously discussed frameworks.
The difference being that this type of model shall consist of a world containing only entities
relevant to the one central class. To have a world occupied by all classes in a system, shown
in a single class-centric manner would defeat the purpose of the framework.
51

The layout of this type of model could vary hugely, there being so many factors needing
inclusion. None are postulated here, however it is apparent that the 3D nature of visualiza-
tions would be an advantage in laying out this type of model, with so many different ways of
separating information. For example, by location, enclosure, adjacency, and/or orientation.
5.8 Framework Additions
The frameworks listed above are by no means an exhaustive list. Those given could be broken
down into sub groups, just as new frameworks could be imagined.
Transcending all of these frameworks, however, is the concept of attributes which are
common to all frameworks. There exist certain elements in OO systems that are just as
easily represented no matter what framework we are working within.
These are commonly attributes which are related to individual classes, since most frame-
works will contain either one or more classes. In addition, the types of attributes which can
be applied must be implementable without interfering with the general gist of the framework.
That is, attributes requiring large amounts of space, or large shapes, or text to represent are
unlikely to be successful, as additions.
The types of attributes which would make useful additions to any type of framework are
likely to be those with scalar properties, such as number of properties, number of methods,
or lines of code. These can be shown in unobtrusive ways, such as through the size of a shape
representing a class, its colour, or a myriad of other ways, as described in Section 4.2 on
page 33.
52
Chapter 6
Architecture
6.1 Introduction
To facilitate the implementation of all concepts mentioned in the previous chapter, it is obvious
that some architecture needed to be developed to facilitate the quick and easy generation of
visualizations from arbitrary OO systems.
Such an architecture needs to have qualities such as being extensible, and modular. By
extensible, we mean that we would like to have an open architecture which is easily modified.
If a new type of model is devised then a means of adding it to the architecture with minimal
effort should be available. Documentation on how to do this is given in Section 6.5 on page 73.
The architecture has also been designed with modularity in mind. This means that the
tools which make up the architecture (see Figure 6.4 on page 74) should be separate from
one another where possible. Also, new tools should be able to be added to the architecture
in situations where this may be necessary.
6.2 An OO Meta Language
Using a single large program to take the input program, parse it, and build the VRML
output is not efficient or easily extensible. Therefore it was proposed that modular tools for
3D visualisation be produced. Our input should not be limited to Javadoc, but by the same
token we should not have to rewrite the entire system if we wish to use some other input
language.
53

Ideally this system should be able to generate a 3D representation given any OO sys-
tem. OO languages tend be very similar, with only small differences in syntax or grammar.
The basic concepts which we wish to model, of classes, methods, properties, etc are always
inherent, whatever the language C++, Java, SmallTalk, ...
The new system will separate the language parser and the VRML generator. Different
parsers will be required for different languages, but all will produce output of a uniform type:
a language representing the basic structure of an OO program, essentially everything but the
code, in a format easily parsed by the VRML generator.
This general OO language, which we have dubbed OODL (Obeject Oriented Definition
Language), has a form similar to HTML, in that there are tags representing the various
parts of the program. i.e. <Class> represents the beginning of a class definition; < \Class>
represents the end of the class definition.
Originally the system to generate VRML from an OO system worked only from a Javadoc
source. That is, it was hard-wired to a specific language. This was achieved by parsing the
Javadoc file, building an internal representation of the class hierarchy within the parser, and
then using this internal model to actually build the VRML.
This is not the ideal situation as we would like to be able to use any OO system to generate
3D, not just Java. Hence it was decided that some language be designed which allows us to
represent an OO system including only relationships and information necessary to build the
final VRML representation.
OODL lists classes and information about them which is pertinent to our modelling. It
has been designed in such a way that extra information fields could be added without major
changes to the parser, the concept being that everything which we could possibly want to
represent in 3D is either available in the language, or able to be added, as detailed in a later
section.
Now, instead of having one monolithic program which reads Javadoc, converts it into an
internal representation, and then to VRML, each step can be modularised. There will be
numerous programs to convert the various languages (C++, SmallTalk, Java) into OODL.
There will the be a program which reads OODL and builds an internal representation. There
are then various methods of this internal representation which can be invoked to build VRML.
For example, at an early point in experimentation with possible systems, two possible VRML
54

Java C++ UML
OODL
Manual Editing
(Conversion Programs)
Any OO Program...
Figure 6.1: Generating OODL
outputs were able to be built from the internal representation; the first being a tree represent-
ing the class hierarchy. The second is a representation of classes together with their parents
for an ‘at a glance’ view of the interface a class makes available.
Another advantage of using a separate language to represent OO systems is that it is not
even necessary to have a complete working source of an OO system to test the 3D generator.
A hypothetical system can easily be generated by hand in the OODL language, or perhaps
generated by some OO design tool such as UML. This will be useful for quick testing features
and prototyping, without requiring a genuine working system from which to generate the
OODL.
The generation of an OODL file is illustrated in Figure 6.1
6.2.1 The Format of OODL
OODL is used to describe the structure of an OO system.
Following is a definition of the current version of OODL in Backus Naur Form(BNF).
Before beginning the actual definition there are two special non-terminals which should be
discussed, <empty> and <string>.
The non-terminal <empty> means a blank terminal, that is, the empty string.
The non-terminal <string> represents any sequence of alpha-numeric characters, but may
not contain white space.
<OODL> ::= <classlist>
55
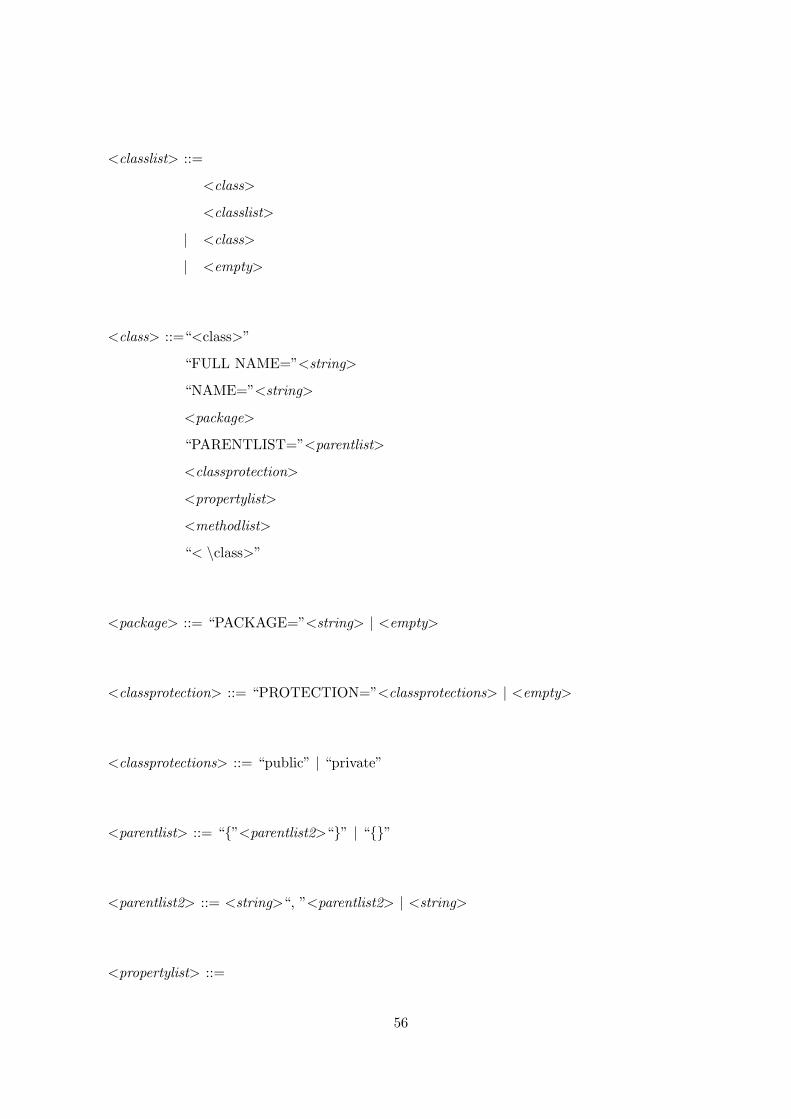
<classlist> ::=
<class>
<classlist>
| <class>
| <empty>
<class> ::=“<class>”
“FULL NAME=”<string>
“NAME=”<string>
<package>
“PARENTLIST=”<parentlist>
<classprotection>
<propertylist>
<methodlist>
“< \class>”
<package> ::= “PACKAGE=”<string> | <empty>
<classprotection> ::= “PROTECTION=”<classprotections> | <empty>
<classprotections> ::= “public” | “private”
<parentlist> ::= “{”<parentlist2>“}” | “{}”
<parentlist2> ::= <string>“, ”<parentlist2> | <string>
<propertylist> ::=
56

“<PropertyList>”
<propertylist2>
“< \PropertyList>”
| <empty>
<propertylist2> ::=
<property>
<propertylist2>
| <empty>
<property> ::=
“NAME=”<string>
“PROTECTION=”<protection>
“BINDING=”<binding>
“TYPE=”<string>
<protection> ::= “public” | “private” | “protected”
<binding> ::= “static” | “dynamic”
<methodlist> ::=
“<MethodList>”
<methodlist2>
“< \MethodList>”
| <empty>
<methodlist2> ::=
<method>
57
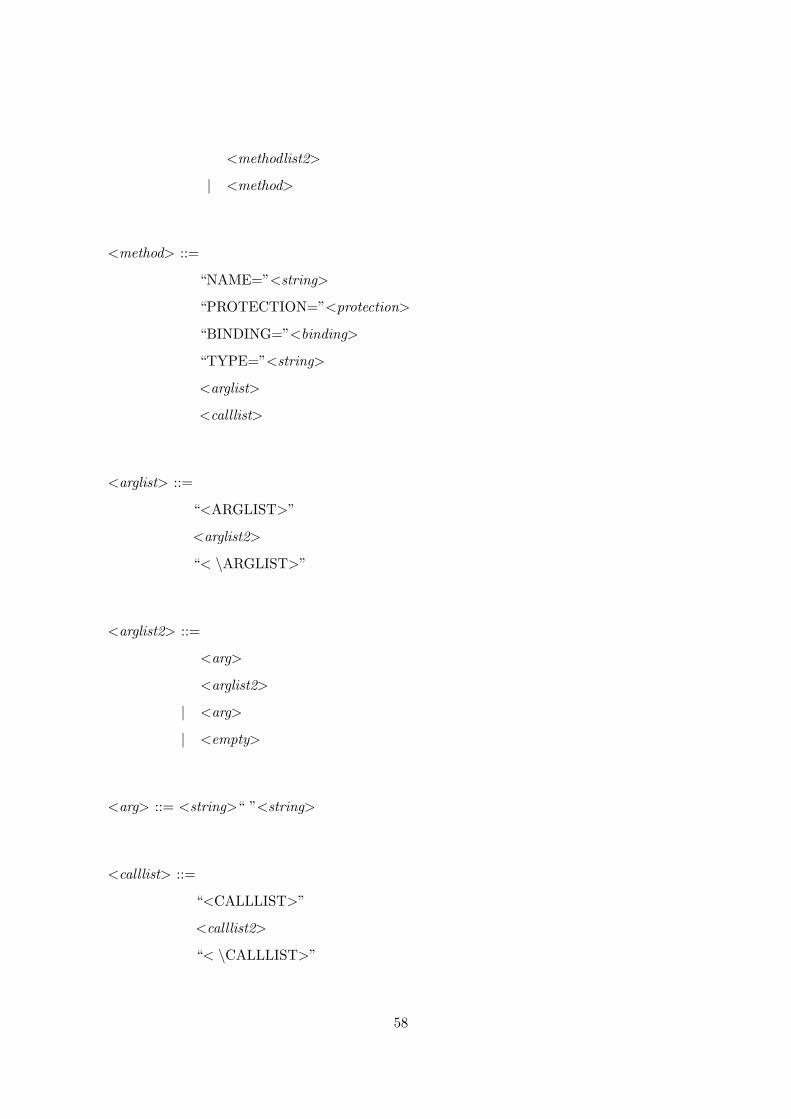
<methodlist2>
| <method>
<method> ::=
“NAME=”<string>
“PROTECTION=”<protection>
“BINDING=”<binding>
“TYPE=”<string>
<arglist>
<calllist>
<arglist> ::=
“<ARGLIST>”
<arglist2>
“< \ARGLIST>”
<arglist2> ::=
<arg>
<arglist2>
| <arg>
| <empty>
<arg> ::= <string>“ ”<string>
<calllist> ::=
“<CALLLIST>”
<calllist2>
“< \CALLLIST>”
58
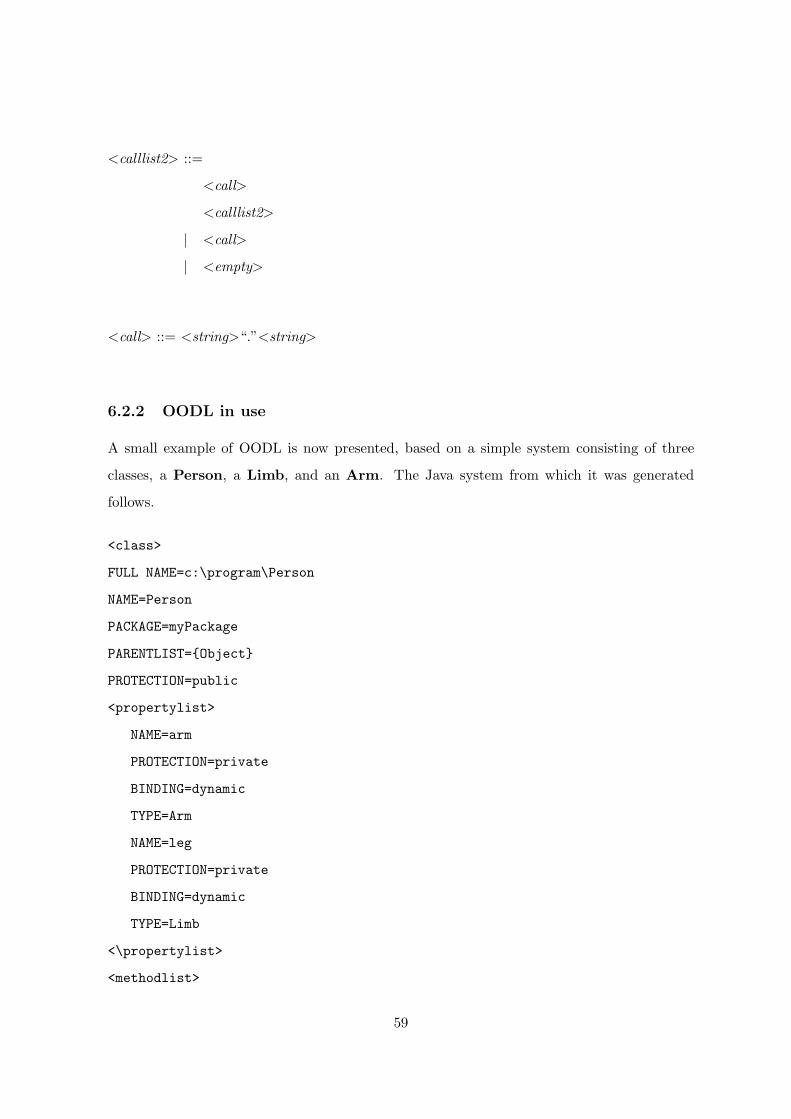
<calllist2> ::=
<call>
<calllist2>
| <call>
| <empty>
<call> ::= <string>“.”<string>
6.2.2 OODL in use
A small example of OODL is now presented, based on a simple system consisting of three
classes, a Person, a Limb, and an Arm. The Java system from which it was generated
follows.
<class>
FULL NAME=c:\program\Person
NAME=Person
PACKAGE=myPackage
PARENTLIST={Object}
PROTECTION=public
<propertylist>
NAME=arm
PROTECTION=private
BINDING=dynamic
TYPE=Arm
NAME=leg
PROTECTION=private
BINDING=dynamic
TYPE=Limb
<\propertylist>
<methodlist>
59
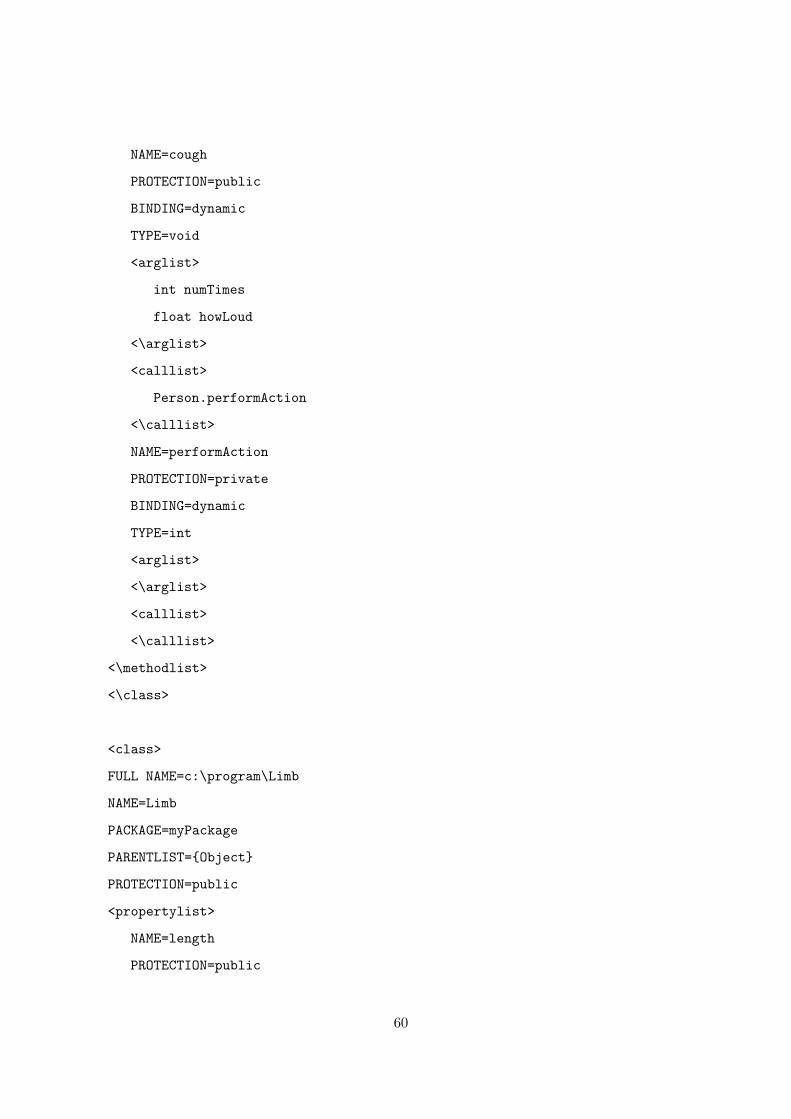
NAME=cough
PROTECTION=public
BINDING=dynamic
TYPE=void
<arglist>
int numTimes
float howLoud
<\arglist>
<calllist>
Person.performAction
<\calllist>
NAME=performAction
PROTECTION=private
BINDING=dynamic
TYPE=int
<arglist>
<\arglist>
<calllist>
<\calllist>
<\methodlist>
<\class>
<class>
FULL NAME=c:\program\Limb
NAME=Limb
PACKAGE=myPackage
PARENTLIST={Object}
PROTECTION=public
<propertylist>
NAME=length
PROTECTION=public
60

BINDING=dynamic
TYPE=int
<\propertylist>
<methodlist>
<\methodlist>
<\class>
<\class>
FULL NAME=c:\program\Arm
NAME=Arm
PACKAGE=myPackage
PARENTLIST={Limb}
PROTECTION=public
<propertylist>
NAME=numFingers
PROTECTION=public
BINDING=dynamic
TYPE=int
<\propertylist>
<methodlist>
<\methodlist>
<\class>
public class Person {private Arm arm;
private Limb leg;
public void cough(int numTimes, float howLoud) {performAction();
System.out.println("I coughed " + numTimes+ ", this loudly:" + howLoud);
}private int performAction() {
61

// Do some stuff. . .
} 10
}public class Limb {
public int length;
}public class Arm extends Limb{
public int numFingers;
}
6.2.3 How OODL is generated from Javadoc
In theory OODL can be generated from any OO language. Over the course of this thesis, we
have extracted OODL information from both a Java source, and a C++ source.
Javadoc is a collection of HTML files relating to some Java package. Together, the HTML
files describe the basic elements of classes, methods, properties, constructors, etc within the
package, in a user friendly manner. It is worth noting that no code is shown in Javadoc,
only high level definitions of classes, methods, properties, constructors and the like. There
are HyperLinks within Javadoc pages, allowing browsers to jump off to related definitions
if necessary. Javadoc is generated from Java source files. By using Javadoc, an element of
the source parsing is simplified, and we are left with mainly the elements we desire, i.e. the
skeleton classes.
Using Javadoc to generate OODL involves reading an initial ‘tree.HTML’ file (which all
Javadoc’s have) which contains the class hierarchy. From this file there are links to all other
files; a single .HTML file for each class. These class files contain information primarily about
properties and methods, which are a major factor in our modelling.
By systematically parsing all Javadoc files, an OODL file can be generated. For the
specifics of this process, see Section 6.5.2 on page 75.
6.3 How to Represent Models
Whilst originally designing the architecture, it was necessary to write unique Java code for
each new type of model which was to be rendered in VRML. This was a time consuming,
62

repetitive, process. Time spent here could have been better spent designing new ways of
viewing systems, or testing existing models for usefulness.
The coding of classes in Java to generate VRML can be very repetitive, consisting mainly
of outputting VRML syntax, brackets, and other such filler material. Between two different
models, a large proportion of the VRML may be the same or similar, but it is not just a
simple matter of cutting and pasting code, since there is a high degree of nesting which must
always balance. Nodes within VRML may be given programmer-designated labels, so one
must be careful to make sure all labels are unique.
6.3.1 A language to represent a VRML model
A method to represent the mappings between an OO system and the VRML model of that
system is required. At first this may seem like an overly ambitious task, since there are po-
tentially infinite ways of mapping OO to VRML. However, if we start with only the mappings
required to generate existing VRML models, and simply add to our mapping language each
time we require a new model, potential combinations of mappings can become large very
quickly. As more models are added, the number of potential models increases exponentially,
due to possible combinations between models.
A simplified example of this concept is now presented. It involves an initial system devised
to illustrate a class. A single mapping for this model is: A class may be represented by
either a circle or square (2 dimensional for simplicity’s sake). It is obvious that this
set of mappings presents us with two possible models, as shown in Figure 6.2 on the next
page.
We now introduce another model, which shall portray properties of classes. The arbitrary
mappings for this model are: Properties may be represented as a string beneath a
class, or a string above a class. Again, this allows two potential models.
Our mappings list now contains two possible mappings, which happen to be of the sort
that can co-exist in a single model. Both mappings have two discrete values they may possess.
Combined, we now have four possible models we may generate from these mappings. These
are shown in Figure 6.3 on the following page.
If we were now to continue this example in a similar fashion, and introduce another
mapping with two possible values, it is obvious we would end up with eight potential models.
63

This shows how quickly many potential models can come about from a relatively small number
of simple mappings.
Figure 6.2: Two possible mappings to class shape.
Figure 6.3: Four possible mappings to class shape, and property arrangement.
Some mappings, of course, may be specific to certain types of models, so will not multiply
the total available models in the manner outlined above. However, we should expect that the
majority of mappings should be usable across all models.
It is not our intention to design a list of mappings and program these with the intention
that no more code need be written. It is understood that this method of doing things is an
alternative to programming the mappings by hand that will be just as difficult, if not more
64

so, to program. However, there is the reward of being able to create many variations on a
basic model very quickly with minimum effort.
Another advantage of using mappings is that they tie in nicely with the concept of model
frameworks, as discussed in Section 5 on page 44. From within a global mappings file, the
type of model framework to be produced is selected. This tells the model generator what
general form the model should have, and how its basic structure should look. Within each
framework, there may be specific mappings. For instance, in the hierarchy-centric framework,
we may wish to show the hierarchy tree in several different ways, as shown in Section 7.1.2
on page 106.
In the current state of the architecture, mappings are defined in a text file. It would be
feasible in the future, if the concept were to be developed, to create a graphical interface to
the mappings. Using a visual programming language this could be implemented relatively
quickly.
6.3.2 The form of the mappings
The possible mappings will be of two types:
Mappings from a discrete set of values,
or
Mappings which take on some value.
For example, a possible mapping with discrete values may be:
Shape={Circle | Cube | Cone | Pyramid} (That is, a mapping Shape can take one
value of Circle, Cube, Cone, or Pyramid)
A possible mapping with some given value may be:
ShapeHeight=3.7
65

Another possibility is to allow VRML chunks to be inserted as mappings. That is, when
some condition or situation is encountered, a piece of pre-defined (within the mappings)
VRML is inserted directly into the final VRML. This may allow much more flexibility, and
the code which generates VRML from the mappings list will be changed less often.
6.3.3 Architecture of Mappings
The file containing the mappings to be used shall be named with a .map file extension. A
mappings file will be requested when generating a model, or batch models may be generated,
which will involve each .map file in a directory being used. Files of type .wrl will be generated
for each .map file with the same name. Therefore, for instance, a file properties.map would
generate a VRML file properties.wrl.
The actual structure of the mappings file will be of the following form:
/property=value ...
Properties which require multiple lines, for example program scripts, will be of the form:
/property=line1...
line2...
line3...
...
That is, each property is identified by beginning with a slash, and ending with an equals. Each
Value is defined by beginning with an equals sign, and ending with a slash, or a comment
symbol (discussed below).
A Java program has been written to read a list of mappings from file. It is described
in detail in Section 6.5.4 on page 83. All functionality concerning mappings is handled by
this class, mappings, which uses a vector to store all the mappings. It has methods to set
some property (add it to the vector), get some property (search the vector for a string which
matches the property), and a method to read all mappings from file. Everything within the
mappings class is static, so only one set of mappings may be in use at any one time, which
66

avoids confusion and allows the actual VRML generating software to use simple, intuitive
commands such as:
out.println(mappings.getProperty(""Shape""))
6.3.4 The mappings in use
Whilst attempting to write mappings files some potential shortcomings were discovered.
Firstly, it is often necessary to be able to insert values into a mapping from within the
model generating software. For example, if you want a class to be represented by a sphere,
and its number of properties to be represented by the sphere’s radius, then a mapping of the
following form would not be satisfactory:
/classShape=geometry Sphere { radius 20 }
VRML has no concept of variables, values are literal as written in the VRML script (20
in the above case).
There needs to be some way to be able to specify the required radius from within the
program that actually builds the final VRML. The radius is a factor computed from within
that final program rather than something static in the mappings. However, we wish to be
able to specify within a mapping where we wish the radius to appear. The simple way around
this would be to split the mapping into two parts, that before the radius value, and the part
after. However, this would deter from the clarity a mapping file should provide, and also be
more complicated to implement in the actual code that generates the final VRML.
The alternative is to allow variable substitution into mappings. This is achieved by using
a special string $$ to show that a variable substitution is required.
Our previous example would now become:
/classShape=geometry Sphere { radius $$ }
67

When actually using this mapping in code, a form such as the following would be used:
double radius = 3.5;
out.println(mappings.get(‘‘classShape’’, radius));
This would substitute the value of radius into the mapping’s string before output.
This alleviates many of the problems associated with using mappings. There is, however,
another situation which requires a more complex form of substitution. Consider the example
above of a mapping to describe the shape and NOP (Number Of Properties) of a class repre-
sentation. In that case, we were assigning a value from the generating program to the radius.
What if we wanted to somehow combine that value with a constant that could be stored in
the mappings file? For example, suppose we wanted to add the value three to every radius to
scale the entire diagram up. The obvious solution would be:
/classShape=geometry Sphere { radius ($$ + 3) }
Unfortunately this does not work in our situation because we are outputting VRML which
does not allow in-line expressions such as this one. The final VRML produced from the above
code may look something like:
geometry Sphere { radius (20 + 3) }
As mentioned the VRML parser can not handle this in-line expression.
The other alternative is to store the constant 3 (from the example) in a separate mapping.
For example, it may be called classSizeMultiplier. This would then be used in code in the
following manner:
68

double radius = 3.5;
out.println(mappings.get(‘‘classShape’’, radius)
+ mappings.get(‘‘classSizeMultiplier’’));
The downside to this approach is that we are again adding extra mappings which add
unnecessarily to the complexity of the mappings file.
A means of circumnavigating this problem would be the use of a pre-processor on the final
VRML file. This could search the VRML for any in-line functions, and evaluate them. This,
we believe, is not the best solution, if for no other reason than that it introduces another
module into the pipeline of the architecture which is not necessary if the following solution is
used.
The final solution involves allowing substitution, with addition or multiplication, directly
within mappings. For this type of substitution the following syntax is used in the mapping:
/classShape=geometry Sphere { radius ($+3+$) }
Then in code the following would be used:
double radius = 3.5;
/out.println(mappings.get(‘‘classShape’’, radius ));
In this case the value of the radius added to the value between the symbols $+ and +$ in
the mapping is substituted into the final output string. $* is used in the same way.
By using these various methods of substitution it is possible to build up a powerful list of
mappings that is easy to read, understand and change, without compromising ease of use or
69

introducing difficulty into the task of coding the final VRML generator.
Of additional use is a comment character, * (asterisk), which can be used in the mappings
file. This allows the user to add a description of a mapping within the file for additional clarity.
This is also useful for detailing how substitutions may be made in a particular mapping.
The mappings file should be partially self documenting, if the following convention is fol-
lowed:
* mapping=option1 | option2 | option3 ...
mapping=option2
This demonstrates how a comment should be used to show what mappings are available,
in a discrete type of mapping.
For a continuous type of mapping, the following form of comment should be used:
* mapping=(0...100) (double)
mapping=36.457
6.3.5 Example Mappings
The following example shows an excerpt from the mappings file used to generate the model
shown in Figure 7.17 on page 117:
* GENERAL STUFF ABOUT MODEL...
* Sky Colour is [0 0.6 0.8]
/backgroundVRML=Background {
groundColor [ 1.0 1.0 1.0]
70
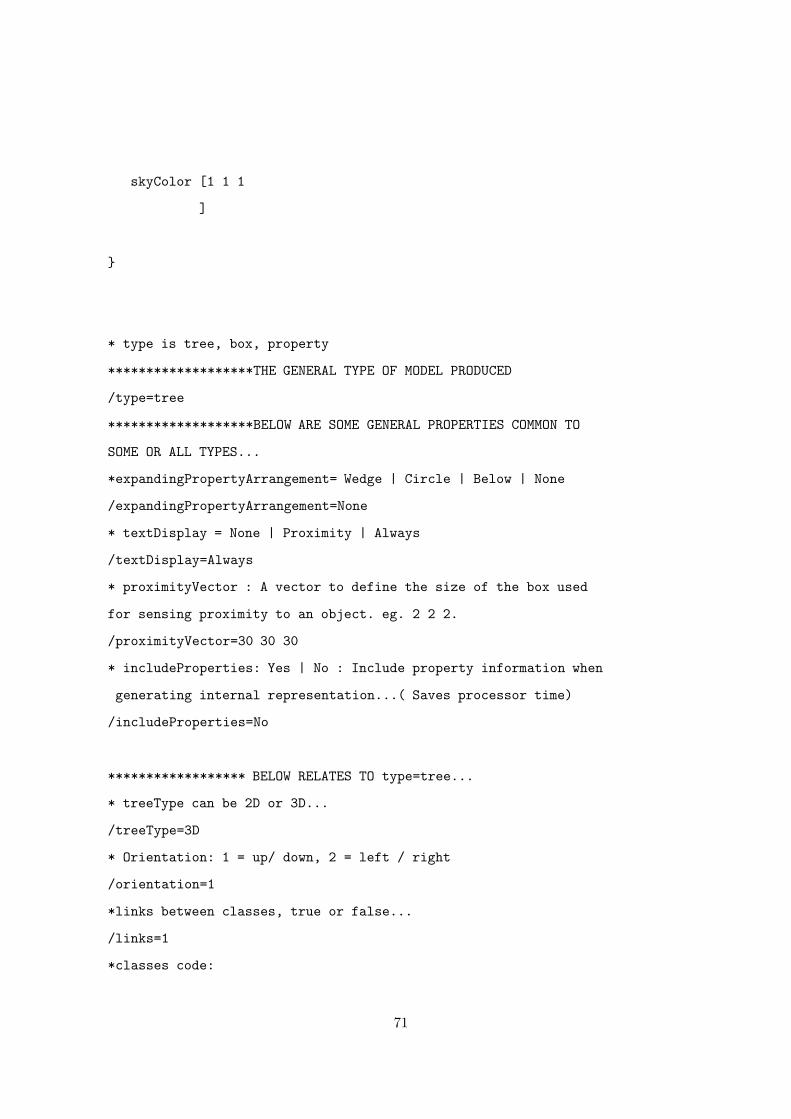
skyColor [1 1 1
]
}
* type is tree, box, property
*******************THE GENERAL TYPE OF MODEL PRODUCED
/type=tree
*******************BELOW ARE SOME GENERAL PROPERTIES COMMON TO
SOME OR ALL TYPES...
*expandingPropertyArrangement= Wedge | Circle | Below | None
/expandingPropertyArrangement=None
* textDisplay = None | Proximity | Always
/textDisplay=Always
* proximityVector : A vector to define the size of the box used
for sensing proximity to an object. eg. 2 2 2.
/proximityVector=30 30 30
* includeProperties: Yes | No : Include property information when
generating internal representation...( Saves processor time)
/includeProperties=No
****************** BELOW RELATES TO type=tree...
* treeType can be 2D or 3D...
/treeType=3D
* Orientation: 1 = up/ down, 2 = left / right
/orientation=1
*links between classes, true or false...
/links=1
*classes code:
71
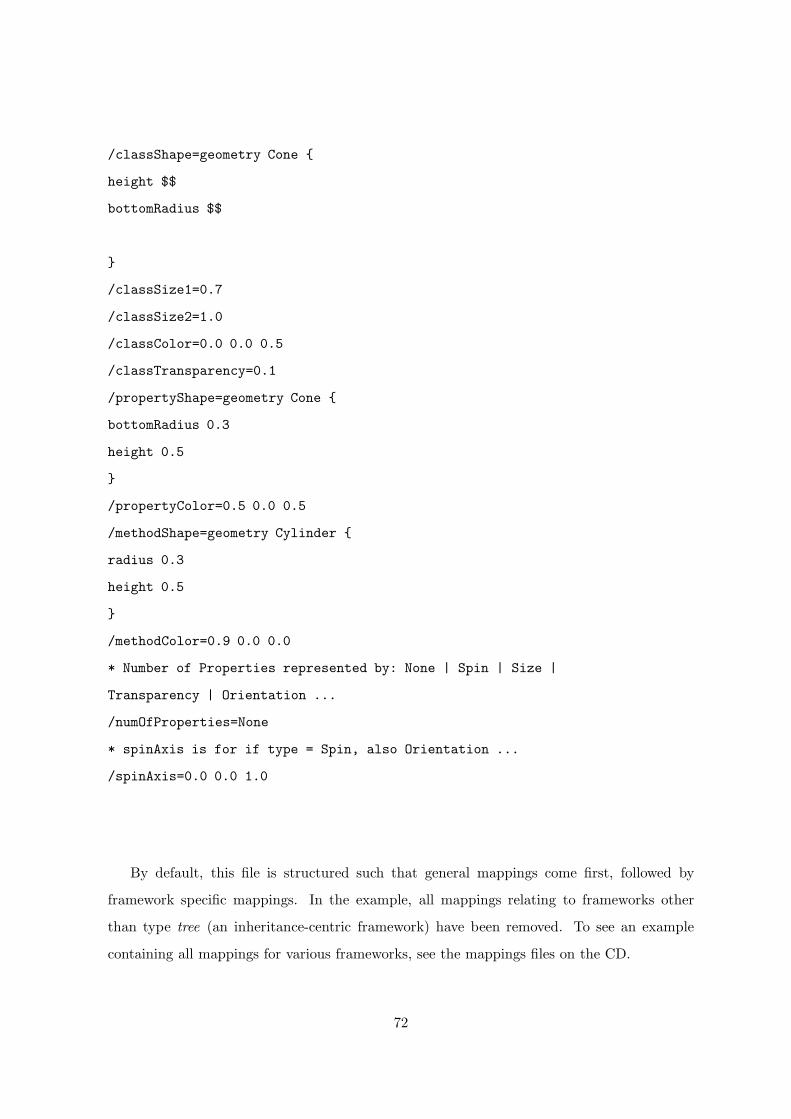
/classShape=geometry Cone {
height $$
bottomRadius $$
}
/classSize1=0.7
/classSize2=1.0
/classColor=0.0 0.0 0.5
/classTransparency=0.1
/propertyShape=geometry Cone {
bottomRadius 0.3
height 0.5
}
/propertyColor=0.5 0.0 0.5
/methodShape=geometry Cylinder {
radius 0.3
height 0.5
}
/methodColor=0.9 0.0 0.0
* Number of Properties represented by: None | Spin | Size |
Transparency | Orientation ...
/numOfProperties=None
* spinAxis is for if type = Spin, also Orientation ...
/spinAxis=0.0 0.0 1.0
By default, this file is structured such that general mappings come first, followed by
framework specific mappings. In the example, all mappings relating to frameworks other
than type tree (an inheritance-centric framework) have been removed. To see an example
containing all mappings for various frameworks, see the mappings files on the CD.
72

As can be seen, a lot of VRML code is imbedded in the mappings. This improves the
flexibility of the mappings concept, while taking away a lot of complexity from the program
which joins a mapping to a system.
Most of the mappings in the example are self explanatory, it should be read in conjunction
with Figure 7.17 on page 117 to make sense.
6.4 The Final Architecture
Over the course of this work, an architecture has evolved which enables the quick development
and testing of VRML models generated from OO systems. Through the use of the intermediate
language OODL, any OO language is able to be used, providing a suitable parser is created.
From an OODL file, an internal representation is built using a Java program. From this
internal representation, one or more mappings files are read, and, for each, a VRML file is
written. In some cases, depending on the contents of a mappings file, an HTML file may be
generated or included in the final output to be used in conjunction with the VRML.
The entire process is illustrated in Figure 6.4 on the following page.
6.5 Modifying the Architecture
In designing and implementing this architecture, a modular approach has been taken, as
mentioned previously. One reason for doing this was to make modifications and additions to
the system easier. In this section, a more technical overview will be given of the architecture,
as it stands. For each part, a discussion is given on what a user may wish to alter, and how
best to go about this.
6.5.1 Overview of the Architecture
The architecture is composed of 5 main modules. These are:
Converter This module, or set of modules, takes an OO system in some format, and converts
it into the language OODL.
Internal Representation Builder Parses an OODL file, and from this builds an internal
representation. This representation consists of a collection of Java classes.
73

Source Code
Internal
Representation
VRML
Mappings List
HTML Docs
Final Web PageRepresentation
OODL
Figure 6.4: Complete Architecture
74

Mappings Reader Reads a set of mappings from a mappings file.
Model Builder Given an internal representation and a set of mappings, this module builds
a VRML representation.
Document Linker This module generates a frame of text to accompany a VRML model.
Its output is an HTML file which includes the text and VRML.
The arrows in Figure 6.4 on the page before can be thought of as representing the above
processes.
6.5.2 Converter
This module is not a self-contained program, but in reality a set of separate programs. Their
purpose is to take an OO system, in some format, and convert it to OODL.
The existing converter which has been written, is for converting a Java OO system to
OODL. It does this by parsing Javadoc (as detailed in Section 6.2.3 on page 62). Javadoc is
generated from Java source using a program included in the Sun Java Distribution, Javadoc.
Given a directory containing Javadoc output, the Java program JavaToOOFormat.java
(included on the accompanying CD) will generate an OODL file.
There is very little reason for wanting to modify this converter program, however it serves
as an example of how such a conversion program may be written. It is not a good ex-
ample, though, because is written in a very convoluted manner. It would have been more
sensible to write it in a dedicated parsing language, Java examples being CUP (accessible
via www.cc.gatech.edu) and Jflex (www.jflex.de). Even if written in pure Java, it would
have been easier to use the Java.io.StreamTokenizer or the Java.lang.StringTokenizer
classes. Documentation for these is given in the standard JDK docs.
To write your own converter for some arbitrary language, the only detail required is the
definition of the OODL language, given in BNF form, in Section 6.2.1 on page 55.
6.5.3 Internal Representation Builder
This Module, which takes an OODL file and converts it into an internal representation, is
written in Java. The representation is encapsulated in a static class, aModel. This class
contains a collection of instances of the class object. Each object has a Vector (see JDK
75

documentation) containing a set of pointers to parents, and a separate Vector which contains
pointers to all children.
Classes are defined to represent methods and properties. Each object also has Vectors
containing both properties and methods. Where types are used in properties and methods,
pointers to the appropriate object are used.
A conceptual diagram of the model is shown in Figure 6.5.
Figure 6.5: Classes used in Internal Representation.
Class diagrams, showing properties and methods, are now given for the four main classes
used in the internal representation (aModel, object, property, method). These are shown in
Tables 6.1 on the next page, 6.2 on page 78, 6.3 on page 79, and 6.4 on page 79, respectively.
Only certain aspects of these classes are important, as far as possible modifications are
concerned. The only modification that would be sensible to make would be one resulting from
a change, or addition to, the OODL language. If this were the case it would be necessary to
alter the main method of the aModel class. This is the part of the system where the OODL
76

aModel
static object root
static Vector allObjs
static void main(String args[])
static void getPropertyList(DataInputStream din, object curr)
static void getMethodList(DataInputStream din, object curr)
public static void makeCONES()
public static void makePROPERTY()
public static void makeBOXES()
Table 6.1: Class diagram for Class aModel
file is parsed, and the internal objects linked together.
If one were to add, say, a field to OODL which gives the lines of code in a class, then
it would be necessary to change any converters that have been written. However, more
importantly for this module, we need to alter the parser in main, and also add a property to
the class object, to hold the Lines of Code (LOC).
The following example shows one way in which this may be achieved:
Firstly, given that our existing OODL language has a format like the following:
<class>
FULL NAME=c:\program\File
NAME=File
PACKAGE=Files
PARENTLIST={Object}
PROTECTION=public
...
We may wish the LOC to be included after PROTECTION, so our new OODL format
would produce files like the following:
77

object
private String name
private String fileName
private Vector children
public static String routes
public Vector parentList
public Vector methods
public Vector properties
public String protection
public String package
public void addChild(object o)
public Vector getChildren()
public String getName()
public int makeVRML(float x, float y, float z, PrintStream out)
private void computeLink(float x1, float x2, float y1, float y2, float z1, float z2, PrintStream
out, String theName)
private int makeBoxOffsets(int x, int y, int z, PrintStream out, object curr, String handle)
public int makeCubeVRML(int x, int y, int z, PrintStream out)
public int makeOffsets(float x, float y, float z, PrintStream out, String handle)
Table 6.2: Class diagram for Class object
78

property
public String name
public String protection
public String binding
public String type
public object obj
Table 6.3: Class diagram for Class property
method
public String name
public String protection
public String binding
public String type
public Vector arglist
public Vector calllist
Table 6.4: Class diagram for Class method
79

<class>
FULL NAME=c:\program\File
NAME=File
PACKAGE=Files
PARENTLIST={Object}
PROTECTION=public
LOC=345
...
The segment of code from aModel.main which handles the parsing of these elements of a
class is shown below:
str = din.readLine();
if (str.startsWith("PROTECTION")) {String prot = str.substring(11);
curr.protection = prot;
str = din.readLine();
}if (str.startsWith("<PropertyList>")) {
It can be seen that the place we would like to insert parsing for LOC is just after PRO-
TECTION is parsed, and just before the property list is parsed. There is a variable, curr,
which points to the current object being defined. Our new code to replace the above will look
something like the following:
str = din.readLine();
if (str.startsWith("PROTECTION")) {String prot = str.substring(11);
curr.protection = prot;
str = din.readLine();
}if (str.startsWith("LOC")) {
int loc = Integer.parseInt(str.subbstring(4));
curr.LOC = loc;
80
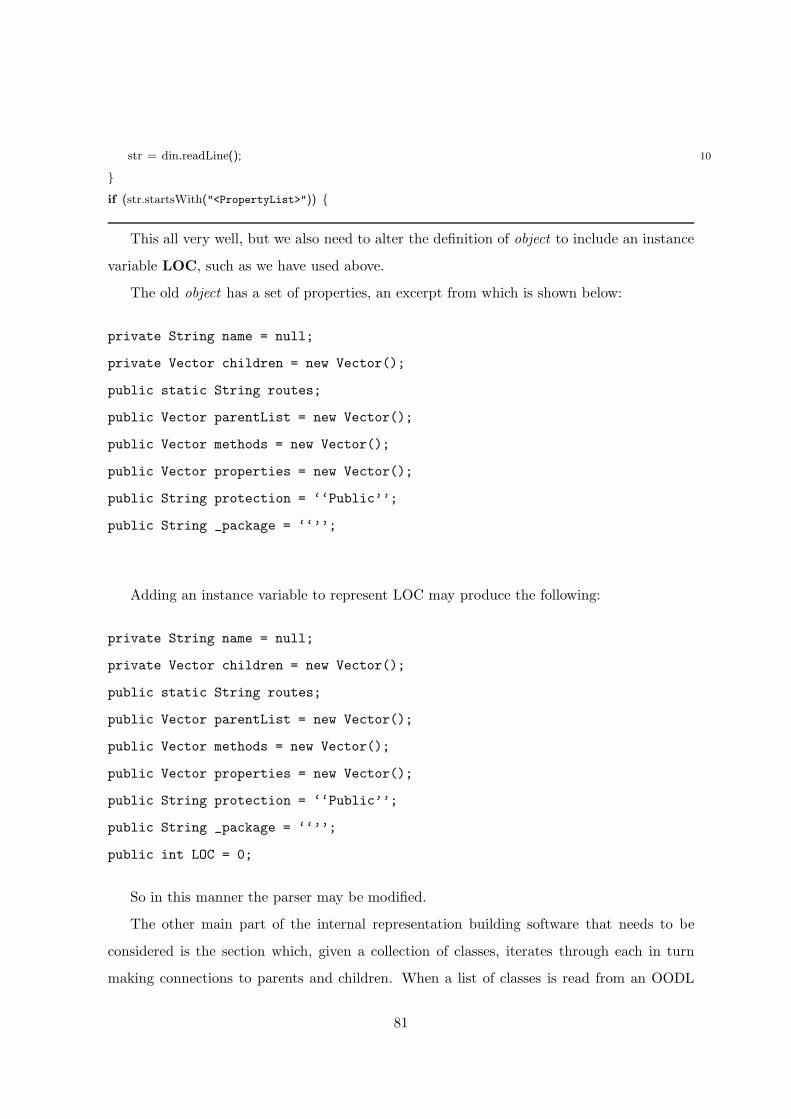
str = din.readLine(); 10
}if (str.startsWith("<PropertyList>")) {
This all very well, but we also need to alter the definition of object to include an instance
variable LOC, such as we have used above.
The old object has a set of properties, an excerpt from which is shown below:
private String name = null;
private Vector children = new Vector();
public static String routes;
public Vector parentList = new Vector();
public Vector methods = new Vector();
public Vector properties = new Vector();
public String protection = ‘‘Public’’;
public String _package = ‘‘’’;
Adding an instance variable to represent LOC may produce the following:
private String name = null;
private Vector children = new Vector();
public static String routes;
public Vector parentList = new Vector();
public Vector methods = new Vector();
public Vector properties = new Vector();
public String protection = ‘‘Public’’;
public String _package = ‘‘’’;
public int LOC = 0;
So in this manner the parser may be modified.
The other main part of the internal representation building software that needs to be
considered is the section which, given a collection of classes, iterates through each in turn
making connections to parents and children. When a list of classes is read from an OODL
81

file, and object classes are instantiated, these objects do not contain links to their parents of
children. Instead the parents are stored in a temporary instance variable, as text. When all
classes have been read from the OODL file, these textual values are used to create pointers
to appropriate parents and children.
A similar method to the above is used when linking properties and methods to appropriate
classes. For properties, this means creating a pointer to the class whose type the property
is. Methods also require this linking, and additionally all their arguments must be linked in
such a way.
This process of linking is embodied in the code excerpt given in Appendix B, Section B.2
on page 143. It is from the main method of the aModel class.
The only foreseeable situation whereby this section of code may need to be changed is
that where some new attribute of an object is added that requires a pointer to another class.
One example of this situation may be adding a constructor field to OODL. Constructors
have arguments in a similar format to methods. For each argument, a link may be needed
to its type. To implement such a modification would first require altering the parser, and
adding instance variables to the object class, as detailed above.
The linking section of aModel would be altered by adding a for loop similar to that used
for linking methods (shown below).
for (int z = 0; z < curr.methods.size();z++) {for (int lk = 0; lk < ((method) curr.methods.elementAt(z)).arglist.size(); lk ++) {
String currArg = ((argument) ((method)
curr.methods.elementAt(z)).arglist.elementAt(lk)).type;
for (int x = 0; x < allObjs.size();x++) {if (((object) allObjs.elementAt(x)).getName().equals(currArg)) {
((argument) ((method) curr.methods.elementAt(z)).arglist.elementAt(lk)).obj
= (object) allObjs.elementAt(x);
}} 10
}}
The outer for loop controls which method we are looking at, the central loop steps through
arguments, and the inner loop steps through all objects, looking for one that matches the
82

argument’s type.
A loop to link constructors’ arguments would be identical, except that instead of a Vector
called methods, we may have a Vector named constructors.
6.5.4 Mappings Reader
The mappings reader takes a file of mappings, and converts it into an internal representation.
A class mappings is defined which provides methods to read mappings from file and access
mappings. All properties and methods of the mappings class are static, since we only ever
need one set of mappings loaded at any one time. A class diagram is shown for the mappings
class in Table 6.5 on the following page.
Mappings are stored within the mappings class in a Vector, also called mappings. The Vec-
tor stores a collection of strings in the form mapping=value. The getMappings method loads
all mappings from file into this Vector. This method is shown in Appendix B, Section B.3.1
on page 145.
The various get methods are used to access the mappings. In its simplest form, that of
the get method with only one argument, the method will search the Vector until a match
is found. The value of the mapping is returned. This method is shown in Appendix B,
Section B.3.2 on page 146.
The more complex forms of the get method are used when substitutions need to be made
into the mapping’s value. The reason for using substitution is discussed in a previous section
( 6.3.4 on page 67). There are two different types of substitution, text and arithmetic.
Function overloading is used in the mappings class, hence all methods relating to the
get operation are called get. They are distinguished by their arguments. The two types of
get are those that require some number of textual substitutions and those that require some
number of arithmetic substitutions. The former are of the form:
public static String get(String toGet, String var1, String var2, ...)
The latter are of the form:
83

mappings
private static Vector mappings
private static String inFile
public static void addMapping(String str)
public static String get(String toGet)
private static String insertVar(String str, double var)
private static String insertVar(String str, String var)
public static String get(String toGet, String var1)
public static String get(String toGet, String var1, String var2)
public static String get(String toGet, String var1, String var2, String var3)
public static String get(String toGet, String var1, String var2, String var3, String var4)
public static String get(String toGet, double var1)
public static String get(String toGet, double var1, double var2)
public static String get(String toGet, double var1, double var2, double var3)
public static String get(String toGet, double var1, double var2, double var3, double var4)
public static String get(String toGet, double var1, double var2, double var3, double var4,
double var5)
public static float getFloat(String toGet)
public static void getMappings()
Table 6.5: Class diagram for Class mappings
84

public static String get(String toGet, double var1, double var2, ...)
The code for these methods is shown in Appendix B, Section B.3.3 on page 146.
The substitutions are handled one at a time from the left, by use of the insertVar
method in both cases. There are two versions of insertVar, one for each type of substitution.
insertVar finds the position of the first substitution and replaces it with the given variable. In
the case of the arithmetic substitution (public static String get(String str, double var)),
it is a little more complex, since we need to find the first occurrence of either $+ or $∗. The
insertVar methods are shown in Appendix B, Section B.3.4 on page 148.
The final method worth mentioning is the getFloat method which simply returns its value
as a float. This saves on conversion where the value is actually used in code.
Reasons for wanting to modify the mappings class may include:
• To change the comment character, or the character which begins a definition line
• To alter the existing substitution symbols
• To add new types of substitution
• Allow for more variables to be substituted into a value
• Alter the manner in which mappings are stored, or the manner in which they are
searched
6.5.5 Model Builder
Given a set of mappings, loaded into the mappings class, and an internal representation, a
VRML model can be built. There are two main ways in which this can be achieved. Firstly,
methods can be created within the object class. This is useful for recursive types of model
generation, such as generating a hierarchical model. The other method is to create new
classes specialised for a certain type of model. For any future additions, this is probably the
more sensible approach, since the object class is becoming to big, and it is more sensible to
encapsulate all model information in a single class anyway.
85

The way in which a model of each type is generated will now be described, with an example
for each.
Both types of model generation have features in common. These are:
Use of PrintStream object named out to send output VRML to file Both types of
model generation use this. It is set-up before model generation is begun, and always
takes a similar form. Below is an example from the method of aModel used to generate
a hierarchy-centric model;
File f = new File ("inheritance.wrl");
FileOutputStream fos = null;
object.routes = "";
try {fos = new FileOutputStream(f);
} catch (IOException e) {}PrintStream out = new PrintStream(fos);
out.println("#VRML V2.0 utf8");
out.println(mappings.get("backgroundVRML")); 10
out.println("Group {");
out.println("children [");
out.println("DEF defaultViewPoint Viewpoint { ");
out.println("position 0 0 150");
out.println("orientation 0 0 -1 0");
out.println("jump FALSE");
out.println("}");
Note how some initial VRML code is sent to the output file before model generation is
begun.
classobject has a class variable routes Of type String, this variable is used to store all
routing information generated during model creation. It is appended to the end of the
output VRML file after all nodal information is written.
86

Generation from within object class
The hierarchy-centric model is generated recursively from within the object class. The object
class is given on the accompanying CD (aModel.java). At a high level the process is this: an
object which is the parent of all top level objects has its makeVRML method called. This
outputs VRML to draw a representation of the class and accompanying text if necessary. A
method is then called, makeOffsets, which draws all properties and methods for this class.
The method makeVRML is then called for each child of the current class. Along with call-
ing the method for children, links may need to be output and these are handled by specialist
methods depending on what type of specific model is required. For 2D, drawRightAngle is
used, for 3D, computeLink is used.
This is a simplification of the process, since in some cases a lot of additional computation
is done. For instance, in the case of the 3D model, the positions of all classes must be
pre-computed before the actual model generation is begun.
Generation of models from stand-alone classes
The property-centric model is an example of a model which is generated using a stand-alone
class, in this case the class propertyCentric. This can be found on the accompanying CD as
propertyCentric.java.
This class has a method, makeVRML, which takes a single object as an argument. This
object is used as the basis for the model. Once the makeVRML method has output VRML
relevant to the class, the method drawProperties is invoked. This outputs VRML based on
the properties of the base class. What VRML is output is determined by the contents of the
mappings file.
The class propertyCentric has an additional class, point, defined within its source file.
This provides a useful class for doing certain 3D calculations with vectors.
When new classes are written in the style of propertyCentric, it may be necessary or
appropriate to use supplementary classes such as point. Or point itself may be more useful
as a publicly defined class.
87
Creating new model generators
Before going ahead with the task of creating a new model generator, consider whether a new
one is totally necessary. In some cases, it may be simpler to modify an existing generator,
and create mappings to control any additions.
A likely case for creating a new model generator is when a new model framework is
contrived (see Section 5 on page 44 for an overview of frameworks). This will often entail an
entirely new way of structuring a model, which is not easily attained from an existing model
generator.
When writing new classes to create models from scratch, existing classes may be used
as a template, but there is no “proper” way to write these classes. As long as they achieve
the desired end result, they may be written in any style the author desires to use. The only
recommendation made, if undertaking the writing of new model generating classes, is that
the existing classes be studied beforehand.
If a new framework has been created, there is a special mapping named (ambiguously) type,
which dictates the general type of model (framework). If this is the case, add a comment to
the mappings file as described in Section 6.3.4 on page 67, to reflect the fact that there is now
a new type of general model available. Keep in mind, when writing new model generators, the
existing mappings, and attempt to incorporate as many as are compatible with a new model
type. In this way consistency is preserved throughout the mappings, and model generation
is kept straightforward for the particular user who will have to use the mappings to generate
models.
In the following example, a new type of model, callgraph, has been created, which shows
which methods call which:
* type is inheritance | hierarchy | property | callgraph
*******************THE GENERAL TYPE OF MODEL (FRAMEWORK) PRODUCED...
/type=callgraph
The only other addition to existing code will need to be made in the aModel class. At the
88

end of the main method, an if statement will be need to handle the new type. The most
likely new code is shown below:
if (mappings.get("type").equals("property")) {model.makePROPERTY();
}if (mappings.get("type").equals("box")) {
model.makeBOXES();
}if (mappings.get(‘‘type'').equals(‘‘callgraph'')) {
model.makeCALLGRAPH();
}
The only other addition to make is to add a method to aModel entitled, in this case,
makeCALLGRAPH. This should be of near identical form to the method makePROPERTY,
except that rather than calling the makeVRML method of class propertyCentric, it may be a
call to method makeVRML in class callGraph (for example).
If altering any of the model generating classes, or writing new ones, it would be neces-
sary to first of all fully familiarise oneself with the VRML language. There exist numerous
books on the subject [5], newsgroups (comp.lang.VRML, alt.lang.VRML), and web pages
(www.vrml.org is the VRML consortium homepage).
6.5.6 Document Linker
This part of the architecture takes a completed VRML model, as a .wrl file, and encapsulates
this along with some form of documentation in an .html page. No form of document linker
has been implemented as of yet. A prototype page has been created to display a property-
centric model along with relevant Javadoc, but the web-page that encapsulates these two
documents was prepared by hand.
The writing of a program to link documents into a single web page would not be difficult.
Briefly, the modifications required to the existing source are outlined below:
Alter OODL The OODL language would need to be altered in one of two ways. A pointer
to source could be included in the OODL file, or the relevant source itself. The latter
option would be more portable, but may result in very large files.
89

Alter the OODL parser This section of code would need to be altered to read in relevant
source code. How this is achieved would depend on the approach taken in the above
design decision.
Alter model generation classes If the model is to be able to interact with accompanying
documentation, anchors need to be inserted into the VRML model. This has already
been done to some extent, as described in Section 4.5 on page 40. However, depending
on the type of documentation to be included, this may need to be altered, or appended.
Formatting of document The documentation to be included in the final web page may
need to be formatted in some way. In one case tried in this thesis, Javadoc was used
as the accompanying documentation. This required no additional formatting since it
was already in an HTML format. However, if, for instance, pure source code is to
be included, it would be useful to format this in some way. Pretty printing would
improve readability, and HTML anchors could be inserted at relevant points, such as
the beginnings of method definitions.
Final web page generation This may be a method of the aModel class, or a stand alone
program or class. Its job would be to generate a web page. The actual formatting of
this page may depend on options specified in the mappings.
6.5.7 Summary
Modifying, and/or adding to the architecture should not be overly difficult due to the modular
way in which it has been designed. Modifications can be made in small steps, as required by
users. All aspects of the system are extensible, and in fact encourage extensions.
A note here is probably appropriate regarding the combining of two or more versions of
the system that have evolved separately. If this is the case, it should not be overly difficult
to combine the two, as long as some careful planning is done first.
In some circumstances, no modifications to either system will be needed, if the only exten-
sions are to the OODL converters. These are stand-alone programs, and can be distributed
in any way their authors wish.
90
Some combinations will require minimal alteration, such as those where new types of
model generators have been created. Assuming these are stand-alone Java classes, they will
be reasonably straight forward to incorporate. Care must be taken to keep the mappings file
up to date with all possible mappings shown. This will require some effort from users to get
right.
More difficult combinations of two system evolutions would be those involving changes to
major parts of the general code. Areas such as the OODL parser, the mappings class, and the
internal representation builder. If any alterations are present in both evolutions, it will be
necessary to go through by hand, line by line, to produce a version which incorporates features
from both. See Section 8.4.1 on page 131 for possible ways of modifying the architecture to
deal with multiple version combination.
91

Chapter 7
Experiments and Findings
This chapter details experiments carried out in two areas. These are:
• How best to arrange models, so that they are effective, and what types (frameworks) of
models are best for what circumstances. Possible layout algorithms are explored
• Some real OO systems are visualized using some of the models we have available. These
are assessed as to how effective they are as visualization tools.
7.1 Various Frameworks Modelled
This section takes frameworks proposed in Section 5 on page 44, and shows some ways in which
they have been implemented. Various design decisions are discussed for each. Algorithms used
to build models are also discussed, where the implementation is non-trivial.
A lot of the layout decisions mentioned herein are general in nature, that is, they could
relate to a lot of other models. Where this is the case, the layouts are only discussed once.
However, it should be noted that in a lot of cases these layouts could just as easily be applied
to totally different types of models.
For example, a layout algorithm which organises properties in a spherical manner about a
class could just as well be used to show parent classes about a child class, or methods about
a class.
92

7.1.1 A Property Centric View
Motivation
A user may have a class, documented or otherwise, that contains properties of various types.
To gain a true idea of what this class encapsulates it is necessary for the user to understand
the interfaces of each property. In a text editor, this would require the user going away,
probably to other files, to locate class definitions for each class for each property. This is time
consuming and confusing, since the user can never really get “the big picture” because they
are always looking at individual elements of the master class rather than seeing it as a whole
with its constituents.
With this in mind, it would therefore make sense to create some sort of view whereby
the user can view a class (master class) with all the usual information about it, its parent(s),
methods, constructors, etc, but also properties, and representations of the classes they are
instances of. This then gives the user a true overview of the master class’s composition. The
only question here is do we show only the property’s classes, or the property’s class’s classes...
i.e. if Class A is composed of a class B which is composed of some class C, should we allow
the user to see that B is composed of C, or is it enough to say that A is composed of B, and
should the user wish to focus on B they must start the whole process again with B as the
focus?
Possible Constructions
For this view, the significant part ought to be the representation of the properties. There
is a certain level of detail about these properties which must be conveyed to the user. Any
information pertaining to the properties should be readily available to the user, rather than
hidden away, or difficult to get at.
Several alternatives are now discussed as to how best to represent the property centric
diagram. Each alternative is available to the user through the mappings file discussed in
Section 6.3.1 on page 63. Each alternative has been tested with a relevant test program to
assess its usefulness, and the results are discussed.
The first issue concerning this property centric view is how to represent the central class
which encapsulates the properties. There are a few factors to consider here, firstly the level
93
of detail required for this central class. It can either be represented, at one end of the
spectrum, as a simple shape with just its name shown, or, at the other end of the spectrum,
as a complex shape with much detail representing such things as parents, children, methods,
etc. It seems clear that neither of the extreme approaches would be suitable all of the time,
however after some experimentation it also becomes apparent that there is no perfect case
for this mapping. Although the focus is always primarily upon the properties there are some
circumstances where the user may wish to see more detail about the owner class rather than
less. At other times however the user may wish to know nothing about the owning class, or
already know a lot about it, and not wish the clutter of having a lot of redundant information
displayed.
Mappings are provided to control the level of detail provided about the encapsulating class.
There are three separate settings: No detail, some detail, and much detail. No detail shows
simply that class as a basic shape with just its name shown. Some detail shows information
such as parents and children. Much detail shows this plus methods. The way these details
are represented is not highly customisable since it is not really relevant to the focus of this
experiment.
The geometry and colour of the shape representing the encapsulating class are controllable
from within the mappings also, as described in Section 6.3.4 on page 67.
Why 3D is better
A two dimensional representation of a system which matches that which we have defined above
would require a large space. The most logical layout would be the master class in the centre
surrounded by representations of its properties and their classes. This may be satisfactory
for small classes but it in more complex situations any such diagram would become very
confusing, especially if you wanted to be able to view the properties of properties of the
master class.
In 3D, however, these problems of layout can be easily overcome. For example, one
possible layout may be to have classes in layers, with the master class in front, with its
property representations behind it, and their property representations behind that layer and
so on. On the other hand, perhaps some sort of layout whereby clicking on a property you
wish to study expands it, or rotates the entire system so that that property is nearest the
94

user.
3D is used to give users a ‘holistic’ feeling for a system should they so wish one. We do not
want to compromise clarity by having a large sprawling layout stretching for several screens
to each side of the viewer. We would like all information to be visible at once if possible in a
clear manner, with the viewer being able to select which part of the diagram they are most
interested in and moving to it, or having that element move to them.
An Implementation
For an experimental implementation it was decided to create a layout whereby the master
class would be central, surrounded by representations of its properties. These would remain
small and simple until clicked upon by the user, whereupon they would expand to show the
usual class details. Representations of this class’s properties should also appear, and could
be clicked on to the same ends. Each selected class should form a layer by moving toward the
user, hence owner classes should always be visible in the background, and can be returned to
by ‘shrinking’ any open class representations. The vital elements of this model are represented
in Figure 7.1 on the next page.
The figure shows a class A with properties B and C. The user has clicked on property B
which has expanded class D. Class D’s properties (E and F) are now also visible, and could
be clicked upon to show another layer of detail.
A major consideration in the design of this model was how properties should be arranged
around the central class. There are several factors which should be optimised when considering
placement of properties. Use of space is an obvious consideration. We wish to use space as
effectively as possible, especially given the additional third dimension. Clarity of view should
also be of importance. It is not satisfactory to have good use of space if this compromises the
visibility of features. The actual layout of properties should also be important, that is, how
they are arranged relative to each other. For instance we may wish to group by binding, or
by protection.
All of these factors are important in how we lay out the model, and are in fact quite
general, that is, they do not apply just to this property-centric model. Layout is important
for all the visualizations undertaken. Hence, we will go into depth on this matter here, with
the property-centric model as one possible application of a sensible layout scheme.
95

Figure 7.1: The Organisation of the Property-Centric Model
96

The filling of space is the first major consideration in layout. A good use of space should
entail entities which are not too close together that they are indistinguishable, nor too far
apart that any neighbour relationships are not clear. Entities too far apart can also produce
models which are tiresome to navigate. Another consideration in space usage is the use of
three dimensions. Distributing entities in only two dimensions when three are available will
lead to models which require undue navigation. As discussed in Section 3.2 on page 19, two
dimensional models, by their nature will lead to entities being, on average, further apart (if
evenly spaced). We would prefer to fill all 3 dimensions equally if possible.
Clarity of view is the next major consideration in our layout scheme. We require that in
an ideal situation, all entities should be as visible as possible. For maximum visibility, many
criteria must be satisfied. Firstly, entities must of such a size that they are easily identifiable,
without being unnecessarily large. Entities should be in proportion, depending on their role.
For instance, in the property-centric model, a class entity may be larger than a property
entity, since the class is the main focus of the model.
Clarity is also affected by entity placement. When placing entities, it is important to
consider how they may appear when viewed from various angles. Especially, the standard
angle of view must be considered. In our VRML worlds, the most common angle will be a
view parallel to the x and z plane. This is due to the fact that the VRML metaphor is that of
a person walking about on a flat surface (the x, z plane). This can be over-ridden, however.
Entities should be placed in such a way that their being obscured by other entities is
unlikely, and likewise, they should not obscure any other entity. This is especially true of
entities which are of a similar, or equal, colour, as these in particular may become unclear
when overlapping. A sensible choice of colours should help alleviate this situation arising. In
general, to prevent overlap we should not have entities placed in such a manner that they are
in line with more than one other entity. No two entities should be in the same x, z plane.
Layout of entities relative to each other is the final placement problem. Related entities
should be kept together, those unrelated should be apart. This is, however, a generalisation
and should only be the case when all other things are equal.
Choice of colours, as mentioned above, should also be a factor. Although not a problem
of placement, it can be related to the placement problem, and must be a consideration when
generating models.
97

Given the above criteria for entity placement, several variations were tried with the
property-centric model as a base. Each variation shows different schemes for placement, each
adhering loosely to the criteria whilst remaining practical. The variations are implemented
through the mappings, as discussed in Section 6.3.1 on page 63.
A Spherical Placement
In this placement scheme, properties are to be arranged equally around the outside of a
conceptual sphere, which shall be centred around the class which we are visualizing. The
radius of the conceptual sphere should be determined such that there is a sensible distance
between entities. That is, if there are 100 entities the sphere should be of a larger radius than
if there are 10 entities.
Technically, this placement involves minimising the maximum distance between points
on the surface of a sphere. Another way of conceiving the problem is to imagine charged
particles confined to the surface of a sphere, free to move about that surface. If all particles
are repulsive to each other, they should eventually settle into a pattern where their maximum
distance apart is a minimum.
Reasons for wanting such a placement scheme, given the criteria above, include:
• Space usage is very efficient. All dimensions are used equally since the entities are
arranged about the surface of a symmetrical 3D object. Also entities can be placed
such that the distance between them and their nearest neighbours is always equal.
Given this nearest neighbour distance, and some number of entities, we need only alter
the radius of the sphere onto which entities are placed to give an identical spacing no
matter the number of entities.
• Concerning layout, no more than two entities will ever lay on the same line of sight, since
a line through a sphere intersects with at most two points. To remedy the possibility of
entities being in the same x, z plane, the sphere can be rotated by small amounts about
the x or z axes until such a situation is alleviated.
• Relative placement of entities is straightforward in this scheme, similar entities should
be neighbours on the sphere.
98

Computation of points on the sphere is a non trivial problem. There is no obvious solution,
as in 2 dimensions (a circle), where 360 degrees can be divided by the number of entities to
be plotted. Given this angle, it is a simple matter of using sine and cosine to find the points
in space.
In 3 dimensions, a sphere cannot simply be divided up into equal angles depending on
the number of entities to be distributed (henceforth n). For this model, placement is based
on angles computed by Sloan, Hardin and Smith ([13]). They list angles of separation for n
entities on the surface of a sphere. Values of n are given from 4 up to 130. These values were
inserted into a text file to be used by the program in our architecture which computes the
actual x, y, and z values to plot entities at.
Given some value, n, the process of computing points involves the following process (a
circle of radius 1 is assumed):
Table Lookup The table aforementioned is searched for the angle which corresponds to the
value n. As a running example we will use a value of n of 10. The relevant angle for this
n value is, from the table, 66.1468220 degrees. This angle shall henceforth be referred
to as θ.
Initial Points Computed The initial two starting points are trivial to compute. Any point
can be used as the start point, we choose arbitrarily (0, 1, 0). From this first point we
can move θ degrees around the great circle in the x, y plane (arbitrarily). This gives us
our second point.
Compute remaining points Points are generated systematically by taking any two exist-
ing points (p1, p2), and from these generating two new points (n1, n2). This is achieved
by creating circles (c1, c2) around both p1 and p2. These circles are defined as laying
entirely on the sphere’s surface, and each point on a circle’s surface is θ degrees from
it’s parent point, through the sphere’s centre. The two points at which circles c1 and c2
intersect are the two new points. This process is shown in Figure 7.2 on the following
page. Before these new points can be accepted into the set of points, they must be
checked to make sure they do not already exist, since in some cases a point may have
already been generated from some other two points.
The spherical placement, when put into practice, produces a model such as that in Fig-
99
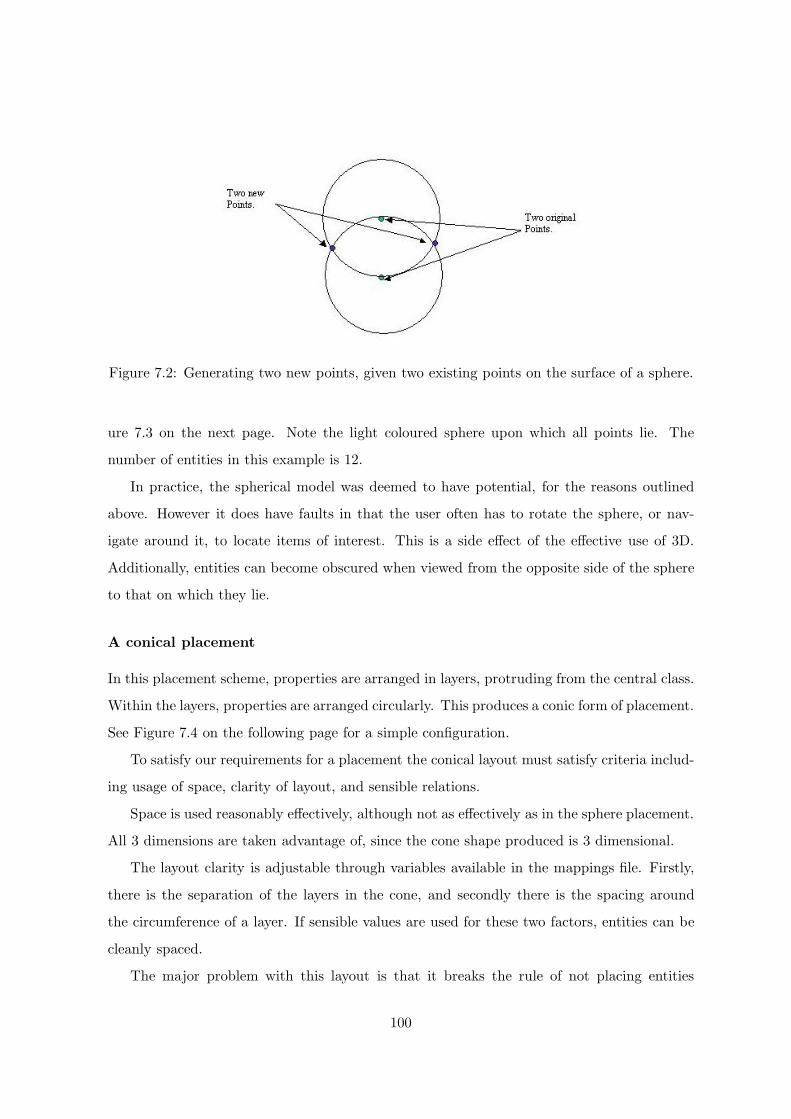
Figure 7.2: Generating two new points, given two existing points on the surface of a sphere.
ure 7.3 on the next page. Note the light coloured sphere upon which all points lie. The
number of entities in this example is 12.
In practice, the spherical model was deemed to have potential, for the reasons outlined
above. However it does have faults in that the user often has to rotate the sphere, or nav-
igate around it, to locate items of interest. This is a side effect of the effective use of 3D.
Additionally, entities can become obscured when viewed from the opposite side of the sphere
to that on which they lie.
A conical placement
In this placement scheme, properties are arranged in layers, protruding from the central class.
Within the layers, properties are arranged circularly. This produces a conic form of placement.
See Figure 7.4 on the following page for a simple configuration.
To satisfy our requirements for a placement the conical layout must satisfy criteria includ-
ing usage of space, clarity of layout, and sensible relations.
Space is used reasonably effectively, although not as effectively as in the sphere placement.
All 3 dimensions are taken advantage of, since the cone shape produced is 3 dimensional.
The layout clarity is adjustable through variables available in the mappings file. Firstly,
there is the separation of the layers in the cone, and secondly there is the spacing around
the circumference of a layer. If sensible values are used for these two factors, entities can be
cleanly spaced.
The major problem with this layout is that it breaks the rule of not placing entities
100

Figure 7.3: Wire Frame view of Spherical placement model with 12 entities.
Figure 7.4: Conical placement of properties.
101

Figure 7.5: Conical placement of properties.
together in the x, z plane. However, this problem is circumnavigable. The cone need only be
tilted at some angle away from the y axis.
As concerns grouping of entities, a logical way to go about this would be to keep like
entities together in layers. The only drawback of this may be that if x items are to be
grouped, and no layer is deemed to contain x items, it may be necessary to reduce or increase
the number of entities in that layer.
When generated, a typical conical placement model may look like that in Figure 7.5.
In practice, the conical model is reasonably useful. This is especially so if different layers
contain related entities. A user can navigate to the required layer, then rotate that layer until
the required entity is in the foreground.
102

A Spiral Placement
In the spiral placement scheme, properties are arranged such that they spiral away, as can be
seen in Figure 7.6.
All of the schemes of arrangement mentioned herein represent my own creations over the
course of this work.
Figure 7.6: Spiralling placement of properties.
7.1.2 The Inheritance-centric Model
Motivation
The goal of this type of model is, as stated in Section 5.3 on page 45, to provide a means by
which users can see, at a glance, what a particular class has inherited from all its ancestors, by
way of inheritance. This makes clear the actual interface provided by a class, without having
to go off and examine every ancestor class individually, which would be a time consuming
103
process.
Classes need not only be shown together, but additional features can make these models
even more useful. For instance, making properties and methods stand out which are used in
the final class. This would give an “at a glance” impression of the interface of a class.
Why 3D is better
For this type of model, there are various attributes of a system which must be displayed for
the model to be useful. These are:
All Ancestors All the ancestors of a given class must be shown in a clear way for the model
to be useful.
Properties and Methods Properties and methods must be shown for each class.
Relationships The relationships between these classes is important in understanding how
the final classes’ interfaces are arrived at.
In a two dimensional model of this type, compromises would have to be made to allow
all this information to be shown. 3D allows multiple dimensions to be used to show all the
above information without cluttering the screen. The example from Section 7.1.2 on page 106,
Figure 7.10 on page 108, below shows clearly how 3D space can be used advantageously. In
this case, one dimension (x, for argument’s sake) is filled by the classes for which ancestry
diagrams are given. The y axis is filled by properties and methods of classes. The z dimension
is filled with ancestor classes. In this way all dimensions are used effectively, whereas if this
particular model were mapped to 2D, one of these features would have to be compromised.
Possible Constructions
Numerous ways exist in which such a model’s layout could be arranged, each having its own
advantages and disadvantages. Certain layouts may be more appropriate for deep hierarchies,
as suggested in Section 5.3 on page 45, others may not.
Suggested below are some of the most likely ways in which models may be constructed.
104

Shells
A shell style layout may involve having the child class central, surrounded by its parents
arranged in shells. These shells would be represented by spheres, and would need to be
transparent to some degree. Additionally, shells may need to be made non-solid, so that a
user can navigate “inside” shells, to view inner ones.
Such a model may look like that in Figure 7.7 (solid), and Figure 7.8 (wireframe). Both
illustrate 3 spheres arranged as shells. The outer sphere represents a base class, which inherits
from no other class. The class inside the outer class inherits from it. The inner class inherits
from the middle class, so indirectly inherits from the outer class also.
Figure 7.7: Solid representation of classes arranged in shells.
Figure 7.8: Wireframe representation of classes arranged in shells.
This arrangement in shells would appear to be a logical layout. However, the question
must be addressed of where to place the actual information that classes encapsulate. That is,
details of the various properties and methods a class may have. In this area, the concept of
105

shells comes somewhat unstuck. There would seem to be no logical placement of properties
and methods that does not lead to a largely cluttered diagram, unless each shell is made of
very large dimensions, in which case the whole point of the exercise is defeated. Alternatively,
a HUD (Heads Up Display) may be incorporated to show information, or this model could
be used in conjunction with web browser frames, as detailed in Section 4.5 on page 40.
If smaller entities are used to represent properties and methods, perhaps as detailed in
Section 7.1.1 on page 98 (smaller spheres evenly spaced about the outside of a large sphere),
then difficulty is encountered in that each subsequent shell obscures inner shells, which is
obviously not satisfactory. As such, experimentation into the use of shells to represent this
type of model was not greatly pursued. This is not to write it off, however. For the purposes
of this thesis, given time constraints, it was deemed wise to focus on a layout with more
potential.
Tree Groups
Tree Groups are the result of postulating on various layouts. They will be familiar to anyone
involved with tracing of family trees. There are two ways of tracing a family tree, from the
top-down (what we have deemed hierarchy-centric), and, from the bottom-up (inheritance-
centric).
Drawing a tree from the bottom-up entails starting with (in our case) a single class, and
showing all its known ancestors, organised by parent-child relationships.
The title tree groups comes from the fact that these trees are grouped together by
system. That is, for a given system, each class will have its own tree. Classes that are base
classes will have no ancestors, and, therefore, will be trees of one entity. Those classes that
are at the bottom of the inheritance hierarchy may have very large trees.
The way in which these tree groups may actually be displayed leaves a lot of room for
variation. There are three general areas which must be considered:
Group layout How do we wish to arrange groups of trees? How should they be ordered, and
how should they be arranged for easy navigation? Figure 7.9 on the next page shows
some 2 dimensional arrangement schemes, as an example. More complex arrangements
are possible in 3D, such as spherical arrangements.
106

Tree layout The orientation of the tree must be considered here, in which plane should it
lie? Likely possibilities include flat, parallel with the users plane of vision, vertical in
relation to the users plane of vision, or at some other angle.
Details within classes Within class representations, how shall properties and methods be
represented? There exist a number of schemes for these arrangements, some of which
have been discussed in the previous Section, 7.1.1 on page 93.
Figure 7.9: Possible arrangements of tree groups in 2D.
Using the mappings (see Section 6.3.1 on page 63), it is reasonably straightforward to try
the numerous variations presented by the above list. Some mappings already exist for these,
others may need to be added to the available mappings.
A model generated in the tree group style is shown in Figure 7.10 on the following page.
This particular figure was generated from a Java system, in which multiple inheritance is not
used. As such, each tree consists of a row of classes. Individual trees are arranged so as to
lie on the plane of the users view. Ancestor classes are shown behind their children, when
viewed from the front.
In this particular model, classes are represented by cubes. These cubes are split into two
parts, a top part, for methods, and a bottom part, for properties. The respective sizes of
the cubes that make up these representations are proportional to the number of properties
or methods in that class.
107
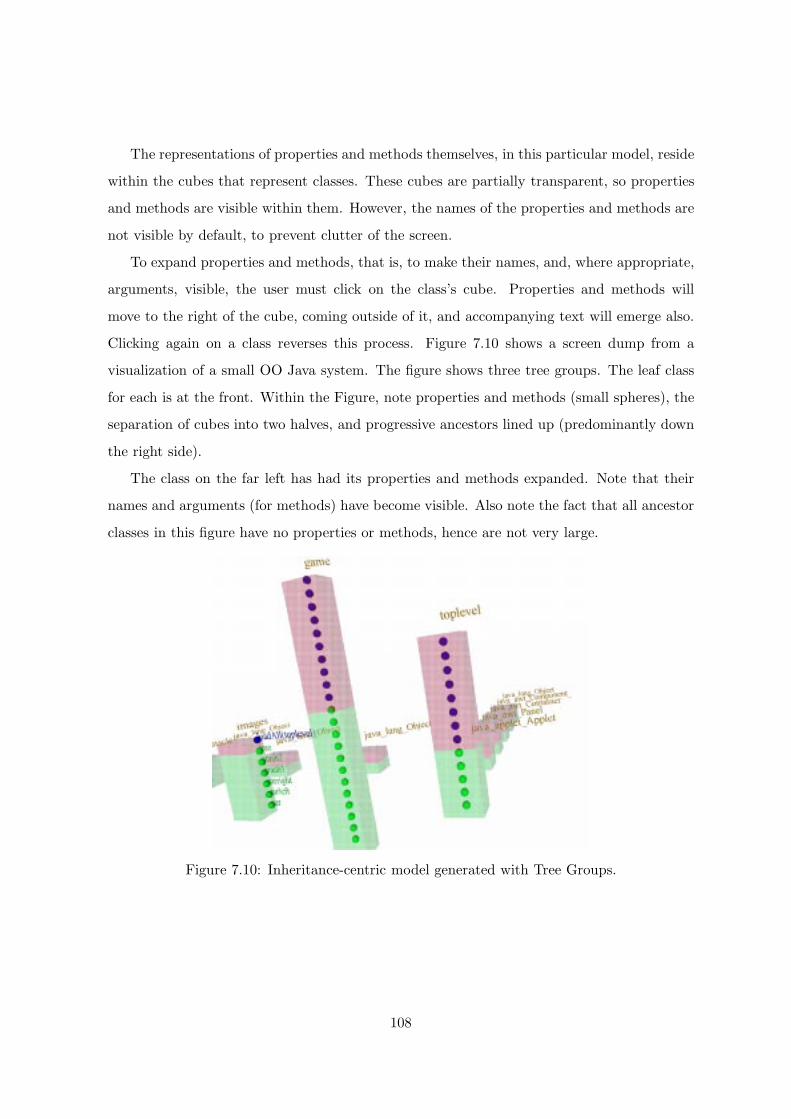
The representations of properties and methods themselves, in this particular model, reside
within the cubes that represent classes. These cubes are partially transparent, so properties
and methods are visible within them. However, the names of the properties and methods are
not visible by default, to prevent clutter of the screen.
To expand properties and methods, that is, to make their names, and, where appropriate,
arguments, visible, the user must click on the class’s cube. Properties and methods will
move to the right of the cube, coming outside of it, and accompanying text will emerge also.
Clicking again on a class reverses this process. Figure 7.10 shows a screen dump from a
visualization of a small OO Java system. The figure shows three tree groups. The leaf class
for each is at the front. Within the Figure, note properties and methods (small spheres), the
separation of cubes into two halves, and progressive ancestors lined up (predominantly down
the right side).
The class on the far left has had its properties and methods expanded. Note that their
names and arguments (for methods) have become visible. Also note the fact that all ancestor
classes in this figure have no properties or methods, hence are not very large.
Figure 7.10: Inheritance-centric model generated with Tree Groups.
108

7.1.3 Hierarchy-centric models
Motivation
This type of model gives an overview of the inheritance hierarchy within a system. The
reasons for wishing to view such a model are, as outlined in Section 5.2 on page 45:
Overall Impression To gain an overall impression of the system, and how the various classes
are related.
Important Classes The inheritance hierarchy should give some indication of which classes
are important (being commonly used). These may be classes which are at the bottom
(leaves) of the hierarchical tree. These are most likely to be instantiated, since they will,
by definition, never be subclassed. Other important classes may be those with many
children, or large branches of the inheritance tree below them. Such classes obviously
have some interface element(s) which are commonly used among their subclasses.
System Design The hierarchical model gives a quick overview of how an OO system has
been designed. Systems that do not take advantage of OO features such as inheritance
will show as trees with many classes bunched together under a root node, but no chil-
dren emanating from these classes. Conversely, systems that have gone overboard with
unnecessary subclassing will show as trees with many classes only having one child.
Such an interpretation may depend on context, however. If said system was designed
as a library from which classes could be inherited then this would be unfair criticism.
Our requirements, then, for a model are that it satisfies all the above criteria.
Why 3D is Better
3D should be especially useful when combined with this type of model. Not only is there the
benefit of having an extra dimension into which entities can be packed, but also the advantage
of being able to freely navigate about these entities. This means that in a large hierarchy,
instead of being presented with a tangle of classes, users should be able to navigate to the
particular branch of the tree that they are interested in, and peruse it independently from
the rest of the model.
109

Possible Constructions
There are two obvious ways in which a hierarchy-centric model can be organised. The first
is to have a truly three dimensional representation, in which all dimensions are utilised by
the tree structure. For example, the vertical dimension may be used to show parent-child
relationships (parents above children), and the horizontal plane may be filled with children
fanning out from a parent above.
The other option is to have a 2 dimensional tree structure, but utilise the third dimension
for some other purpose. This purpose may be, for example, to show properties and methods
of each class. These may fan out in the third (unused) dimension. The advantage of this type
of model is that the entire tree structure is visible from a single view point.
The 2 Dimensional Tree
There are two traditional ways of drawing a 2 dimensional tree, the kind that has a one-to-
many style basis, such as the OO inheritance hierarchy. This assumes Java is being used,
since other OO languages allow multiple inheritance which would produce a more convoluted
diagram. This is not to say such a many-to-many diagram would be ineffective, just that it
is not been attempted in the course of this thesis.
The two ways are:
Fanning Tree This type of tree spreads out evenly from a root node. It requires a large
degree of pre-analysis to draw, since sizes of individual branches must be determined be-
fore the whole tree can be drawn. An example of this type of tree is given in Figure 7.11
on the next page.
Indent Tree In this type of tree, sibling nodes are plotted along a straight line. At points
where any of these nodes may have children, the line breaks and moves in some direction
parallel to the original line, and the process is repeated. These trees tend to have an
unattractive, non-symmetrical look.. However, it could be argued that they are easier
to generate than fanning trees. An example of an indent tree is given in Figure 7.12 on
the following page.
Of these two sub-types of 2 dimensional model, we primarily experimented with the indent
tree type. Although it does not give as symmetric or attractive a model as a fanning tree,
110

Figure 7.11: The layout of a fanning tree.
Figure 7.12: The layout of an indent tree.
111

we persevered with it as it allows representation of class information in a third (unused)
dimension. Also, a fanning tree style of model was used for the 3D tree experiment.
The Figure given below, 7.13, comes from the visualization of a small Java system in the
hierarchy-centric indent tree style of model.
Figure 7.13: A 2D indent tree.
Classes are represented by squat cone shapes. Links directly below represent siblings.
Links to the right and below represent children. To navigate this style of model a user
can use the combination of panning and walking functions common to all VRML browsers.
Walking is the equivalent, in this case, of zooming in and out, and panning moves the focus
around various sections of the model.
In Figure 7.14 on the following page, a class is shown having been clicked on, to expand
properties and methods. These can be seen extending into the distance from our point-of-view
(perpendicular to the plane in which the hierarchy model lies). Methods are on the right,
112

Figure 7.14: A 2D indent tree expanded to show properties and methods.
small cylinders, and properties are on the left, small pyramids. All shapes and colours used
to represent classes, links between classes, properties, and methods, are able to be altered to
suit the users taste, from the mappings file, as discussed in Section 6.3.1 on page 63.
The Fully 3D Tree
The fully 3D tree can be thought of as equivalent to the 2D fanning tree, but instead of
children being organised equally around a parent in 2 dimensions, they sit around a parent
in 3 dimensions.
This arrangement has the advantage of using available 3D space very effectively. 2D trees
can easily become very wide, which is unpleasant for users, who may find themselves having
to navigate from one side to the other in large tress.
The fully 3D tree, as we have used it is, is similar to the Cone tree discussed in [33]. A
parent has its children spaced at equal angles around and symmetrically below it. These are
arranged in such a way that entities never overlap one another.
The code used to generate the fully 3D tree is shown in Appendix B.3.5 on page 149. The
class name bbox stands for Bounding Box. The bounding box is the concept around which
the computation of this model is built.
The steps in the generation of the 3D hierarchy-centric model are:
Compute bounding boxes This involves recursively traversing all classes in a system.
Those that are at the bottom of the tree (leaves) are computed first. A single class,
which all final classes are (no children), has a bounding box represented by its physical
size. Note that bounding boxes are defined as rectangular, so a perfect fit will not
113
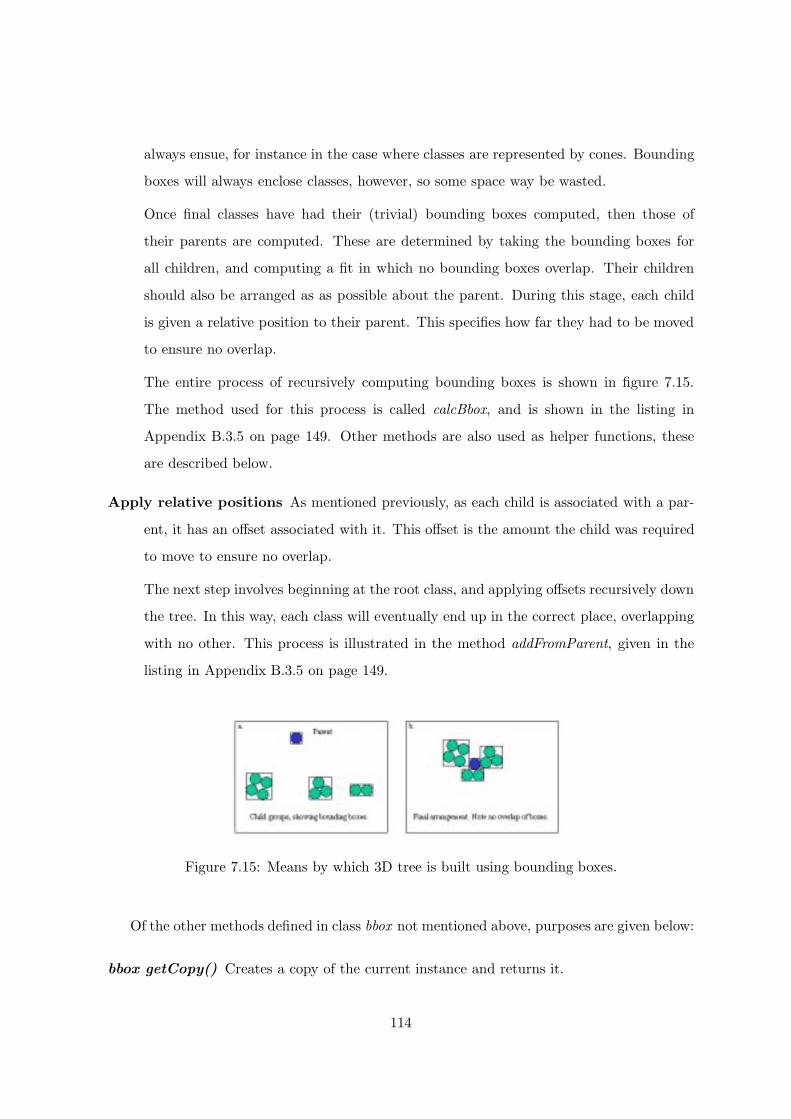
always ensue, for instance in the case where classes are represented by cones. Bounding
boxes will always enclose classes, however, so some space way be wasted.
Once final classes have had their (trivial) bounding boxes computed, then those of
their parents are computed. These are determined by taking the bounding boxes for
all children, and computing a fit in which no bounding boxes overlap. Their children
should also be arranged as as possible about the parent. During this stage, each child
is given a relative position to their parent. This specifies how far they had to be moved
to ensure no overlap.
The entire process of recursively computing bounding boxes is shown in figure 7.15.
The method used for this process is called calcBbox, and is shown in the listing in
Appendix B.3.5 on page 149. Other methods are also used as helper functions, these
are described below.
Apply relative positions As mentioned previously, as each child is associated with a par-
ent, it has an offset associated with it. This offset is the amount the child was required
to move to ensure no overlap.
The next step involves beginning at the root class, and applying offsets recursively down
the tree. In this way, each class will eventually end up in the correct place, overlapping
with no other. This process is illustrated in the method addFromParent, given in the
listing in Appendix B.3.5 on page 149.
Figure 7.15: Means by which 3D tree is built using bounding boxes.
Of the other methods defined in class bbox not mentioned above, purposes are given below:
bbox getCopy() Creates a copy of the current instance and returns it.
114

bbox combine(Vector others) Takes a collection of bboxes and computes the bounding
box that would enclose all of these.
boolean intersects(bbox other) Given two bboxes, do they intersect each other?
object findPosOnLine(bbox theBox, float angle, Vector bboxes, object curr) Given
a bbox to fit to a parent, an angle about which to fit this bbox, an existing set of child
bboxes, and an object which we are trying to fit, compute how far along the angle the
bbox must be moved until it does not intersect with the other children. Record the
offset in the returned object.
If any modification were to be made to the algorithm for 3D placement, it would be done
within the bbox class.
Examples of models generated in the 3D tree style are shown in Figures 7.17 on page 117
and 7.19 on page 119.
7.2 Modelling a real system
7.2.1 OO Brewery
An example presented in the paper The Object-Oriented Brewery: A Comparison of Two
Object-Oriented Development Methods ([37]) concerns the development of two object oriented
systems for the same purpose. The difference lies in the methods of designing the systems. The
two different approaches are a data-driven approach, and a responsibility-driven approach.
The goal, as relates to this thesis, is to compare the hierarchy diagrams given in the paper,
which are two dimensional, to those generated by our architecture, which are 3 dimensional
and navigable.
The 2D data-driven diagram is shown in Figure 7.16 on page 117. Its 3D counterpart is
shown in Figure 7.17 on page 117.
The difference in expressive powers of these two diagrams is negligible, due to, we believe,
the relatively small number of classes involved.
The 2D responsibility-driven diagram is shown in Figure 7.18 on page 118. Its 3D coun-
terpart is shown in Figure 7.19 on page 119.
115

These two diagrams are more interesting, in that the there are more classes involved.
We believe that, in this situation, the 3D model has advantages over the 2D model. These
advantages are:
Clear separation of sub-hierarchies When viewing the 3D model, sub-hierarchies are in-
stantly recognisable. In Figure 7.19 on page 119, five main groups are visible immedi-
ately. These are, from the left, the ingredient family (in the foreground), the elements
with no children (top rear), applications (foreground), portal group (large), and the
manifold group (far right). The 2D diagram does not have a layout which clearly dif-
ferentiates between sub-groups.
Ability to navigate Although it is not apparent from the figure, the 3D model offers the
opportunity to explore, zooming in to specific parts of the model, or rotating for a better
view of certain parts. This enables one to effectively view any part of a hierarchy at
a high level of detail. On a 2D diagram this would be the equivalent of being able to
zoom in.
Sub-groups are more compact The 3D diagram illustrates sub-groups in a more compact
way than its 2D counterpart. This is an advantage, due to the fact that the maximum
distance between related information is reduced, as discussed in Section 3.2 on page 19.
In the 3D figures shown, all class name labels are visible. By changing one mapping,
we could make these labels proximity sensitive, to reduce clutter, and increase frame rate.
Another potential feature which logically follows from this is the ability to have entire hierar-
chies proximity sensitive. The top level classes would be visible upon entering a world. When
nearing a class, its children would expand forth from it. This could be considered as part of
future work as an interesting sideline.
7.3 Large Case Study
For the architecture designed to satisfy its design criteria, it must be tested in a real world
situation. This involves attempting the visualization of a large OO system. It should be
possible, using some generated models, to get a good overview of the system without actually
needing to see any code.
116

Figure 7.16: 2D Data Driven Brewery Hierarchy
Figure 7.17: 3D Data Driven Brewery Hierarchy
117

Figure 7.18: 2D Responsibility Driven Brewery Hierarchy
118

Figure 7.19: 3D Responsibility Driven Brewery Hierarchy
119

The system chosen to visualize is used by a large software development company. It
consists of many classes, a large proportion of which are library “utility” classes. As part of
a PhD. research project, a researcher at the University of Canterbury, Warwick Irwin, has
generated a database based on the core OO information contained within this system. All of
the information we need to build an OODL representation of the system is contained within
the database.
It is considerably easier to write a conversion program to go from a relational database
format to OODL, than it is to go from C++ (the language the large system is written in) to
OODL, primarily due to the fact that the C++ source is split across numerous files. If such
a conversion program were to be written it would be further evidence that any OO language
can be represented by OODL. Since we can go from C++ to database to OODL, this is a
two-step conversion program for C++ to OODL. This process is illustrated in 7.20. This
two step process is conceptually equivalent to the (single) first step in Figure 6.4 on page 74,
between source and OODL.
Figure 7.20: Conversion of C++ to OODL
The system consists of 10 main libraries, a core application plus support libraries. Each
can be considered independently, or as a whole comprising the total system. The name (names
120

Figure 7.21: Package sizes in the large case study system
have been changed) and size (in classes) of each package is shown in Figure 7.21.
As can be seen, some of these packages contain thousands of classes (although, in reality
a lot of these are structs and anonymous classes). These are not “flat” packages (that is,
inheritance is used). This will be seen in visualizations of the inheritance hierarchy. The
structure of the database used to store this information is shown in Figure 7.22 on the next
page. This database contains areas for all information used in OODL plus more.
The code used to extract OODL from this database is shown in Appendix B.1 on page 140.
It is written in Visual Basic, which is reasonably good at doing iterative database tasks such
as this one, although the language is not important, only the final result in this case. There
121

Figure 7.22: Database to store OO information
is nothing complex about this code, it simply looks at each class in turn, then builds a list of
parents, properties, and methods. The section of code to extract methods has been excluded
from the Appendix, since it is essentially the same as the code to extract properties.
In generating an OODL file from the database, a few different variations can be tried,
such as only including certain packages, or only including classes at a certain depth in the
inheritance tree. There is a variable named condition in the code which can be used to select
which classes are included in the final OODL file.
Having generated an OODL file from the code, mappings need to be decided upon, de-
pending on what kind of a visualization is required. As an example, we selected only the Lib1
package, since it is of a reasonable size (886 classes, some of which will be structs, so will have
no children).
The model created from the Lib1 system is a hierarchical one. The reasons for doing this
are:
• Get an overview of which classes are most often used to inherit from.
• The degree of inheritance used in the system. That is, how many classes are extensions
of others versus stand alone classes.
• Which classes are most likely to be important in the system, based on their position in
the inheritance hierarchy. Those that are leaves of the inheritance hierarchy tree are
those most likely to be instantiated.
122

• Which classes share common parents.
The type of hierarchical model created was a 3D cone-tree type model (see Glossary). This
type of model allows an efficient use of 3D space to show the inheritance hierarchy. Users can
jump to a particular point of interest by selecting any class from a pop-up list of viewpoints.
All other information, such as properties and methods, was suppressed to allow the model to
be quickly generated. This also had the effect of increasing the frame rate since there was
less to be drawn.
The exact mappings used to generate this model are shown in the accompanying file
company.map. The OODL file used to generate the model is also supplied, its filename is
companyOODL.txt.
The model generated is shown in Figure 7.23 on the next page.
123

Figure 7.23: Cone Tree model of Lib1 package
124

Chapter 8
Future Work
8.1 Overview
Throughout the course of this thesis, the emphasis has been on providing an “open” architec-
ture that could be suitably modified to serve any visualization requirements. This has meant
a lot of scope for experiments. As such, those experiments conducted by ourselves have only
scratched the surface.
There exists, then, a potentially huge number of further experiments that could be carried
out by the user, either within the existing architecture, or by modifying the architecture. Some
suggestions for further experiments are given in Section 8.2
Future work may also entail providing a user-friendly interface to the architecture. A few
possibilities are suggested in Sections 8.3 on page 127 and 8.4 on page 130.
The other major area in which future work may be undertaken, is that of experimentation
within the existing architecture. There exists great scope here to determine the viability of
static visualization of OO systems in 3D.
8.2 Further Experiments
In Chapter 7 on page 92, experiments were undertaken in two fields. The first was to determine
useful models and layout algorithms for those models. The second type of experiment was to
take a model definition, and test it with a real system.
125

8.2.1 Model types and layouts
In Section 5 on page 44, general frameworks were suggested for models. In Chapter 7 on
page 92, some of these were actually implemented and tested. Ones that were not include the
method-centric framework, the metric-centric framework, and the single class-centric frame-
work. Also, as mentioned in that section, there is no restriction on users devising their own
types of frameworks. To incorporate a new type of framework into the existing architecture is
covered in Section 6.5 on page 73. This should not prove overly difficult, since the foundations
are already there upon which to be built.
That is the benefit of having a set of mappings. If implementing a new type of framework,
the code to draw a class has been done, the code to draw properties, methods, and links
between classes is done. The way in which all these are representable is controllable from the
mappings, thus they should integrate seamlessly with any new framework.
Layout algorithms will require more diligence to implement. Firstly, some sort of scheme
must be devised, which may prove useful as a layout for some given framework. Then an
entry must be added to the mappings, reflecting the existence of a new layout. Lastly, the
code must be written for the layout, which may (or may not) prove to be rather difficult,
depending on the complexity of the new algorithm.
8.2.2 User Trials
User trials involve taking a visualization scheme ( a model), which has some perceived value,
and applying OO systems to it to test for usefulness, as done in Section 7.3 on page 116. Such
studies may involve comparing 3D visualizations generated with our architecture against those
generated in more conventional 2D ways.
Another opportunity may exist to create visualizations with our system, and package these
together with dynamic 3D visualizations, such as those created in Three Dimensional Compu-
tation Visualization ([41]). Such a packaging may lead to very general purpose visualizations,
which could be used in a number of situations.
The most obvious case study, however, is one in which a system is visualized with our
software in various ways (perhaps using multiple frameworks), and then a potential user of
the system is given the task of learning about the system via our 3D visualizations. Only in
this way can the usefulness of our visualizations be assessed.
126

One could imagine the afore-mentioned user as a programmer who is new to a system, or a
system designer who has been away from said system for a long time and needs re-acquainting.
Other scenarios may involve a programmer who likes to visualize their progress on a system
as they build it, to retain some vision of “the big picture”, or some management personnel
not directly involved in the programming process, but require a high level view of a system.
8.3 CGI Interface
The current interface to the architecture is fully functional but could be improved in various
ways. A user is required to generate files of type OODL, and modify files containing mappings
by hand, through a command line. This involves invoking Java programs and editing text
files. A user-friendly interface has been designed but not implemented. Implementation would
be trivial (but time consuming) so has not been undertaken as of yet.
The interface that has been designed is based on a CGI (Common Gateway Interface)
form on the World Wide Web. Such forms allow users to enter data via text entry boxes,
radio buttons, check boxes, and the like. It is imagined that a user should specify some OO
file they wish to visualize. They then select from a panel of radio buttons, and text boxes,
the various mappings they would like to employ to view the model.
Upon submitting the information described above, a program is run on the server which
performs the following steps:
• Take the source file and determine its type
• Generate an OODL file based on the input file, assuming a converter is available
• Generate a mappings file based on the selections made by the user on the CGI form
• Generate a HTML file to accompany the VRML model, if a converter exists for the type
of source specified
• Take all above files and generate a VRML file
• Return an HTML page which will encapsulate the VRML world, and may have a frame
for accompanying text.
127

An example of a possible CGI interface is given in Figure 8.1. The possible output upon
submitting such a form is shown in Figure 8.2 on the next page. Java Servlets would be a good
way to do this, as they have numerous advantages over standard CGI. They are persistent,
and are written in Java, meaning easy integration of the existing architecture.
Such an interface would be beneficial especially as a test bed for various visualizations.
Also it has the advantage of removing computation from the local machine. All computation
is done on the server. This would allow visualizations to be undertaken from such platforms
as, at the extreme, a web TV machine.
Using Java, all steps outlined in the process above could be achieved. This would have
the advantage over other languages of allowing the CGI processing software to be included in
the same package as all the existing software.
Figure 8.1: A Possible CGI Interface to the System
128

Figure 8.2: Possible Result of a CGI System
129

8.3.1 Fisheye Views
Fisheye views have created much interest lately [36]. They involve some graphical represen-
tation which is distorted to provide detail about some specific area of the graph. In doing so,
the surrounding area is still visible, but not in such detail. This gives a user a sense of their
surroundings, and at the same time they can focus on some detail.
This concept may be applied to our architecture. The most logical way of doing so may
be to create a type of framework which is specifically a Fisheye visualization. Within this
framework may be many varied types of models.
For instance, one can imagine a hierarchical model, in which the whole tree is visible,
but by clicking on a certain class, it expands relative to its surroundings, and detail becomes
obvious.
An advantage of implementing Fisheye views with VRML is that it has built in features
which allow the alteration of local perspective, whereas in 2D graphical transformations have
a large (slow) computation overhead.
8.4 Architecture refinements
In its present incarnation, the architecture consists of programs which must be edited to
change their behaviour, and files which provide input (OODL) and instruction (mappings)
to the architecture. The programs which are run to generate a model, or generate an OODL
file, are hard-wired with filenames.
A sensible refinement would be to allow the use of command line arguments to executables.
This would not be overly difficult. Along similar lines, usage messages could be generated if
inappropriate arguments were used.
To take the refinement process one step further, a graphical interface could be designed.
An example of one such interface was given in Section 8.3 on page 127. However, an interface
need not be web based. Interfaces may be written in any graphical language, Java, Visual
Basic, and Tcl/Tk being likely options.
130

8.4.1 Version control of architecture
As mentioned previously, the architecture needs some means of being able to incorporate
modifications from multiple sources. This may entail producing an even more modular style of
architecture, where each module can be replaced by a similar type. In this way, an architecture
could be built from multiple sources, providing no two modules of the same type had both
been modified.
Another possibility would be to have the entire architecture redesigned around an inter-
preted script style of operation. In the present architecture, a Java program is used to convert
an OODL file into a VRML representation, via a mappings file. This Java program provides
a weak link in that if it is altered by two users separately, the changes are unlikely to be
reconcilable into a single file.
If the task of the Java program which generates VRML were moved to a script, then this
problem would be relieved to a degree. This script would serve the purpose of a more complex
mappings file, this time taking two inputs, an OODL file and a conventional mappings file,
and turning these into a VRML output.
For example, our script may dictate that if we have a class with 4 properties (from an
OODL file), and a mapping of number of properties to class height, then the script actually
produces the VRML output, putting in the appropriate numbers.
Such a scripting language would of course need a program to control it, but it would be
less likely that such a “script interpreter” would need alteration than the script from which
it reads.
A conceptual model of the script based architecture is given in Figure 8.3 on the next
page. The existing style is shown in Figure 8.4 on the following page. Note the relative
sizes of the Java program representations in each. These represent the programs’ size and
complexity in each case.
131

Figure 8.3: Architecture uses a script to generate VRML.
Figure 8.4: Architecture uses a Java program to generate VRML.
132

Chapter 9
Conclusions
9.1 Goals Revisited
The goals of this research have been:
• To design an extensible architecture which can be used to build 3D visualizations of OO
systems
• To explore potential model layouts
• To examine visualizations as to effectiveness
The philosophy used in achieving these goals has been one of a functional approach, not
necessarily the most elegant. End user control has been a driving factor throughout the
development of the architecture, as has the concept of a Virtual World, as opposed to a
straight 3D model.
The first goal, to design and build an architecture, has been unequivocally achieved. The
programs comprising this architecture can be found on the accompanying CD ROM, and a
full description can be found in Chapter 6 on page 53. Part of the success of the architecture
stems from the use of mappings (Section 6.3.1 on page 63), and a language to represent OO
systems generically (Section 6.2 on page 53).
A pipeline style of architecture was used, allowing modules to be altered independently, or
“slotted in”. The pipeline is not a linear sequence of modules, but may use different modules
each time invoked by a user depending on preferences. In this way the user should be able to
133

maximise time spent designing and viewing Virtual Worlds, and a minimum amount of time
designing and implementing tools which will allow the generation of suitable worlds.
The exploration of various layout algorithms was explored in Chapter 7 on page 92. This
covered several layout algorithms that may be considered generic. Also explored in this
section were the use of various frameworks as a way of generalising a model type. This was
first discussed in Section 5 on page 44, and was expanded upon in Chapter 7 on page 92.
Finally, some real world systems were visualized using our architecture, and their effec-
tiveness discussed. These accounts were given in Sections 7.2 on page 115 and 7.3 on page 116.
Lastly, future areas of research which may build on ours are suggested in Section 8 on
page 125. Extensions to the architecture were discussed. An interface to the architecture
through a web browser was given as a logical extension. Also a means of using interpreted
scripts to build models was suggested. In the experimentation area, suggestions were given
for the types of models to build next, and the types of systems which may be visualized.
134
Bibliography
[1] Ames, Nadeau, and Moreland. VRML 2.0 Sourcebook. Wiley, 2nd edition, 1997.
[2] Wendy Boggs and Michael Boggs. Mastering UML with Rational Rose. Sybex, 1999.
[3] S.K. Card, J.D. Mackinlay, and B. Shneiderman, editors. Readings in Information Vi-
sualisation: Using Vision to Think. Morgan Kaufman, 1999.
[4] R. Carey and G. Bell. The Annotated VRML 2.0 Reference manual. Addison-Wesley,
1997.
[5] Rikk Carey, Gavin Bell, and Chris Marrin. The Virtual Reality Modeling Language. The
VRML Consortium Inc., 1997.
[6] George S Carson, Fichard F Puk, and Rikki Carey. Developing the VRML 97 interna-
tional standard. IEEE Computer Graphics and Applications, 19(1):52–59, March-April
1999.
[7] Neville Churcher, Lachlan Keown, and Warwick Irwin. Virtual worlds for software visu-
alization. In SoftVis 99, pages 9–16, Sydney, December 1999.
[8] R.A. Earnshaw, M.A. Gigante, and H. Jones, editors. Virtual Reality Systems. Academic
Press, 1993.
[9] K.M. Fairchild, L. Serra, N. Hern, L.B. Hai, and A.T. Leong. Dynamic fisheye informa-
tion visualisations. In Earnshaw et al. [8], pages 162–177.
[10] N.E. Fenton and Shari Lawrence Pfleeger. Software Metrics: A Rigorous & Practical
Approach. Thompson Press, 2nd edition, 1997.
[11] Ian S Graham. HTML Sourcebook. Wiley, 3rd edition, 1997.
135

[12] F. Hamit. Virtual Reality and the Exploration of Cyberspace. SAMS Publishing, 1993.
[13] R H Hardin, N J A Sloane, and W D Smith. Spherical Codes. AT&T, In Preparation.
[14] J. Hartman and J. Wernecke. The VRML 2.0 Handbook: Building Moving Worlds on
the Web. Addison Wesley, 1996.
[15] P Haynes, T J Menzies, and R F Cohen. Visualisations of large object oriented systems.
Technical report, Monash University, 1996.
[16] B. Henderson-Sellers. Object-Oriented Metrics: Measures of Complexity. Prentice Hall,
1996.
[17] IEEE. A framework for abstract 3D visualization, Proceedings of the 1993 IEEE Sym-
posium on Visual Languages, Norway, August 1993.
[18] C.L. Jeffery. Program Monitoring and Visualisation: An Exploratory Approach. Springer
Verlag, 1999.
[19] Dean F Jerding and John T Stasko. Using visualization to foster object-oriented program
understanding. Technical Report 33, Georgia Institute of Technology, July 1994.
[20] P.R. Keller and M.M. Keller. Visual Cues: Practical Data Visualisation. IEEE Press,
1993.
[21] Hideki Koike. An Application of Three-Dimensional Visualization to Software Engineer-
ing. PhD thesis, University of Tokyo, 1991.
[22] Hideki Koike. An application of three-dimensional visualization to object-oriented pro-
gramming. In T Catarci, M F Costabile, and S Levialdi, editors, World Scientific, pages
180–192. Singapore, 1992.
[23] Hideki Koike. Three-dimensional software visualization: A framework and its applica-
tions. In T L Kunii, editor, Visual Computing (Proc. of CG International ’92, pages
151–170, 1992.
[24] Hideki Koike. An application of fractal theory to information diplay. Fractals: An
interdisciplinary Journal on the Complex Geometry of Nature, 1(3):663–670, 1993.
136

[25] Hideki Koike. The role of another spatial dimension in software visualization. ACM
Transactions on Information Systems, 11(3):266–286, July 1993.
[26] Kideki Koike and Kirotaka Yoshihara. Fractal approaches for visualizing huge hierarchies.
In Proceedings of the 1993 IEEE Symposium on Visual Languages, volume 93, pages 55–
60, 1993.
[27] Danny B Lange and Yuichi Nakamura. Object-oriented program tracing and visualiza-
tion. Computer, 30(5):63, May 1997.
[28] R. Lea, K. Matsuda, and K. Miyashita. Java for 3D and VRML Worlds. New Riders
Publishing, 1996.
[29] Bertrand Meyer. Object-Oriented Software Construction. Prentice Hall, 1988.
[30] R. Paton and I. Neilson, editors. Visual Representations and Interpretations. Springer
Verlag, 1999.
[31] Blaine A Price, Ronald M Baecker, and Ian S Small. A principled taxonomy of software
visualization. Jornal of Visual Languages and Computing, 4(3):211–266, September 1993.
[32] H. Rheingold. Virtual Reality. Summit Books, 1991.
[33] G G Robertson, J D Mackinley, and S K Card. Cone trees: Animated 3d visualizations
of hierarchical information. In Proc. ACMSIGCHI ’91 Conf. on Human Factors in
Computing Systems, pages 189–194, New Orleans, Louisiana, April 1991.
[34] B. Roehl, J. Couch, C. Reed-Ballreich, T. Rohaly, and G. Brown. Late Night VRML 2.0
with Java. Ziff-Davis Press, 1997.
[35] G Ruia-Catalin Roman and Kenneth C Cox. Program visualization: The art of mapping
programs to pictures. In Proceedings of the 14th International Conference on Softeware
Engineering, May 1992.
[36] M Sarkar and M H Brown. Graphical fisheye views. Communications of the ACM,
37(12):73–84, December 1994.
137

[37] Robert C Sharble and Samuel S Cohen. The object oriented brewery: A comparison of
two object-oriented development methods. Technical report, Boeing Computer Services,
1994.
[38] N J A Sloane. The sphere packing problem. In Documenta Mathematica III(Proceedings
International Congress Math), pages 387–396, 1998.
[39] A Sowizral and Michael F Deering. The Java 3D API and virtrual reality. IEEE Computer
Graphics and Applications, 19(3):12–16, May-June 1999.
[40] Mathew L Staples and James M Bieman. 3-d visualization of software structure. Advances
in Computers, 49, 1999.
[41] John T Stasko. Three-dimensional computation visualization. Technical Report 20,
Georgia Institute of Technology, September 1992.
[42] J.R. Vacca. VRML Clearly Explained. AP Professional, 2nd edition, 1998.
[43] J. Vince. Virtual Reality Systems. Addison-Wesley, 1995.
[44] J. Vince. Virtual Reality Worlds. Addison-Wesley, 1995.
[45] A. Wexelblat, editor. Virtual Reality: Applications and Explorations. Academic Press,
1993.
[46] B. Woolley. Virtual Worlds. Blackwell, 1992.
138

Appendix A
Glossary
Class A class definition in an OO language.
Entity As relates to this thesis, a three dimensional object. For example, the representation
of a class as a green cone in 3D is an entity.
Framework A general type of model. Driven by a high level user requirement, such as a
need to see the inheritance hierarchy for a system.
Mapping As defined within the thesis, a transformation between some attribute of an OO
system, and a representation of that attribute in a Virtual World.
Method A function encapsulated by a class in an OO language.
Model A specific visualization in 3D of some system.
Node A VRML entity, can be tangible objects such as shapes, or intangible such as a prox-
imity sensor.
Object Synonymous with Class. May mean an instance in some contexts.
OODL Object Oriented Definition Language, defined within this thesis to give a generic
language to describe OO systems at a high level.
Property A variable encapsulated by a class in an OO language.
Route A VRML term to describe a linking between two nodes.
VRML Virtual Reality Modelling Language. Used to define Virtual Worlds.
139

Appendix B
Program Excerpts
B.1 Conversion of OO Database
Sub ExtractClassestoXXXX()
Dim dbs As Database
Dim rst As Recordset
Dim baseclass, properties, propertyType As Recordset
Dim classname As String
Dim package As String
Dim fs As Object
Dim a As Object
Dim cnt As Integer
Dim parentlist As String 10
Dim vartype As String
Dim condition As Boolean
’ OPEN FILE. . .
’Open “c:\thesis\src\walXXXX.txt” For Output As #1
Set fs = CreateObject("Scripting.FileSystemObject")
Set a = fs.CreateTextFile("c:\thesis\src\walXXXX.txt", True)
’ OPEN DATABASE. . .
Set dbs = CurrentDb
Set rst = dbs.OpenRecordset("class")
Set baseclass = dbs.OpenRecordset("baseclass") 20
Set properties = dbs.OpenRecordset("variable")
Set propertyType = dbs.OpenRecordset("variabletype")
baseclass.Index = "subclassname"
140

properties.Index = "classname"
propertyType.Index = "variablename"
rst.MoveFirst
cnt = 0
While Not rst.EOF
classname = rst("uniquename")
package = rst("library") 30
condition = (Not classname Like "__unnamed*") And rst("library") = "WinNav" And rst("typespecifier") = 8192
’SELECT ONLY CLASSES FROM THE PACKAGE, AND EXCLUDE STRUCTS AND UNNAMED
’CLASSES. . .
If condition Then
’BUILD PARENTLIST
baseclass.Seek "=", classname
If Not baseclass.NoMatch Then
Dim first As Boolean
first = True
parentlist = "{" 40
Do While baseclass("subclassname") = classname
If baseclass("subclasslibrary") = package Then
If first Then
parentlist = parentlist + baseclass("superclassname")
first = False
Else
parentlist = parentlist + ", " + baseclass("superclassname")
End If
End If
baseclass.MoveNext 50
If baseclass.EOF Then
Exit Do
End If
Loop
parentlist = parentlist + "}"
Else
parentlist = "{}"
End If
’ ONLY INCLUDE CLASSES WITH CHILDREN. . .
’If Not parentlist = “{}” Or rst(“depthintree”) > 0 Then 60
If True Then
141

cnt = cnt + 1
a.writeline ("<Class>")
a.writeline ("FULL NAME=" + classname)
a.writeline ("NAME=" + classname)
a.writeline ("PACKAGE=" + package)
a.writeline ("PARENTLIST=" + parentlist)
’GET PROPERTIES. . .
a.writeline ("<PropertyList>")
properties.Seek "=", classname 70
If Not properties.NoMatch Then
Do While properties("classname") = classname
If properties("classlibrary") = package Then
a.writeline ("NAME=" + properties("name"))
a.writeline ("PROTECTION=" + access(properties("access")))
a.writeline ("BINIDNG=" + binding(properties("storageclass")))
’ Check if type is another class. . .
propertyType.Seek "=", properties("name")
vartype = properties("type")
If Not propertyType.NoMatch Then 80
Do While properties("name") = propertyType("variablename")
If propertyType.EOF Then
Exit Do
End If
If propertyType("variableclassname") = classname And
propertyType("variableclasslibrary")
= package Then
vartype = propertyType("classname")
Exit Do
End If 90
propertyType.MoveNext
Loop
End If
a.writeline ("TYPE=" + vartype)
End If
properties.MoveNext
If properties.EOF Then
Exit Do
End If
142

Loop 100
End If
a.writeline ("<\PropertyList>")
a.writeline ("<\Class>")
a.writeline ("")
End If
End If
rst.MoveNext
Wend
a.Close
MsgBox ("Did " + Str(cnt) + " classes") 110
End Sub
Function access(num) As String
If num = 1 Then
access = "public"
End If
If num = 2 Then
access = "protected"
End If
If num = 4 Then
access = "private" 120
End If
End Function
Function binding(num) As String
If num = 4 Then
binding = "static"
Else
binding = "dynamic"
End If
End Function
B.2 Code to link objects
// Take allObjs and make sense. . .
for (int c = 0;c < allObjs.size();c++) {object curr = ((object) allObjs.elementAt(c));
String parent = (String) curr.parentList.elementAt(0);
143

//System.out.println(“Class ” + curr.getName() + “ has parent ” + parent);
if (parent.startsWith("Root") | | parent.trim().equals("")) {curr.setParent(root);
root.addChild(curr);
System.out.println("ADDED A CHILD TO ROOT!!!!!!!!!!!");
} else { 10
object parentObj = root;
for (int x = 0; x < allObjs.size();x++) {if (((object) allObjs.elementAt(x)).getName().equals(parent)) {
parentObj = (object) allObjs.elementAt(x);
}}if (parentObj != null) {
//System.out.println(“Setting the parent of ” + curr.getName() + “ to ” + parentObj.getName());
curr.setParent(parentObj);
parentObj.addChild(curr); 20
} else {System.out.println("Couldn't find a parent for this class " + curr.getName());
}}// Try and link into properties, if building propertycentric (CHANGE THIS LATER!!!!). . .
if (mappings.get("type").equals("property")) {for (int z = 0; z < curr.properties.size();z++) {
String currProp = ((property) curr.properties.elementAt(z)).type;
for (int x = 0; x < allObjs.size();x++) {if (((object) allObjs.elementAt(x)).getName().equals(currProp)) { 30
((property) curr.properties.elementAt(z)).obj = (object) allObjs.elementAt(x);
System.out.println("Set a property in " + curr.getName() + ", "
+ ((object) allObjs.elementAt(x)).getName() + " to type " + currProp);
}}
}for (int z = 0; z < curr.methods.size();z++) {
for (int lk = 0; lk < ((method) curr.methods.elementAt(z)).arglist.size(); lk ++) {String currArg = ((argument) ((method) curr.methods.elementAt(z)).arglist.elementAt(lk)).type;
for (int x = 0; x < allObjs.size();x++) { 40
if (((object) allObjs.elementAt(x)).getName().equals(currArg)) {((argument) ((method) curr.methods.elementAt(z)).arglist.elementAt(lk)).obj
144

= (object) allObjs.elementAt(x);
//System.out.println(“Set a method to type ” + currArg);
}}
}}}
} 50
B.3 Mappings
B.3.1 getMappings Method
public static void getMappings() throws java.io.IOException{// Open file inFile, etc. . .
File f = new File(inFile);
if (f.exists()) {System.out.println("hooray it exists!" + f.getPath());
FileInputStream in = null;
try {in = new FileInputStream(f);
} catch (FileNotFoundException fe) {System.out.println("Bummer dude"); 10
}DataInputStream din = new DataInputStream(in);
String str = din.readLine();
while (str != null) {String finalStr = "";
if (str.startsWith("/")) {finalStr = str.substring(1);
}str = din.readLine();
if ( str != null) { 20
while (!str.startsWith("/") && !str.startsWith("*")) {finalStr += "\n" + str;
str = din.readLine();
if (str == null) {break;
145

}}
}if (!finalStr.startsWith("*")) {
addMapping(finalStr); 30
}}
}}
B.3.2 get Method
public static String get(String toGet) {String retval = null;
boolean found = false;
for (int i = 0; i < mappings.size();i ++ ) {String curr = ((String) mappings.elementAt(i));
if (curr.startsWith(toGet)) {int pos = curr.indexOf('=');
if (pos > 0) {retval = curr.substring(pos + 1);
found = true; 10
break;
}}
}if (!found) {
System.out.println("Couldn't find a mapping for: " + toGet);
Thread.dumpStack();
System.exit(0);
}return retval.trim(); 20
}
B.3.3 More Complex get Methods
public static String get(String toGet, String var1) {
146

String str = get(toGet);
return insertVar(str, var1);
}public static String get(String toGet, String var1, String var2) {
String str = get(toGet, var1);
str = insertVar(str, var2);
return str;
}public static String get(String toGet, String var1, String var2, String var3) { 10
String str = get(toGet, var1);
str = insertVar(str, var2);
str = insertVar(str, var3);
return str;
}public static String get(String toGet, String var1, String var2, String var3, String var4) {
String str = get(toGet, var1);
str = insertVar(str, var2);
str = insertVar(str, var3);
str = insertVar(str, var4); 20
return str;
}public static String get(String toGet, double var1) {
String str = get(toGet);
return insertVar(str, var1);
}public static String get(String toGet, double var1, double var2) {
String str = get(toGet, var1);
str = insertVar(str, var2);
return str; 30
}public static String get(String toGet, double var1, double var2, double var3) {
String str = get(toGet, var1);
str = insertVar(str, var2);
str = insertVar(str, var3);
return str;
}public static String get(String toGet, double var1, double var2, double var3, double var4) {
String str = get(toGet, var1);
147
str = insertVar(str, var2); 40
str = insertVar(str, var3);
str = insertVar(str, var4);
return str;
}public static String get(String toGet, double var1, double var2, double var3, double var4
, double var5) {String str = get(toGet, var1);
str = insertVar(str, var2);
str = insertVar(str, var3);
str = insertVar(str, var4); 50
str = insertVar(str, var5);
return str;
}public static String get(String toGet, double var1, double var2, double var3, double var4
, double var5, double var6) {String str = get(toGet, var1);
str = insertVar(str, var2);
str = insertVar(str, var3);
str = insertVar(str, var4);
str = insertVar(str, var5); 60
str = insertVar(str, var6);
return str;
}
B.3.4 insertVar Methods
private static String insertVar(String str, double var) {String retval = str;
int pos1 = str.indexOf("$+");
int pos2 = str.indexOf("$*");
if (pos1 >=0 | | pos2 >= 0) {if (pos1 < 0) pos1 = 10000;
if (pos2 < 0) pos2 = 10000;
if (pos1 < pos2) {// HANDLE $+. . .
pos2 = str.indexOf("+$"); 10
String snum = str.substring(pos1 + 2, pos2);
148

double num = (new Double(snum)).doubleValue();
num = num + var;
retval = str.substring(0, pos1);
retval += num;
retval += str.substring(pos2 + 2);
} else {// HANDLE $∗. . .
pos1 = str.indexOf("*$");
String snum = str.substring(pos2 + 2, pos1); 20
double num = (new Double(snum)).doubleValue();
num = num ∗ var;
retval = str.substring(0, pos2);
retval += num;
retval += str.substring(pos1 + 2);
}}return retval;
}private static String insertVar(String str, String var) { 30
String retval = str;
int pos = str.indexOf("$$");
if (pos >= 0) {retval = str.substring(0, pos) + var;
retval += str.substring(pos + 2);
}return retval;
}
B.3.5 Class to generate 3D inheritance hierarchy
import java.util.∗;public class bbox {
public float xmin = 0;
public float xmax = 0;
public float zmin = 0;
public float zmax = 0;
public float size = 0;
private static float baseDistance = 4;
149
private bbox getCopy() {bbox retval = new bbox(); 10
retval.xmin = xmin;
retval.xmax = xmax;
retval.zmin = zmin;
retval.zmax = zmax;
retval.size = size;
return retval;
}private static bbox combine(Vector others) {
bbox retval = new bbox();
if (others.size() > 0) { 20
bbox first = (bbox) others.elementAt(0);
retval.xmin = first.xmin;
retval.xmax = first.xmax;
retval.zmin = first.zmin;
retval.zmax = first.zmax;
for (int c = 1; c < others.size();c++) {bbox curr = (bbox) others.elementAt(c);
if (curr.xmin < retval.xmin) {retval.xmin = curr.xmin;
} 30
if (curr.xmax > retval.xmax) {retval.xmax = curr.xmax;
}if (curr.zmin < retval.zmin) {
retval.zmin = curr.zmin;
}if (curr.zmax > retval.zmax) {
retval.zmax = curr.zmax;
}} 40
}return retval;
}private boolean intersects(bbox other) {
boolean vert = false;
boolean horiz = false;
150

if (xmin <= other.xmax && xmin >= other.xmin) {horiz = true;
}if (xmax <= other.xmax && xmax >= other.xmin) { 50
horiz = true;
}if (other.xmin <= xmax && other.xmin >= xmin) {
horiz = true;
}if (other.xmax <= xmax && other.xmax >= xmin) {
horiz = true;
}if (zmin <= other.zmax && zmin >= other.zmin) {
vert = true; 60
}if (zmax <= other.zmax && zmax >= other.zmin) {
vert = true;
}if (other.zmin <= zmax && other.zmin >= zmin) {
vert = true;
}if (other.zmax <= zmax && other.zmax >= zmin) {
vert = true;
} 70
if (vert && horiz) {return true;
} else {return false;
}}private static object findPosOnLine(bbox theBox, float angle, Vector bboxes, object curr) {
float x = (float) Math.cos(angle);
float z = (float) Math.sin(angle);
float distance = baseDistance; 80
bbox tempBox = theBox.getCopy();
boolean clash = true;
while (clash) {System.out.println("Moving " + curr.getName() + " box out. . .");
151

clash = false;
for (int c = 0;c < bboxes.size();c++) {if (tempBox.intersects((bbox) bboxes.elementAt(c))) {
clash = true;
break;
} 90
}if (tempBox.intersects(new bbox())) {
clash = true;
}distance += 1;
x = (float) Math.cos(angle) ∗ distance;
z = (float) Math.sin(angle) ∗ distance;
System.out.println("Moving out a distance of (X) " + x + " (Z) " + z);
// Calculate new tempBox. . .
tempBox.xmin = theBox.xmin + x; 100
tempBox.xmax = theBox.xmax + x;
tempBox.zmin = theBox.zmin + z;
tempBox.zmax = theBox.zmax + z;
}object retval = new object();
retval.x3d = x;
retval.z3d = z;
// Move the Bbox along by x and z. . .
theBox.xmin += x;
theBox.xmax += x; 110
theBox.zmin += z;
theBox.zmax += z;
System.out.println("Final bbox of " + curr.getName() + " is " + theBox);
return retval;
}private static bbox calcBbox(object curr, float y) {
curr.x3d = 0;
curr.y3d = 0;
curr.z3d = 0;
// CREATE A RANDOM START POSITION. . . 120
float startAngle = (float) (Math.random() ∗ 2 ∗ Math.PI);
float angle = (float) (2 ∗ Math.PI) / curr.getChildren().size();
152

Vector allBoxes = new Vector();
System.out.println("Ascertaining bbox for " + curr.getName());
for (int c = 0;c < curr.getChildren().size();c++) {object thisChild = (object) curr.getChildren().elementAt(c);
System.out.println("Examining child: " + thisChild.getName());
bbox thisBox = new bbox();
float thisAngle = startAngle + (c ∗ angle);
float x = 0; 130
float z = 0;
if (thisChild.getChildren().size() > 0) {// SOME CHILDREN, so calculate bbox. . .
thisBox = calcBbox(thisChild, y − 3);
if (curr.getChildren().size() == 1) {// PUT DIRECTLY BELOW. . .
x = 0;
z = 0;
} else {object temp = findPosOnLine(thisBox, thisAngle, allBoxes, thisChild); 140
x = temp.x3d;
z = temp.z3d;
}} else {
if (curr.getChildren().size() == 1) {// PUT DIRECTLY BELOW. . .
// ONLY CHILD WITH NO CHILDREN
x = 0;
z = 0;
} else { 150
// NO CHILDREN, but MEMBER OF A FAMILY SO PLOT(FIND OUT HOW AWAY FIRST). . .
object temp = findPosOnLine(thisBox, thisAngle, allBoxes, thisChild);
x = temp.x3d;
z = temp.z3d;
//x = (float) Math.cos(thisAngle) ∗ baseDistance;
//z = (float) Math.sin(thisAngle) ∗ baseDistance;
}thisBox.xmin = x;
thisBox.xmax = x;
thisBox.zmin = z; 160
153

thisBox.zmax = z;
}thisChild.x3d = x;
thisChild.z3d = z;
thisChild.y3d = y − 3;
System.out.println("Set y to :" + thisChild.y3d);
allBoxes.addElement(thisBox);
}System.out.println("Done.");
bbox retval = combine(allBoxes); 170
System.out.println("The final bounding box for " + curr.getName() + " was " + retval);
return retval;
}private static void addFromParent(float x, float z, object curr) {
curr.x3d += x;
curr.z3d += z;
System.out.println("Final values for object " + curr.getName() + " were:");
System.out.println("x = " + curr.x3d + ", y = " + curr.y3d + ", z = " + curr.z3d);
for (int c = 0;c < curr.getChildren().size();c++) {object thisChild = (object) curr.getChildren().elementAt(c); 180
addFromParent(curr.x3d, curr.z3d, thisChild);
}}public static void buildModel(object root) {
bbox throwAway = calcBbox(root, 0);
// NOW GO DOWN THE TREE ADDING CHILDREN’S OFFSETS FROM PARENTS. . .
addFromParent(0, 0, root);
}public String toString() {
String retval = ""; 190
retval += "xmin = " + xmin + ", xmax = " + xmax;
retval += "\nzmin = " + zmin + ", zmax = " + zmax;
return retval;
}}
154

B.4 Functions associated with hyperbolic tangent conversions
public static double tanh(double arg) {// Returns between 0 and 1. . .
// When arg is 0.55 output is 0.5, so Normalize inputs to make the average input 0.55. . .
double retval = 0;
retval = Math.pow(Math.E, arg) − Math.pow(Math.E, arg ∗ −1.0);
retval = retval / (Math.pow(Math.E, arg) + Math.pow(Math.E, arg ∗ −1.0));
return retval;
}public static double tanh(double arg, double avg, double range) {
// Convert arg to 0.55 if average. . . 10
double retval = arg ∗ (0.55 / avg);
retval = tanh(retval) ∗ range;
return retval;
}
155