LACE Data Assimilation Working Days 14-16 June 2011, Budapest HARMONIE DA suite at KNMI
34
LACE Data Assimilation Working Days 14-16 June 2011, Budapest HARMONIE DA suite at KNMI Jan Barkmeijer With contributions from: Cisco de Bruijn, Siebren de Haan, Gert-Jan Marseille, Emiel van
description
LACE Data Assimilation Working Days 14-16 June 2011, Budapest HARMONIE DA suite at KNMI Jan Barkmeijer With contributions from: Cisco de Bruijn, Siebren de Haan, Gert-Jan Marseille, Emiel van der Plas, and Wim de Rooy. Content. Description KNMI DA suite Monitoring tools - PowerPoint PPT Presentation
Transcript of LACE Data Assimilation Working Days 14-16 June 2011, Budapest HARMONIE DA suite at KNMI
LACE Data AssimilationWorking Days
14-16 June 2011, Budapest
HARMONIE DA suiteat KNMI
Jan Barkmeijer
With contributions from: Cisco de Bruijn, Siebren de Haan, Gert-Jan Marseille, Emiel van der Plas, and Wim de Rooy.
Content
- Description KNMI DA suite
- Monitoring tools
- Problems encountered
- Future developments
3
The KNMI Data assimilation suite
• Initial run at 15 November 2010, but many changes (experimental status) since then.
• Runs at ECMWF, using hourly boundaries and observation set from a H7.2 Hirlam suite at KNMI (ectrans is used to tranfer data vice-versa)
• Cycling time is 6h and a 24h forecast is produced at 00 and 12 UTC.
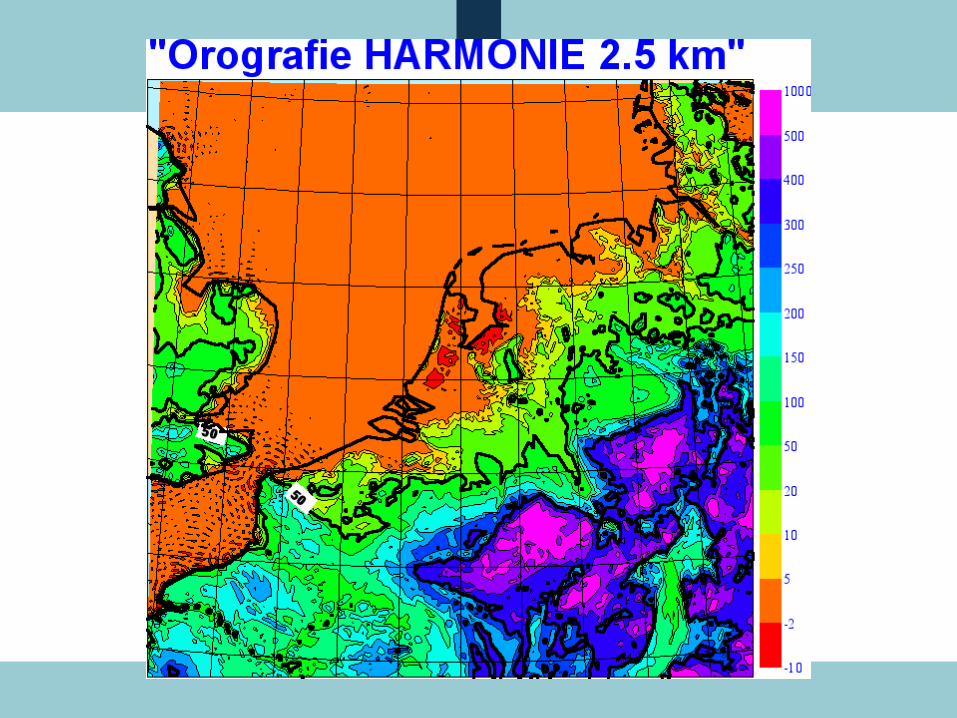
• Integration area (300x300 gp at 2.5km grid resolution) covers the Netherlands and vertical resolution is 60 levels (Meteo-France definition). Lowest model level around 9m
• Harmonie model cycle H36h1.2 with some modifications
• Data is processed e.g. at DMI/KNMI for monitoring purposes.

Area definition
200x200
300x300
400x400
500x500

LBC data from
Hirlam forecast
for both runs
300x300 400x400
RADAR
Computation of background error statistics
- Used the recipe as described on the Hirlam wiki page for Harmonie Data-assimilation
- Central here is the creation of a series of downscaled Harmonie 6h forecasts for 20060920-20061031 at 00 UTC, using 4 members of the ECMWF EPS
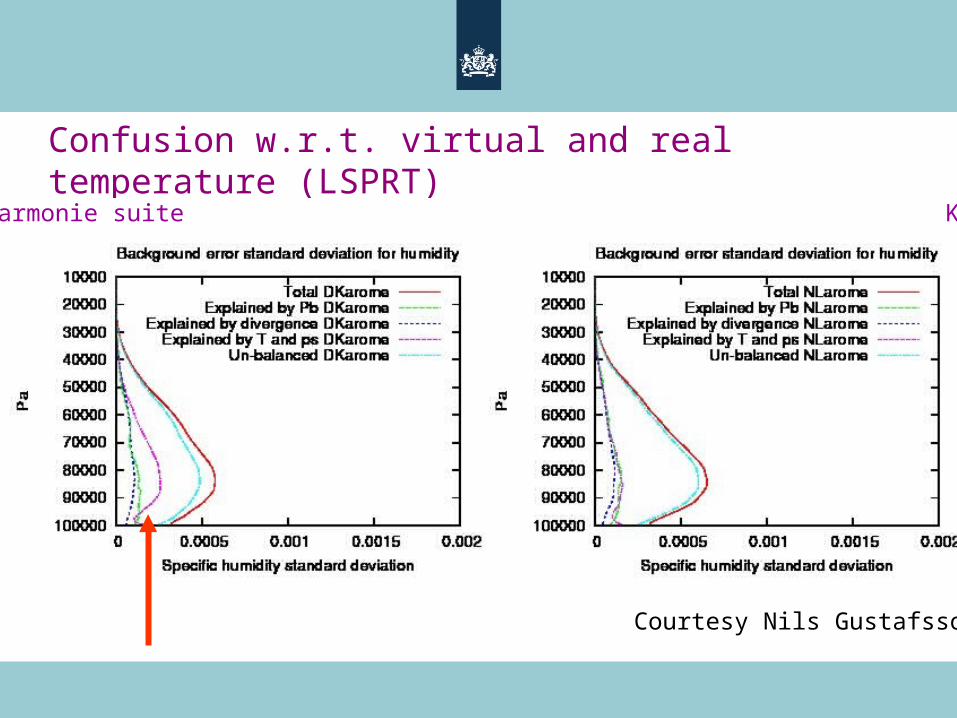
Confusion w.r.t. virtual and real temperature (LSPRT)
DMI Harmonie suite KNMI old
Courtesy Nils Gustafsson

After correction
DMI KNMI new
Content
- Description KNMI DA suite
- Monitoring tools
- Problems encountered
- Future developments

What datasets are being used?
SYNOP U,V Z T
AIREP U,V T
RADIOSONDE U,V Z T Q
Mode-S U,V T

What data sets are being used (2)?
Mode-S drops out

o-a/o-b statistics for April
negative bias


The Danmark Monotoring Facility


Monitoring with KNMI Parametrization Testbed (KPT)
1D column at Cabauw from 3D run
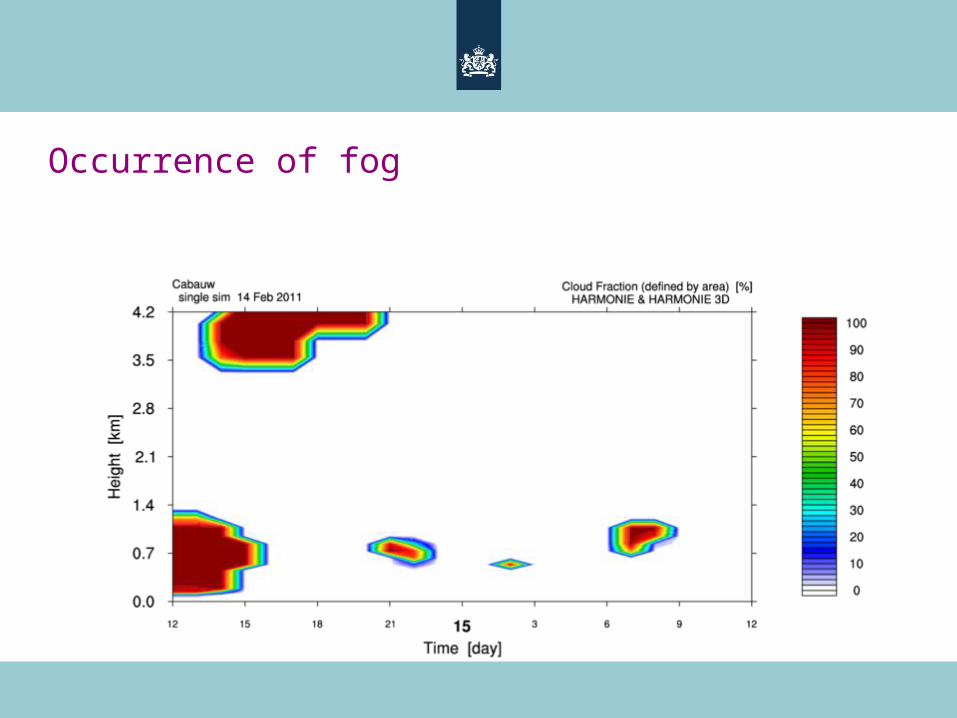
Occurrence of fog

Occurrence of fog (2)
Content
- Description KNMI DA suite
- Monitoring tools
- Problems encountered
- Future developments

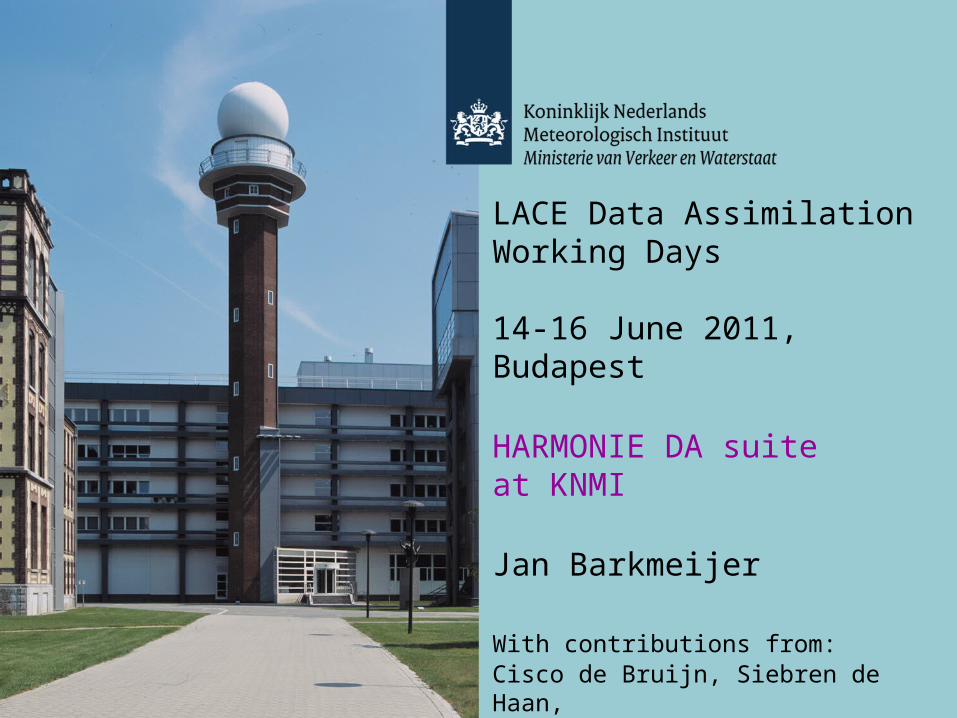
Modis VIS satellite image13th of May 2008 1315 UTC Cloud cover Cloud cover
EDMFM and cloud scheme changes
Increase variance computation in the cloud scheme to alleviate the on-offcharacter in the generation of cloud
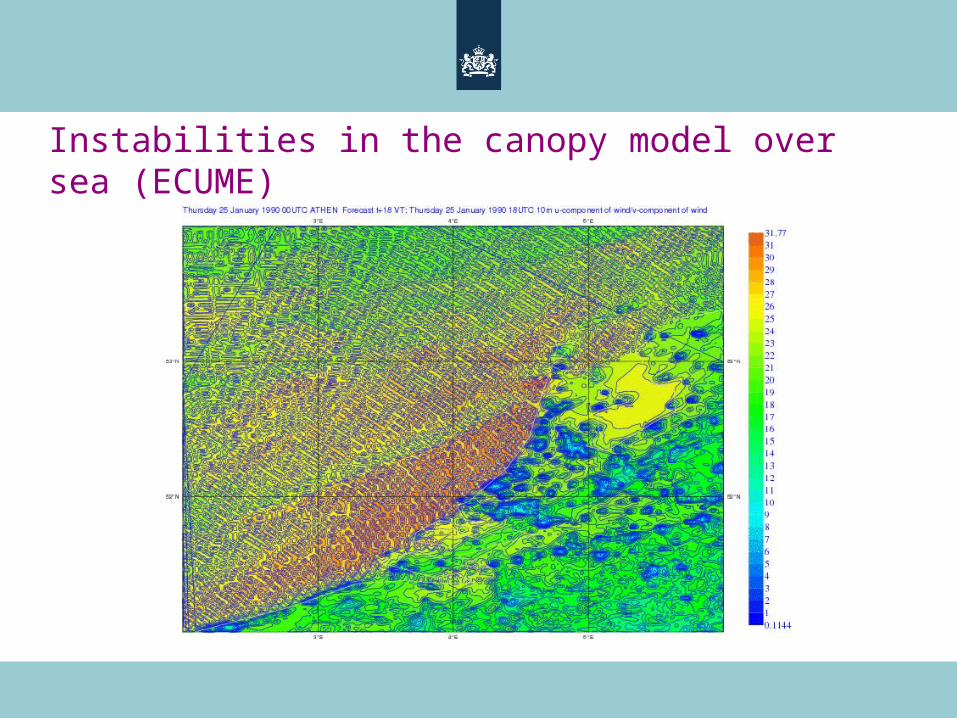
Instabilities in the canopy model over sea (ECUME)

Using Meteo-France 60 level definition
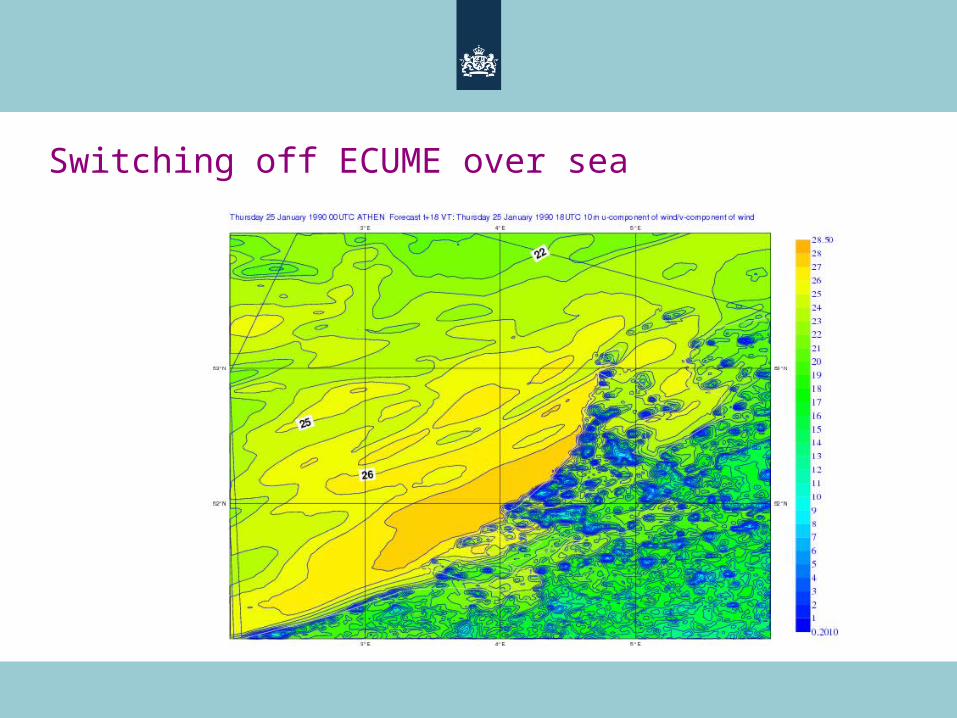
Switching off ECUME over sea

Occurrence of negative q in the analysisAlso other hydrometeors are affected (e.g. cloud-ice and cloud-water)
First-guess Analysis
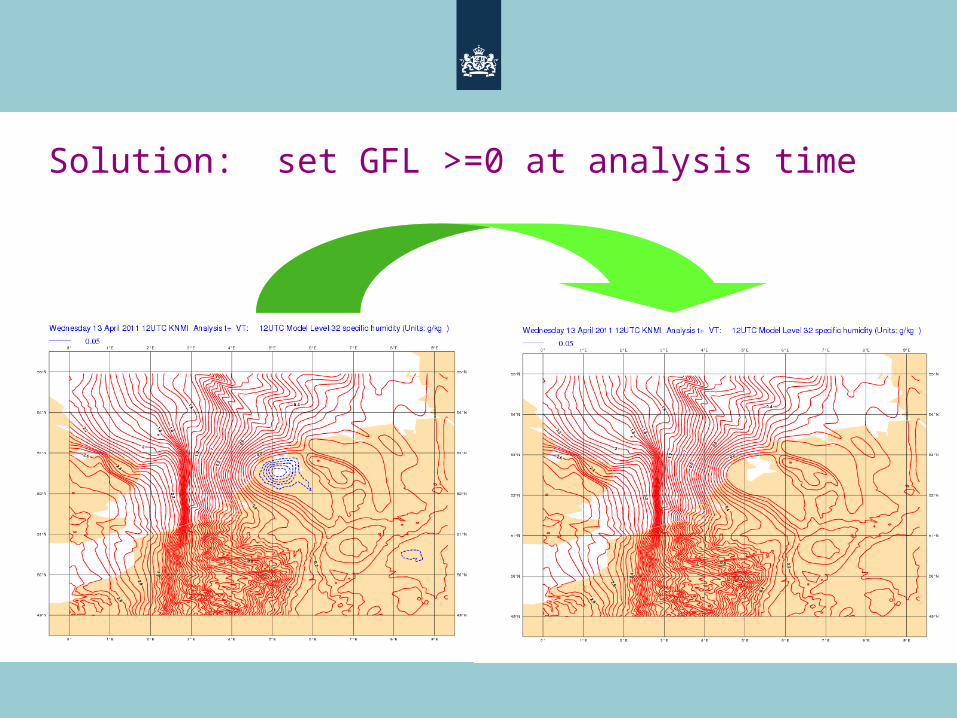
Solution: set GFL >=0 at analysis time

Impact on 24-h accumulated precipitation
original analysis modified
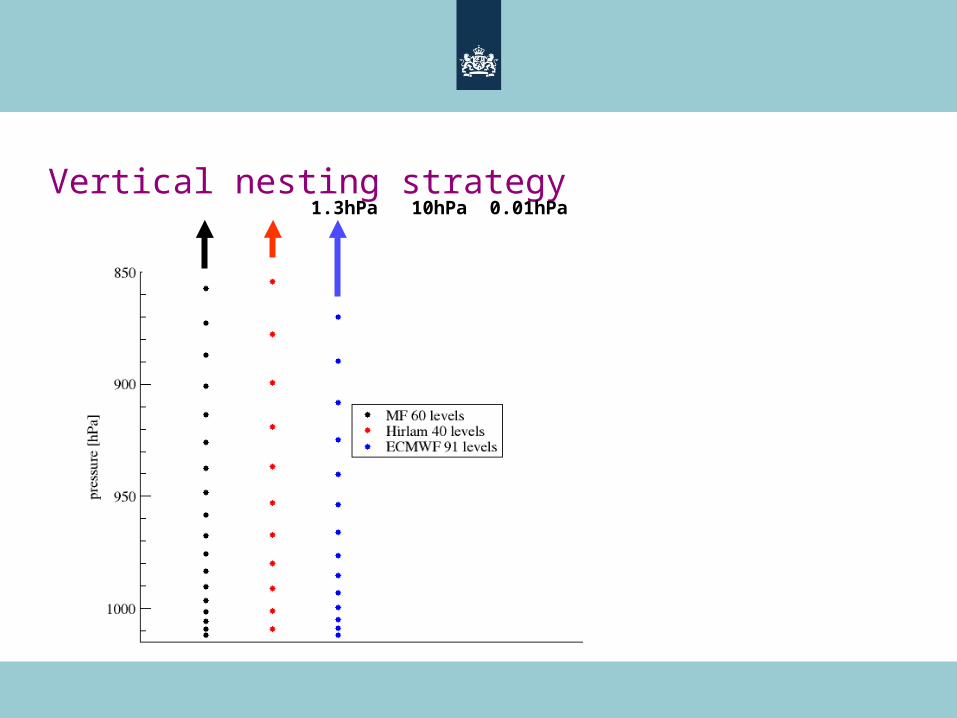
Vertical nesting strategy 1.3hPa 10hPa 0.01hPa
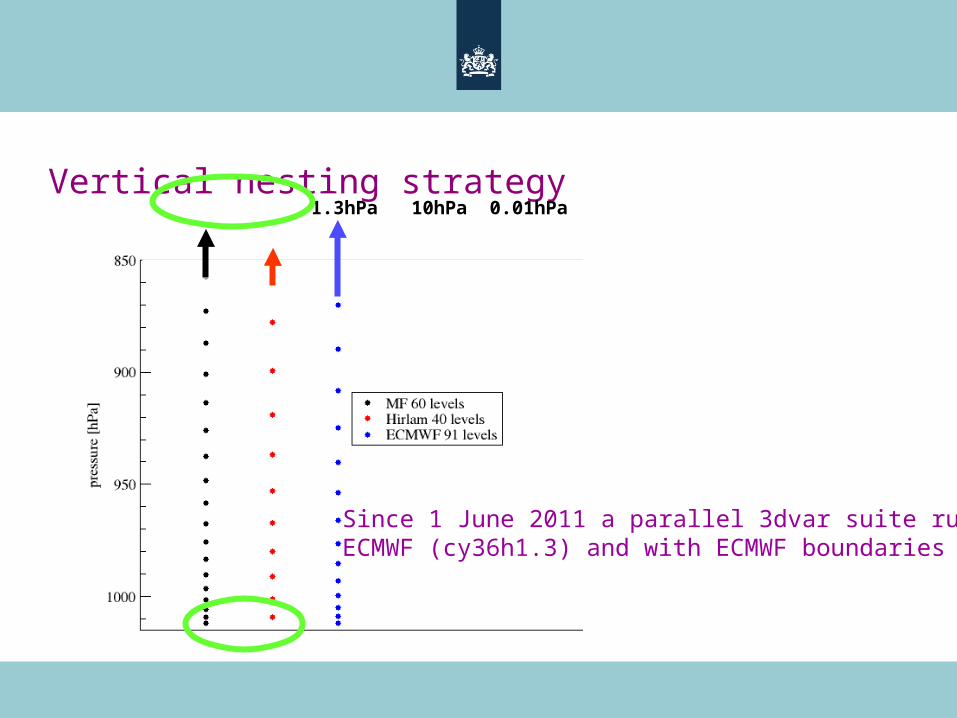
Vertical nesting strategy 1.3hPa 10hPa 0.01hPa
Since 1 June 2011 a parallel 3dvar suite runs atECMWF (cy36h1.3) and with ECMWF boundaries
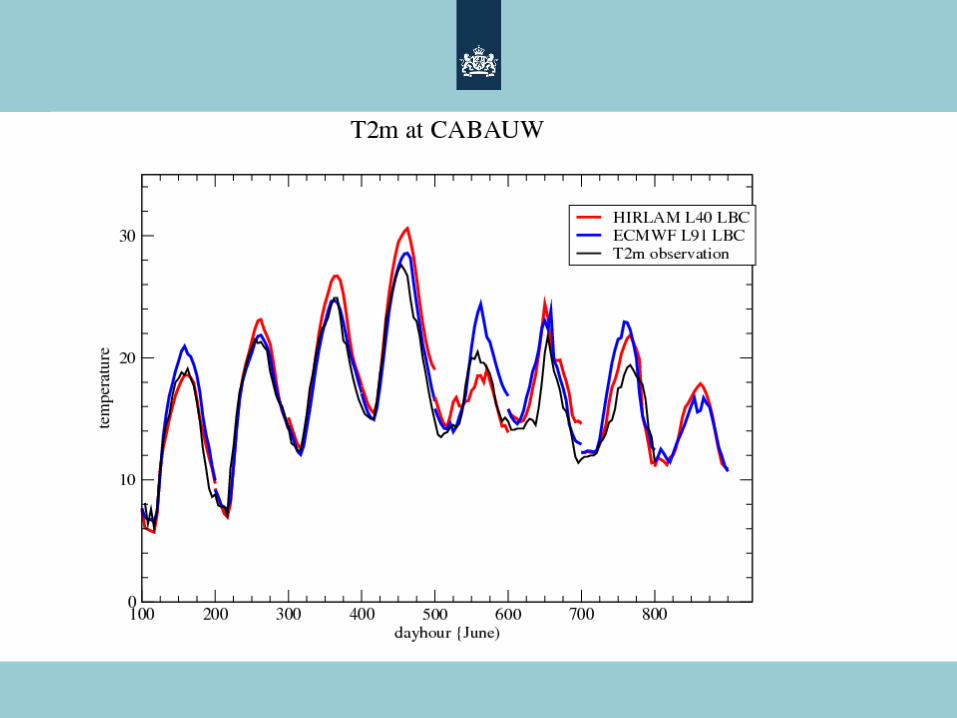
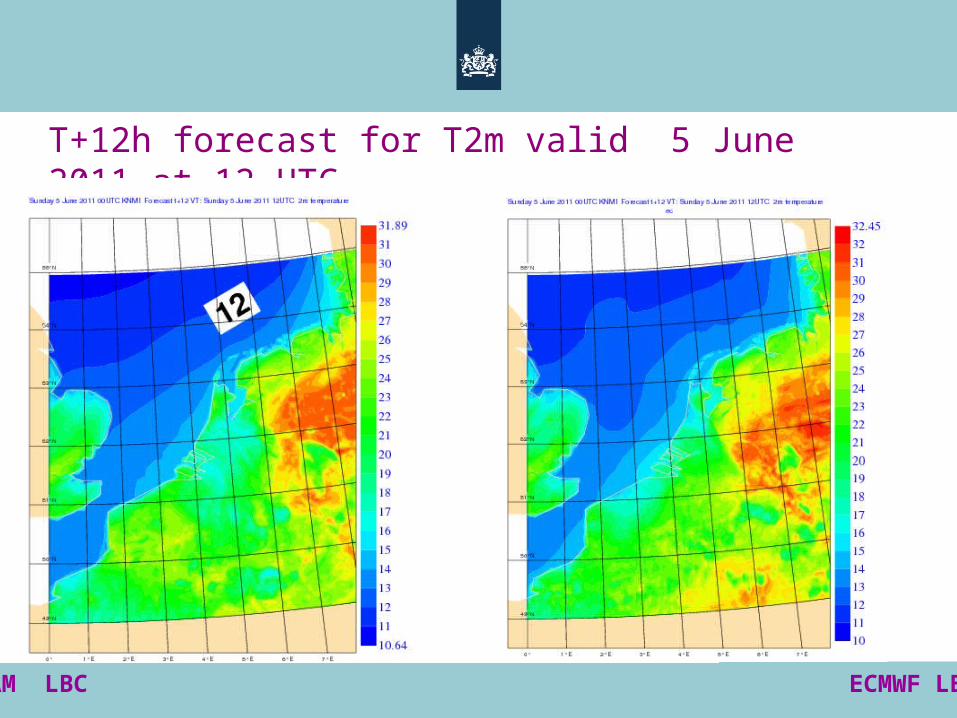
T+12h forecast for T2m valid 5 June 2011 at 12 UTC
HIRLAM LBC ECMWF LBC

RADAR 3DVAR + HIRLAM LBC
400x400 500x500
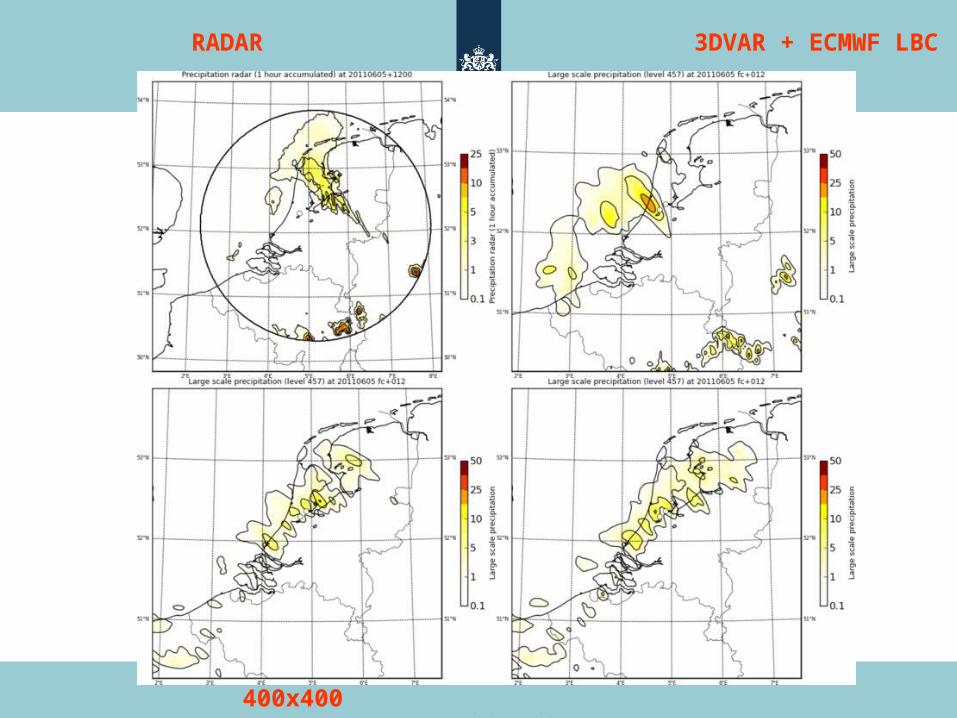
RADAR 3DVAR + ECMWF LBC
400x400 500x500

FUTURE PLANS- Get radar data-assimilation running
- Implementation of a 800x800xL60 Harmonie suite at KNMI, 3dvar with cycling time of 3 hour (or less)
- Add more q observations: GPS, Cloud data (e.g. cover)
- Develop more tools for monitoring (MetEvaluation)
- Coupling with other applications:surge model, LOTOS (air pollution model)
- Increase research effort on DA+EPS:+ timing/location of convection+ 4dvar without nonlinear updates