Labour Productivity in Kenyan Manufacturing and …ftp.iza.org/dp9923.pdf · Labour Productivity in...
25
Forschungsinstitut zur Zukunft der Arbeit Institute for the Study of Labor DISCUSSION PAPER SERIES Labour Productivity in Kenyan Manufacturing and Service Industries IZA DP No. 9923 April 2016 Almas Heshmati Masoomeh Rashidghalam
Transcript of Labour Productivity in Kenyan Manufacturing and …ftp.iza.org/dp9923.pdf · Labour Productivity in...

Forschungsinstitut zur Zukunft der ArbeitInstitute for the Study of Labor
DI
SC
US
SI
ON
P
AP
ER
S
ER
IE
S
Labour Productivity in Kenyan Manufacturing andService Industries
IZA DP No. 9923
April 2016
Almas HeshmatiMasoomeh Rashidghalam

Labour Productivity in
Kenyan Manufacturing and Service Industries
Almas Heshmati Jönköping International Business School,
Sogang University and IZA
Masoomeh Rashidghalam
University of Tabriz
Discussion Paper No. 9923 April 2016
IZA
P.O. Box 7240 53072 Bonn
Germany
Phone: +49-228-3894-0 Fax: +49-228-3894-180
E-mail: [email protected]
Any opinions expressed here are those of the author(s) and not those of IZA. Research published in this series may include views on policy, but the institute itself takes no institutional policy positions. The IZA research network is committed to the IZA Guiding Principles of Research Integrity. The Institute for the Study of Labor (IZA) in Bonn is a local and virtual international research center and a place of communication between science, politics and business. IZA is an independent nonprofit organization supported by Deutsche Post Foundation. The center is associated with the University of Bonn and offers a stimulating research environment through its international network, workshops and conferences, data service, project support, research visits and doctoral program. IZA engages in (i) original and internationally competitive research in all fields of labor economics, (ii) development of policy concepts, and (iii) dissemination of research results and concepts to the interested public. IZA Discussion Papers often represent preliminary work and are circulated to encourage discussion. Citation of such a paper should account for its provisional character. A revised version may be available directly from the author.

IZA Discussion Paper No. 9923 April 2016
ABSTRACT
Labour Productivity in Kenyan Manufacturing and Service Industries*
Labour productivity reflects a firm’s ability to generate higher production or value-added. This paper analyses labour productivity and its determinants in the manufacturing and service sectors in Kenya. As the largest economy in East Africa, it is crucial for Kenya to have high labour productivity as it has strong implications for economic growth and welfare. The paper also provides practitioners with a better understanding of the state of labour productivity in the country. Using the World Bank’s Enterprise Survey’s database for 2013, we find that capital intensity and wage significantly and positively affected labour productivity. A higher female share in the labour force reduced labour productivity. We also found that training and education were associated with higher labour productivity. Reliance on technologies such as emails and websites for communication had a positive but insignificant impact on firms’ labour productivity. On the basis of these observations we make a number of recommendations to promote higher productivity of labour. JEL Classification: J01, J16, J24, L60, O14 Keywords: labour market, labour productivity, manufacturing, services, firms, Kenya Corresponding author: Almas Heshmati Department of Economics Sogang University Baekbeom-ro (Sinsu-dong #1), Mapo-gu Seoul 121-742 Republic of Korea E-mail: [email protected]
* This research was conducted during my visit to Jönköping International Business School, Jönköping University in 2015-2016. I am grateful to faculty members, PhD students and the administrative staff for their support and excellent hospitality during my visit.

2
1. Introduction
Kenya is the largest economy in East Africa. After independence in 1964, it promoted rapid economic growth through public investments in infrastructure, by encouraging smallholder agricultural production, improving living conditions and providing incentives for private industrial investment. Its gross domestic product (GDP) grew annually by 6.6 per cent between 1963 and 1973. Agricultural production grew at an average of 4.7 per cent per annum during the same period. However, despite major efforts at achieving high growth and development objectives, economic performance during the 1980s and 1990s was far below its potential. Since its independence, Kenya had its worst economic performance in 1991-1993. GDP growth declined and agricultural production decreased at an annual rate of 3.9 per cent. The economy grew by an annual average of only 1.5 per cent from 1997 to 2002, which was below population growth leading to a decline in per capita incomes.
Kenya’s poor economic performance between the 1980s and mid-2000s was largely due to improper agricultural, land and industrial policies which was aggravated by poor international terms of trade and governance weaknesses. Increased government intrusion into the private sector and import substitution policies made the manufacturing sector uncompetitive. Economic growth began to recover with real GDP growth of 2.8 per cent in 2003, 4.3 per cent in 2004, 5.8 per cent in 2005, 6.1 per cent in 2006 and 7.0 per cent in 2007. However, the economic effects of the violence that broke out after the 27 December 2007 general elections, was compounded by drought and the global financial crisis, which decreased growth rates to less than 2.0 per cent in 2008. There was moderate improvement with 2.6 per cent growth in 2009 and the final 2010 growth figure was expected to be about 5.0 per cent.1 In 2012 and 2013, GDP growth was 6.9 and 5.7 respectively. GDP estimates revealed economic expansion of 5.3 and 6.5 per cent in 2014 and 2015 respectively. Kenya had a GDP of $69.98 billion in 2015, which made it the 72nd largest economy in the world. Per capita GDP was estimated at $1,587 (Odero et al., 2015).
Despite the fact that Kenya is industrially the most developed country in East Africa, manufacturing still contributes little to its GDP (the World Bank, 2015). Industrial activity, which is established around the three largest urban areas of Nairobi, Mombasa and Kisumu, is dominated by food processing industries such as grain milling, beer production, sugarcane crushing and the fabrication of consumer goods (for example, vehicles from kits). Kenya also has an oil refinery which processes imported crude petroleum into petroleum products, mostly for domestic markets. In addition, a substantial and developing informal sector
1 See http://www.state.gov/outofdate/bgn/kenya/201469.htms.

3
engages in small-scale manufacturing of household goods, motor vehicle parts and farm instruments. Approximately half the investments in the industrial sector are foreign; the United Kingdom provides half of these. The United States’ national corporations are the second largest foreign investors in Kenya.
The industry and manufacturing sectors accounted for 21.0 per cent of Kenya's overall GDP in 1980 (the World Bank, 2015). This manufacturing GDP represented only a slight increase since Kenya’s independence in 1964 after which the development of the sector has stagnated since the 1980s, hampered as it is by shortages in hydroelectric power, high energy costs, rundown transport infrastructure and the dumping of cheap imports in the absence of efficient local production. However, as a result of urbanization, the industry and manufacturing sectors have become increasingly important for the Kenyan economy. GDP per capita decreased to 19.0 per cent in 1990, and in 2000 the value-added to GDP decreased again to 17.0 per cent. In 2011, there was a modest increase to 19.0 per cent of Kenya's overall GDP.
The service sector has proven to be a major contributor to Kenya’s economy. It accounted for 47.0 per cent of Kenya's overall GDP in 1980. In 1990, it accounted for 51.0 per cent, in 2000 it stayed constant at 51.0 per cent and in 2011, the service sector contributed 58 per cent to Kenya's overall GDP (the World Bank, 2015).
In 2006 Kenya's labour force was estimated to include about 12 million workers, of which almost 75 per cent worked in agriculture. About 6 million were employed outside small-scale agriculture and pastoralism. Approximately 15 per cent of the labour force was officially classified as unemployed in 2004. As Kenya became increasingly urbanized, the labour force shifted from the countryside to cities (the World Bank, 2015). The service sector absorbed a majority of the inflow of labour to urban areas.
Labour force participation rates for both women and men were constant between 1997 and 2010. In 1997, 65 per cent of the women were employed in some type of labour market activity, while the corresponding number for men was 76 per cent (the World Bank, 2015). Around 60 per cent of the women and 70 per cent of the men were in the labour force in 2005. Their shares increased in 2010, when 61 per cent of the women and 72 per cent of the men were a part of the labour force.
In the past 20 years, Kenyans have moved away from family farming towards jobs which pay wages or to start small businesses outside the agricultural sector. In 1989, 4.5 million Kenyans (62.0 per cent), out of a total working population of 7.3 million, worked on family farms. In 2009, only 6.5 million Kenyans or 45 per cent, of a total working population of 14.3 million worked on family farms. More than half the family farm workers in Kenya were

4
women (3.8 million) as compared to men who made up 2.7 million. According to the World Bank 2012 Kenya Economic Update, "Men are much more likely than women to hold wage jobs, and women are more likely to work on family farms. Twice as many men as women hold wage jobs, and more men work principally in wage jobs than on family farms. Most Kenyans are now aiming to get modern wage jobs." In 1989, there were only 1.9 million Kenyans employed in wage work while in 2009 about 5.1 million people worked in modern, wage jobs; as expected men dominated over women in off-farm wage jobs. In 2009, 3.4 million men were employed in wage jobs, while only 1.3 million women held wage jobs (the World Bank, 2012).
This paper aims at analysing labour productivity in the manufacturing and service sectors in Kenya. Productivity reflects the ability of an organization or country to generate higher income or value-added. It is a ratio which shows how effectively a firm or organization turns a set of resources into products or services. However, there are various measures of productivity, some of which include capital productivity, labour productivity, profitability indices and total factor productivity. In the present study, due to lack of data we only measure labour productivity and its determinants, which is an important measure for gauging competitiveness in producing goods.
Labour productivity can simply be defined as total produced output or sales per employee at the firm level. The model is estimated using the regression analysis method by controlling for aspects of firm-specific, employment, market and public policy. The results show large variations in labour productivity across firms from the manufacturing and service sectors; these can be attributed to differences in their possible determinants.
The rest of the paper is organized as follows. Section 2 presents a literature review while Section 3 presents a data description. Method issues are discussed in Section 4. Section 5 presents the results which is followed by a summary and recommendations in Section 6.
2. Literature Review
A number of studies have attempted to analyse labour productivity and its determinants. Xiaodong et al. (2016) studied the impacts of high-temperature conditions on construction labour’s productivity. Their results demonstrated that high temperature environments impose heat stress on the human body as a result of which there is a decrease in labour productivity in the construction industry. According to Baptist and Teal (2015) heterogeneity in production functions and technology is an important source of variations in firm outcomes in Africa and it is even more important than education in explaining differences in output per worker. Based on this study, there is some technological diversity within Africa with

5
more dependence on raw materials in poor countries and higher returns to education in richer countries. Nagler and Naudé (2014) measured labour productivity in rural African enterprises and found that rural enterprises were on average less productive than those in urban areas and that female-owned enterprises were less productive than male-owned ones. They provided evidence that enterprises which operated throughout the year were more productive. According to their study, gender, education, shocks and access to finance and location mattered for labour productivity in rural Africa and that policy decisions tackling shortcomings could significantly contribute to a better business environment and increased labour productivity. Ogutu et al. (2014) assessed the impact of information and communication technology-based (ICT-based) market information services (MIS) on Kenyan smallholder farms’ input use and productivity. Their study found that participation in the ICT-based MIS project had a positive and significant effect on the use of purchased seeds, fertilizers and labour and land productivity, but it had a negative and significant impact on the use of hired, family and total labour.
Heshmati and Su (2014) studied the development and the source of labour productivity in 31 Chinese provinces during 2000-2009. They identified several determinants of labour productivity and found that the share of industry output, investments in fixed asset, total volume of telecommunication investments, enterprises’ profits and the average wage for labour, had positive effects on labour productivity both when productivity was measured in level and in growth rate forms. Sala and Silva (2011) have shown that vocational training is an important determinant of productivity growth. They constructed a multi-country, multi-sectoral dataset and quantified empirically to what extent vocational training had contributed to an increase in the growth rate of labour productivity in Europe between 1999 and 2005. According to this study, one extra hour of training per employee accelerated the rate of productivity growth by around 0.55 percentage points.
With reference to return to development economics, Rijkers et al. (2010) analysed the productivity of manufacturing enterprises in rural Ethiopia. The authors found that rural enterprises were less productive than urban ones, and reported an output per labour ratio for remote rural enterprises of 0.43, while it was 0.95 for enterprises in rural towns and 2.30 for enterprises in urban areas. Söderbom and Teal (2004) and Söderbom et al. (2006) found that more productive firms tended to survive longer in Africa. This however happened only in cases when these enterprises had already attained a certain firm size and scale in production that enhanced their survival.
According to Dearden et al. (2006) on-the-job training was directly associated with productivity increases. In particular, for a panel of British industries they found that a 1.0 per cent increase in work-training raised the value added per hour by about 0.6 per cent and

6
the hourly wage by about 0.3 per cent. Using Ghanaian enterprise level data, Frazer (2005) confirmed that more productive enterprises were more likely to survive compared to less productive ones. Wei (2000) found a positive relationship between fixed investments and real GDP per capita in China.
Some literature has also studied the performance of female-headed enterprises (Amin, 2011; Kinda et al., 2011; Saliola and Seker, 2011; Rijkers and Costa, 2012). According to these studies female-headed enterprises were less productive than male-headed ones. Other studies include Dollar et al. (2005), Arnold et al. (2006), Eifert et al. (2008) and Dethier et al. (2010) which have found that a poor business environment reduces enterprise productivity and growth. In general, research indicates that aid support targeting female entrepreneurs is more productive in creating employment opportunities, reducing risks of defaults, increasing family welfare, reducing poverty and possibly even increasing survival of the firms.
In sum, existing literature has helped identify the key determinants of labour productivity in manufacturing and services in both developed and developing countries’ environments. Among others, it suggests that environmental factors such as high-temperature conditions influence labour productivity negatively in some industries like construction and possibly even an open space working environment such as agriculture. Productivity differences can be large when rural and urban located firms are compared. This is very likely attributed to differences in education, skill, productive capital and other urban-biased development infrastructure. Gender related differences in the management and operation of firms is very likely a result of gender discrimination in the form of objectives, access to financial sources, culture, level of education, etc. Export orientation, innovative activities and training programs not only influence the survival and growth of firms but also their labour productivity positively (Kang et al., 2008; Oh et al., 2009). In Africa’s case it seems that policy decisions tackling market shortcomings could significantly contribute to a better business environment and increased labour productivity. In this study we extend the set of determinants listed earlier by several factors specific to the environment in Kenyan manufacturing and service sectors. The factors are selected based on data availability and our expectation about their possible positive effects on labour productivity.
3. Methods
In economics, productivity is measured as the ratio of what is produced to what is required to produce it. Usually this ratio is in the form of an average, expressing the total output of some category of goods divided by the total inputs of, say, labour, energy, capital or raw materials. Productivity is generally defined as a measure of physical output produced from

7
a given quantity of inputs. It is a ratio to show how effectively and efficiently a firm or organization turns a set of inputs into a product or service. It is easier to use inputs like energy and labour in the form of number of employees or hours worked and units of energy used in production. Capital stock needs to be aggregated and constructed in an index form. Due to its multi-output nature, output is the best measure in the form of an aggregate monetary measure. It has the advantage that changes in quality are reflected in prices and values (for a survey on measures of inputs and outputs in manufacturing and services see Heshmati, 2003).
Researchers use various measures of productivity. Availability of data and a researcher’s skills determine the approach that is used. The starting point is a production function for manufacturing:
(1) Y = f (K,L,M,E)
where Y is output, K, L, M and E represent capital, labour, material and energy inputs. In recent years the set also includes information technology and public infrastructure. Labour is the dominating factor in the production of many goods and services as in general other inputs in production are proportional to the number of employees or the quantity of output. Banks, insurance companies and education and public sector services are among typical services with such characteristics. Dividing both left and right sides with L and adding technology (T) and other control variables (Z), the relation is rewritten as:
(2) Y/L = f (K/L, L/L, M/L, E/L, Z, T)
where the ratio Y/L is a measure of labour productivity, and ratios K/L, M/L and E/L measure capital, material and energy intensities per employee. T captures the state of production technology and Z is a vector of control or firm-specific variables capturing the state of firm, market, policy and regulatory conditions.
Productivity in literature includes measures such as single factor capital productivity, labour productivity, energy productivity, profitability indices and total factor productivity. Productivity is estimated using a parametric approach such as estimation of production and cost functions or non-parametrically using the Divisia index of productivity. However, for single factor productivity, it is common that a simple ratio of factor productivity, namely production divided by the factor (in this case labour) is computed. In this case the objective is to maximize labour productivity for a given quantity of labour. The opposite is labour use which aims at minimizing its use for a given level of production in the manufacturing (Masso and Heshmati, 2004) and service sectors (Battese et al., 2000). The labour use model is an inverted factor demand model. As such, the labour productivity method allows the use of cross-sectional data. In case of productivity growth one can use time series or panel data to compute changes over time.
8
In this study we only consider labour productivity, which is an important measure to gauge competitiveness in producing goods and services (Heshmati, 2003; Sauiana et al., 2013). Labour is by far the most common factor of production used in measuring productivity. One reason for this is, of course, the relatively large share of labour costs in the value of most products. A second reason is that labour inputs are measured more easily than certain other inputs such as capital. It is also directly and highly related to welfare and an important measure of development and living standards. This is especially true if by measurement one means simply counting heads and neglecting differences among workers in skill levels and intensity of work. In addition, statistics on employment and labour-hours are often readily available, while information on other productive factors may be difficult to obtain and compute.
It is worth mentioning that although the ratio of output to persons engaged in production or to labour-hours is referred to as labour productivity, the term does not imply that labour is the sole factor responsible for changes in the ratio. Improvements in output per unit of labour may be due to increased quality and efficiency of the human factor as well as other factors such as capital intensity, institutions and also many other conditioning variables. Thus, there is special interest in labour productivity measures simply because they also represent welfare and development levels. GDP per capita is the corresponding measure at the aggregate national level.
The level of productivity at different levels of aggregation is determined by a number of factors including, for instance, institutions, quality of management and governance, available supplies of labour force, land, raw materials, capital and other related factors. Also included in the relation are the education and skill levels of the labour force, the level of technology and technological capabilities, organization of production, efforts of managers and workers and other social and cultural factors. Differences in environment and organizations lead to heterogeneity in outcomes including those like labour productivity.
These variables interact and mutually condition one another in determining productivity levels and their changes. Thus, in any country one expects the level of technology, the skills of the workforce, the quantity of capital and the capacity for rational economic organization to be positively correlated. A country with low productivity is likely to have deficiencies on all counts while a country with high productivity is likely to score high on all. To put it differently, the numerous productivity-determining factors behave as variables in a system of simultaneous equations, with all acting concurrently to shape the outcome. Within this system, there are no grounds for assigning causal priorities to one or a few variables. All of them interact mutually to determine labour productivity outcomes. Within certain problem

9
frameworks, however, it may be entirely appropriate and indeed essential for explanatory purposes to emphasize certain variables over others.2
To estimate the labour productivity model we used a cross-sectional sample of firms, where we included data from different firms in the manufacturing and service sectors in Kenya. The model follows as:
(3) Labour productivity=f (Output, wages, production factor intensity, control variables)
where labour productivity is measured as value of annual production per unit of labour at the firm level. The two key variables as determinants of labour productivity are wages to compensate labour and capital intensity, namely capital per employee. Wage is measured as annual wage, while capital intensity is measured as capital per employee. Other factors that influence labour productivity include energy and material use intensities and workers’ characteristics such as age, gender, training, education and experience. The production environmental factors include specialization in production; size of firm; location of the market and industrial sectors; location and access to electricity and water utilities; and communication infrastructure, as well as various obstacles in the production and operations of firms. The model in vector form is written as:
(4) inin nmim mkik kjij ji XXXXLABPRO ε+lnβ+lnβ+lnβ+lnβ+β=ln 43210 ∑∑∑∑
where X1, X2, X3 and X4 are vectors of the four different categories of variables. A summary of the main factors affecting labour productivity are discussed in the next section, which identifies 21 factors divided into four categories labelled as main, labour, firm and infrastructure related. Given data availability, these factors were selected from literature reviews and are well-known common determinants of labour productivity regardless of the level of development.
The model was specified and estimated with ordinary least square with robust standard errors and is expressed as:
(5)
ε+β+β+β+β+β+β+
β+β+β+β+β+β+β+β+β+β+β+
)ln(β+)ln(β+)ln(β+)ln(β+β=)ln(
21
2019181716
1514131211
1098765
43210
EOBSTATOBSTALSIZEPOWERWATCONINSUWA
EMAILWEBSIREGIONSECTORSIZEAGEPSECFEDUTRAINSFEMEXPERI
WAGEFUEINTELEINTCAPINTLABPRO
2 http://academic.eb.com/EBchecked/topic/478036/productivity.

10
The model accounts for non-linearity by including squares of age of the enterprise and experience of the CEOs.
4. Data
The data used in this study are from the World Bank’s Enterprise Survey (ES). As part of these surveys the World Bank collects data from key manufacturing and service sectors in every region of the world. The surveys use standardized survey instruments and a uniform sampling methodology to minimize measurement errors and to yield data that are comparable across the world’s economies and as such are suitable for comparative economic studies. The initial dataset consisted of 670 firm-level observations in Kenya’s manufacturing and service firms in 2013. Data for estimating labour productivity determinants comprised of dependent, independent and characteristic variables. Dependent variable is labour productivity (LABPRO) defied as the value of all annual sales counting manufactured goods and goods that an establishment has bought for trading per labour. For services it refers to the value of all the services provided during the year per unit of labour. The independent and characteristic variables include four categories classified as main, labour related, firm related and infrastructure variables. Each category is now described.
The first category –main -- comprises of capital intensity, electric intensity, fuel intensity and wages. The capital intensity (CAPINT, +) variable is measured as the sum of the annual investment on machinery, vehicles, equipment and annual investment in land, buildings and structures per labour. The ‘+’ sign is the expected effect on labour productivity. The electricity intensity (ELEINT, +) variable is the annual cost of electric energy per employee purchased from public or private utility companies or received from other establishments that belong to the same firm. The fuel intensity (FEUINT, +) variable is the annual cost of all fuels per labour which are consumed for heating, power, transportation or the generation of electricity. Finally, the wage (WAGE, +) variable is the average wage per employee in a given firm and is obtained by dividing total wages by the total yearly average number of workers. It includes wages, salaries and benefits including food, transport and social security.
The second category –labour -- includes six variables related to employment: the top manager’s managerial experience in years (EXPERI, +), female labour share of the workforce at the firm level (SFEM, +/-), training programs for employees (TRAIN, +), average number of years of education of a typical female production worker (FEDUC, +) and the percentage of full time permanent workers who have completed secondary school

11
(PSEC, +). The variable training program for employees is a dummy variable where 1 indicates skill upgrading for a firm’s labour force.
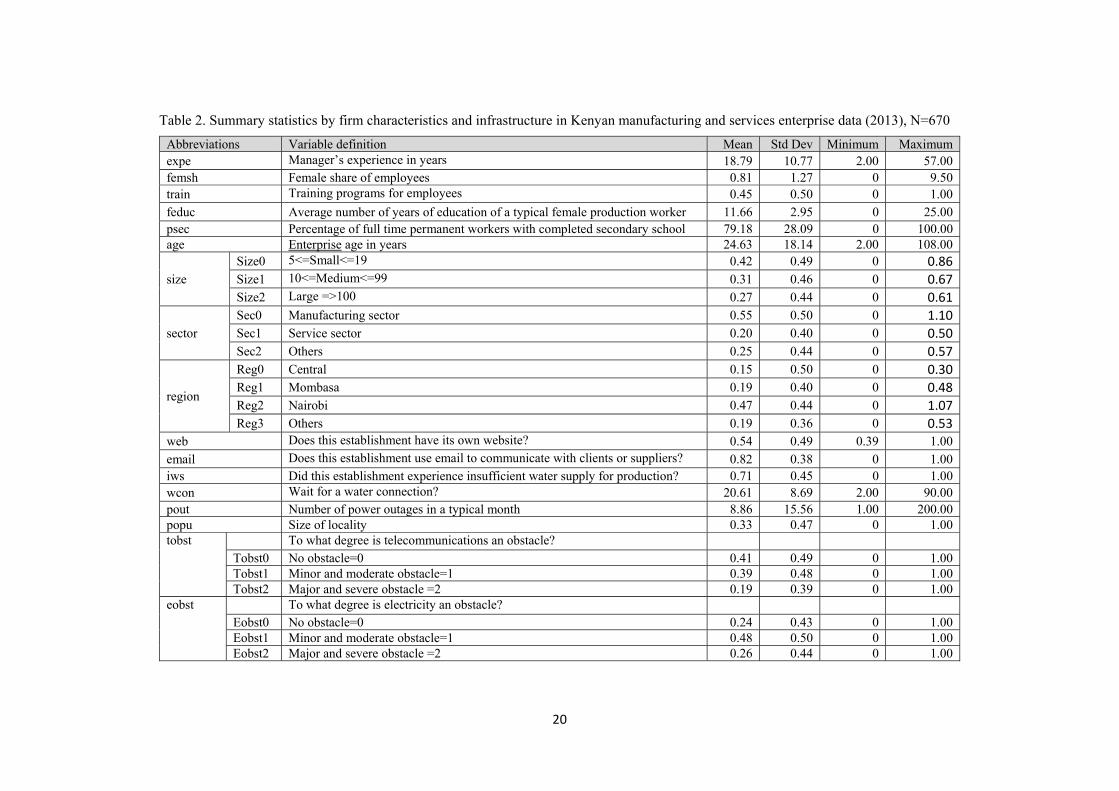
The third category – firm -- comprises of firm characterizes such as age, size and industrial sector classifications. A firm’s age (AGE, +) is measured in years. For the size of the establishment (SIZE, +/-) we group firms into three size classes by the number of employees: 5-19 (small), 10-99 (medium) and over 100 (large) employees. In classifying an establishment’s activities (SECTOR, +/-) we club firms into three groups of manufacture, services and others. Finally location (REGION, +/-) defines the region stratum of the establishment and includes Central, Mombasa, Nairobi and others.
The fourth category - infrastructure -- includes eight variables that play a crucial role in the smooth operation of firms. Website use (WEBSI, +) includes cases when an establishment has its own website and email (EMAIL, +) which suggests that the establishment uses emails to communicate with clients or suppliers. The utility variables include the establishment’s experience of insufficient water supply (INSUWA, -) for production, waiting for a water connection (WATCON, -) and the number of power outages (POWER, -) in a typical month. The remaining variables include the size of locality (LSIZE, +), the degree to which telecommunications is seen as an obstacle by the firm (TOBSTA, -) and to what degree electricity is an obstacle (EOBSTA, -) in production.
5. Empirical Results
5.1 Model specification and estimation
Tables 1 and 2 provide summary statistics of the data for the input and output variables and labour, firm and market characteristics used in this study. Sales averaged at 1,170 million Kenyan Shilling (KES)3 with dispersion 6.54 times the mean.4 The average employment in a sample firm was 98 persons. It varied in interval 1 and 8,000, with a dispersion of 4.32 around the mean value. The ratio of the two variables, the amount of sales per employee, which measures labour productivity varied from 3,000 to 1,720 billion KES with mean and standard deviations of 14.4 million and 90.2 million KES.
The value of investment per employee indicates considerable variations in the dataset. Mean wage per employee was 1.05 million KES with a large standard deviation of 7.1 million. It varied in the interval 1,000 and 170 million KES. Energy and fuel intensity variables also showed large variations among firms. The sample average capital intensity per employee
3 US$ 1 = 99.7 Kenyan Shilling (KES) on 13 March 2016. 4 Measured as coefficient of variation, CV=StdDev/Mean.

12
was 7.8 million KES with standard deviation of 35 million KES. The highest in the sample – a capital-intensive technology firm -- used 484 million KES in capital per employee. Variability in energy (electricity and fuel) use per employee also varied greatly. An average manager’s experience was about 19 years in our dataset, which varied between 2 and 57 years. The average age of firms was 25 years with a standard deviation of 18 years. It varied in the interval 2 and 108. On average male labour share was 0.81 and on average firms’ CEOs had about 12 years of education. Around 80 per cent of the permanent workers had completed secondary schooling.
Insert Table 1 about here
Insert Table 2 about here
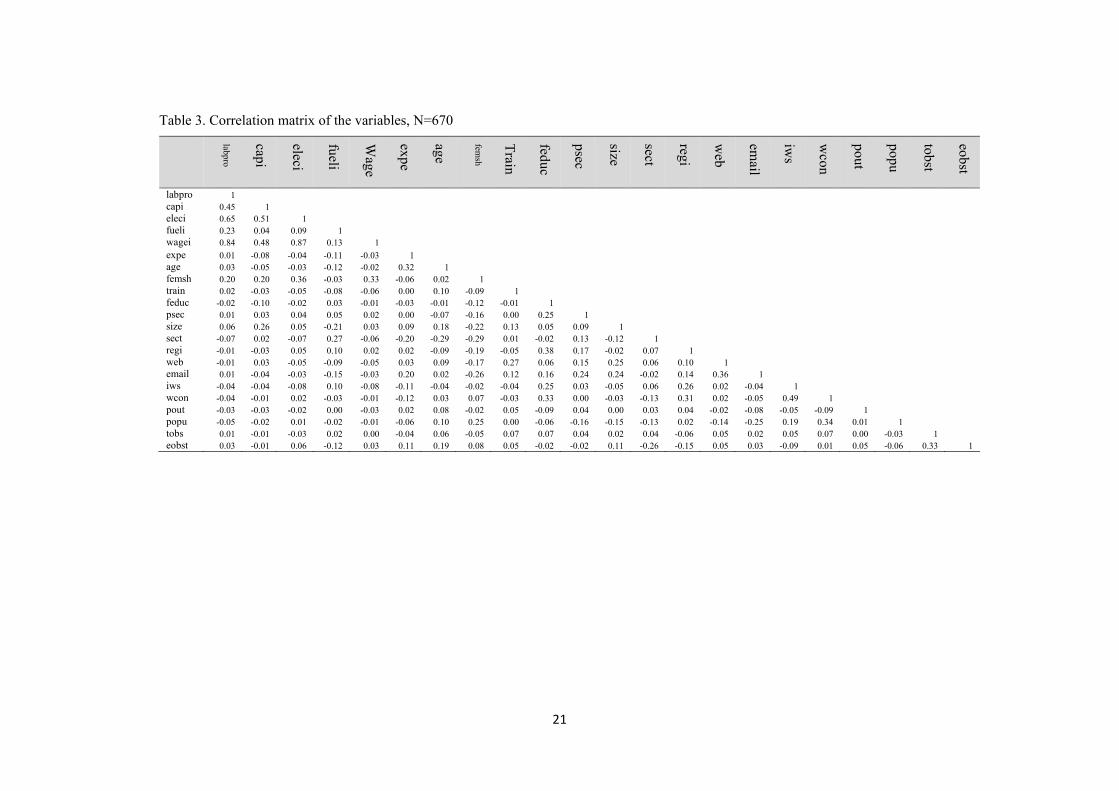
In order to check for collinearity among the explanatory variables, correlation coefficients among all the 22 variables is presented in Table 3. Labour productivity, as expected, was unconditionally positively correlated with capital, energy intensities and wages. Only pairs of wages and electricity showed higher correlation than 0.50 indicating multicollinearity and possible confounded effects. The remaining pairs were low correlated with each other and did not show any signs of serious multicollinearity. The age of the firm, training for workers, secondary education of workers and firm size were positively correlated with labour productivity.
Insert Table 3 about here
The model in equation (5) was estimated by ordinary least squares (OLS) with robust standard errors. Four regression models were specified and estimated using STATA. These differed by generalizations of the basic model with vectors of firms, labour and market characteristic variables. They were used to study the impacts of various categories of factors on labour productivity in the manufacturing and service sectors in Kenya at the firm level. The results of equation (5) are presented in Table 4. Tests of functional form using F-test based on residual sum of squares suggest that the somewhat less general Model 3 was the accepted and preferred model specification with reasonable explanatory power in explaining variations in labour productivity among the sample manufacturing and service firms in Kenya.
Ideally one should estimate the labour productivity model separately for different sub-samples of manufacturing and services. However, due to relatively small sub-sample sizes and robustness of the results we estimated a pooled model, but controlled for sectors of the firms grouped into manufacturing, services and others.
13
5.2 Determinants of labour productivity
Column 1 of Table 4 displays the estimation results for our basic model (Model 1), in which labour productivity was only affected by main variables like capital intensity, electricity intensity, fuel intensity and wages. We further added labour category variables to the first model and then constructed Model 2. Model 3 was attained by adding variables from the category firm characteristics to Model 2. Finally we show the estimates for full determinants of the labour productivity in Model 4 by adding the infrastructure category variables to Model 3.
Insert Table 4 about here
Thus, Model 1 was the most restricted and Model 4 the most generalized model specification. The models are nested and thereby allow testing for selection of appropriate model specifications. The specification test results are presented in Table 5. The test results show that the semi-general Model 3 was the accepted model specification which served as a base for the analysis. However, we also discuss the unconditional model specification. The models’ performances were measured in coefficient of determinations, adjusted R2, in explaining variations in labour productivity. Given the small and heterogeneous sample, this is relatively high, in the interval 0.28 and 0.35.
Insert Table 5 about here
Labour productivity, energy intensity, capital intensity and wage variables were transformed to logarithmic form. The coefficients were elasticities and as such were directly interpretable. They reflect percentage change in labour productivity in response to percentage changes in energy and capital input intensities and wages.
In all the models wage elasticity is positive (in the range of 0.49 and 0.51) and statistically significant at less than the 1 per cent level. Consistent with theory and our expectations, a higher level of wages increased labour productivity. Wages had the strongest effect on the level of labour productivity. In the simple model (Model 1) the effects of capital intensity (0.007), electricity intensity (0.053) and fuel intensity (0.002) on labour productivity were weaker than that of wages. Unexpectedly, capital intensity was not found to have effects on labour productivity. This is surprising as capital equips labour with the tools needed to make it productive. A third significant factor with effected labour productivity was fuel intensity in the third and fourth models. The electricity intensity elasticity was statistically significant in the first and second models but insignificant in the third and fourth models. Considering the accepted Model 3, wages and fuel intensity were the key determinants of labour productivity among Kenyan manufacturing and service firms.
14
Experience of the manager, female share of employees, training and education of workers were among the second category labour related variables expected to influence labour productivity. We allowed for non-linearity in the relationship between labour productivity and managerial experience by adding square of experience to the specification. The first and second order experience coefficients were positive and negative respectively suggesting that a higher managerial experience increased labour productivity but at a decreasing rate. An experienced manager with greater abilities can typically complete higher quality work. In addition, it is widely accepted that the training and education of labour usually increases working abilities resulting in higher labour productivity. According to Models 2 and 3, female share in labour had a negative effect on labour productivity. This finding is consistent with other studies like those by Saliola and Seker (2011) and Rijkers and Costa (2012). However, the coefficient of female share of employees was insignificant suggesting no statistical difference in labour productivity by gender. After higher wages, the training of workers was the second factor with the largest positive effect on labour productivity. The effect ranged in the interval 0.32 and 0.42 and was statistically significant at less than the 1 per cent level. Education for females and completion of secondary education did not seem to affect labour productivity. Adding interactive effects between wage and managerial experience, representing higher payments to the experienced workforce will affect labour productivity positively.
The firm category consisted of age, size, sector and regional location. Like managerial experience we allowed for a non-linear relationship between labour productivity and age of the firm. The coefficients of firm age and age squared were both positive suggesting a positive relationship between labour productivity and a firm’s age at an increasing rate. It indicates that labour in older firms was more productive than in young firms, which can be possibly explained by managers’ experiences. However, they were statistically insignificant. The insignificant size coefficients suggest no difference in labour productivity across different age groups. The other groups of firms had lower productivity than manufacturing firms, whose productivity did not differ from that in service firms. Labour productivity did not differ by location suggesting no advantage for the capital city or a location with better productivity facilitating infrastructure. Size of locality or market had a positive but insignificant effect on labour productivity.
Next we introduced an additional infrastructure category to Model 3 and get Model 4. The category list included infrastructure variables such as use of website and email services in communication with suppliers and customers, water supply, waiting for water connections, power outages and degrees of telecommunication and electricity supply obstacles. A majority of the coefficients are of expected signs but statistically insignificant. In the fourth
15
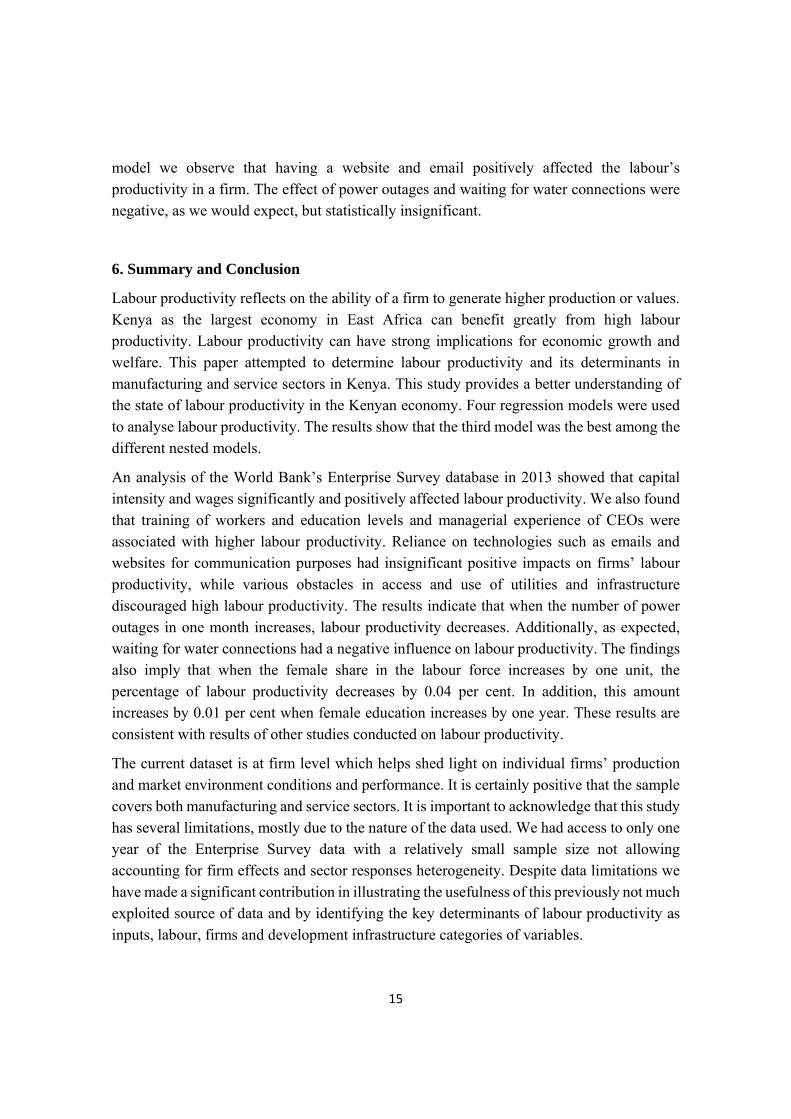
model we observe that having a website and email positively affected the labour’s productivity in a firm. The effect of power outages and waiting for water connections were negative, as we would expect, but statistically insignificant.
6. Summary and Conclusion
Labour productivity reflects on the ability of a firm to generate higher production or values. Kenya as the largest economy in East Africa can benefit greatly from high labour productivity. Labour productivity can have strong implications for economic growth and welfare. This paper attempted to determine labour productivity and its determinants in manufacturing and service sectors in Kenya. This study provides a better understanding of the state of labour productivity in the Kenyan economy. Four regression models were used to analyse labour productivity. The results show that the third model was the best among the different nested models.
An analysis of the World Bank’s Enterprise Survey database in 2013 showed that capital intensity and wages significantly and positively affected labour productivity. We also found that training of workers and education levels and managerial experience of CEOs were associated with higher labour productivity. Reliance on technologies such as emails and websites for communication purposes had insignificant positive impacts on firms’ labour productivity, while various obstacles in access and use of utilities and infrastructure discouraged high labour productivity. The results indicate that when the number of power outages in one month increases, labour productivity decreases. Additionally, as expected, waiting for water connections had a negative influence on labour productivity. The findings also imply that when the female share in the labour force increases by one unit, the percentage of labour productivity decreases by 0.04 per cent. In addition, this amount increases by 0.01 per cent when female education increases by one year. These results are consistent with results of other studies conducted on labour productivity.
The current dataset is at firm level which helps shed light on individual firms’ production and market environment conditions and performance. It is certainly positive that the sample covers both manufacturing and service sectors. It is important to acknowledge that this study has several limitations, mostly due to the nature of the data used. We had access to only one year of the Enterprise Survey data with a relatively small sample size not allowing accounting for firm effects and sector responses heterogeneity. Despite data limitations we have made a significant contribution in illustrating the usefulness of this previously not much exploited source of data and by identifying the key determinants of labour productivity as inputs, labour, firms and development infrastructure categories of variables.

16
This study only focused on service and manufacturing sectors. Hence, additional studies are required to analyse labour productivity and its determinants in specific sub-sectors of the Kenyan economy (for example, transportation, finance, education and health). Moreover, additional categories (for example, management and environment) should be included in future studies. Some variables such as a manager’s education, payment, motivation and employees’ education and skills, as well as pollution and waste and their management can be studied in management and environmental categories respectively. Hopefully, this simple and preliminary study will help initiate further research in this important field of research by using the unexploited Enterprise Survey data.
References
Amin, M. (2011). Labour Productivity, Firm-Size and Gender: The case of informal firms in Argentina and Peru. Enterprise Note, 22. The World Bank.
Arnold, J., A. Mattoo and G. Narciso (2006). Services inputs and firm productivity in Sub-Saharan Africa: evidence from firm-level data. World Bank Policy Research Working Paper, No. 4048, Washington DC: The World Bank.
Baptist S. and F. Teal (2015). Technology and productivity in African manufacturing firms. World Development, 64, 713–725.
Battese, G.E., A. Heshmati and L. Hjalmarsson (2000). Efficiency of Labour Use in the Swedish Banking Industry: A Stochastic Frontier Approach. Empirical Economics 25(4), 623-640.
Dearden, L., H. Reed, and J.V. Reenen (2006). The impact of training on productivity and wages: Evidence from British Panel Data. Oxford Bulletin of Economics and Statistics, 68(4), 397-421.
Dethier, J., M. Hirn and S. Straub (2010). Explaining enterprise performance in developing countries with business climate survey data. World Bank Research Observer, 26, 258-309.
Dollar, D., M. Hallword-Driemeier and T. Mengistae (2005). Investment climate and firm performance in developing countries. Economic Development and Cultural Change, 54(1), 1-31.
Eifert, B., A. Gelb and V. Ramachandran (2008). The cost of doing business in Africa: evidence from enterprise survey data. World Development, 36(9), 1531-1546.

17
Frazer, G. (2005). Which Firms Die? A look at manufacturing firm exit in Ghana. Economic Development and Cultural Change, 53(3), 585-617.
Heshmati, A. (2003). Productivity Growth, Efficiency and Outsourcing in Manufacturing and Services. Journal of Economic Surveys, 17(1), 79-112.
Heshmati, A. and B. Su (2014). Development and sources of labour productivity in Chinese provinces. China Economic Policy Review, 2(2), 1-30.
Kang, J.W., A. Heshmati and G.G. Choi (2008). The Effects of Credit Guarantees on Survival and Performance of SMEs in Korea. Small Business Economics 31(4), 445-462.
Kinda, T., P. Plane and M. Veganzones-Veroudakis (2011). Firm productivity and investment climate in developing countries: how does the Middle East and North Africa Perform? The Developing Economies, 49(4), 429-469.
Masso, J. and A. Heshmati (2004). Optimality and Overuse of Labour in Estonian Manufacturing Enterprises. Economics of Transition, 12(4), 683-720.
Nagler, P. and W. Naudé (2014). Labour Productivity in Rural African Enterprises: Empirical Evidence from the LSMS-ISA. IZA Discussion Paper No. 2014: 8524.
Odero, W.O., W.A. Reeves and N. Kipyego (2015). Kenya 2015. African Economic Outlook. http://www.africaneconomicoutlook.org/ Accessed April 4, 2016.
Ogutu, S.O., J.J. Okello and D.J. Otieno (2014). Impact of information and communication technology-based market information services on smallholder farm input use and productivity: the case of Kenya. World Development, 64, 311–321.
Oh, I., A. Heshmati, C. Baek and J-D. Lee (2009). Comparative Analysis of Firm Dynamics by Size: The Korean Manufacturing. Japanese Economic Review 60(4), 512-538.
Rijkers, B. and R. Costa (2012). Gender and Rural Non-Farm Entrepreneurship. World Development, 40(12), 2411-2426.
Rijkers, B., Söderbom, M. and J. Loening (2010). A Rural-Urban Comparison of Manufacturing Enterprise Performance in Ethiopia. World Development, 38(9), 1278-1296.
Sala, H. and J.I. Silva (2011). Labour Productivity and Vocational Training: Evidence from Europe. IZA Discussion Paper No. 2011: 6171.
Saliola, F. and M. Seker (2011). Total factor productivity across the developing world. Enterprise Note No. 23. The World Bank.

18
Sauiana, M.S., N. Kamarudinb and R.M. Rani (2013). Labour productivity of services sector in Malaysia: analysis using Input-Output approach. Procedia Economics and Finance, 7, 35-41.
Söderbom, M. and F. Teal (2004). Size and Efficiency in African Manufacturing Firms: Evidence from Firm-Level Panel Data. Journal of Development Economics, 73(1), 369 - 394.
Söderbom, M., F. Teal and A. Harding (2006). The determinants of survival among African manufacturing firms. Economic Development and Cultural Change, 54(3), 533-555.
Wei, Y.H. (2000). Investment and regional development in post-Mao China. Geo Journal, 51(3), 169-179.
World Bank (IBRD-IDA) (2015). Labour force participation rate, female (% of female population ages 15+) (modeled ILO estimate) (http://data.worldbank.org/indicator/SL.TLF.CACT.FE.ZS?page=2)
World Bank (2012). Kenya Economic Update: Kenya at work: Energizing the economy and creating jobs. Edition No. 7. (http://siteresources.worldbank.org/INTAFRICA/ Resources/257994-1335471959878/kenya-economic-update-december-2012.pdf)
Xiaodong, L., K.H. Chow, Y. Zhu, Y. and L. Ying (2016). Evaluating the impacts of high-temperature outdoor working environments on construction labour productivity in China: A case study of rebar workers. Building and Environment, 95, 42-52.

19
Table 1. Summary statistics of key variables in the Kenyan manufacturing and services enterprise data (2013), N=670
Variable Variable definition Mean Std Dev Minimum Maximum CV
Sale Total sales (in Kenyan Shilling, KES) 1,170,000,000 7,650,000,000 90,000 120,000,000,000 6.54 Employment Annual employment 98 424.80 1 8000
4.32 LABPRO Sale per employee (labour productivity) in KES 14,400,000 90,200,000 3,000 1,720,000,000
6.26 CAPINT Annual investment per employee (capital intensity) in
KES 7,806,039 35,000,000 0.16 484,000,000
4.48 EENINT Annual cost of electric energy per labour (energy
intensity) in KES 238,817 1,610,259 0.00 36,000,000
6.74 FENINT Annual cost of all fuels per labour (fuel intensity) in
KES 4,821,125 10,800,000 0.00 200,000,000
2.24 WAGE Wage per employee in KES 1,049,785 7,095,087 1000 170,000,000
6.76 Note: US$ 1 = 99.7 Kenyan Shilling (KES) on 13 March 2016.
20
Table 2. Summary statistics by firm characteristics and infrastructure in Kenyan manufacturing and services enterprise data (2013), N=670
Abbreviations Variable definition Mean Std Dev Minimum Maximum expe Manager’s experience in years 18.79 10.77 2.00 57.00 femsh Female share of employees 0.81 1.27 0 9.50 train Training programs for employees 0.45 0.50 0 1.00 feduc Average number of years of education of a typical female production worker 11.66 2.95 0 25.00 psec Percentage of full time permanent workers with completed secondary school 79.18 28.09 0 100.00 age Enterprise age in years 24.63 18.14 2.00 108.00
size
Size0 5<=Small<=19 0.42 0.49 0 0.86Size1 10<=Medium<=99 0.31 0.46 0 0.67Size2 Large =>100 0.27 0.44 0 0.61
sector
Sec0 Manufacturing sector 0.55 0.50 0 1.10Sec1 Service sector 0.20 0.40 0 0.50Sec2 Others 0.25 0.44 0 0.57
region
Reg0 Central 0.15 0.50 0 0.30Reg1 Mombasa 0.19 0.40 0 0.48Reg2 Nairobi 0.47 0.44 0 1.07Reg3 Others 0.19 0.36 0 0.53
web Does this establishment have its own website? 0.54 0.49 0.39 1.00
email Does this establishment use email to communicate with clients or suppliers? 0.82 0.38 0 1.00 iws Did this establishment experience insufficient water supply for production? 0.71 0.45 0 1.00 wcon Wait for a water connection? 20.61 8.69 2.00 90.00 pout Number of power outages in a typical month 8.86 15.56 1.00 200.00 popu Size of locality 0.33 0.47 0 1.00 tobst To what degree is telecommunications an obstacle?
Tobst0 No obstacle=0 0.41 0.49 0 1.00 Tobst1 Minor and moderate obstacle=1 0.39 0.48 0 1.00 Tobst2 Major and severe obstacle =2 0.19 0.39 0 1.00
eobst To what degree is electricity an obstacle? Eobst0 No obstacle=0 0.24 0.43 0 1.00 Eobst1 Minor and moderate obstacle=1 0.48 0.50 0 1.00 Eobst2 Major and severe obstacle =2 0.26 0.44 0 1.00
21
Table 3. Correlation matrix of the variables, N=670
labpro
capi
eleci
fueli
Wage
expe
age
femsh
Train
feduc
psec
size
sect
regi
web
iws
wcon
pout
popu
tobst
eobst
labpro 1 capi 0.45 1 eleci 0.65 0.51 1 fueli 0.23 0.04 0.09 1 wagei 0.84 0.48 0.87 0.13 1
expe 0.01 -0.08 -0.04 -0.11 -0.03 1 age 0.03 -0.05 -0.03 -0.12 -0.02 0.32 1 femsh 0.20 0.20 0.36 -0.03 0.33 -0.06 0.02 1 train 0.02 -0.03 -0.05 -0.08 -0.06 0.00 0.10 -0.09 1 feduc -0.02 -0.10 -0.02 0.03 -0.01 -0.03 -0.01 -0.12 -0.01 1 psec 0.01 0.03 0.04 0.05 0.02 0.00 -0.07 -0.16 0.00 0.25 1 size 0.06 0.26 0.05 -0.21 0.03 0.09 0.18 -0.22 0.13 0.05 0.09 1 sect -0.07 0.02 -0.07 0.27 -0.06 -0.20 -0.29 -0.29 0.01 -0.02 0.13 -0.12 1 regi -0.01 -0.03 0.05 0.10 0.02 0.02 -0.09 -0.19 -0.05 0.38 0.17 -0.02 0.07 1 web -0.01 0.03 -0.05 -0.09 -0.05 0.03 0.09 -0.17 0.27 0.06 0.15 0.25 0.06 0.10 1 email 0.01 -0.04 -0.03 -0.15 -0.03 0.20 0.02 -0.26 0.12 0.16 0.24 0.24 -0.02 0.14 0.36 1 iws -0.04 -0.04 -0.08 0.10 -0.08 -0.11 -0.04 -0.02 -0.04 0.25 0.03 -0.05 0.06 0.26 0.02 -0.04 1 wcon -0.04 -0.01 0.02 -0.03 -0.01 -0.12 0.03 0.07 -0.03 0.33 0.00 -0.03 -0.13 0.31 0.02 -0.05 0.49 1 pout -0.03 -0.03 -0.02 0.00 -0.03 0.02 0.08 -0.02 0.05 -0.09 0.04 0.00 0.03 0.04 -0.02 -0.08 -0.05 -0.09 1 popu -0.05 -0.02 0.01 -0.02 -0.01 -0.06 0.10 0.25 0.00 -0.06 -0.16 -0.15 -0.13 0.02 -0.14 -0.25 0.19 0.34 0.01 1 tobs 0.01 -0.01 -0.03 0.02 0.00 -0.04 0.06 -0.05 0.07 0.07 0.04 0.02 0.04 -0.06 0.05 0.02 0.05 0.07 0.00 -0.03 1 eobst 0.03 -0.01 0.06 -0.12 0.03 0.11 0.19 0.08 0.05 -0.02 -0.02 0.11 -0.26 -0.15 0.05 0.03 -0.09 0.01 0.05 -0.06 0.33 1

22
Table 4. Ordinary least squares parameter estimates (with robust standard errors) of labour productivity, N=670
Model 1 Model 2 Model 3 Model 4
Variable Variable definition
Coefficient Robust
Std error Coefficient
Robust Std error
Coefficient Robust
Std error Coefficient
Robust Std error
cons Intercept 0.674a 7.626 6.425a 0.682 6.483a 0.692 6.138a 0.867
CAPINT Capital intensity 0.007 0.023 0.027 0.024 0.010 0.024 0.015 0.025
ELEINT Electricity intensity 0.053b 0.022 0.040 0.023 0.029 0.023 0.027 0.023
FEUINT Fuel intensity 0.002 0.011 0.007 0.012 0.031b 0.015 0.032b 0.015
WAGE Wage 0.511a 0.050 0.510a 0.048 0.500a 0.049 0.491a 0.050
EXPERI Manager’s experience 0.047b 0.020 0.042b 0.020 0.040b 0.020
EXPERI 2 Square of experience -0.001c 0.000 -0.001c 0.000 -0.001c 0.000
SFEM Female share of employees -0.037 0.054 -0.015 0.059 0.002 0.059
TRAIN Training of workers 0.429a 0.113 0.402a 0.113 0.328a 0.115
FEDUC Female education 0.010 0.022 0.004 0.024 -0.001 0.024
PSEC Secondary school education 0.003 0.002 0.003 0.002 0.002 0.002
AGE Age of firm 0.014 0.009 0.014c 0.008
AGE 2 Square of age <0.0001 0.000 <0.0001 0.000
SIZE 1 Size of firm – medium -0.048 0.145 -0.059 0.144
SIZE 2 Size of firm- large 0.274c 0.160 0.219 0.165
SECTOR 1 Sector - service <0.0001 0.209 0.010 0.224
SECTOR 2 Sector – others -0.386b 0.184 -0.397b 0.194
Region 1 Region – Mombasa 0.090 0.212 0.266 0.437
Region 2 Region – Nairobi 0.170 0.172 0.178 0.359
Region 3 Region – others -0.288 0.203 -0.258 0.207
LSIZE Size of locality 0.065 0.354
WEBSI Website 0.168 0.128
EMAIL Email 0.216 0.188
INSUWA Insufficient water supply 0.317 0.156
WATCON Wait for water connection -0.005 0.010
POWER Power outages -0.002 0.003
TOBSTA 1 Telecommunications obstacles – minor and moderate
0.213c 0.124
TOBSTA 2 Obstacle – major and severe 0.270 0.171
EOBSTA 1 Electricity obstacles - minor and moderate
-0.050 0.140
EOBSTA 2 Electricity obstacles - major and severe
0.108 0.169
F-value 30.90 19.90 14.48 11.07
R2 adj 0.28 0.31 0.34 0.35
Note: Significant at less than 1% (a), 1-5% (b) and 5-10% (c) levels of significance.

23
Table 5. F-tests for alternative model specifications
Model comparison RSS1 RSS2 F-test statistics
Critical value at 5%
Decision
Model 1 versus Model 2 1433.76 1358.76 4.53 1.96 Model 1 is rejected Model 1 versus Model 3 1433.76 1316.11 3.87 1.74 Model 1 is rejected Model 1 versus Model 4 1433.76 1283.92 2.98 1.54 Model 1 is rejected Model 2 versus Model 3 1358.76 1316.11 3.00 2.03 Model 2 is rejected Model 2 versus Model 4 1358.76 1283.92 2.19 1.64 Model 2 is rejected Model 3 versus Model 4 1316.11 1283.92 1.60 1.85 Model 3 is accepted
Note: RSS1 is restricted models’ residuals sum of squares, RSS2 is unrestricted models’ residual sum of squares.