Labour Migration for Employment - Nepal | Mission
106
Government of Nepal Ministry of Labour and Employment Labour Migration for Employment A Status Report for Nepal: 2015/2016 – 2016/2017
Transcript of Labour Migration for Employment - Nepal | Mission

Government of NepalMinistry of Labour and Employment
Labour Migration for EmploymentA Status Report for Nepal: 2015/2016 – 2016/2017


Government of NepalMinistry of Labour and Employment
Labour Migration for EmploymentA Status Report for Nepal: 2015/2016 – 2016/2017


iLabour Migration for Employment | A Status Report for Nepal: 2015/2016 – 2016/2017

Labour Migration for Employment | A Status Report for Nepal: 2015/2016 – 2016/2017 ii

iiiLabour Migration for Employment | A Status Report for Nepal: 2015/2016 – 2016/2017
ContentsMessage iAcronyms vi
Part 1: Introduction 11.1 Objectives of the report 21.2 Methodology 31.3 Limitations of the report 31.4 Content of the report 4
Part 2. Overview of the status of labour migration in Nepal 72.1 Current trends in obtaining a labour permit 72.2 Destination countries of labour migrant 102.3 Origin districts of labour migrants 132.4 Renewal of permits 172.5 Mode of migration: using a recruitment agency or migrating independently 192.6 Regularized data 202.7 Grievances, distress and death 212.8 Recruitment agencies and other institutions 352.9 Remittances 35
Part 3. Governing labour migration 393.1 Prevailing laws and policies 413.2 Institutional mechanisms 42
Part 4. Thematic issues 534.1 Skills recognition and development of migrant workers 534.2 Skills 544.3 Occupations of Nepali migrant workers: Data and limitations 544.4 Current practices of skills development and recognition 594.5 Key points for discussion 60
Part 5. Gaps, challenges and ways forward 635.1 Major gaps 635.2 Challenges 645.3 Ways forward 65
References 69Annex I 71Annex II 88

Labour Migration for Employment | A Status Report for Nepal: 2015/2016 – 2016/2017 iv
FiguresFigure 1. Current trend in obtaining labour permits, 2008/09 - 2016/17 8Figure 2. Share of total labour migrants, by sex, 2008/09 - 2016/17 10Figure 3. Top destination countries for foreign employment, 2008/09 - 2016/17 11Figure 4. Trends in labour permits issued for Malaysia and GCC countries, 2008/09 - 2016/17 12Figure 5. Top-ten destination countries for female labour migrants, 2008/09 - 2016/17 13Figure 6. Top- ten source districts for migrant workers, 2008/09 - 2016/17 14Figure 7. Province wise breakdown of migrant workers, 2008/09 - 2016/17 14Figure 8. Top-ten source districts for female migrant workers, 2008/09 - 2016/17 16Figure 9. Trend in renewal of labour permits, 2011/12 - 2016/17 17Figure 10. Top-ten destination countries for renewal of permits, 2012/13 - 2016/17 18Figure 11. Top-ten destination countries for renewal of permits, female migrant workers,
2012/13 - 2016/17 18Figure 12. Proportion of labour permits issued, by mode of migration, 2008/09 - 2016/17 19Figure 13. Number of previously unregistered migrant workers who applied for and
received a labour permit, 2012/13 – 2016/17 20Figure 14. Destination countries of previously unregistered migrant workers who
obtained a labour permit, 2012/13 – 2016/17 21Figure 15. Destination countries of migrant workers who filed complaint against individual
and institution at the DOFE, 2014/15 - 2016/17 23Figure 16. Reported causes of injury and disability, 2008/09 - 2016/17 27Figure 17. Reported proportion of death, by destination country, 2008/09 – 2016/17 28Figure 18. Reported number of deaths in top destination countries, 2008/09 – 2016/17 29Figure 19. Remittance as share of GDP, 2008/09 - 2016/17 36
TablesTable 1. Labour migration to the Republic of Korea via EPS, 2008-2017 9Table 2. Annual rate of increase/decrease in permits issued to labour migrants,
2008/09 - 2016/17 10Table 3. Districts with significantly increasing trend in obtaining labour permits,
2008/09 - 2016/17 15Table 4. Labour migration trend in 14 crisis-hit districts by earthquake in 2015 16Table 5. Complaints and settlements, 2012/13 -2016/17 22Table 6. Most cited nature of complaints registered at DOFE, 2014/15 - 2016/17 24Table 7. Cases at the Foreign Employment Tribunal, by year and status, 2009/10 - 2016/17 24Table 8. Destination countries stated in the rescue request, 2016/17 25Table 9. Reported numbers of migrant workers physically disabled during their foreign
employment, by sex, 2008/09 - 2016/17 25

vLabour Migration for Employment | A Status Report for Nepal: 2015/2016 – 2016/2017
Table 10. Reported cases of disability, by destination country, 2008/09 - 2016/17 26Table 11. Total reported number of migrant workers’ deaths during foreign employment, by sex,
2008/09 - 2016/17 27Table 12. Difference in total deaths recorded at DOCS and FEPB 28Table 13. Reported cause of death among labour migrants while working abroad, by sex,
2008/09 - 2016/17 30Table 14. Causes of death in Malaysia and GCC countries, 2008/09 - 2014/15 30Table 15. Reported number of deaths by suicide in destination countries, by sex,
2008/09 - 2014/15 31Table 16. Reported number of deaths as other or unidentified in destination countries,
by sex, 2008/09 - 2014/15 31Table 17. Reported number of deaths by natural cause in destination countries, by sex,
2008/09 - 2014/15 32Table 18. Reported of deaths by workplace accident in destination countries, by sex,
2008/09 - 2014/15 33Table 19. Reported number of deaths by traffic accident in destination countries, by sex,
2008/09 - 2014/15 33Table 20. Reported number of death by cardiac arrest in destination countries, by sex,
2008/09 - 2014/15 34Table 21. Reported number of death by heart attack in destination countries, by sex,
2008/09 - 2014/15 34Table 22. Details on private institutions providing services to migrant workers 35Table 23. Time-line of key events in foreign employment governance in Nepal 40Table 24. List of bilateral agreements and Memorandum of Understanding signed by
the Government of Nepal till date 43Table 25. Occupation profile: Malaysia, 2016/17, via recruitment agency only 55Table 26. Occupation profile: Qatar, 2016/17, via recruitment agency only 56Table 27. Occupation profile: Saudi Arabia, 2016/17, via recruitment agency only 56Table 28. Occupation profile: UAE, 2016/17, via recruitment agency only 57Table 29. Occupation profile: Kuwait, 2016/17, via recruitment agency only 57Table 30. Occupation profile: Bahrain, 2016/17, via recruitment agency only 58Table 31. Occupation profile: Oman, 2016/17, via recruitment agency only 58

Labour Migration for Employment | A Status Report for Nepal: 2015/2016 – 2016/2017 vi
CTEVT Council for Technical Education and Vocational Training DOCS Department of Consular ServicesDOFE Department of Foreign EmploymentEPS Employment Permit System FEA Foreign Employment Act FEPB Foreign Employment Promotion Board FET Foreign Employment Tribunal FY Fiscal Year GCC Gulf Cooperation Council HDI Human Development Index ILO International Labour Organization SAARC South Asia Association for Regional Cooperation TVET Technical and Vocational Education and TrainingUAE United Arab Emirates
Acronyms

viiLabour Migration for Employment | A Status Report for Nepal: 2015/2016 – 2016/2017

Labour Migration for Employment | A Status Report for Nepal: 2015/2016 – 2016/2017 viii
Sharmila Rai Gurung, a returnee migrant worker, rears poultry. © ILO.

1Labour Migration for Employment | A Status Report for Nepal: 2015/2016 – 2016/2017
Foreign employment continues to be the most significant motivation for international migration from Nepal. In the past consecutive fiscal years 2015/16 and 2016/17, the Department of Foreign Employ-ment (DOFE) issued 786,564 permits for foreign employment to over one hundred destination coun-tries. As migration for employment continues apace, the Government of Nepal remains steadfast to regulate and facilitate safe migration cycle for its citizens.
The first version of the report, Labour Migration for Employment - A Status Report for Nepal: 2013/14, set out a format for generating quantitative information with regard to labour migration, mainly through the presentation of trends, following the enactment of the Foreign Employment Act (FEA), 2007. These trends show large-scale labour migration from Nepal albeit the movement was concentrated in the Gulf Cooperation Council (GCC) countries and Malaysia. Labour migration to these seven countries ac-counted for 85 per cent of all labour migration between fiscal years 2008/09 and 2014/15. While labour migrants originate from all parts of the country, the majority of them were from the South-Eastern plains of Nepal. Similarly, labour migration was primarily a male phenomenon because more than 95 per cent of all those obtaining labour permits were male. Updating these data for the past two fiscal years, 2015/16 and 2016/17, the DOFE database showed that over 3.5 million labour permits have been issued in the nine years since the enactment of the FEA, 2007.
Governing such a large number of movements and presenting opportunities for planning and develop-ment are challenging. A primary concern has been ensuring the safety, rights, decency, and welfare of mi-grant workers. However, high levels of informality infused in most aspects to the labour migration process, unscrupulous and abusive recruitment practices that increase the vulnerability of forced labour and human trafficking, and an economy at home that provides inadequate job and employment opportunities both before and after labour migration complicates and adds cross-cutting challenges across the development spectrum. There is consequently, a need for harmonized approaches between the governmental agencies in devising regulatory and operational policies, plans and procedures to meet these challenges as well as to benefit from the developmental opportunities that may be gained through labour migration. The Govern-ment of Nepal not only recognized the increasing trends in labour migration in the early 2000s but also took gradual steps for effective governance culminating in the enactment of the FEA, 2007.
The FEA was a turning point in labour migration governance which is now more inclined towards regu-lating private agencies and individuals providing services for foreign employment, promoting safe and de-cent work abroad and protecting the rights and welfare of labour migrants. The law paved the way for the establishment of substantial institutional structures, support services, and regulatory oversight. Moreover, it was not only the challenges that needed to overcome but also manage the benefits and opportunities offered by foreign employment. A vision for foreign employment was materialized in the form of Foreign Employment Policy, 2012 as a guiding effort of the Government.
IntroductionPART 1:

Labour Migration for Employment | A Status Report for Nepal: 2015/2016 – 2016/2017 2
The second edition, Labour Migration for Employment - A Status Report for Nepal: 2014/2015, included discussions on thematic issues that were meant to encourage critical analysis and further research on the labour migration phenomenon. Considering the complex relation between migration and development, a historical context of labour migration in policies taken up by the Government of Nepal was discussed throughout the report. It also raised points for discussion on how benefits of foreign employment can be optimized for national development and explored possibilities for migrant workers to contribute in the aftermath of the devastating earthquake occurred in 2015. Furthermore, the growing trend of fe-male migration over the years and the government policies on female labour migration were presented. Overall, the analysis showed that the role of the government has been central to the labour migration phenomenon in Nepal. This year’s report continues the discussion with further inquiries on skills devel-opment and recognition of the migrant workers. It presents the updated information on the occupations of Nepali migrant workers in major countries of destination and discusses the possibilities and challenges.
This report is part of a continued effort of the Government of Nepal and the collaborating development partners, the International Labour Organization (ILO), the International Organization for Migration and The Asia Foundation to produce public information on labour migration from Nepal. Consequently, the policy makers and practitioners can make informed decisions to reap benefits from and tackle chal-lenges of international labour migration. It presents updated data adhering to the format utilized in the previous reports to ensure consistency in tracking migration trends. It highlights efforts and achievements of the Government of Nepal to ensure safer migration and discusses the key issues of labour migration governance faced by Nepal. It is hoped that the report will inform various country-level initiatives in both the sending and receiving countries, provide a valuable tool to form policy decisions, improve migration management mechanism, and strengthen national governance structures to promote safe and empowered labour migration that can safeguard fair labour conditions at destination countries.
1.1 Objectives of the report
This study aims to: • assess and delineate the magnitude of labour migration for foreign employment in Nepal in all its
dimensions by collecting and collating information available with relevant government agencies in the migration cycle;
• identify various government-led initiatives to promote safe migration and the rights and welfare of migrant workers in the countries of origin and destination; and
• identify gaps and challenges in the existing policies and institutional mechanisms that support labour migration and the human development of migrants and migrant’s households, and suggest ways forward to fill the gaps.

3Labour Migration for Employment | A Status Report for Nepal: 2015/2016 – 2016/2017
1.2 Methodology
The key sources of data presented throughout this report are the Department of Foreign Employment (DOFE), the Foreign Employment Promotion Board (FEPB), the Foreign Employment Tribunal (FET) and the Department of Consular Services (DOCS). As in the previous reports, labour permits issued by the DOFE have been considered a primary indicator for international migration trends.
The report comprises the trends in foreign employment for the past nine fiscal years, 2008/09 – 2016/17. The data from this report mostly refer to the Nepali fiscal year (FY). According to the Gregorian calendar, the Nepali fiscal year runs from 17 July to 16 July. While FY 2008/09, since the enactment of FEA, 2007 has been taken as a base year for presentation of data, the labour migration history is long and hence, pertinent information and data before that period have been used where necessary.
The Foreign Employment Information Management System (FEIMS) has been consistently upgraded in the last two fiscal years, which has facilitated this year’s report to present occupational data on demand in the destination countries. The occupation listed in the labour permits obtained by migrant workers has-been considered its indicator. Furthermore, the upgraded database has a facility to retrieve more information on grievances of migrant workers as registered in the DOFE, which is included in this re-port. Information available from the DOCS of the Ministry of Foreign Affairs has also been presented throughout this report.
For discussion on thematic issues, a range of literature was reviewed and consultations with high-level officials and focal persons from government agencies were conducted to enrich the content and elaborate the available data.
1.3 Limitations of the report
This report is limited to the official data available at different levels of government institutions. It pres-ents current trends based on the past nine years. The use of labour permits issued by the DOFE as the primary indicator limits the assessment to the nature, scale and magnitude of labour migrants in foreign employment. Therefore, labour migration to India was not included in the analysis because there is no requirement for official documents to cross the border, and thus there are no records of migration flows. Furthermore, the database used to collect information about the labour permits only presents the total number of labour permits issued and thus cannot differentiate who is a repeat migrant. The only indica-tor of repeat migration can be observed in the form of renewal of permits and have been included in this report. Furthermore, obtaining labour permits does not necessarily mean that an individual has departed from the country because the permits can neither be revoked nor used. Moreover, the numbers of labour permits issued do not capture labour migration through irregular channels, including those who travelled with a different type of visa to a destination country and stayed there for work.

Labour Migration for Employment | A Status Report for Nepal: 2015/2016 – 2016/2017 4
A few technical considerations were required to overview the data on labour migration. The DOFE data-base is online and provides real-time data. Hence, data collected at a certain point of time may not match in the future. For example, the total figure for labour permits issued in 2014/15 in the second report does not match the numbers collected in 2017 for the same year; it has decreased slightly. This is because of the cancellation of labour permits, which may happen a few months after they are obtained. Moreover, there are minor discrepancies in the data that do not affect the overall trends but need to be pointed out.
1.4 Content of the report
Part 2 highlights the trends for the past nine fiscal years (2008/09 – 2016/17) regarding labour permits issued for foreign employment along with the associated data. The disaggregated data is provided on sex, age, the corridors of origin and destination for foreign employment and grievances and distress reported by migrant workers.
Part 3 informs on various laws, policies and institutional mechanisms governing foreign employment and features recent development and achievements in managing the outflow of migrant workers.
Part 4 discusses thematic issues within foreign employment.
Part 5 covers prevailing gaps and challenges in the governing of the foreign employment process in Nepal and proposes ways forward to fill the lacunae and overcome the challenges.

5Labour Migration for Employment | A Status Report for Nepal: 2015/2016 – 2016/2017

Labour Migration for Employment | A Status Report for Nepal: 2015/2016 – 2016/2017 6
Nepali migrant workers at the Tribhuwan International airport. © ILO.

7Labour Migration for Employment | A Status Report for Nepal: 2015/2016 – 2016/2017
The history of labour migration for foreign employment from Nepal is characterized by the outflow to India until the end of the twentieth century. Nepal and India share a long open border, which does not require any documents or approval to cross from either side. The Census records showed that India received 93.1 per cent of Nepali emigrants in 1981, which gradually declined to 89.2 per cent in 1991, 77.3 per cent in 2001 and dropped conspicuously to 37.6 per cent in 2011.1 Although India is the most popular destination for international migration from Nepal, its share has been decreasing with the rise of labour migration to other destination countries, namely the GCC countries and Malaysia in the last decade. The earliest records of the Government show that only 3,605 Nepali migrants left for foreign employment in 1993/94; however, since 2001 more than 100,000 labour permits have been is-sued each year to destination countries other than in India, peaking at 519,638 in 2013/14. The surge in labour migration to destination countries, except in India, can be attributed to the intensification of globalization dynamics and adoption of economic liberalization since the restoration of democracy in 1990.
2.1 Current trends in obtaining a labour permit
The Department of Foreign Employment issued 3,509,633 labour permits from FY 2008/09 through 2016/17.2 As illustrated in Figure 1, there was a steady increase in the issuance of permits between FY 2008/09 to 2013/14 but the numbers have declined since then. While it was noted in the previous report that the decrease in the FY 2014/15 was caused by disruption of everyday activities in the after-math of the earthquake in April 2015, the decline in subsequent years corresponds to the significant number of decrease in labour permits issued to Malaysia in those years. Malaysia has been the top des-tination for labour migration with the number of labour permits peaking at 210,009 in FY 2013/14 (41.14 per cent of all labour permits issued that year). However, the number dropped considerably to 59,033 in FY 2015/16 and 95,244 in FY 2016/17. (For more on trends in destination countries see Section 2.2 below).
Overview of the status of labour migration in Nepal
PART 2:
1 Khatiwada, Padma P. (2014) 2 This does not include the Nepali migrant workers who migrated to the Republic of Korea for foreign employment through the government-to-
government Employment Permit System.

Labour Migration for Employment | A Status Report for Nepal: 2015/2016 – 2016/2017 8
Figure 1. Current trend in obtaining labour permits, 2008/09 - 2016/17
600 000
500 000
400 000
300 000
200 000
100 000
02008/09 2009/10 2011/122010/11 2012/13 2013/14 2014/15 2015/16 2016/17
20 10518 46721 41229 12127 76722 958
10 41610 0568 594
219 965
294 094
354 716384 665
450 889
519 638499 102
382 871
403 693
211 371
284 038
344 300361 707
423 122
490 517 477 690
362 766385 226 Male
Female
Total
In addition to the labour permits issued by the DOFE, as illustrated above, 44,978 migrant workers gained employment in the Republic of Korea via the Employment Permit System (EPS) from the year 2008 to 2017.3 The Republic of Korea introduced the scheme in 2004. It has signed bilateral agree-ments with several countries to receive labour migrants. The Government of Nepal signed a Memoran-dum of Understanding with the Republic of Korea in 2008 and has been participating in the scheme since then. The employment scheme is operated by a separate section, named EPS Korea Section – which acts as the sending agency under the DOFE and has received the ‘Best Practice Outstanding Award’ from EPS Korea in 2009, 2011 and 2013.
The EPS Korea sets an annual quota for receiving labour migrants from each country as per the agree-ment. It demands labour from Nepal for its manufacturing, agriculture and fishing sector. EPS Korea requires aspirants to take either computer-based or paper-based test, primarily on language skills and basic aptitude test, and only those who pass the tests are eligible to apply for the vacant jobs. Records from the EPS Korea Section show that more than three hundred thousand Nepalis have attended the exams in the last nine years with a low pass rate of 15.59 per cent. However, the possibility of obtaining a job after passing the test is as high as 98.71 per cent. The migrant workers can access employment opportunities in the Republic of Korea through their individual efforts too. However, the number of those workers migrating independently is significantly less than those who choose the EPS scheme. A total of 1,795 independent applicants were issued labour permits between 2012/13 and 2016/17. An individual selected by the EPS scheme receives a contract of employment for 4 years and 10 months with the possibility of extension, based on her/his performance and demand of the host company.
3 The EPS data is presented separately because the data is maintained adhering to Gregorian calendar, which presents a different timeline than the one used to maintain the DOFE data. While there is data of ten years since 2008 from EPS, the DOFE data is only for nine years starting from FY 2008/09. Since the data is not segregated properly, there are repeat migrants within the total presented in the data. However, the data from DOFE and EPS are combined to present the information on destination countries.

9Labour Migration for Employment | A Status Report for Nepal: 2015/2016 – 2016/2017
Table 1. Labour migration to the Republic of Korea via EPS, 2008-2017Year Total
attendeein exam
Passers Job application
filled upMale Female Total
Male Female Total
2008 31 525 6 406 380 6 786 6 587 2 733 81 2 8142009 - - - - - 1 847 64 1 9112010 36 203 3 734 446 4 180 4 096 1 917 422 2 3392011 50 043 14 080 1 598 15 678 15 678 3 846 137 3 9832012 - - - - - 5 937 395 6 3322013 44 122 7 336 715 8 051 7 778 4 863 183 5 0462014 58 746 3 463 200 3 663 3 478 5 587 441 6 0282015 51 137 7 789 701 8 490 8 370 5 460 406 5 8662016 60 626 3 183 334 3 517 3 464 7 501 578 8 0792017 68 383 - - 12 108 - 6 085 333 6 418Total 400 785 45 991 4 374 62 473 49 451 45 776 3 040 48 816*
Note: *This total includes repeat migrant or committed migrants as referred in EPS. The actual number of individuals is 44,978. Source: EPS Korea Section
Men accounted for the bulk of the labour migrants over the past nine years, at 95.18 per cent on an average, as depicted in Figure 2 below. There has also been a significant increase in the number of permits acquired by women during this period. The share of female migrant workers peaked in 2012/13, at nearly 6.2 per cent; however, it averages at 4.68 per cent of all labour permits issued in the past nine years. As reflected in the Labour Migration for Employment - A Status Report: 2014/15, the increase in participation of women in foreign employment was observed alongside their overall rise in participation in wage employment in the non-agriculture sector nationally. This suggests that increas-ing number of women opting foreign employment can be expected in the future too. Nevertheless, the participation of women in foreign employment has been a highly regulated affair by the Government since the promulgation of the first FEA in 1985. Nepal, like a few countries in Asia, has invoked ad-ditional conditions and various bans on women from migrating for employment with intent to protect women from many risks, including long working hours, sexual violence, physical abuse and economic exploitation.4
Although the increase in female migrant workers is significant in itself, it has had less impact on the overall trend in labour permits issued than the situation of men migrant workers. The annual in-crease or decrease in overall labour permits issued is associated with the rise and fall in the number of male migrant workers, as presented in the table below. While decreasing number of migrant workers between both sexes were observed, there was an 8.95 per cent increase in permits issued to female migrant workers in FY 2016/17 compared to FY 2015/16. The sharp decline among female migrant workers in 2014/15 can be attributed to complete ban placed by the Government on female migrant workers to travel as domestic workers in destination countries.
4 It was discussed in the previous report that trends concerning female labour migrants were influenced by the government’s regulations at varied time, including ‘ban’ in certain sectors in certain countries.

Labour Migration for Employment | A Status Report for Nepal: 2015/2016 – 2016/2017 10
Figure 2. Share of total labour migrants, by sex, 2008/09 - 2016/17
Table 2. Annual rate of increase/decrease in permits issued to labour migrants, 2008/09 - 2016/17
Fiscal Year Annual rate of increase/decrease in issuing permits (%)
Rate of increase/decrease in absolute terms (% male)
Rate of increase/decrease in absolute terms (% female)
2008/09 - - -2009/10 33.70 34.37 172010/11 20.61 21.21 3.62011/12 8.44 5.05 120.42012/13 17.21 16.97 20.942013/14 15.24 15.92 4.872014/15 -3.95 -2.61 -26.472015/16 -19.12 -19.35 -13.752016/17 -5.15 -5.83 8.86
2.2 Destination countries of labour migrants
Nepali labour migrants have obtained permits to work in 153 countries over the past nine fiscal years (2008/09 – 2016/17). A migrant worker may choose a United Nations member country, unless banned by the Government of Nepal, as a destination country, although the Government limits the number of countries that may be managed for employment through recruitment agencies. The coun-tries banned for foreign employment as of 2017 were Libya and Iraq.
100.00 %
95.00 %
90.00 %
85.00 %
80.00 %
75.00 %
70.00 %
65.00 %
60.00 %
55.00 %
50.00 %
96.10 % 93.85 %97.10 % 95.71 %96.60 % 94.40 %94 % 95.42 % 94.74 %
3.90 % 6.15 %2.90 % 4.29 %3.40 % 5.60 %6 % 4.58 % 5.26 %
Male
Female
2008/09 2009/10 2011/122010/11 2012/13 2013/14 2014/15 2015/16 2016/17

11Labour Migration for Employment | A Status Report for Nepal: 2015/2016 – 2016/2017
Figure 3. Top destination countries for foreign employment, 2008/09 - 2016/17
0.21 %
0.35 %0.63 %
0.86 %
1.32 %
2.54 %
29.88 %
21.57 %20.37 %
10.62 %
11.65 %
Malaysia Qatar
Saudi Arabia UAE
Kuwait Republic of Korea
Bahrain Oman
Lebanon Japan
Remaining countries
Malaysia and the GCC countries have been the most attractive destinations, receiving 86.42 per cent of all male and female labour migrants in the past nine fiscal years. As shown in Figure 3, of the total 3,554,683 permits issued over that period (including DOFE and EPS), 29.88 per cent were for Ma-laysia, followed by Qatar (at 21.57 per cent), Saudi Arabia (20.37 per cent), United Arab Emirates (UAE) (10.62 per cent), Kuwait (2.54 per cent), Republic of Korea (1.32 per cent), Bahrain (0.86 per cent) and Oman (0.63 per cent).
The Republic of Korea also received 1.32 per cent of all labour migrants during that period. This is largely because of the employment opportunities created by the Employment Permit System (EPS) for Korea as 96.16 per cent of all labour migrations to that country was arranged via this scheme. The Republic of Korea, as a destination country, has been favourable for Nepali migrant workers for its relatively higher wages, and sound living and working conditions that were provisioned in govern-ment-to-government agreement.
The trends in the destination countries of migrant workers from Nepal are similar to the trends in other South-Asian countries. Countries like India, Pakistan, Sri Lanka, and Bangladesh have high pro-portion of their labour migrants destined to GCC countries; at 96 per cent; 94 per cent; 88 per cent; and 60 per cent respectively5 with variation in the top destination countries. The proportion of Nepali migrant workers acquiring permits to GCC countries in the past nine years, FY 2008/09 – 2016/17, stands at 56.54 per cent. In the past nine years, 29.88 per cent of all labour permits issued by the DOFE were to Malaysia. However, the number of permits issued to Malaysia has dropped conspicu-ously in the last two fiscal years.
5 GIZ and ILO. (2015)

Labour Migration for Employment | A Status Report for Nepal: 2015/2016 – 2016/2017 12
Figure 4. Trends in labour permits issued for Malaysia and GCC countries, 2008/09 - 2016/17
250 000
200 000
150 000
100 000
50 000
0
210 009
196 229
158 663
111 366106 029
96 272
54 72359 549
45 044
29 320 25 612
24 057
410
17 77824 047
34 503
58 586
44 88335 943
55 426 53 081
52 091
59 03357 887
62 49968 103
128 550
103 932
134 808
124 032127 903
121 128
95 24496 795
86 613
96 903
72 892
Malaysia
Qatar
UAE
Kuwait
Bahrain
Oman
Saudi Arabia
As shown in Figure 4, labour migration to Malaysia picked up significantly from 13.3 per cent share of all labour migrants in FY 2008/09 to 42.14 per cent in FY 2013/14. However, the share of labour migrants acquiring permits to Malaysia has dropped drastically to 14.62 per cent in FY 2015/16 and 24.87 per cent in FY 2016/17. While there are no reported causes of this decline, it may be speculated that the decline followed bilateral agreements between Malaysia and Bangladesh, which is the top origin country for labour migrants to Malaysia in 2016 that opened a job opportunity for at least 1.5 million Bangladeshi workers over the period of three years.6 However, the Government does not have a bilateral agreement concerning labour migration with the Government of Malaysia even after several rounds of bilateral discussions in recent years. Moreover, the devaluation of Malaysian currency to US dollars, as reported in various financial newspapers in the past two years, also suggests that there is less incentive for Nepali workers to seek jobs until the currency regains its appreciated value.
Huge surge in migrant workers was also observed for four GCC countries: Qatar, Saudi Arabia, the UAE, and Kuwait. Labour permits issued to Qatar and Saudi Arabia have averaged 85,189 and 80,467
6 Chowdhury, Kamran R. (2016)
2008/09 2009/10 2011/122010/11 2012/13 2013/14 2014/15 2015/16 2016/17
1 7784 3261 298
1 8621 877 3 100
4 255 4 4184 168 3 133 3 911
1 006
7 981 9 165
17 376
3 931 3 453
20 196
9 632 9 94013 134
3 0663 0362 3081 884
2 286

13Labour Migration for Employment | A Status Report for Nepal: 2015/2016 – 2016/2017
respectively in the past nine years. Among other destination countries and territories, Afghanistan, Japan, Jordan, Lebanon and Macau, China have remained popular destinations while Cyprus, Sey-chelles, Brazil, and the Czech Republic have emerged as new destinations.
The pattern for male migrant workers follows the overall trend with the exception of Afghanistan in the top-ten list instead of Lebanon as observed in the overall trend. The top-ten countries of destina-tions for male migrant workers during the last nine fiscal years were Malaysia (30.55 per cent among all men), Qatar (22.33 per cent), Saudi Arabia (21.22 per cent), UAE (9.92 per cent), Kuwait (2.09 per cent), Republic of Korea (1.40 per cent), Bahrain (0.83 per cent), Oman (0.55 per cent), Japan (0.35 per cent), and Afghanistan (0.20 per cent).
The pattern for women differs slightly as reflected in Figure 5. The top-ten destinations for female mi-grant workers in the past nine-year fiscal period were UAE (41,468 permits issued), Malaysia (27,045 permits issued), Kuwait (19,275 permits issued), Qatar (10,168 permits issued), Cyprus (5,551 per-mits issued), Saudi Arabia (5,334 permits issued), Lebanon (4,381 permits issued), Jordan (4,101 permits issued), Oman (3,855 permits issued), and Republic of Korea (3,095 permits issued).
Figure 5. Top-ten destination countries for female labour migrants, 2008/09 - 2016/17
27.75 %
1.80 %
2.24 %
2.38 %
2.55 %
3.10 %
3.23 %5.91 % 11.21 %
15.72 %
24.11 %
UAE
Malaysia
Kuwait
Qatar
Lebanon
Cyprus
Saudi Arabia
Oman
Jordan
Republic of Korea
Remaining countries
2.3 Origin districts of labour migrants
The recipients of labour permits over the past nine fiscal years came from every district across the coun-try, with the top ten being (in order of most migrants) Dhanusa, Jhapa, Mahottari, Morang, Siraha, Saptari, Nawalparasi, Sunsari, Sarlahi and Rupandehi (see Figure 6).7
7 This aggregate does not include numbers of permits issued individually prior to FY 2012/13 since disaggregated data was not available.

Labour Migration for Employment | A Status Report for Nepal: 2015/2016 – 2016/2017 14
Figure 6. Top- ten source districts for migrant workers, 2008/09 - 2016/17
Dhanusa
Jhapa
Mahottari
Morang
Siraha
Saptari
Nawalparasi
Sunsari
Sarlahi
Rupandehi
Remaining 65 districts
5.16 %
4.48 %
4.40 %
4.10 %
3.97 %
3.06 %
3.04 %
2.93 %
2.87 %
2.64 %
63.35 %
As per the new federal structure, Province 1 had the top source (at 25.51 per cent) of labour migrants followed closely by Province 2 (at 24.10 per cent). Province 7 had the least number of labour migrants in the past nine fiscal years.
Figure 7. Province wise breakdown of migrant workers, 2008/09 - 2016/178
Province 1
Province 2
Province 3
Province 4
Province 5
Province 6
Province 7
25.51 %
24.10 %16.07 %
13.01 %
16.26 %
3.41 % 1.64 %
8 The database in DOFE hitherto records information according to 75 districts. In the new Federal System, there are 77 districts, with Rukum and Nawalparasi separated into two provinces each. The data for these two districts were equally divided into two provinces they represented.

15Labour Migration for Employment | A Status Report for Nepal: 2015/2016 – 2016/2017
The top-ten source districts for migrant workers accounted for 34.64 per cent of all migrant workers in the past nine fiscal years. As per the eco-development regions determined by the National Planning Commission,9 the top-ten source districts of migrant workers belong to the Eastern and Central Tarai region and Western Tarai Region. These regions, in terms of Human Development Index (HDI) value, are neither the top nor the lowest compared to other eco-development regions.10 Considering the HDI values district wise, Mahottari had the lowest HDI (0.388) and Jhapa had the highest HDI (0.518) in 2011 among the top-ten source districts for migrant workers. The HDI value for Nepal in 2011 was 0.490 with Kathmandu valley region having the highest HDI of 0.622.
As noted in the Labour Migration for Employment - A Status Report for Nepal: 2014/15, the top-ten dis-tricts remain the geographical source of most of the migrants for foreign employment. However, there has also been a considerable increase in obtaining labour permits in other districts, mostly in the Tarai region. These districts include Bara, Rautahat, Parsa, Kapilvastu, Banke, and Kanchanpur (See Table 3). The lowest share of migrant workers obtaining labour permits is from the mountainous districts, such as Humla, Mugu, Dolpa, Mustang, and Manang.
Table 3. Districts with significantly increasing trend in obtaining labour permits, 2008/09 - 2016/17Percentage share of total migrants
District 2008/09 2009/10 2010/11 2011/12 2012/13 2013/14 2014/15 2015/16 2016/17Total
share in nine years
Bara 1.08 % 1.12 % 1.73 % 1.60 % 1.76 % 1.90 % 1.95 % 2.00 % 2.32 % 1.80 %Rautahat 0.95 % 0.95 % 1.37 % 1.27 % 1.58 % 1.83 % 2.05 % 2.04 % 2.45 % 1.73 %Kapilvastu 0.75 % 0.97 % 1.31 % 1.21 % 1.87 % 1.78 % 1.92 % 2.20 % 1.91 % 1.69 %Banke 0.61 % 0.83 % 1.05 % 0.98 % 1.25 % 1.26 % 1.30 % 1.43 % 1.55 % 1.21 %Parsa 0.54 % 0.53 % 0.93 % 0.86 % 0.94 % 1.37 % 1.33 % 1.29 % 1.52 % 1.12 %Kanchanpur 0.41 % 0.52 % 0.61 % 0.57 % 0.71 % 0.73 % 0.76 % 0.70 % 0.76 % 0.68 %
Most of the male migrant workers between 2008/09 and 2016/17 were from the same top-ten dis-tricts. Those ten districts; however, differ from the top-ten origin districts for female migrant workers. Nearly half (48.24 per cent) of all female migrant workers who obtained a labour permit over the nine-year period were from Jhapa, Sindhupalchowk, Morang, Makwanpur, Kathmandu, Kavrepalanchowk, Sunsari, Nuwakot, Ilam, and Chitwan (See Figure 7). A geographical distinction is noticeable. Most of the men in foreign employment were from the southern Tarai while most of the women were from the hilly regions, although the southern Jhapa, Morang, Sunsari, and Chitwan districts each had a somewhat large share of female migrants as well.
9 Nine eco-development regions as per National Planning Commission, presented in Nepal Human Development Report 2014 and their HDI values in 2011: (a) Eastern and Central Mountains (0.475); (b) Eastern and Central Hills (0.490); (c) Eastern and Central Tarai (0.463); (d) Kathmandu Valley (0.622); (e) Western Hills (0.511); (f) Western Tarai (0.480); (g) Western, Mid-Western and Far-Western Mountains (0.398); (h) Mid-Western and Far-Western Hills (0.423); Mid-Western and Far-Western Tarai (0.472)
10 See NPC (2014)

Labour Migration for Employment | A Status Report for Nepal: 2015/2016 – 2016/2017 16
Figure 8. Top-ten source districts for female migrant workers, 2008/09 - 2016/178.84 %
51.91 %7.51 %
5.80 %
4.75 %
4.45 %
3.90 %
3.53 %
3.52 %
3.07 %2.86 %
Jhapa
Sindhupalchowk
Morang
Makwanpur
Kathmandu
Kavrepalanchowk
Sunsari
Nuwakot
Ilam
Chitwan
Remaining 65 districts
A key concern in the aftermath of the devastating earthquake - 2015 is its possible effect on the trend of labour migration in the government declared 14 ‘crisis-hit’ districts. The data indicate a decreasing trend in obtaining labour permits in all the ‘crisis-hit’ districts since FY 2014/15. These districts had a gradual increase in obtaining labour permits preceding the earthquake annually. However, there is no clear evidence to suggest a correlation that the decrease was caused by the disaster and may reflect the overall decrease in trends in the past two fiscal years.
Table 4. Labour migration trend in 14 crisis-hit districts by earthquake in 2015
Crisis-hitdistricts 2008/09 2009/10 2010/11 2011/12 2012/13 2013/14
2014/15 (earthquake
year)2015/16 2016/17
Makwanpur 2 865 3 447 3 635 4 832 9 288 10 759 9 859 7 705 6 472Dhading 2 396 3 777 5 015 5 479 7 953 8 706 8 143 6 028 4 829Kavrepalanchowk 2 564 2 754 2 843 4 372 8 588 9 387 8 511 6 115 5 417Sindhupalchowk 2 680 2 814 2 497 3 782 8 759 9 901 7 806 5 865 5 332Sindhuli 2 416 3 332 3 828 5 091 7 070 8 148 8 095 5 994 5 150Gorkha 3 100 3 348 3 717 4 415 6 672 7 604 7 130 5 440 4 631Nuwakot 2 370 2 479 2 774 3 831 7 291 8 149 7 427 5 112 4 369Kathmandu 2 215 1 546 2 325 3 346 6 870 7 175 6 095 4 873 4 150Ramechap 1 616 1 907 2 241 3 242 5 119 6 154 5 636 4 023 3 268Dolakha 1 530 1 707 1 754 2 361 4 494 5 186 4 881 3 183 2 750Okhaldhunga 1 525 1 668 1 904 1 991 3 562 4 329 4 421 3 140 2 524Lalitpur 1 123 945 1 060 1 791 2 942 3 328 2 833 2 100 1 824Bhaktapur 805 642 988 1 254 1 671 1 895 1 652 1 289 1 051Rasuwa 451 555 391 646 1 217 1 123 932 613 429

17Labour Migration for Employment | A Status Report for Nepal: 2015/2016 – 2016/2017
2.4 Renewal of permits
If any worker, on the expiry of his or her contract, wants to return to the same country of destination for the same job, his or her work permit is renewed. The data on the renewal of permits are only avail-able since 2011/12, which show a steady increase. In the past six fiscal years, 1,196,687 labour permits were renewed comprising 96.04 per cent male and 3.96 per cent female. Notably, there was a declining trend in obtaining new labour permits, whereas there was a significant increase in renewal of permits. Although no specific information is available, the increase numbers suggest some degree of job security and job satisfaction among the migrant workers.
Figure 9. Trend in renewal of labour permits, 2011/12 - 2016/17
Male
Female
Total
300 000
250 000
200 000
150 000
100 000
50 000
02011/12 2012/13 2013/14 2014/15 2015/16 2016/17
153 690164 527
176 286
204 730
238 088
259 366
246 035
224 917
195 719
172 213160 258
150 175
Most of the labour permits renewed were for Qatar, Saudi Arabia, UAE, Malaysia, Kuwait, Bahrain, Oman, Japan, Macau China, and Israel. The total renewals of labour permits to these 10 countries constituted 98.70 per cent of all renewals between FY 2012/13 and 2016/17.11 The large number of renewals in these destination countries, particularly GCC countries and Malaysia, corresponds to the large number of labour permits issued to these destinations in the preceding years. The number of permits renewed for Macau, China and Israel is remarkable considering the low share of migrant workers obtaining labour permits in preceding years while Malaysia accounted for only 8.63 per cent of total renewal, which seems low, in view of the high volume of workers leaving for that country in preceding years.
11 Disaggregated information was not available for 2011/12.
3 515 4 269 4 073 9 011 13 171 13 331

Labour Migration for Employment | A Status Report for Nepal: 2015/2016 – 2016/2017 18
Figure 10. Top-ten destination countries for renewal of permits, 2012/13 - 2016/17
1.31 %0.36 %0.37 %0.59 %1.28 %
4.59 %1.58 %
8.63 %
20.28 %
28.25 %
32.76 %
Qatar
Saudi Arabia
UAE
Malaysia
Kuwait
Bahrain
Oman
Japan
Macau, China
Israel
Remaining countries
The overall trend on labour migration is male dominant. Similarly, the renewal of labour permits for male migrant workers in the top-ten destination countries was consistent with the overall trend, with the exception of the Maldives among the top ten instead of Israel. The pattern for female migrant workers’ renewal of permits corresponded with their top destination countries. Most of the labour permits renewed by female migrants were for UAE, Kuwait, Qatar, Israel, Malaysia, Oman, Lebanon, Bahrain, Saudi Arabia and Cyprus (Figure 11).
Figure 11. Top-ten destination countries for renewal of permits, female migrant workers, 2012/13 - 2016/17
35.39 %
28.19 %
5.75 %
5.29 %
3.56 %
3.37 %
3.36 %
2.20 %
1.71 %1.20 %
9.98 %
UAE
Kuwait
Qatar
Israel
Malaysia
Oman
Lebanon
Bahrain
Saudi Arabia
Cyprus
Besides the renewal of permits issued by the DOFE, the records of EPS Korea Section illustrate that 3,838 migrant workers in the Republic of Korea, on completion of their initial four years and ten-month contract, extended their jobs.

19Labour Migration for Employment | A Status Report for Nepal: 2015/2016 – 2016/2017
2.5 Mode of migration: Using a recruitment agency or migrating independently
An aspirant migrant worker can use two channels to gain foreign employment: using a recruitment agency or finding a job on their own. Over the past nine fiscal years, 82.52 per cent of labour permits were issued through the agency services. The first reason for using a recruitment agency is the bulk labour demand from certain destination countries. The second reason is the growing number and net-work of recruitment agencies that facilitate foreign employment.
Figure 12. Proportion of labour permits issued, by mode of migration, 2008/09 - 2016/17
100.00 %
90.00 %
80.00 %
70.00 %
60.00 %
50.00 %
40.00 %
30.00 %
20.00 %
10.00 %
0.00 %
76.57 %
67.94 % 67.60 %
87.75 %84.89 %
89.86 % 90.89 % 92.44 %
7.56 %9.11 %10.14 %15.11 %12.25 %
32.40 %32.06 %
23.43 %25.49 %
74.51 %
2011/122010/112009/102008/09 2012/13 2013/14 2014/15 2015/16 2016/17
Via recruitment agency
Individually
Figure 9 illustrates a steady increase in migrant workers using recruitment agencies over the past nine fiscal years. As noted in the previous report, the decline in obtaining an individual labour permit oc-curred as the Government issued a directive for receiving labour permits through the individual pro-cess in 2012 in a bid to better regularize and protect the migration process. The directive has helped the Government gather more information on the nature of jobs and sponsors in destination countries involved in the individual process, which has subsequently helped in providing best protection of mi-grant workers.
The proportion of female migrant workers using a recruitment agency in the past nine years was 55.64 per cent while the number stood at 83.88 per cent for male labour migrants. The proportion of female workers migrating using an independent permit was high in earlier years as the law allowed for seeking a job as a domestic worker only on a personal basis. Then after, the amended regulation provisioned that only the recruitment agencies could provide such services. Hence, the high proportion of women migrant workers through the independent permit request until 2011/12 has declined rapidly.

Labour Migration for Employment | A Status Report for Nepal: 2015/2016 – 2016/2017 20
2.6 Regularized data
The DOFE database that tracks the total number of labour permits issued also includes previously unregistered migrants who went abroad for employment but returned for acquiring a labour permit for the same destination country. A total of 186,204 labour permits were issued and recorded under this category between 2012/13 and 2016/17 of which 90.10 per cent were issued to men.
Figure 13. Number of previously unregistered migrant workers who applied for and received a labour permit, 2012/13 – 2016/17
2016/17
2015/16
2014/15
2013/14
2012/13
0 20 00010 000 30 000 40 000 50 000 60 000
2 17618 250
22 6992 656
3 86336 672
6 52755 284
34 868
3 209
Male
Female
Since the data was recorded in FY 2012/13, the number of regularized data has gradually decreased. Though the numbers are not much indicative, it might suggest that more migrant workers are depart-ing through regular channels of migration with the labour permits. While in the preceding years to 2012/13, many workers emigrated undocumented and returned to obtain a permit, there seems to a lower number of those being regularized in the subsequent years.
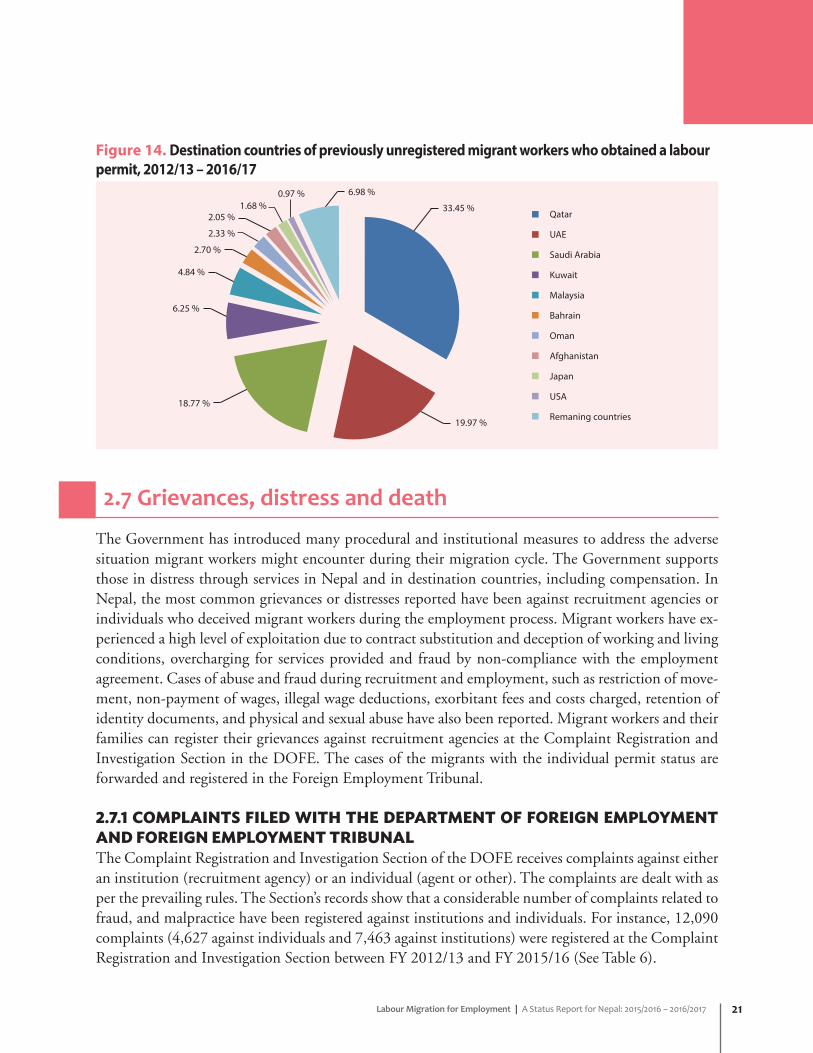
The data showed that previously unregistered migrants obtained a labour permit for employment in 136 destination countries. Of them, Qatar, UAE, Saudi Arabia, Kuwait, Malaysia, Bahrain, Oman, Afghanistan, Japan and USA had the larger numbers of permits (93.02 per cent) granted (Figure 11). These countries are popular destinations for migrant workers. However, a surprise appearance on the list is USA where 1,503 men and 311 women have been recorded since FY 2012/13.
21Labour Migration for Employment | A Status Report for Nepal: 2015/2016 – 2016/2017
Figure 14. Destination countries of previously unregistered migrant workers who obtained a labour permit, 2012/13 – 2016/17
Qatar
UAE
Saudi Arabia
Kuwait
Malaysia
Bahrain
Oman
Afghanistan
Japan
USA
Remaning countries
0.97 % 6.98 %
33.45 %
19.97 %
2.05 %
2.33 %
2.70 %
4.84 %
6.25 %
18.77 %
1.68 %
2.7 Grievances, distress and death
The Government has introduced many procedural and institutional measures to address the adverse situation migrant workers might encounter during their migration cycle. The Government supports those in distress through services in Nepal and in destination countries, including compensation. In Nepal, the most common grievances or distresses reported have been against recruitment agencies or individuals who deceived migrant workers during the employment process. Migrant workers have ex-perienced a high level of exploitation due to contract substitution and deception of working and living conditions, overcharging for services provided and fraud by non-compliance with the employment agreement. Cases of abuse and fraud during recruitment and employment, such as restriction of move-ment, non-payment of wages, illegal wage deductions, exorbitant fees and costs charged, retention of identity documents, and physical and sexual abuse have also been reported. Migrant workers and their families can register their grievances against recruitment agencies at the Complaint Registration and Investigation Section in the DOFE. The cases of the migrants with the individual permit status are forwarded and registered in the Foreign Employment Tribunal.
2.7.1 COMPLAINTS FILED WITH THE DEPARTMENT OF FOREIGN EMPLOYMENT AND FOREIGN EMPLOYMENT TRIBUNALThe Complaint Registration and Investigation Section of the DOFE receives complaints against either an institution (recruitment agency) or an individual (agent or other). The complaints are dealt with as per the prevailing rules. The Section’s records show that a considerable number of complaints related to fraud, and malpractice have been registered against institutions and individuals. For instance, 12,090 complaints (4,627 against individuals and 7,463 against institutions) were registered at the Complaint Registration and Investigation Section between FY 2012/13 and FY 2015/16 (See Table 6).

Labour Migration for Employment | A Status Report for Nepal: 2015/2016 – 2016/2017 22
Tabl
e 5.
Com
plai
nts
and
sett
lem
ents
, 201
2/13
-201
6/17
Fisc
al Y
ear
2012
/13
2013
/14
2014
/15
2015
/16
2016
/17
Indi
vidu
alIn
stit
utio
nal
Indi
vidu
al
Inst
itut
iona
lIn
divi
dual
Inst
itut
iona
lIn
divi
dual
Inst
itut
iona
lIn
divi
dual
Inst
itut
iona
lN
o. o
f com
plai
nts
1 245
1 060
974
1 577
773
1 906
704
1 468
931
1452
Am
ount
cla
imed
(N
PR)
839
380
607
331 5
51 6
1075
8 29
3 74
427
6 17
7 80
947
1 109
083
262
797
747
475
334
241
219
762
261
321 7
76 6
8643
6 06
5 11
8
Am
ount
Set
tled
(NPR
)82
191 1
3049
389
037
92 3
59 3
5665
383
483
77 4
83 0
0046
026
900
55 6
38 5
2548
039
560
69 10
3 33
890
314
470
No.
of r
epor
ted
com
plai
nts
sett
led
202
350
151
303
7458
994
426
159
687
Cases
File
d in
cou
rt16
414
128
516
51
222
426
552
Am
ount
(N
PR) fi
led
in c
ourt
396
543
949
40 2
14 2
5043
6 41
6 43
73
691 5
0028
9 24
3 84
60
378
789
428
016
6 54
2 85
61 5
00 0
00
Dec
ision
by
the
DO
FE0
390
450
20
14N
AN
A
Pena
lty
(NPR
) de
cide
d by
th
e D
OFE
04
500
000
04
600
000
015
0 00
00
1 400
000
02
810
000

23Labour Migration for Employment | A Status Report for Nepal: 2015/2016 – 2016/2017
As illustrated in Figure 15, the DOFE has made available the information on a number of complaints filed according to the destination countries of the migrant workers. The data since FY 2014/15 show that the migrants who departed for Malaysia, Saudi Arabia, Qatar, and UAE filed a maximum number of complaints, where 75.23 per cent of all complaints registered between FY 2014/15–2016/17 were against individual and institutions who sent the workers to these four countries. This corresponds to the high number of migrant workers leaving for those countries in preceding years. However, the list also contains USA, Russia, Australia, and Canada, which receive only a small proportion of Nepali migrant workers annually. This suggests that grievances of migrant workers are not limited to major corridors of migration but are prevalent across countries.
Figure 15. Destination countries of migrant workers who filed complaint against individual and institution at the DOFE, 2014/15 - 2016/17
12.83 %
1 %
1.74 %2.01 %
2.02 %2.09 %
3.07 %
11.23 %
13.34 % 15.43 %
35.24 %Malaysia
Saudi Arabia
Qatar
UAE
Japan
USA
Macau, China
Canada
Russia
Australia
Remaning (59 countries)
The DOFE database provides information about the nature of the registered complaints. Even though 6,831 complaints were registered between FY 2014/15 and 2016/17, only the information on 5,484 such complaints is available in this database. This is because some data were yet to be filtered and digi-tized. The registered complaints were recorded under 33 separate headings and of them, “Prosecute the accused and reimbursement and compensation” was the most cited nature of complaints (See Table 6). The five most cited nature of complaints constituted 75 per cent of all recorded complaints. While the categories specified do not imply that the cases were proven or settled, it indicates the nature of distress faced by the migrant workers and their families. A noteworthy category to consider is “repatriation” – either independently categorized or tagged along with other categories - since it means that many migrants are waiting to come back home from an adverse situation. Other categories on the list showed complaints registered to “repossess passport” from recruitment agencies and “rescue” from destination countries. The number of complaints is higher against institutions or recruitment agencies because the majority of the migrant workers use that medium.

Labour Migration for Employment | A Status Report for Nepal: 2015/2016 – 2016/2017 24
Table 6. Most cited nature of complaints registered at DOFE, 2014/15 - 2016/17Nature of complaints 2014/15 2015/16 2016/17 Total Count
Ind. Ins. Ind. Ins. Ind. Ins. Ind. Ins. Total“Prosecute the accused, reimburse and compensate”
270 620 671 485 43 34 984 1 139 2 123
“Prosecute, reimburse, compensation and repatriation”
6 340 7 238 1 27 14 605 619
“Compensation” 0 198 0 46 10 352 10 596 606“Prosecute and compensate” 0 92 0 188 145 119 145 399 544“Repatriation” 1 192 0 30 0 14 1 236 237
*Ind. – Migrated independently; Ins. – Via recruitment agency
The cases forwarded by the DOFE are registered at the FET. The Tribunal tries and settles cases other than those punishable by the DOFE as per the FEA, 2007. Particularly, the DOFE cannot take deci-sions about individual cases, and it must refer such cases to the Tribunal. The records at the Tribunal show that over the eight years, a total of 1,492 cases have been registered out of which 1,134 cases have been cleared (Table 8). The case settlement at the Tribunal has been efficient as the percentage of cases cleared each year is increasing. However, 21 cases of more than two years old were still unsettled.
Table 7. Cases at the Foreign Employment Tribunal, by year and status, 2009/10 - 2016/17Fiscal Year New cases Total cases (new
and carried over)Cases cleared Cases remaining Cases clearance
percentage2009/10 158 158 16 142 10.132010/11 120 262 78 184 29.772011/12 186 370 124 246 33.512012/13 178 424 163 261 38.442013/14 134 395 151 244 38.232014/15 175 419 213 206 50.802015/16 230 436 185 251 42.432016/17 311 562 204 358 64.55Total 1 492 - 1 134 - -
The distress faced by migrant workers in destination countries is also reflected in the number of res-cues requested to the embassies in destination countries via the DOCS, under the Ministry of Foreign Affairs. The Department started online application for the rescue request since FY 2016/17, which showed 227 rescue requests made through that medium. The request can be made either by migrant workers or someone in their family or their acquaintances. Of the 227 rescue requests registered, ma-jority were for migrant workers in Saudi Arabia, Malaysia and Kuwait and UAE (See Table 7). The number of rescue request does not imply whether repatriation was successful.

25Labour Migration for Employment | A Status Report for Nepal: 2015/2016 – 2016/2017
Table 8. Destination countries stated in the rescue request, 2016/17Destination countries of migrant workers stated in the rescue requests made at the Department of Consular Services Total count
Saudi Arabia 72Malaysia 65Kuwait 25UAE 19Qatar 12Oman 12Lebanon 4Afghanistan 4China 3USA 2Cyprus 2Uganda 1Turkey 1Republic of Korea 1Mauritius 1Indonesia 1Egypt 1Australia 1
2.7.2. COMPENSATION THROUGH THE MIGRANT WORKERS’ WELFARE FUNDThe FEPB maintains information on those who have sustained injuries or an illness that resulted in disability and/or loss of job and on the deaths of migrant workers. The Board provides compensation to such workers12 or their nominated beneficiaries as per the Foreign Employment Rule, 2008 and col-lects data in the process. However, this information is limited to migrant workers or family members who seek help and request for compensation from the agency. Thus, the data may not reflect all deaths and disability-related injuries of Nepali migrant workers. The information, nonetheless, is perceived as an indicator of the problems.
Table 9. Reported numbers of migrant workers physically disabled during their foreign employment, by sex, 2008/09 - 2016/17
Fiscal YearSex
TotalMale Female
2008/09 8 0 82009/10 9 2 112010/11 29 0 292011/12 54 213 56
12 The compensation is provided from the Foreign Employment Welfare Fund, established by the Foreign Employment Act 2007.

Labour Migration for Employment | A Status Report for Nepal: 2015/2016 – 2016/2017 26
Fiscal YearSex
TotalMale Female
2012/13 89 4 932013/14 108 7 1152014/15 180 4 18413
2015/16 111 5 1162016/17 200 6 206Total 788 30 818
In total, 818 migrant workers received compensation for a disability from the FEPB between FY 2008/09 – 2016/17, of which 788 were men and 30 were women (See Table 10). The increasing trend suggests that more migrant workers have access to the compensation mechanism, which might have been used less in the initial years due to lack of information among the migrants. Most incidences of disability were recorded for Malaysia (45.59 per cent), followed by Saudi Arabia (21.14 per cent) and Qatar (16.13 per cent).
Table 10. Reported cases of disability, by destination country, 2008/09 - 2016/17Country 2008/09 2009/10 2010/11 2011/12 2012/13 2013/14 2014/15 2015/16 2016/17 Total
Malaysia 3 4 15 27 38 47 106 67 66 373Saudi Arabia 3 1 6 16 20 30 30 18 49 173Qatar 1 2 2 3 15 18 30 12 49 132UAE 1 1 5 6 10 13 9 12 22 79Kuwait 0 0 1 2 7 6 4 3 8 31Bahrain 0 1 0 0 2 1 2 1 1 8Republic of Korea 0 0 0 0 1 0 0 3 3 7Afghanistan 0 0 0 0 0 0 0 0 5 5Oman 0 1 0 1 0 0 2 0 0 4Lebanon 0 1 0 1 0 0 0 0 0 2Macau, China 0 0 0 0 0 0 0 0 2 2Cyprus 0 0 0 0 0 0 0 0 1 1Total 8 11 29 56 93 115 183
(+1 un-known)
116 206 817(+1 un-known)
The records on the reported disabilities over the past nine years reveal that most incidents occurred due to “workplace accidents”, followed by disease, traffic accidents and physical fighting. Workplace accidents indicate challenges and concerns regarding occupational safety and health. Similarly, traffic accident reported as the third main cause for disabilities reflects inadequate knowledge of the local context of the country in which the migrant worker is employed.
13 There was an error in the presentation of the data in the previous report. In the earlier report, this was reported as 181.

27Labour Migration for Employment | A Status Report for Nepal: 2015/2016 – 2016/2017
Figure 16. Reported causes of injury and disability, 2008/09 - 2016/17
1.11 %0.98 %8.92 %
18.58 %
70.41 %
Workplace accident
Disease
Traffic accident
Fighting
Other causes (unspecified)
A total of 5,892 deaths of migrant workers occurring in 29 destination countries were reported to the FEPB from 2008/09 to 2016/17 (Table 14). There has been slight decrease in the number of reported deaths in the last two fiscal years.
Table 11. Total reported number of migrant workers’ deaths during foreign employment, by sex, 2008/09 - 2016/17
Fiscal YearSex
TotalMale Female
2008/09 87 3 902009/10 399 19 4182010/11 541 8 5492011/12 632 14 6462012/13 716 11 7272013/14 864 24 8882014/15 1 000 6 1 00614
2015/16 789 24 8132016/17 737 18 755Total 5 765 127 5 892
Most deaths over the past nine fiscal years occurred in Malaysia (2,154 counts), Saudi Arabia (1,638 counts), Qatar (1,203 counts), UAE (427 counts) and Kuwait (186 counts) which are the main coun-tries of destination for Nepali migrant workers. Deaths of migrant workers were recorded for at least 28 destination countries (See Annex).
14 There was an error in the presentation of the data in the previous report. Only 1,004 was reported in the previous report.

Labour Migration for Employment | A Status Report for Nepal: 2015/2016 – 2016/2017 28
Figure 17. Reported proportion of death, by destination country, 2008/09 – 2016/17
Malaysia
Saudi Arabia
Qatar
UAE
Kuwait
Bahrain
Republic of Korea
Oman
Lebanon
Afghanistan
Remaining (18 countries)
36.56 %
0.74 %0.32 %0.34 %
0.80 %
20.41 %
7.25 %3.16 %
1.31 %1.31 %
27.80 %
There is an evidence of more deaths in the destination countries than those recorded at the FEPB. The DOCS provided some information on deaths from their records obtained from the embassies in the destination countries. It showed that more deaths had occurred in the destination countries than re-corded at the FEPB. This suggests that not all deaths are compensated although it must be considered that the FEPB requires labour permit records of the migrant workers to access compensation.
Table 12. Difference in total deaths recorded at DOCS and FEPBCountry Fiscal Year Total deaths as per the
Department of Consular ServiceTotal deaths as per the Foreign Employment Promotion Board
UAE 2013 – 2017 317 274Kuwait 2007 – 2017 331 186Bahrain 2007 – 2017 111 77Oman 2008 – 2017 74 47
Note: The timeframe of data is presented as it was available.
Similarly, the records of EPS Korea Section showed that 76 migrant worker sent through this medium died during employment between 2008 and 2017. A total 77 deaths were compensated at the FEPB dur-ing the same period though it also records those who might have migrated independently and not used EPS system. Further disaggregation of data from the DOCS and EPS Korea Section was not available.
When disaggregated by sex, the men and women who died while working in a GCC country or Malaysia combined accounted for 97 per cent and 85 per cent, respectively, of all deaths. The large number of deaths in these countries is associated with the flow of the Nepali migrant workers to these countries. The highest number of male deaths was recorded for Malaysia while the largest number of deaths among female migrant workers occurred in Kuwait.

29Labour Migration for Employment | A Status Report for Nepal: 2015/2016 – 2016/2017
Figure 18. Reported number of deaths in top destination countries, 2008/09 – 2016/17
2 500
2 000
1 500
1 000
500
0
2 127
1 635
1 195
398
298327149
37 45 75 16 772 2 4 0
Male
Female
Malaysia Qatar UAE Kuwait Oman Bahrain LebanonSaudiArabia
Republicof Korea
The major causes of deaths of the migrant workers were natural death (1,351 cases), cardiac arrest (1,152 cases) and traffic accident (798 cases) (see Table 13). The death by natural causes for male was 23 per cent and the death of female by suicide causes was 33 per cent. The death of male by suicide is as high as 10 per cent.
The classification of cause of death in the current system at FEPB and the subsequent findings in terms of numbers of death under each category reflect a significant grey area in the causes of death. First, many categories under which the cause of death of a migrant worker is classified are ambiguous and coupled with the lack of information it can lead to speculative conclusions that need further research. For instance, large numbers of death are recorded under ‘unidentified causes’ or ‘natural death’ while it is noteworthy that migrant workers take a medical test before departure and are allowed to travel only when they are deemed fit. Second, if the available information is taken at face value, then it suggests an emerging public health problem that needs deeper understanding, backed by systematic analysis and immediate intervention. Thus, to understand further, the causes of the migrant workers’ death, an in-depth investigation of the autopsies and medical records in the destination countries would require.

Labour Migration for Employment | A Status Report for Nepal: 2015/2016 – 2016/2017 30
Table 13. Reported cause of death among labour migrants while working abroad, by sex, 2008/09 - 2016/17
Fiscal year
Causes of deathCardiac arrest
Heart attack
Murder Natural death
Suicide Traffic accident
Workplace accident
Other or uniden-
tified causes
Under investi-gation
Total
M F M F M F M F M F M F M F M F M F2008/09 25 1 2 0 1 0 24 0 8 1 8 0 6 0 13 1 0 0 90
2009/10 104 2 10 0 1 0 110 8 21 4 65 2 41 3 47 0 0 0 418
2010/11 100 0 48 0 40 0 114 4 60 2 60 0 59 2 60 0 0 0 549
2011/12 134 0 37 0 2 0 102 0 61 5 97 4 39 2 160 3 0 0 646
2012/13 115 1 31 1 2 0 105 1 76 5 104 0 27 0 256 3 0 0 727
2013/14 190 0 73 6 1 0 137 1 87 9 110 2 78 1 188 5 0 0 888
2014/15 268 0 88 2 0 0 247 0 110 3 120 1 113 0 54 0 0 0 1 006
2015/16 144 4 91 3 3 0 242 4 100 9 101 2 80 1 28 1 0 0 813
2016/17 64 0 64 0 1 0 246 6 84 5 118 4 59 2 97 1 4 0 755
Total 1 144 8 444 12 51 0 1 327 24 607 43 783 15 502 11 903 14 4 0 5 892
In the previous report, information available on causes of death as per destination country was pre-sented, which could not be updated for FY 2015/16 and 2016/17 because the database at the FEPB recently underwent upgrading, and some data remain to be filtered and digitized. Considering the importance of the available information, data for seven fiscal years, FY 2008/09 – FY 20014/15 is presented in the tables below.
Table 14. Causes of death in Malaysia and GCC countries, 2008/09 - 2014/15
Country
Total number of deaths Causes of deathMale Female Total Cardiac
arrestHeart attack
Natural cause
Other or unidenti-
fied causes
Traffic acciden
Suicide Workplace accident
Murder
Malaysia 1 545 17 1 562 291 132 166 546 83 144 136 19Saudi Arabia
1 158 3 1 162 (+1 sex
unknown)
61 28 485 34 340 60 118 1
Qatar 927 5 932 462 45 65 140 49 54 81 22UAE 309 16 326
(+1 sexunknown)
98 35 62 29 46 26 18 3
Kuwait 105 24 129 6 43 7 16 24 18 2 2Oman 38 1 39 4 2 12 7 7 4 3 0Bahrain 61 0 61 5 1 32 3 12 3 6 0Total 4 143 66 4 211 927 286 829 775 561 309 364 47

31Labour Migration for Employment | A Status Report for Nepal: 2015/2016 – 2016/2017
Table 14 highlights causes of death in Malaysia and GCC countries because most of the reported deaths of migrant workers occurred in the destination countries. The data reveal that most of the deaths reported as “other or unidentified” occurred in Malaysia (546 deaths) and Qatar (140 deaths). The largest number of cases of cardiac arrest was reported for Qatar (462 deaths), while the largest numbers of deaths categorized as the natural cause were in Saudi Arabia. Death by traffic accident was highest in Saudi Arabia, at nearly 60 per cent of all traffic accidents related deaths. The larger number of suicides occurred in Malaysia (144 deaths), Saudi Arabia (60 deaths) and Qatar (54 deaths). More disaggregated data in terms of cause wise by sex in destination countries is presented in table 15-21.
Table 15. Reported number of deaths by suicide in destination countries, by sex, 2008/09 - 2014/15
Country
Suicide
2008/09 2009/10 2010/11 2011/12 2012/13 2013/14 2014/15 Total
M F M F M F M F M F M F M F M+F
Malaysia 2 - 4 37 25 2 34 - 41 - 43 1 189SaudiArabia
1 - 3 1 8 14 - 17 - 18 - 33 - 95
Qatar 2 - 11 8 - 7 - 15 - 13 - 12 - 68UAE 3 - 1 2 1 8 3 6 3 6 1 34Kuwait - - 2 1 2 1 3 4 5 9 1 28Republic of Korea - - 3 3 3 3 5 - 17Lebanon - 1 1 1 1 - - 2 - 1 - 1 - - 8Oman - - 1 - - - 2 - 1 - - - - - 4Bahrain - - - - 1 - - - 1 - 1 - 1 - 4Israel - - - - - - - - - 1 - - - - 1Japan - - - - - - - - 1 - - - - - 1Russia - - - - - - - - 1 - - - - - 1Papua New Guinea
- - - - - - - - - - 1 - - - 1
Total 8 1 21 4 60 2 61 5 76 5 87 9 109 3 451
Table 16. Reported number of deaths as other or unidentified in destination countries, by sex, 2008/09 - 2014/15
Country
Other or unidentified causes
2008/09 2009/10 2010/11 2011/12 2012/13 2013/14 2014/15 Total
M F M F M F M F M F M F M F M+F
Malaysia 7 - 18 - 51 - 124 1 174 2 124 1 44 - 546Qatar 4 - 22 - 1 - 20 - 40 - 45 - 8 - 140Saudi Arabia 1 - 3 - 3 - 3 - 14 - 7 - 3 - 34
UAE 1 - 3 - 2 - 8 - 12 - 2 - 1 - 29

Labour Migration for Employment | A Status Report for Nepal: 2015/2016 – 2016/2017 32
Country
Other or unidentified causes
2008/09 2009/10 2010/11 2011/12 2012/13 2013/14 2014/15 Total
M F M F M F M F M F M F M F M+F
Kuwait - - - - - - 3 2 6 1 1 3 - - 16Republic of Korea - - - - 1 - 2 - 6 - 5 - - - 14
Oman - - - - - - - - 1 - 5 - 1 - 7Afghanistan - - - - 2 - - - 1 - - - 1 - 4Bahrain - - 1 - - - - - 1 - - - 1 - 3Lebanon - 1 - - - - - - - - - - - - 1Russia - - - - - - - - 1 - - - - - 1Israel - - - - - - - - - - - - - - 0Japan - - - - - - - - - - - - - - 0Papua New Guinea - - - - - - - - - -
- - - - 0
Total 13 1 47 0 60 0 160 3 256 3 189 4 59 0 795
Table 17. Reported number of deaths by natural cause in destination countries, by sex, 2008/09 - 2014/15
CountryNatural cause
2008/09 2009/10 2010/11 2011/12 2012/13 2013/14 2014/15 TotalM F M F M F M F M F M F M F M+F
Saudi Arabia 16 51 1 58 75 80 93 111 485Malaysia 1 31 3 26 2 10 4 7 82 166Qatar 4 1 9 2 18 31 65UAE 3 14 10 5 7 11 12 62Bahrain 1 5 8 5 7 3 3 32Oman 3 1 1 1 4 2 12Kuwait 1 2 1 2 1 7Lebanon 3 2 1 6Republic of Korea
1 1 1 3
Israel 1 1 1 3Libya 1 1Sri Lanka 1 1Japan 1 1Italy 1 1Germany 1 1USA 1 1Mauritius 1 1Total 24 0 110 8 114 4 102 0 105 1 137 1 242 0 848

33Labour Migration for Employment | A Status Report for Nepal: 2015/2016 – 2016/2017
Table 18. Reported of deaths by workplace accident in destination countries, by sex, 2008/09 - 2014/15
CountryWorkplace accident
2008/09 2009/10 2010/11 2011/12 2012/13 2013/14 2014/14 TotalM F M F M F M F M F M F M F M+F
Malaysia 2 - 11 - 37 1 9 - 2 - 24 - 50 - 136Saudi Arabia 3 - 14 - 14 - 21 - 17 - 21 - 28 - 118Qatar - - 12 1 2 - 3 - 4 - 29 - 30 - 81UAE 1 - 3 1 3 - 2 - 2 - 1 1 4 - 18Bahrain - - - - 2 - - - 2 - 1 - 1 - 6Lebanon - - - 1 1 - 1 - - - - - 3Oman - - 1 - - - 1 - - 1 - - - 3Kuwait - - - 1 - 1 - - - - - - 2Israel - - - - - - 1 1 - - - - - 2Republic of Korea
- - - - - - - - - - 1 - - - 1
Japan - - - - - - 1 - - - - - - 1Total 6 0 41 3 59 2 39 2 27 0 78 1 113 0 371
Table 19. Reported number of deaths by traffic accident in destination countries, by sex, 2008/09 - 2014/15
CountryTraffic accident
2008/09 2009/10 2010/11 2011/12 2012/13 2013/14 2014/15 TotalM F M F M F M F M F M F M F M+F
Saudi Arabia 4 - 42 1 40 - 59 - 71 - 66 - 57 - 340Malaysia - - 14 - 2 - 13 2 11 - 17 - 24 - 83Qatar - - 1 1 9 - 13 - 5 - 6 - 14 - 49UAE 2 - 7 - 6 - 4 2 6 - 9 1 8 1 46Kuwait - - - - 1 - 3 - 5 - 4 - 11 - 24Bahrain 1 - 1 - 1 - 3 - 3 - 2 - 1 - 12Republic of Korea
- - - - 1 - - 1 - 4 - 3 - 9
Oman 1 - - - - 2 - 1 - 2 1 - - 7Japan - - - - - - 1 - - - - 1Lebanon - - - - - - - - - - - - 0Total 8 0 65 2 60 0 97 4 104 0 110 2 118 1 571

Labour Migration for Employment | A Status Report for Nepal: 2015/2016 – 2016/2017 34
Table 20. Reported number of death by cardiac arrest in destination countries, by sex, 2008/09 - 2014/15
CountryCardiac arrest
2008/09 2009/10 2010/11 2011/12 2012/13 2013/14 2014/15 TotalM F M F M F M F M F M F M F M+F
Qatar 18 1 57 1 69 83 81 84 68 462Malaysia 3 22 14 31 14 63 144 291UAE 2 18 1 9 16 12 1 25 14 98Saudi Arabia 2 7 7 4 4 9 28 61Kuwait 1 3 2 6Bahrain 1 4 5Republic of Korea 2 1 2 5Oman 2 2 4Lebanon 1 1 2Afghanistan 2 2Poland 1 1Sri Lanka 1 1Japan 1 1Maldives 1 1Canada 1 1Total 25 1 104 2 100 0 134 0 115 1 190 0 269 0 941
Table 21. Reported number of death by heart attack in destination countries, by sex, 2008/09 - 2014/15
CountryHeart attack
2008/09 2009/10 2010/11 2011/12 2012/13 2013/14 2014/15 TotalM F M F M F M F M F M F M F M+F
Malaysia 2 30 20 12 29 37 2 132Qatar 1 3 9 1 4 12 15 45Kuwait 1 9 6 1 11 6 9 43UAE 3 4 5 4 10 9 35Saudi Arabia 1 3 2 3 6 13 28Republic of Korea
1 1 1 1 1 5
Oman 1 1 2Japan 2 2Afghanistan 1 1Bahrain 1 1Israel 1 1Russia 1 1Uganda 1 1Total 2 0 10 0 48 0 37 0 31 1 73 6 87 2 297

35Labour Migration for Employment | A Status Report for Nepal: 2015/2016 – 2016/2017
2.8 Recruitment agencies and other institutionsRecruitment agencies are private businesses established under the prevailing Company Act and li-censed to conduct services that facilitate foreign employment. The recruitment agencies are mandated to explore opportunities for foreign employment and arrange the recruitment process for prospective migrants. These agencies operate through agents hired to facilitate the process. Likewise, various insti-tutions also acquire a permit to provide pre-departure orientation training and medical test to migrant workers. The DOFE regularly monitors these institutions.
Table 22. Details on private institutions providing services to migrant workersDetails Total numbersRecruitment agencies registered to operate 1 130Recruitment agencies currently operating 932Branch offices of registered recruitment agencies 47Registered agents of recruitment agencies 733Orientation institutions registered to operate 118Orientation institutions currently operating 118Institutions approved to operate under JITCO agreement 222Registered institutions providing training for domestic worker jobs 18Currently operating institutions providing training for domestic worker jobs 15
2.9 Remittances
Nepal was the fourth highest remittance recipient, as a share of GDP, among all countries and the top recipient among the South Asian Association for Regional Cooperation (SAARC) countries in 2017.15 As a percentage share of GDP, there was an increase from 21.2 per cent in FY 2008/09 to 26.9 per cent in FY 2016/17.16 In other terms, Nepal received 209.7 billion NPR in remittances in 2008/09, which has increased to 699 billion NPR in 2016/17. While there has been a continuous increase in the total remittance income in the past decade, it is contingent upon the outflow of migrant workers (see Figure 1). Additionally, while the overall volume of remittance annually is large; a remittance recipient household receives an annual 80,462 NPR on average,17 which is low at an individual level.
15 World Bank (2017) 16 MOF (2017)17 MOLE (2015) National Employment Policy 2015. The Government of Nepal: Ministry of Labour and Employment.

Labour Migration for Employment | A Status Report for Nepal: 2015/2016 – 2016/2017 36
Figure 19. Remittance as share of GDP, 2008/09 - 2016/17
35
30
25
20
15
10
5
0
21.219.4
18.5
23.525.6
27.729
29.6
26.9
Remittance income/GDP in per cent
2009/10 2011/12 2013/14 2016/172015/162008/09 2010/11 2012/13 2014/15

37Labour Migration for Employment | A Status Report for Nepal: 2015/2016 – 2016/2017

Labour Migration for Employment | A Status Report for Nepal: 2015/2016 – 2016/2017 38
Labour permits being granted to potential migrant workers at the Labour Village. © ILO.
39Labour Migration for Employment | A Status Report for Nepal: 2015/2016 – 2016/2017
Labour migration governance is a priority issue for the Government of Nepal, and it remains steadfast to manage and protect the rights of the growing number of Nepali migrant workers. The response of the Government to increasing trend over time has sought to address the changing context of domestic and international labour markets. Moreover, it has also attempted to regulate, facilitate and monitor the migration processes for foreign labour employment, protect the rights of labour migrants, and build an enabling environment for investment by the returnee migrants as well as the transfer of their newly acquired skills and knowledge. The achievements of the Government are reflected in the poli-cies, laws and institutional mechanisms.
The Government’s effort at governing foreign employment began in 1985 with the enactment of the FEA. It aimed at regulating the volume of migrant workers leaving for employment to countries other than in India, which was relatively low at that time. A significant rise in the outflow of migrant work-ers came about with the democratic revolution in 1990 that resulted in government adopting a liberal economic approach to issues of labour management. It opened doors for all Nepali citizens to seek employment globally and allowed the private sector to engage intensively in the migration process. As the outflow of migrant workers increased, the Government has made necessary changes to its approach by expanding the scope of foreign employment governance and reforming its role in the migration process. Two decades after the adoption of the first FEA, the Government’s role was inclined towards promoting safe and decent foreign employment, protecting the rights of migrant workers, and regulat-ing private sectors and individuals providing services for foreign employment.
A major turning point in governing labour migration was 2007 when the Government enacted a new law considering the meteoric rise in foreign employment trend, which led to new legal and administra-tive challenges, and thus increasing demand for the protection of migrant workers. At the same time, the Government had to take account of the socio-economic impacts of labour migration in Nepal. The FEA, 2007 paved the way for establishment of a separate and dedicated department concerning foreign employment, namely the Department of Foreign Employment that regulates the migration process and also the creation of Foreign Employment Promotion Board that sought to ensure the social protection of migrant workers. Subsequently, the Foreign Employment Policy 2012, the first national policy on foreign employment was devised with an aim to integrate socio-economic dimen-sions of increasing trends in foreign employment along with providing overall guidance for regulating the migration cycle.
The Government of Nepal is cognizant of international practices on governing labour migration for employment and ensures coherency of its efforts in line with the international standards on labour and migration. The Government is a member country of ILO, and Nepal has ratified 11 Conventions that
Governing labour migrationPART 3:

Labour Migration for Employment | A Status Report for Nepal: 2015/2016 – 2016/2017 40
ensure rights to fair and decent labour practices. The Government of Nepal was elected as a Deputy Member of the Governing Body of the ILO in June 2017.
The Government of Nepal is also a regional actor on the issues of labour migration. It has been a member of the Colombo Process since 2003 and the Chair of the regional process since 2017. The Colombo Process is a regional consultative process in the management of overseas employment and contractual labour for countries of origins in Asia, and it consists of twelve Member States and eight Observer Countries.18 Likewise, Nepal is a participating country in the Abu Dhabi Dialogue, initiated since 2008, that takes a collaborative approach to address development in temporary labour mobility in Asia by building action-oriented partnerships between countries of origin and destination. In ad-dition, Nepal played a leading role together with the SAARC Secretariat to hold the first ever SAARC level discussion on regional cooperation on labour migration, which resulted in the endorsement of the Plan of Action for Cooperation on Labour Migration. The Plan of Action identified common strate-gies and acts as the region’s blueprint for collective action on labour migration.
Table 23. Time-line of key events in foreign employment governance in NepalYear Description 1985 Enactment of first law on foreign employment: Foreign Employment Act 19851992 First amendment of the Foreign Employment Act1998 Second amendment of the Foreign Employment Act1999 Enactment of Foreign Employment Rules, 19992003 The Government becomes member of the Colombo Process – a regional consultative
forum on management of foreign employment and contractual labour2007 Enactment of new law: Foreign Employment Act, 20072008 Establishment of the Foreign Employment Promotion Board
Establishment of the Department of Foreign Employment; the responsibility of which was until then overseen by the Department of Labour and Employment Promotion in the then Ministry of Labour and Transport Management. Enactment of Foreign Employment Rules, 2008
2010 Establishment of Foreign Employment Tribunal2011 First amendment of Foreign Employment Rules, 20112012 Announcement of the first, Foreign Employment Policy, 20122015 Development of five-year National Strategic Action Plan on Foreign Employment
First Amendment of Foreign Employment Act, 20072016 First SAARC-level regional consultation on labour migration held by the Government of
Nepal together with the SAARC Secretariat 2017 Nepal becomes the Chair of the Colombo Process
18 www.colomboprocess.org

41Labour Migration for Employment | A Status Report for Nepal: 2015/2016 – 2016/2017
3.1 Prevailing laws and policies
3.1.1 Foreign Employment Act, 2007The FEA, 2007 and the accompanying Rules (2008) govern all matters relating to migration for foreign employment from Nepal. The law and its Rules promote the security and welfare of foreign labour migrants with the provisions regarding the protection to their rights and for the regularization and monitoring of the businesses that facilitate the migration process. The provisions include the establishment of necessary institutional mechanisms to govern foreign employment, the creation of a welfare fund for migrant workers, insurance coverage, pre-departure orientation and training, com-pensation to migrant workers and their families, rescue and repatriation of migrant workers and their income. In addition, they specify the provision of monitoring mechanisms, such as a facility at the international airport, a mechanism to receive, investigate and adjudicate complaints as well as setting up a tribunal to settle cases and penalize perpetrators.
Keeping pace with the expanding challenges and dynamics of foreign labour migration, necessary amendments were made to the Foreign Employment Rules 2008 in 2011 and FEA, 2007 in 2015, in order to strengthen the prevailing laws and rules to make foreign employment safe, decent and digni-fied.
3.1.2 Foreign Employment Policy, 2012A Foreign Employment Policy was announced in 2012. It is the first policy of the Government to ad-dress the socio-economic dimension of the increasing trends in foreign labour employment. The policy recognizes irregularities in the managing of the migration process for employment and lack of good governance as major problems. It also recognizes that poorly informed and weakly prepared migrant workers are at greater risk of exploitation and vulnerable situations. It acknowledges the increasing trend among female labour migrants going abroad for employment and recognizes the problems that they experience during the migration process. Moreover, it heeds to the issues of families left behind and points out the need to strategize a re-integration process for returning migrants.
The policy set a goal to “ensure safe, organized, respectable and reliable foreign employment to contrib-ute to poverty reduction along with sustainable economic and social development through economic and non-economic benefits of foreign employment” and specified the following seven policy pillars:
n Identify and promote employment opportunities in the international market.n Develop skilled human resources to a competitive capacity to maximize the benefits from foreign
employment.n Make each step of the foreign employment process simple, transparent, organized and safe.n Address the concerns of female migrant workers and ensure their rights in the overall migration
cycle.

Labour Migration for Employment | A Status Report for Nepal: 2015/2016 – 2016/2017 42
n Ensure good governance in the management of foreign employment. n Marshal local, national and international resources for managing foreign employment and promote
collaborative efforts by increasing sectoral partnerships. n Help foreign labour migrants utilize their remittances for their own development as much as pos-
sible.
3.2 Institutional mechanisms
3.2.1. Ministry of Labour and EmploymentThe Ministry of Labour and Employment was established as an independent entity in 2012 after it separated from the Ministry of Labour and Transport Management. As per the Government’s Alloca-tion of Business Rules, 2012, the Ministry of Labour and Employment takes the lead in the formu-lation, implementation, coordination, monitoring and evaluation of policies, plans, and programs related to labour and employment. The objectives of the Ministry have two folds:
n to create dignified employment opportunities in line with the right to labour granted by the Con-stitution of Nepal such that unemployment and under-employment are reduced; and
n to make foreign employment safe, dignified and well-managed.
The Foreign Employment and International Labour Relations Division, within the Ministry, admin-isters all matters relating to foreign employment.
As of FY 2016/17, the work priorities related to foreign employment in line with the objectives of the Ministry were:
n strengthening and expanding of the institutional mechanisms that facilitate foreign employment;n appointing labour attaché in major destination countries;n expanding and promoting labour market in collaboration with Non-residential Nepali Association
along with protecting of the rights of the migrant workers; n collaborating with SAARC member countries and other destination countries to develop and en-
dorse Plan of Action for Cooperation on Labour Migration to include protection and support mechanisms for migrant workers;
n developing a standard format for bilateral agreements, entering into new bilateral labour agree-ments with key destination countries and reforming existing bilateral agreements;
n encouraging migrant workers to remit their income through formal banking channels and increas-ing employment domestically by facilitating productive use of remittance;
n making foreign employment inclusive to marginalized groups by increasing their access to employ-ment generating training;
n collaborating with financial institutions to increase access to credit for those entering the domestic and international labour market;

43Labour Migration for Employment | A Status Report for Nepal: 2015/2016 – 2016/2017
n strengthening the information management system regarding foreign employment;n effectively managing pre-departure orientation and preliminary training for migrant workers that
includes cultural knowledge of destination countries, protection mechanisms, and health require-ments; and
n gradually developing provisions to ensure that only skill tested and certified individuals are sent for foreign employment.
In an effort to expand its extraterritorial jurisdiction and accord more protection to its citizens abroad, the Government of Nepal has signed bilateral agreements or Memorandum of Understanding with key destination countries.
Table 24: List of bilateral agreements and Memorandum of Understanding signed by the Government of Nepal till date
Destination country Year of agreement Nature of agreementQatar 2005 General AgreementUAE 2007 Memorandum of UnderstandingRepublic of Korea 2007 Memorandum of UnderstandingBahrain 2008 Memorandum of UnderstandingJapan 2009 DirectiveIsrael 2015 Joint Pilot ProgramJordan 2017 General Agreement
While each of these instruments is different in its specific terms, all are based on a commitment to cooperate in the sending and receiving of labour and include the following:
n pre-departure responsibilities of Nepal;n procedures for recruitment of workers;n provisions pertaining to payment of a worker’s travel and recruitment costs;n provisions related to the content and form of contracts;n methods for resolving disputes;n framework for monitoring of agreements; and n validity of agreements and terms and conditions for mutually agreed extensions and revocations.
In addition to implementing the FEA, 2007, the Ministry has hitherto developed following directives and manual to ensure good governance in foreign employment:
n Directive on the Management of Sending Technical Interns to Japan, 2008n Directive for Acquiring Labour Permits through Individual Process, 2012n Standard on the Enlisting Process of Health Examination Institution for Workers going for Foreign
Employment, 2013n Manual on Registration and Renewal of Orientation Training Institutions, 2014

Labour Migration for Employment | A Status Report for Nepal: 2015/2016 – 2016/2017 44
n Guidelines Regarding Sending Domestic Workers on Foreign Employment, 2015n Standard Procedure on Monitoring of Foreign Employment Business and Orientation Training
Institutions, 2016
The Ministry launched a detailed five-year National Strategic Action Plan for the period of 2015 to 2020 that seeks to translate the objective, aim and seven pillars of the Foreign Employment Policy into reality by creating safe, organized and respectable foreign employment opportunities that will contrib-ute towards poverty reduction as well as sustainable economic and social development.
The Ministry initiated to reduce the economic burden and chances of vulnerability to fraud among workers during the migration process through implementation of the ‘Free Visa, Free Ticket’ policy. On July 2015, a ministerial directive was issued for a ‘Free Visa, Free Ticket’ policy for seven destina-tions; Bahrain, Kuwait, Malaysia, Oman, Qatar, Saudi Arabia, and UAE; and, pursuant to which, the workers going to these countries would have the costs of their visa and ticket covered by the recruit-ment agency.
The Ministry has collaborated with the United Nations and other international agencies to promote foreign employment as a safe, dignified and decent prospect for both employed migrants and perspec-tive migrants. Currently, these are the ministerial programs on affairs of foreign employment operating in collaboration with development partners:
n Safer Migration Project, 2013 – 2018n Partnership Program on Fair Recruitment and Decent Work for Women Migrant Workers in South
Asia and the Middle East, 2013 – 2018
Recent developments pertaining to foreign employment by the Ministry of Labour and Employment, 2015/16 – 2016/17, were:n undertaking regional leadership as the Chair of the Colombo Process;n elected as Deputy Member of the ILO Governing Body;n developed the Standard Procedure on Monitoring of Foreign Employment Business and Orienta-
tion Training Institutions, 2016;n carried out the first amendment of the FEA, 2007 in 2015;n monitored 127 institutions within Kathmandu valley that provide orientation training and medical
examination test pertaining to foreign employment;n negotiated and signed general agreement with Jordan19; in talks with other destination countries
such as Malaysia, Saudi Arabia, Kuwait and Oman n initiated coordination with the Ministry of Foreign Affairs and Department of Immigration to
share information system on labour migration and returnee migrant workers; andn conducted study on the utilization of remittances.
19 The government entered into agreement with Jordan in October 2017 during the time of preparing this report.

45Labour Migration for Employment | A Status Report for Nepal: 2015/2016 – 2016/2017
3.2.2 Foreign Employment Promotion BoardThe FEPB was established in 2008 according to Section 38 of the FEA, 2007 and is chaired by the Minister of Labour and Employment. It consists of 23 members, including representatives from dif-ferent ministries, Nepal Rastra Bank, civil societies, and private sector. Its major responsibilities are the promotional activities for foreign employment and ensuring the social protection and welfare of migrant workers. The Board conducts its responsibilities through the FEPB Secretariat and carries out following functions:
n conduct studies relating to international labour markets and explore new destinations; n collect, process and publish information that promotes specific jobs;n manage the Foreign Employment Welfare Fund;n conduct pre-departure orientation, skills training, and arrange emergency contact detail for each
worker that leads to their improved protection while working abroad;n formulate, implement, monitor and evaluate programs to use the skills, capital and technology of
returnee migrants and mobilize them for national interests; prescribe the qualifications for the reg-istration of businesses that provide pre-departure orientation training;
n formulate and approve the curricula of pre-departure orientation training;n formulate short- and long- term policies as required to make foreign employment safe, system-
atic and decent; carry out a comprehensive study on the implementation of the FEA and suggest amendments to the Government; and
n advise the Government on fixing of service charges and promotional costs.
The Board manages the Foreign Employment Welfare Fund that was established under the FEA, 2007. The Act has a provision for welfare fund to ensure social security and protection of migrant workers, returnee migrant workers and their families. The fund is pooled from following sources:n amount deposited by the departing migrant worker (NRs. 1,500 for three-year labour permit and
NRs. 2,500 for labour permit extending more than 3 years; paid one-time);n interests from the deposit made by foreign employment businesses when obtaining a license of
operation and license renewal cost;n amount received in the form of fees and renewal fees from Government of Nepal licensed private
recruitment agencies; n registration fees deposited by the orientation training institutions to obtain a license of operation
and their renewal;n amounts received from institutions operating foreign employment services; andn grants and assistance received from any native or foreign persons or institutions.
The Welfare Fund is utilized in following ways:n providing skill-oriented training to workers going for foreign employment;n providing monetary support and compensation to migrant workers or their families in case the
migrant worker was injured and/or disabled during foreign employment or had to be returned due to adverse conditions (as stated in Section 75 of the FEA, 2007) from destination countries;

Labour Migration for Employment | A Status Report for Nepal: 2015/2016 – 2016/2017 46
n repatriating workers to Nepal due to injuries or if the workers become helpless contravening the terms and conditions stipulated in the contract;
n repatriating dead bodies of migrant workers from destination countries when needed and provide monetary support to the family of the deceased migrant worker;
n carrying out awareness raising and promotional activities on foreign employment and safer migra-tion; and
n conducting employment generating programs for returnee migrants.
Recent developments at the FEPB, during 2016/1720, were: n monetary support provided to nominated beneficiaries of 755 migrant workers who died during
foreign employment;n monetary support provided to 206 migrant workers who were injured and/or disabled during for-
eign employment and returned back;n reimbursement of fees as per the cost incurred to 1,671 migrant workers who participated in the
two-day pre-departure orientation training to destination countries;n repatriated dead bodies of 251 migrant workers who were abandoned in destination countries and
provided free services in transporting the dead bodies of 767 migrant workers to their home in the origin district;
n rescued 51 migrant workers from destination countries in coordination with respective Nepali em-bassies;
n released funds to provide legal support for the needy migrants in destination countries;n provided scholarship funds to 1,250 children of migrant workers, who died during employment or
returned impaired and unable to work;n released funds to 107 institutions to provide skill development training to 10,000 individuals across
50 districts in all the seven provinces. A 160-hour training was provided for electrician, mason, house painting, steel (fixer), shuttering carpenter, scaffolders, cook, waiter/waitress, house-keeping, garment/tailoring and security guards;
n conducted Training of Trainers to produce 305 new trainers to deliver pre-departure orientation training;
n conducted interaction programs to raise awareness for safer migration in five districts in coordina-tion with District Coordination Committee, and in collaboration with school teachers and stu-dents in four districts and with media personnel in five districts;
n conducted awareness raising and promotional activities through production of radio program, street drama, and informative video; and
n published country-specific information in the form of brochures for major destination countries.
20 Information for FY 2015/16 was not available.

47Labour Migration for Employment | A Status Report for Nepal: 2015/2016 – 2016/2017
3.2.3 Department of Foreign Employment The restructuring of the previous Department of Labour and Employment Promotion resulted in a division that led to creation of the present DOFE and the Department of Labour. The DOFE is the key institution in facilitating and regulating foreign employment. Its objectives revolve around pro-moting safe and dignified foreign-based work opportunities, including regulating the operations of recruitment agencies and other business offering related services to ensure they conduct fair and decent practices. The Department has the following scope of work:
Policy workn carry out policy work related to the FEA, Regulation, Directives and Working Procedures;n carry out labour agreements with destination countries for foreign employment in collaboration
with relevant national and international organizations;n coordinate and collaborate in matters related to foreign employment and international migration;
Regulatory workn regulate foreign employment business, including the issuance, renewal and revocation of a license
needed to operate;n authorize a permit to institutions that provide foreign employment orientation training and their
monitoring;n register complaints related to foreign employment;n investigate and prosecute cases registered in the Department;n coordinate in providing compensation to migrant workers; andn support in rescue of migrant workers from destination countries.
Notification of job opportunities in foreign countries, typically coursed through the recruitment agen-cies, are provided to the Department in the form of a demand letter. The Department reviews the terms and conditions of a contract to ensure its legal compliance and gives an “approval notice” for that job listing. Once a migrant is recruited for a particular job and has signed the contract, the han-dling agency registers the migrant with the Department through the application for a labour permit to travel abroad. At that point, the recruiting agency provides the Department with the ‘appointment letter’ from the employer in the destination country, specifying the terms and conditions of the job offer (often the terms and conditions do not comply with the contract). The labour permit is a sticker placed in the worker’s passport.
The complaints and grievances of migrant workers are registered in the Complaint Registration and Investigation Section. Cases of foreign employment filed under the FEA are considered cases against the State. When a complaint is filed, the Complaints Registration and Investigation Section must in-vestigate the case. The Department has jurisdiction to decide if an offence has occurred, as per Sections 43-59 of the FEA. The cases beyond its jurisdiction are forwarded to the Foreign Employment Tribu-nal. For example, the Department does not handle cases filed by workers who received an “individual” type permit but automatically forwards them to the Tribunal. The Department of Foreign Employ-
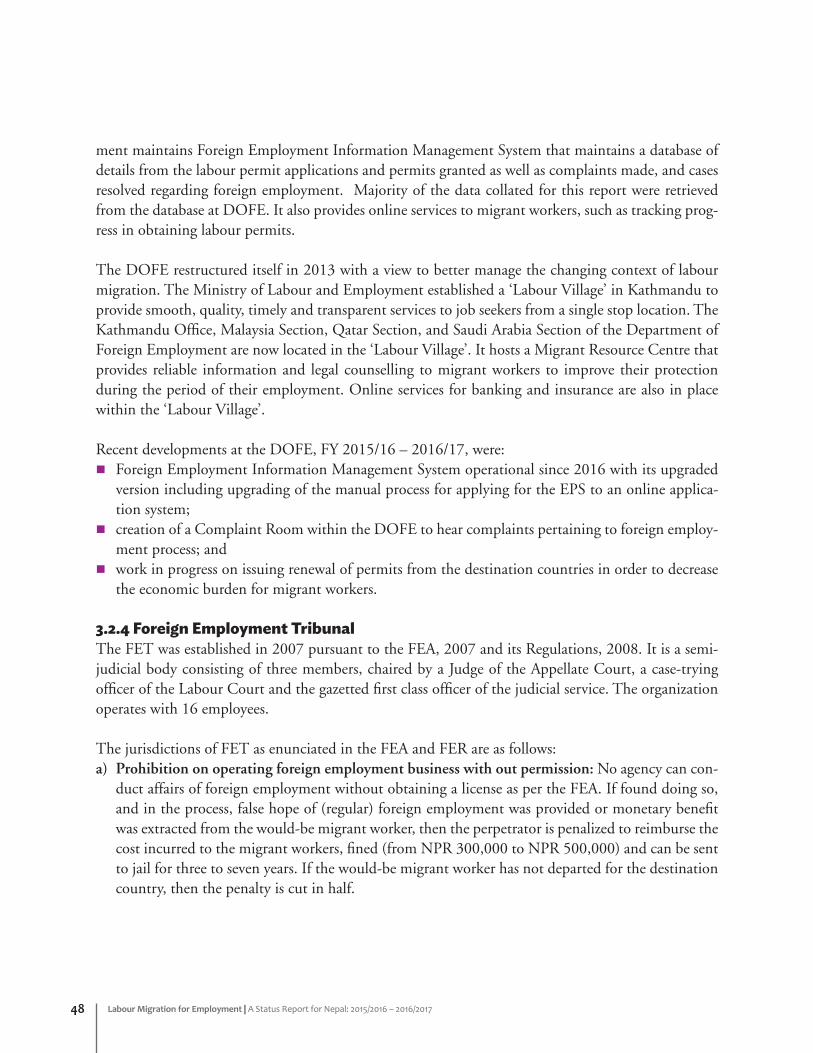
Labour Migration for Employment | A Status Report for Nepal: 2015/2016 – 2016/2017 48
ment maintains Foreign Employment Information Management System that maintains a database of details from the labour permit applications and permits granted as well as complaints made, and cases resolved regarding foreign employment. Majority of the data collated for this report were retrieved from the database at DOFE. It also provides online services to migrant workers, such as tracking prog-ress in obtaining labour permits.
The DOFE restructured itself in 2013 with a view to better manage the changing context of labour migration. The Ministry of Labour and Employment established a ‘Labour Village’ in Kathmandu to provide smooth, quality, timely and transparent services to job seekers from a single stop location. The Kathmandu Office, Malaysia Section, Qatar Section, and Saudi Arabia Section of the Department of Foreign Employment are now located in the ‘Labour Village’. It hosts a Migrant Resource Centre that provides reliable information and legal counselling to migrant workers to improve their protection during the period of their employment. Online services for banking and insurance are also in place within the ‘Labour Village’.
Recent developments at the DOFE, FY 2015/16 – 2016/17, were:n Foreign Employment Information Management System operational since 2016 with its upgraded
version including upgrading of the manual process for applying for the EPS to an online applica-tion system;
n creation of a Complaint Room within the DOFE to hear complaints pertaining to foreign employ-ment process; and
n work in progress on issuing renewal of permits from the destination countries in order to decrease the economic burden for migrant workers.
3.2.4 Foreign Employment TribunalThe FET was established in 2007 pursuant to the FEA, 2007 and its Regulations, 2008. It is a semi-judicial body consisting of three members, chaired by a Judge of the Appellate Court, a case-trying officer of the Labour Court and the gazetted first class officer of the judicial service. The organization operates with 16 employees.
The jurisdictions of FET as enunciated in the FEA and FER are as follows:a) Prohibition on operating foreign employment business with out permission: No agency can con-
duct affairs of foreign employment without obtaining a license as per the FEA. If found doing so, and in the process, false hope of (regular) foreign employment was provided or monetary benefit was extracted from the would-be migrant worker, then the perpetrator is penalized to reimburse the cost incurred to the migrant workers, fined (from NPR 300,000 to NPR 500,000) and can be sent to jail for three to seven years. If the would-be migrant worker has not departed for the destination country, then the penalty is cut in half.

49Labour Migration for Employment | A Status Report for Nepal: 2015/2016 – 2016/2017
b) If a licensed recruiting agency sends a migrant worker without obtaining the labour permit: In cases where a licensed recruiting agency provides false hope for (regular) foreign employment and extracts money for doing so, then a total sum of the principal amount and 50 per cent more of that amount is fined to the recruitment agency, with jail time of three to seven years and revocation of their license to operate the business.
c) Prohibition on sending minor for foreign employment: If any licensed recruiting agency is found sending a ‘minor’ for foreign employment, such agency is fined NPR 300,000 to NPR 500,000 and is sentenced between three and seven years of jail.
d) Prohibition on sending workers to countries not specified by the Government: If any licensed recruiting agency is found sending workers to countries not permitted by the Government of Nepal or channelling workers to such countries by obtaining a permit for other countries that are permit-ted, such agency is fined NPR 300,000 to NPR 700,000 and jailed for three to seven years. If the would-be migrant worker has not already departed, then, the penalty is cut in half.
e) Action against embezzlement of necessary documents or reports: In cases in where a licensed recruitment agency embezzles necessary documents or records related to its business, that agency is fined NPR 100,000 to NPR 300,000 and jailed for six months to a year. In case of repetitive of-fence, the penalty is doubled.
FET operates as per the provision in the Summary Procedures Act, 1972. The cases that are filed are tried and dealt in accordance with this Act. The Tribunal also receives cases forwarded by the DOFE.
3.2.5 Labour AttachéThe FEA (section 68) requires the appointment of a labour attaché in destination countries where 5,000 or more Nepali migrant workers are based21. The functions, duties and powers of the labour attaché are as follows:
n provide information to the Government on the conditions of labour, employment and immigra-tion where Nepali migrants are working and the steps taken by the host country for the protection of their rights;
n assist in resolving any dispute between workers and businesses involved in sending foreign labour migrants abroad;
n make the necessary arrangements for rescuing any Nepali workers who have been deemed helpless in the course of foreign employment;
n furnish information on the availability of employment that matches with the skills of Nepali workers; n manage the repatriation arrangements of the body of any deceased migrant worker;
21 The Foreign Employment Rules 2008 requires appointment of female labour attaché in destination countries where there are more than 1,000 female migrant workers.

Labour Migration for Employment | A Status Report for Nepal: 2015/2016 – 2016/2017 50
n maintain bilateral agreements at the government level for the supply of workers from Nepal; n provide welfare-protecting information to migrant workers and discourage them to do any other
work that set forth in their work contract; n supervise any activity that may affect migrant workers; and n perform functions as prescribed by the Government when necessary.
The Government of Nepal has appointed labour attachés in eight countries: Bahrain, Kuwait, Malay-sia, Oman, the Republic of Korea, Saudi Arabia, and the UAE.
3.2.6 Other institutionsNepali embassies play a major role in providing services and supporting Nepali migrant workers in destination countries. Major activities of the Nepali embassies in relation to labour migrants include services and support in time of distress and grievances, repatriation of the dead bodies of deceased mi-grant workers, facilitating migrant workers to receive compensation from their employer, and rescuing migrant workers from vulnerable situations.
In Nepal, Ministry of Foreign Affairs is a focal ministry through which indemnities of a migrant worker who died during employment abroad are distributed to the nominated beneficiary. The funds are channelled from the Nepali embassies in destination countries to the DOCS, which then forwards the payment to the respective District Administration Office for disbursement to the beneficiary.
The DOCS renders its services to the Nepali citizens. The consular office and legal consultation func-tion provides following services to the Nepali citizens:
n Search and rescuen Repatriation of dead bodiesn Compensation of death and deformation n Grievance handling n Handling of insurance specific issues
The DOCS has introduced an e-governance system in delivering the various services. With regard to migrant workers, requests for search and rescue of workers in distress, request for repatriation of dead bodies from destination countries, and applications for compensation for disabled or deceased migrant worker can be made online.

51Labour Migration for Employment | A Status Report for Nepal: 2015/2016 – 2016/2017

Labour Migration for Employment | A Status Report for Nepal: 2015/2016 – 2016/2017 52
Aspirant migrant worker participating in a garment skills training. © ILO/A. Basnyat.

53Labour Migration for Employment | A Status Report for Nepal: 2015/2016 – 2016/2017
4.1 Skills recognition and development of migrant workers
The importance of knowledge and skills development of a country’s workforce cannot be overstated. It has been widely observed that economic growth is increasingly driven by individuals’ endowments in terms of skills and knowledge.22 Higher education and enhanced skills are key factors for increased productivity, better jobs and wages, and a major route out of poverty.23
As many as 500,000 enter the Nepali labour market each year, of which many find work abroad24; about 390,000 labour permits were issued on an average annually in the past nine fiscal years. Inter-national labour migration is a critical determinant of the employment situation in the country and has been considered a major force of change and development, particularly in poverty reduction and sustainability of economy.25 However, majority in the labour force both domestically and internation-ally are low-skilled and the need to develop skilled human resource is apparent. The Fourteenth Period Plan, 2016/17 – 2018/19 of the Government acknowledges the need to produce qualified and skilled human resource through vocational, technical and skill based training such that the labour force can be competitive in the national and international labour markets.
The records at the DOFE in 2013/1426 showed that nearly 75 per cent of the migrant workers are “un-skilled”, which is a serious national concern. Low level of skills is often associated with low paying jobs and vulnerable working conditions. Hence, the National Employment Policy, 2015 considers foreign employment as an intermediate strategy where the aspirants need to be imparted suitable trainings and skills.27 The National Youth Policy, 2015 and the Technical and Vocational Education and Train-ing Policy, 2012 posit the case even more strongly by stating that formal and technical training along with skills certificates should be gradually made mandatory for those aspiring foreign employment.28 The Foreign Employment Policy, 2012 considers that skills would maximize benefits of the foreign employment and the FEA, 2007 provisions for pre-departure orientation training to migrant workers. The aforementioned policies also acknowledge the fact that skill development is a continuous process that carries on during foreign employment and upon return but not just limited to pre-departure. As many citizens leave for foreign employment each year, there is also an increasing number of returnee migrant workers and thus a need to address their issues, including skills recognition and further devel-
Thematic issuePART 4:
22 OECD (2014) 23 Taylor M., Haux T., and Pudney S. (2012) 24 NPC (2016) 25 NPC (2016a)26 The DoFE data on skill classification after FY 2013/14 is not available. 27 Part 13.5 of the National Employment Policy 2015 of the Government of Nepal28 Part 10 (B.12) of the National Youth Policy and Working Policy No.15 of the TVET Policy 2012

Labour Migration for Employment | A Status Report for Nepal: 2015/2016 – 2016/2017 54
opment upon return. Since there is a need to better understand the phenomenon of labour migration and the return of migrants for formulating strategies to achieve the Sustainable Development Goals29, it is apt that a discussion on skills development and recognition of migrant workers should included in this report.
4.2 Skills
Skill has been defined as “goal-oriented, well-organized behaviour that is acquired through practice and performed with economy of effort” while the International Standard Classification of Occupa-tions defines skill as the ability to carry out the tasks and duties of a given job.30 In other words, it is an ability developed over time to produce desired results in a coherent manner within a given amount of time. It is usually measured by education level, qualifications and training, and furthermore, increas-ingly valued in terms of soft skills, such as communication, teamwork and other inter-personal skills.31 Skills may be acquired through formal environment as well as in non-formal or informal settings. While education system of a country is a setting for formal learning, skills may be gained through in-formal and non-formal settings, such as in the labour market. The labour market is a place for produc-tion of non-formal and informal learning situations32 that may result in obtaining basic and advanced technical skills or soft skills.
It is important to recognize what the skills are and how they are gained in the context of international labour migration cycle due to the diversity of migrant workers, mainly in terms of the nature of jobs, the countries of destination, and the personal abilities predisposed by education and work experience.
4.3 Occupations of Nepali migrant workers: Data and limitations
The quantitative and qualitative data available on the skills of migrant workers is limited. The occu-pations of migrant workers recorded at the DOFE serve as an indicator of the nature of jobs Nepali migrant workers are engaged at the destination countries and suggest associated skills. The Depart-ment records data on the occupations of migrant workers, gender and country of destination wise, from FY 2016/17 onwards as per the occupation stated in the demand letter submitted to obtain the labour permit. This recent effort to produce disaggregated data was part of upgrading the Foreign Employment Information Management System within the Department. Till FY 2013/14, the DoFE maintained data on the skill level in four broad categories as “unskilled”, “semi-skilled”, “skilled” and “highly skilled or professional” worker and was reported at around 74 per cent, 12 per cent, 14 per
29 NPC (2016a) pp.930 Proctor, R.W.; Dutta A. (1995) Skill acquisition and human performance, Sage Publications: London31 Taylor M., Haux T., and Pudney S. (2012)32 Werquin, P. (2010) Recognition of non-formal and informal learning: Country practices. OECD: Paris available at:https://www.oecd.org/edu/
skills-beyond-school/44600408.pdf

55Labour Migration for Employment | A Status Report for Nepal: 2015/2016 – 2016/2017
cent and less than 1 per cent of the total number of migrant workers respectively.33 However, the four categories did not adhere to any standard classifications of skills.
While there is new information, it is still limited in terms of time-period – available only for FY 2016/17 – and information of the skill level of migrant workers going abroad on an individual level is not yet available. Moreover, the data recorded in terms of occupation must not be unequivocally equated with skills because a single occupation may have different levels of skills. Similarly, the re-corded data is not based on a formal certification of skills by any authorized government institutions. A key point to note is that due to the reported cases of contract substitution and deception of working conditions, the occupations data drawn from the demand letters might not present an exact picture. Considering such limitations, the data on major occupations of Nepali migrant workers in the GCC countries and Malaysia for FY 2016/17 is presented as they represent the major corridors of foreign employment in last nine fiscal years.
Table 25: Occupation profile: Malaysia, 2016/17, via recruitment agency onlyTotal flow of migrant workers: 94 426; Male: 92 419 (97.88 %); Female: 2 007 (2.12 %)
Occupation Male Female TotalPercentage
M F TFactory worker (production and manufacturing) 54 512 1 697 56 209 56.81 84.55 59.52General labour (unspecified) 17 482 289 17 771 18.92 14.39 18.82Security guard 10 984 0 10 984 11.8 0 11.63General cleaning labour (sector unspecified) 3 051 0 3 051 3.30 0 3.23Construction worker 1 429 0 1 429 1.54 0 1.51Restaurant and hotel worker 1 414 11 1 425 1.52 0.54 1.50Agriculture labour (farm, plantation) 1 314 3 1 317 1.42 0.14 1.39
Malaysia was the top country of destination for Nepali migrant workers in the past nine fiscal years. The data shows that majority of the migrant workers who went to Malaysia, both male and female, engaged in manufacturing factories as a production worker or general labour at 59.52 percent of all migrant workers. Nearly 85 per cent of the female migrant workers were listed as factory workers. Gen-eral labour (sector unspecified) comprised the second largest occupation for migrant workers followed by security guards (at 11.63 per cent).
33 GIZ and ILO (2015)

Labour Migration for Employment | A Status Report for Nepal: 2015/2016 – 2016/2017 56
Table 26: Occupation profile: Qatar, 2016/17, via recruitment agency onlyTotal flow of migrant workers: 113 696; Male: 111 339 (97.92 %); Female: 2 357 (2.08 %)
Occupation Male Female TotalPercentage
M F TGeneral labour (unspecified) 57 605 5 57 610 51.74 0 50.67Mason 9 241 0 9 241 8.30 0 8.13Driver (light and heavy vehicles) 8 806 0 8 806 7.91 0 7.74General cleaning labour (sector unspecified) 3 945 1 627 5 572 3.54 69.03 4.90Carpenter 5 173 0 5 173 4.64 0 4.55Electrician 2 690 0 2 690 2.42 0 2.36Security guard 2 207 84 2 291 1.98 3.56 2.01Painter 1 999 0 1 999 1.80 0 1.76
Half of the migrant workers bound to Qatar in FY 2016/17 were general labourers (unspecified), fol-lowed by a high number of masons (8.13 per cent) and drivers of light and heavy vehicles (7.74 per cent). There were also a significant number of workers who migrated to Qatar as construction workers in similar semi-skilled jobs, such as carpenter (4.55 per cent), electrician (2.36 per cent) and painter (1.76 per cent). Majority of the female migrant workers went as general cleaning labour (69.03 per cent).
Table 27: Occupation profile: Saudi Arabia, 2016/17, via recruitment agency only Total flow of migrant workers: 71 948; Male: 70 865 (98.49 %); Female: 1 083 (1.51 %)
Occupation Male Female TotalPercentage
M F TGeneral labour (unspecified) 33 270 4 33 274 46.95 0.36 46.24Driver (light and heavy vehicles) 5 572 0 5 572 7.86 0 7.74General cleaning labour (sector unspecified) 3 435 1 047 4 482 4.85 96.67 6.22Restaurant and hotel worker 3 936 1 3 937 5.55 0 5.47Construction labour (unspecified) 3 425 0 3 425 4.83 0 4.76Factory labour (production and manufacturing)
1 720 0 1 720 2.43 0 2.39
Mason 1 473 0 1 473 2.08 0 2.04Electrician 1 391 0 1 391 1.96 0 1.93Carpenter 1 071 0 1 071 1.51 0 1.48
Majority of the Nepali migrant workers going to Saudi Arabia went as a general labour (unspecified) in FY 2016/17 (46.24 per cent) followed by as a driver (at 7.74 per cent) and as a general cleaning labour (6.22 per cent). The migrant workers were also employed as restaurant and hotel workers (5.47 per cent) which include waiters, cooks and general hotel staff. The ratio of women as general cleaning labour across different sectors is 96.67 per cent.

57Labour Migration for Employment | A Status Report for Nepal: 2015/2016 – 2016/2017
Table 28: Occupation profile: UAE, 2016/17, via recruitment agency only Total flow of migrant workers: 50 950; Male: 44 532 (87.40 %); Female: 6 418 (12.6 %)
Occupation Male Female TotalPercentage
M F TGeneral cleaning labour (sector unspecified) 10 327 4 626 14 953 23.19 72.07 29.34General labour (unspecified) 14 688 99 14 787 32.98 1.54 29.02Security guard 4 178 105 4 283 9.38 1.63 8.40Restaurant and hotel worker 1 538 437 1 975 3.45 6.81 3.88Scaffolder 1 880 0 1 880 4.22 0 3.69Carpenter 1 468 0 1 468 3.30 0 2.88Shop worker (retail and wholesale) 1 120 278 1 398 2.51 4.33 2.74
UAE has been a popular destination for both male and female migrant workers. Nearly equal number of migrant workers left for UAE as general cleaning labour (29.34 per cent) and general labour (29.02 per cent), followed by as security guard (8.40 per cent) and restaurant and hotel worker (3.88 per cent). The occupations of women in UAE were found more diversified than other destination coun-tries in 2016/17 as many left for jobs as a general cleaning labour (72.07 per cent), a restaurant and hotel worker (6.81 per cent), and a shop worker (4.33 per cent).
Table 29: Occupation profile: Kuwait, 2016/17, via recruitment agency only Total flow of migrant workers: 12 089; Male: 11 617 (96.09 %); Female: 472 (3.91 %)
Occupation Male Female TotalPercentage
M F TGeneral labour (unspecified) 3 413 1 3 414 29.37 0 28.24Civil technician labour 1 174 8 1 182 10.10 1.69 9.78General cleaning labour 639 276 915 5.50 58.47 7.56Scaffolder 891 0 891 7.67 0 7.37Restaurant and hotel worker 658 82 740 5.66 17.37 6.12Carpenter 735 0 735 6.32 0 6.07Security guard 578 28 606 4.97 5.94 5.01Welder 390 0 390 3.35 0 3.22
The occupations for Kuwait in FY 2016/17 show that majority of the migrant workers went for jobs as general labour (28.24 per cent) followed by civil technician labourers (9.78 per cent). Civil technician labourers included professional engineers and semi-skilled technicians that work with the design, con-struction and maintenance of buildings, roads, bridges, canals and other infrastructures. There were also number of other construction related jobs, such as scaffolder (7.37 per cent), carpenter (6.07 per cent) and welder (3.22 per cent).

Labour Migration for Employment | A Status Report for Nepal: 2015/2016 – 2016/2017 58
Table 30: Occupation profile: Bahrain, 2016/17, via recruitment agency only Total flow of migrant workers: 3 230; Male: 3 035 (93.96 %); Female: 195 (12.6 %)
Occupation Male Female TotalPercentage
M F TGeneral labour (unspecified) 797 0 797 26.26 0 24.67Security guard 665 2 667 21.91 1.02 20.65Driver (light and heavy vehicles) 361 0 361 11.89 0 11.17General cleaning labour 258 45 303 8.50 23.07 9.38Maintenance clerk 248 0 248 8.17 0 7.67Restaurant and hotel worker 107 29 136 3.52 14.87 4.21
The largest percentage of Nepali migrant workers going to Bahrain (24.67 per cent) went as a general labour followed closely by a security guard (20.65 per cent) and driver (11.17 per cent). Majority of the female migrant workers left for Bahrain as general cleaning labour (23.07 per cent), and restaurant and hotel worker (14.87 per cent).
Table 31: Occupation profile: Oman, 2016/17, via recruitment agency only Total flow of migrant workers: 2 240; Male: 1 969 (87.90 %); Female: 271 (12.1 %)
Occupation Male Female TotalPercentage
M F TGeneral cleaning labour 717 254 971 36.41 93.72 43.34General labour (unspecified) 366 0 366 18.59 0 16.33Restaurant and hotel worker 178 13 191 9.04 4.79 8.52Scaffolder 110 0 110 5.58 0 4.91Mason 53 0 53 2.69 0 2.36Carpenter 53 0 53 2.69 0 2.69
Oman receives the least number of Nepali migrant workers among the GCC countries. Majority of the jobs were under general cleaning labour (43.34 per cent) followed by general labour (16.33 per cent), and restaurant and hotel worker (8.52 per cent).
Although the available data is limited to provide a trend of labour market demands in destination countries, the disaggregated data provide useful information in understanding the different jobs un-dertaken by Nepali migrant workers in GCC countries and Malaysia, which comprised of nearly 86.42 per cent of all migrant workers between FY 2008/09 and FY 2016/17. The trends indicated by the data can also be complemented by trends in employment in the countries of destination. While in the GCC countries, it has been noted that the demand for migrant workers will remain in domestic work, manufacturing and construction as well as sales and retail, services and hospitality, the employment trends in Malaysia indicates that heavy reliance on low-skilled general workers in agriculture, palm oil, rubber and electronic industries.34
34 GIZ and ILO (2015a).

59Labour Migration for Employment | A Status Report for Nepal: 2015/2016 – 2016/2017
Majority of the migrant workers in these countries were found to be general labour across different un-specified sectors, which do represent the large number of jobs as low skilled labour. Similarly, general cleaning labourers were also high in numbers across all seven countries. It also showed the concentra-tion of female migrant workers as general cleaning labour. However, it is noteworthy that plenty of mi-grant workers also leave for jobs requiring some levels of skills, such as masons, carpenters, electricians and painters. The available data suggests that majority of the Nepali migrant workers in destination countries are engaged in the construction sector, service industry, and manufacturing jobs, albeit the actual skill of the worker cannot be ascertain with the available data. When more data is available in the future, information on occupations can indicate labour market trends in destination countries that can be suggestive for skills development and recognition of migrant workers.
4.4 Current practices of skills development and recognition
The Council for Technical Education and Vocational Training (CTEVT) is an autonomous and apex body of the Government committed to produce technical and skilled human resources required for the nation. As a prime agency for skills development and recognition, the services of its wings and institutions can also be availed by migrant workers. The CTEVT is responsible for formulating Tech-nical and Vocational Education and Training (TVET) policies in coordination with TVET providers, assuring quality of TVET and implementing or facilitating to implement all types of TVET programs to produce skilled workforce.
The TVET structure in Nepal comprises of formal, informal and non-formal education. The CTEVT also accredits skill levels for individual by carrying out skill-test through the National Skill Testing Board. The skill testing reaches out to experience worker (employed and unemployed) who lack offi-cial certification, successfully completed from pre-employment vocational training wishing to facilitate transition to work and the workers, who, at the end of the in-service training seek an upgraded or ad-ditional certificate. Principally, the skill testing activity operates within the framework of the Recogniz-ing Prior Learning approach as a form of assessment that acknowledges individuals’ previous learning outside the formal system and is a key method recognized globally for non-formal and informal skill assessment.
The aspiring migrant workers can develop various technical and vocational skills through institutions accredited by the CTEVT and get assessed against the units of competency in an Occupational Skill Standard or Occupational Profile. However, the current system of documentation at the CTEVT does not differentiate a migrant and non-migrant worker. Thus, it is premature to ascertain how migrant workers are accessing to the services provided by the CTEVT. A CTEVT official also represents in the Foreign Employment Promotion Board to ensure coordination between TVET sector and foreign employment sector.
Apart from the services provided by the CTEVT and its institutions, the migrant workers obtain im-portant cultural knowledge and information about the destination countries through the pre-departure

Labour Migration for Employment | A Status Report for Nepal: 2015/2016 – 2016/2017 60
skill-orientation training. These trainings are provided by the institutions licensed by the DOFE ac-cording to the curriculum developed by the FEPB. Various government-led programmatic initiatives, such as Safer Migration project also provide skills training to migrant workers.
The Vocational and Skill Development Training Centre under the Ministry of Labour and Employ-ment also assists the migrant workers to gain and develop skills. Moreover, the FEPB also conducts skills training for potential migrant workers.
4.5 Key points for discussion
n Labour market trends in destination countries: It is necessary to be familiar with the labour mar-ket trends in destination countries to devise plans and programs for skills development and rec-ognition of migrant workers. Although the data is limited in this topic, the available information suggest that many migrants work in the construction and hospitality sector in the major corridors of labour migration. Such data and trend would help to produce skilful human resource to meet the needs of the destination countries. Notably, global labour markets are subject to numerous factors and can be volatile, thus matching the skills with appropriate jobs is challenging.
n Gender dimension of labour market trends: There is an increasing share of female migrant work-ers. Similarly, the labour market structure of the countries of destination coupled with social and cultural practices indicate a large demand for low-skilled female workers. Especially in the GCC, as more national women enter the labour force, the demand for migrant domestic workers and care providers has been increasing with increased need for childcare and other domestic responsibilities within the household.
n Strengthening the link between TVET sector and foreign employment sector: While there are mechanisms for coordination between the TVET sector and foreign employment sector through the FEPB, the relationship between agencies of the two sectors are not well pronounced. A key point for discussion is envisioning skills development of migrant workers as a major part of the TVET sector. It could include sharing of more data and information between the agencies such that skills development and recognition of migrant workers can be adhered to the standards and practices of CTEVT. For instance, the data on occupations at the DOFE can be standardized ac-cording to the occupational standards and profile created by the NSTB and can be used to target specific occupations in demand with skills development training.
n Skill recognition in destination countries: There is no system of referencing skills and occupational standard between Nepal and the countries of destination. Hence, there is no guarantee that the skills certificate obtained in Nepal is recognized in the countries of destination. Moreover, in the lack of common standards, the levels of skills gained in Nepal may not adhere to same standard in destination countries. Similarly, studies show that the employers at destination countries prefer

61Labour Migration for Employment | A Status Report for Nepal: 2015/2016 – 2016/2017
workers with prior labour migration experience and that there is minimal role of TVET training in labour migration selection.35 Hence, developing a common approach towards skills certification and recognition between Nepal and destination countries is a key point for discussion. The focus should be on bilateral and regional qualification frameworks.
n Returns to skills development and recognition: While it is encouraging to value skills develop-ment, it is equally important to ascertain the returns of such development and recognition. As the available data show, the demand in popular destination countries is primarily for low skilled labour. In such case, it can be discouraging for an individual to invest time in obtaining skills when there is no appropriate job matching the acquired skill. Skills development and recognition must be linked with appropriate jobs, wages and decent working conditions. A key point for discussion is how to diversify foreign employment options for migrant workers globally and bring job demands match-ing the skill.
n Focus on returnee migrants: Although many migrant workers leave as low skilled, it is highly likely that they return with additional level of skills, either technical or soft skills, and exposure to global economy and new technologies. An opportunity lies in recognizing the skills obtained through foreign employment experience. Such recognition can lead to further skills development of migrant workers and can be used to capitalize in the domestic labour market. A key point for discussion is how investment friendly approaches offered to returnees can be coupled with skills recognition and development.
n Focus on basic and soft skills: Just as a technical skill is valued in the labour market, the employ-ers increasingly desire basic and soft skills. Encouraging and providing opportunities to develop such skills can be fruitful for majority of migrant workers who leave unskilled. Many soft skills are gained during foreign employment and recognition of such skills upon return can lead to better integration in the domestic labour market.
35 ILO and GIZ (2015), pp.38.

Labour Migration for Employment | A Status Report for Nepal: 2015/2016 – 2016/2017 62
FEPB staff providing information to migrant workers at the Labour Village. © ILO.

63Labour Migration for Employment | A Status Report for Nepal: 2015/2016 – 2016/2017
Gaps, challenges and ways forwardPART 5:
5.1 Major gaps
n Data constraints: Although there has been a significant improvement in the database management of foreign employment across relevant institutions, there are still gaps in available data. Firstly, there is no source of reliable data on labour migration to India, which constitutes as a major destination. This situation has shadowed their issues in labour migration policies and governance. Secondly, the major sources of data on foreign employment, the database at the DOFE, FEPB and FET, have not yet been able to generate important information on key characteristics of migrant workers and the nature of their problems accurately. These include age, ethnic group, educational background, skill level, repeat migration, returnee migrant workers, causes of death, and nature of grievances. Finally, there is lack of linkages in data generated across different government agencies that are linked di-rectly or indirectly to the labour migration cycle. For instance, data generated at the Nepali embas-sies at destination countries rarely links with the database at the FEPB and DOFE, which could be useful in matters of rescue, repatriation, and compensation.
n Inadequate research: The government led research on key aspects of labour migration is not ad-equate. Moreover, no studies suggest how long or at what levels the Nepali labour migration trend will continue. The decline in overall trend of issuing permits was observed in the past two fiscal years corresponding to the decline in numbers just in Malaysia. Academic literature suggests that the trends depend on macroeconomic dynamics of the sending and receiving countries. There is a lack of knowledge in this regard, which directly affects the policies taken for the future. There is an urgent need to understand the public health of Nepali migrant workers. There are also gaps on the issues of returnee migrant workers, and skills development and recognition of migrant workers.
n Limited coordination and collaboration between different government agencies: There is lim-ited coordination and collaboration between government agencies addressing the issues of migrant workers. Labour migration is a cross-cutting issue requiring harmonized approach between govern-mental agencies; however, different agencies are working in isolation risking efficacy and duplica-tion of work. The National Action Plan on Foreign Employment that took a sector-wide approach as a governance tool has not been effectively implemented. Furthermore, the FEPB, which com-prises of representation of various government agencies and private and public sector, has facilitated limited inter-governmental collaborative approach towards tackling issues of labour migration. For instance, though CTEVT has representation in the FEPB, there has not yet been coordination for strongly linking the TVET sector to labour migration.
n Centralized operation of government agencies and private sector: Although migrant workers originate from all districts of the country, the government’s institutional mechanism and major-

Labour Migration for Employment | A Status Report for Nepal: 2015/2016 – 2016/2017 64
ity of private sector, engaged in labour migration process, operate centrally from Kathmandu thus increasing migration costs and impeding access of migrant workers to important services.
n Weak linkage between TVET system and labour migration: Although the low skill of Nepali mi-grant workers is well pronounced, there is a lack of strong linkage between the national TVET poli-cies and practices and the skills development and recognition of migrant workers. While national policies are guiding towards mandatory skills attainment and certification for migrant workers, there is lack of knowledge on how that affects the labour migration trend and vice-versa. The in-formation on skills required in the destination countries and the institutions capable of addressing such requirements is not adequately available. Moreover, a common framework for recognition of skills and occupational standards between Nepal and destination countries is lacking.
n Lack of procedural guidelines on reintegrating returnee labour migrants: A key feature of labour migration is temporariness of its arrangements. It means, many labour migrants return to home country upon completion of their contract in the country of destination. Just as many have left, many migrants have returned and expected to return, albeit no data is available hitherto. There is a lack of procedural guideline on reintegrating returnee labour migrants to domestic labour market, and optimally utilizing their social capital besides their savings.
5.2 Challenges
n Regulatory challenges: The data show that there are considerable numbers of complaints and cases of malpractices in the labour migration process. These cases against individuals or institutions suggest a need of continuous monitoring and regulation amidst growing number of recruitment agencies and agents. The data on death of migrant workers due to traffic accidents, heart attack, cardiac arrest and suicide also call into question the effectiveness of pre-departure orientation and medical tests carried out by the licensed institutions. While the government has recently adopted Standard Procedure on Monitoring of Foreign Employment and Orientation Institutions, 2016, its implementation and effect are yet to be seen. A key regulatory challenge for the government is also to prevent human trafficking in the pretext of labour migration. Studies and reports of the Ministry of Women, Children and Social Welfare have recurrently raised issues of distressed women rescued from various destination countries who were taken there in the pretext of labour migra-tion36, though the problem is not limited to women only.
n Increasing access to justice: The number of complaints and cases registered against those settled has been low. While many dynamics are at play in trying and settling cases and complaints, there is exigent challenge for the government to increase access to justice for those in need and make sure that nefarious actors do not impede the proceedings. Similarly, a key issue for the Foreign Employ-ment Tribunal has been to follow up the implementation of their verdicts and increase the rate of case clearance annually so that quick redress is provided to the victims.
36 See MOWCSW (2016) and MOWCSW (2016a)

65Labour Migration for Employment | A Status Report for Nepal: 2015/2016 – 2016/2017
n Protection of migrant workers in destination countries: An initial glance at the nature of com-plaints filed at the DOFE and the number of rescues requested at the DOCS indicate that many migrant workers in destination countries await rescue and repatriation. Search and rescue of those in distress whilst providing shelter in a destination country is a major challenge for the government. Protection of migrant workers at the destination countries also requires an effective presence of the Nepali missions, thus requiring a close coordination between the Ministry of Labour and Employ-ment, and the Ministry of Foreign Affairs.
n Procedural challenges: The dynamic nature of labour migration demands frequent changes to the process of labour migration governance. For instance, the growing number of renewal of labour permits in the last few years indicates the need of revised procedure on renewal. Likewise, there are also challenges to make the labour migration process simpler and cost-effective. A key procedural challenge also lies ahead in restructuring the labour migration governance within the new federal structures. Given the cross-border nature of labour migration, it is noted that some aspects of la-bour migration governance need to be governed by the Federal State while other aspects need to be decentralized and devolved to the provincial and local unit levels.
n Implementation of laws, plans and policies: Given the aforementioned gaps and issues, there are numerous challenges to effective implementation of laws, plans and policies regarding labour migration, including implementation of the ‘Free Visa, Free Ticket’ policy and producing the out-comes set in the National Action Plan on Foreign Employment.
5.3 Ways forward
n The database management on labour migration needs to be strengthened such that data constraints and limitations can be overcome for effective policy usage. The categorical data on skills, occupa-tions, causes of deaths, and nature of complaints need to be generated in consultation with relevant experts such that a standard classification is maintained. For instance, the data on occupations of migrant workers can be reclassified as per the occupational standards set by the CTEVT and the nature of complaints can be reclassified in consultation with legal experts. Furthermore, initiatives must be taken to account labour migration to India.
n The Government should continue to conduct research such that evidence informed actions and policies are taken in the future. Key areas of research that could benefit labour migration gover-nance are labour migration and development nexus; labour market trends in destination countries; returnee migrants and reintegration; skills development and recognition of migrant workers; hu-man trafficking and transportation in the pretext of labour migration; and effective utilization of remittance income. As a mandated agency, the FEPB can initiate and lead such research.
n Coordination and collaboration among different government agencies should be encouraged. The Ministry of Labour and Employment can collaborate with the CTEVT on matters related to skills development and recognition. It can coordinate with the Department of Immigration on generat-ing information on returnee migrants and with the Ministry of Women, Children and Social Wel-

Labour Migration for Employment | A Status Report for Nepal: 2015/2016 – 2016/2017 66
fare to address issues on human trafficking, social costs of labour migration and women in foreign employment. A more harmonized approach between the governmental agencies is the way forward.
n A remittance utilization guideline should be developed to encourage productive use of remittance income at national and household level. While the huge inflow of remittance and productive in-vestment thereof is a matter of general discussion, there is a lack of guiding principle on how remit-tances can be optimally utilized in macro- and micro-economic level. At macro-economic level, considering the large volume of remittance as a share of GDP, utilizing remittance as development finance is a key point for discussion. However, the flow of remittance is contingent upon labour mi-gration trends and it affects other aspects of the economy. At a household level, the average volume of remittance received annually is low which can be a constraint in using it productively. Moreover, programs should be devised to utilize social remittances earned by the returnees in the form of oc-cupational skills and social capital.
n Decentralizing and devolving labour migration governance in accordance with the new federal structure is a key priority. There should be wide spread consultations on the matter and implica-tions of decentralized governance on labour migration should be gauged. Regulatory and proce-dural challenges must be considered during restructuring.
n The Standard Procedure on Monitoring of Foreign Employment and Orientation Institutions, 2016 must be implemented effectively to better regulate all license holders and authorized private service providers. The regulatory activities should be linked with complaint registering mechanisms at the DOFE.
n An evaluation of the five-year Foreign Employment Policy, 2012 should be considered so that new and emerging opportunities can be harnessed.
n The FEA, 2007 should be amended to address new challenges, including the review of eligibility criteria for registration of new recruitment agencies.
n The Government of Nepal should continue to play a prominent role in regional and global pro-cesses on labour migration.

67Labour Migration for Employment | A Status Report for Nepal: 2015/2016 – 2016/2017

Labour Migration for Employment | A Status Report for Nepal: 2015/2016 – 2016/2017 68
A student speaking at a school-level debate completion on issue of women in foreign employment in Dhading district. © IOM.

69Labour Migration for Employment | A Status Report for Nepal: 2015/2016 – 2016/2017
Chowdhury, Kamran R. 2016) “Bangladesh to send 1.5 million workers to Malaysia” Published in Benar News, Bangladesh. Retrieved from: www.benarnews.com
GIZ and ILO. 2015a. Labour market trends analysis and labour migration from South Asia to Gulf Co-operation Council Countries, India and Malaysia (Kathmandu, ILO)
GIZ and ILO. 2015. Analysis of labour market and migration trends in Nepal (Kathmandu, ILO) Khatiwada, Padma P. 2014. International migration and citizenship in Nepal” in Population Monograph
of Nepal, Vol.1, pp. 211-237 (Kathmandu, Central Bureau of Statistics, Government of Nepal).Ministry of Finance. 2017. Economic Survey 2017 (Kathmandu, Ministry of Finance, Government of
Nepal).Ministry of Labour and Employment. 2015. National Employment Policy 2015 (Kathmandu, Ministry
of Labour and Employment, Government of Nepal).Ministry of Women, Children and Social Welfare. 2016a. A Desk Review: Progression in the Trafficking
in Persons Scenario and Response for Prevention, Protection and Prosecution (Kathmandu, Ministry of Women, Children and Social Welfare Government of Nepal).
________. 2016. National Report on Human Trafficking and Transportation Prevention 2016 (Kath-mandu, Ministry of Women, Children and Social Welfare, Government of Nepal).
National Planning Commission. 2014. Nepal Human Development Report 2014 (Kathmandu, Na-tional Planning Commission Government of Nepal).
________. 2016. 14th Periodic Plan FY 2016/17 – 2018/19 (Kathmandu, National Planning Com-mission, Government of Nepal).
________2016a. Nepal and the Millennium Development Goals Final Status Report 2000 – 2015 (Kathmandu, National Planning Commission, Government of Nepal).
OECD. 2014. Skills and Wage Inequality: Evidence from PIAAC. Seminar report by OECD Directorate for Education and Skills, available at https://www.oecd.org/naec/2014.10.21_NAEC-Seminar_Re-port-on-Wage-and-Skill-Dispersion.pdf
Proctor, R.W.; Dutta A. 1995. Skill acquisition and human performance (London, Sage Publications).Taylor M., Haux T., and Pudney S. 2012. Skills, employment, income inequality and poverty: Theory,
evidence and an estimation framework (University of Essex: Institute for Social and Economic Re-search).
Werquin, P. 2010. Recognition of non-formal and informal learning: Country practices”, (Paris, OECD). Available at: https://www.oecd.org/edu/skills-beyond-school/44600408.pdf
World Bank. 2017. Migration and Development Brief 28: Migration and Remittance Recent Develop-ments and Outlook (World Bank Group, KNOMAD).
References

Labour Migration for Employment | A Status Report for Nepal: 2015/2016 – 2016/2017 70
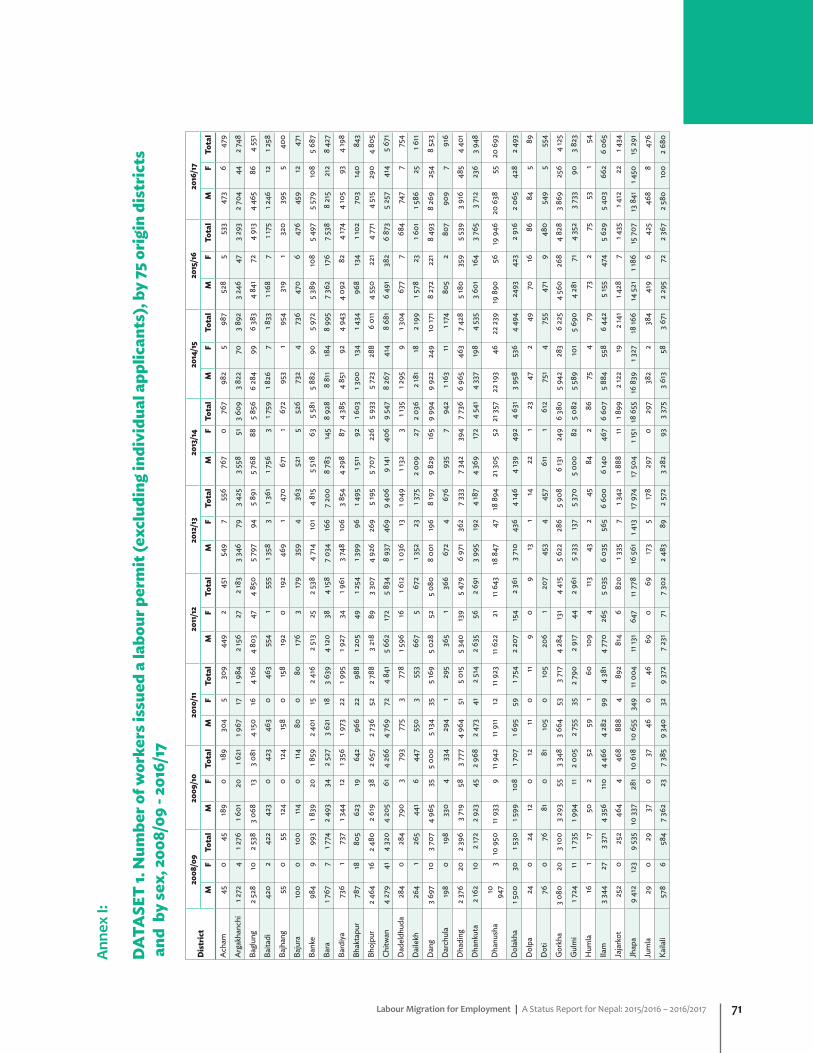
71Labour Migration for Employment | A Status Report for Nepal: 2015/2016 – 2016/2017
Dis
tric
t20
08/0
920
09/1
020
10/1
120
11/1
220
12/1
320
13/1
420
14/1
520
15/1
620
16/1
7
MF
Tota
lM
FTo
tal
MF
Tota
lM
F
Tota
lM
FTo
tal
MF
Tota
lM
FTo
tal
MF
Tota
lM
F To
tal
Ach
am45
045
189
018
930
45
309
449
245
154
97
556
767
076
798
25
987
528
553
347
36
479
Arg
akha
nchi
1 2
724
1 276
1 601
201 6
211 9
6717
1 984
2 15
627
2 18
33
346
793
425
3 55
851
3 60
93
822
703
892
3 24
647
3 29
32
704
442
748
Bagl
ung
2 52
810
2 53
83
068
133
081
4 15
016
4 16
64
803
474
850
5 79
794
5 89
15
768
885
856
6 28
499
6 38
34
841
724
913
4 46
586
4 55
1
Baita
di
420
242
242
30
423
463
046
355
41
555
1 358
31 3
611 7
563
1 759
1 826
71 8
331 1
687
1 175
1 246
121 2
58
Bajh
ang
550
5512
40
124
158
015
819
20
192
469
147
067
11
672
953
195
431
91
320
395
540
0
Baju
ra10
00
100
114
011
480
080
176
317
935
94
363
521
552
673
24
736
470
647
645
912
471
Bank
e98
49
993
1 839
201 8
592
401
152
416
2 51
325
2 53
84
714
101
4 81
55
518
635
581
5 88
290
5 97
25
389
108
5 49
75
579
108
5 68
7
Bara
1 7
677
1 774
2 49
334
2 52
73
621
183
639
4 12
038
4 15
87
034
166
7 20
08
783
145
8 92
88
811
184
8 99
57
362
176
7 53
88
215
212
8 42
7
Bard
iya
736
173
71 3
4412
1 356
1 973
221 9
951 9
2734
1 961
3 74
810
63
854
4 29
887
4 38
54
851
924
943
4 09
282
4 17
44
105
934
198
Bhak
tapu
r78
718
805
623
1964
296
622
988
1 205
491 2
541 3
9996
1 495
1 511
921 6
031 3
0013
41 4
3496
813
41 1
0270
314
084
3
Bhoj
pur
2 46
416
2 48
02
619
382
657
2 73
652
2 78
83
218
893
307
4 92
626
95
195
5 70
722
65
933
5 72
328
86
011
4 55
022
14
771
4 51
529
04
805
Chitw
an
4 27
941
4 32
04
205
614
266
4 76
972
4 84
15
662
172
5 83
48
937
469
9 40
69
141
406
9 54
78
267
414
8 68
16
491
382
6 87
35
257
414
5 67
1
Dad
eldh
uda
284
028
479
03
793
775
377
81 5
9616
1 612
1 036
131 0
491 1
323
1 135
1 295
91 3
0467
77
684
747
775
4
Dai
lekh
264
126
544
16
447
550
355
366
75
672
1 352
231 3
752
009
272
036
2 18
118
2 19
91 5
7823
1 601
1 586
251 6
11
Dan
g3
697
103
707
4 96
535
5 00
05
134
355
169
5 02
852
5 08
08
001
196
8 19
79
829
165
9 99
49
922
249
10 17
18
272
221
8 49
38
269
254
8 52
3
Dar
chul
a19
80
198
330
433
429
41
295
365
136
667
24
676
935
794
21 1
6311
1 174
805
280
790
97
916
Dha
ding
2 37
620
2 39
63
719
583
777
4 96
451
5 01
55
340
139
5 47
96
971
362
7 33
37
342
394
7 73
66
965
463
7 42
85
180
359
5 53
93
916
485
4 40
1
Dha
nkut
a2
162
102
172
2 92
345
2 96
82
473
412
514
2 63
556
2 69
13
995
192
4 18
74
369
172
4 54
14
337
198
4 53
53
601
164
3 76
53
712
236
3 94
8
Dha
nush
a 10
94
73
10 9
5011
933
911
942
11 9
1112
11 9
2311
622
2111
643
18 8
4747
18 8
9421
305
5221
357
22 19
346
22 2
3919
890
5619
946
20 6
3855
20 6
93
Dol
akha
1 5
0030
1 530
1 599
108
1 707
1 695
591 7
542
207
154
2 36
13
710
436
4 14
64
139
492
4 63
13
958
536
4 49
424
9342
32
916
2 06
542
82
493
Dol
pa
240
2412
012
110
119
09
131
1422
123
472
49 7
016
8684
589
Dot
i76
076
810
8110
50
105
206
120
745
34
457
611
161
275
14
755
471
948
054
95
554
Gor
kha
3 08
020
3 10
03
293
553
348
3 66
453
3 71
74
284
131
4 41
55
622
286
5 90
86
131
249
6 38
05
942
283
6 22
54
560
268
4 82
83
869
256
4 12
5
Gul
mi
1 724
111 7
351 9
9411
2 00
52
755
352
790
2 91
744
2 96
15
233
137
5 37
05
000
825
082
5 58
910
15
690
4 28
171
4 35
23
733
903
823
Hum
la
161
1750
252
591
6010
94
113
432
4584
286
754
7973
275
531
54
Ilam
3
344
273
371
4 35
611
04
466
4 28
299
4 38
14
770
265
5 03
56
035
565
6 60
06
140
467
6 60
75
884
558
6 44
25
155
474
5 62
95
403
662
6 06
5
Jaja
rkot
25
20
252
464
446
888
84
892
814
682
01 3
357
1 342
1 888
111 8
992
122
192
141
1 428
71 4
351 4
1222
1 434
Jhap
a 9
412
123
9 53
510
337
281
10 6
1810
655
349
11 0
0411
131
647
11 7
7816
561
1 413
17 9
7417
504
1 151
18 6
5516
839
1 327
18 16
614
521
1 186
15 7
0713
841
1 450
15 2
91
Jum
la
290
2937
037
460
4669
069
173
517
829
70
297
382
238
441
96
425
468
847
6
Kaila
li
578
658
47
362
237
385
9 34
032
9 37
27
231
717
302
2 48
389
2 57
23
282
933
375
3 61
358
3 67
12
295
722
367
2 58
010
02
680
Ann
ex I:
DAT
ASE
T 1.
Num
ber o
f wor
kers
issu
ed a
labo
ur p
erm
it (e
xclu
ding
indi
vidu
al a
pplic
ants
), by
75
orig
in d
istr
icts
a
nd b
y se
x, 2
008/
09 -
2016
/17

Labour Migration for Employment | A Status Report for Nepal: 2015/2016 – 2016/2017 72
Dis
tric
t20
08/0
920
09/1
020
10/1
120
11/1
220
12/1
320
13/1
420
14/1
520
15/1
620
16/1
7
MF
Tota
lM
FTo
tal
MF
Tota
lM
F
Tota
lM
FTo
tal
MF
Tota
lM
FTo
tal
MF
Tota
lM
F To
tal
Kalik
ot
590
5995
095
890
8914
65
151
489
349
272
43
727
799
780
650
74
511
487
549
2
Kanc
hanp
ur
669
167
01 1
6811
1 179
1 693
121 7
051 4
6418
1 482
2 90
452
2 95
63
400
383
438
3 56
952
3 62
12
655
452
700
2 69
454
2 74
8
Kapi
lvas
tu
1 220
41 2
242
172
202
192
2 97
816
2 99
43
117
353
152
6 35
780
6 43
77
063
557
118
7 99
759
8 05
67
688
577
745
6 61
345
6 65
8
Kask
i 3
781
433
824
3 07
972
3 15
13
945
634
008
4 24
911
64
365
6 35
427
46
628
5 72
222
25
944
5 48
222
25
704
4 43
422
34
657
3 78
024
04
020
Kath
man
du
2 14
075
2 21
51 4
2512
11 5
462
182
143
2 32
53
099
247
3 34
65
267
685
5 95
25
131
661
5 79
24
167
826
4 99
33
206
774
3 98
02
440
746
3 18
6
Kavr
epal
an-
chow
k 2
507
572
564
2 59
915
52
754
2 76
380
2 84
34
171
201
4 37
27
280
732
8 01
27
606
757
8 36
37
048
767
7 81
54
910
649
5 55
94
148
817
4 96
5
Khot
ang
2 86
916
2 88
53
199
443
243
3 60
642
3 64
84
067
116
4 18
36
219
255
6 47
46
975
272
7 24
77
219
311
7 53
05
914
251
6 16
55
659
287
5 94
6
Lalit
pur
1 097
261 1
2389
847
945
1 013
471 0
601 7
1873
1 791
2 36
521
52
580
2 52
925
32
782
2 08
631
62
402
1 507
287
1 794
1 167
317
1 484
Lam
jung
2
293
212
314
2 40
743
2 45
02
911
372
948
3 03
466
3 10
04
335
150
4 48
54
411
125
4 53
64
081
141
4 22
23
441
145
3 58
63
127
124
3 25
1
Mah
otta
ri 6
136
06
136
25 16
855
25 2
2313
679
813
687
9 45
224
9 47
612
560
4612
606
15 5
9545
15
640
16 6
6954
16 7
2315
253
4115
294
15 8
3954
15 8
93
Mak
wan
pur
2 80
659
2 86
53
283
164
3 44
73
514
121
3 63
54
592
240
4 83
27
734
793
8 52
78
731
828
9 55
98
272
893
9 16
56
340
814
7 15
45
075
981
6 05
6
Man
ang
990
9910
91
110
391
4025
429
174
2163
669
7616
9243
548
152
17
Mor
ang
6 88
499
6 98
39
379
187
9 56
610
148
251
10 3
9910
354
440
10 7
9415
789
1 002
1 679
117
098
731
17 8
2916
771
852
17 6
2314
419
702
15 12
113
417
807
14 2
24
Mug
u 10
00
100
361
3751
051
474
5177
380
139
514
425
83
261
204
120
517
06
176
Mus
tang
73
174
342
3631
031
184
2238
1048
4910
5953
861
4612
5832
537
Mya
gdi
1 534
81 5
421 6
9916
1 715
2 26
838
2 30
62
364
362
400
3 27
010
63
376
3 14
011
53
255
3 11
111
13
222
2 59
792
2 68
92
430
127
2 55
7
Naw
alpa
rasi
5 12
536
5 16
16
397
646
461
7 98
879
8 06
78
343
162
8 50
511
940
370
12 3
1012
722
270
12 9
9212
489
271
12 7
6010
448
242
10 6
909
609
222
9 83
1
Nuw
akot
2
324
462
370
2 34
613
32
479
2 69
777
2 77
43
645
186
3 83
16
043
692
6 73
56
559
673
7 23
26
000
721
6 72
14
105
557
4 66
23
281
672
3 95
3
Okh
aldh
unga
1 5
0619
1 525
1 633
351 6
681 8
6935
1 904
1 905
861 9
913
062
200
3 26
23
680
158
3 83
83
896
233
4 12
92
702
188
2 89
02
148
191
2 33
9
Palp
a 2
481
102
491
2 79
527
2 82
23
336
243
360
4 13
154
4 18
55
392
128
5 52
05
659
765
735
5 60
697
5 70
34
340
844
424
4 00
282
4 08
4
Panc
htha
r 3
232
343
266
4 03
954
4 09
34
015
584
073
3 88
212
14
003
5 59
131
15
902
5 57
020
65
776
5 87
631
66
192
5 30
426
25
566
4 83
333
45
167
Parb
at
1 719
111 7
301 6
9818
1 716
2 41
120
2 43
12
890
312
921
3 74
683
3 82
93
675
563
731
3 59
767
3 66
42
804
672
871
2 54
259
2 60
1
Pars
a 88
14
885
1 183
111 1
941 7
3013
1 743
2 22
519
2 24
43
717
873
804
6 41
654
6 47
06
076
836
159
4 82
164
4 88
55
488
755
563
Pyut
han
93
05
935
1 104
41 1
081 5
917
1 598
1 561
101 5
712
610
352
645
3 36
530
3 39
54
055
364
091
3 36
344
3 40
73
187
283
215
Ram
echa
p 1 5
8927
1 616
1 834
731 9
072
183
582
241
3 10
014
23
242
4 25
543
54
690
5 07
540
05
475
4 67
650
55
181
3 27
343
23
705
2 51
447
22
986
Rasu
wa
438
1345
151
738
555
377
1439
156
185
646
875
190
1 065
802
136
938
744
106
850
434
101
535
306
7938
5
Raut
ahat
1 5
484
1 552
2 12
014
2 13
42
867
62
873
3 27
721
3 29
86
524
826
606
8 79
464
8 85
89
630
709
700
7 71
670
7 78
68
974
799
053
Rolp
a 2
641
12
642
3 15
311
3 16
43
243
63
249
3 66
521
3 68
65
586
685
654
6 09
678
6 17
46
698
936
791
5 44
310
15
544
5 11
410
45
218
Ruku
m
1 260
41 2
641 6
157
1 622
1 982
111 9
932
356
382
394
3 34
455
3 39
93
890
663
956
4 50
170
4 57
13
337
383
375
3 41
885
3 50
3
Rupa
ndeh
i 3
403
163
419
4 12
241
4 16
35
375
535
428
5 86
711
95
986
10 5
5729
310
850
11 5
3816
211
700
12 13
418
112
315
9 73
815
89
896
8 07
915
28
231
Salya
n 1 9
620
1 962
3 13
418
3 15
23
690
93
699
4 89
654
4 95
05
168
885
256
6 17
978
6 25
76
210
876
297
4 88
596
4 98
15
119
905
209
Sank
huw
as-
abha
1 9
7613
1 989
2 63
939
2 67
82
685
312
716
2 24
744
2 29
13
381
163
3 54
43
973
131
4 10
43
701
158
3 85
92
941
143
3 08
42
889
183
3 07
2
Sapt
ari
4 06
84
4 07
27
276
107
286
7 46
614
7 48
07
314
187
332
11 2
4429
11 2
7313
393
2513
418
13 9
6741
14 0
0813
360
4413
404
13 3
4034
13 3
74
Sarla
hi
3 45
424
3 47
85
130
705
200
5 68
831
5 71
95
655
685
723
10 0
6427
110
335
13 14
418
613
330
14 3
9221
114
603
12 9
0920
813
117
14 5
5125
914
810
Sind
huli
2 39
521
2 41
63
235
973
332
3 77
058
3 82
84
918
173
5 09
16
292
406
6 69
87
150
331
7 48
17
319
387
7 70
65
368
344
5 71
24
498
420
4 91
8
Sind
hupa
l-ch
owk
2 52
315
72
680
2 47
034
42
814
2 35
614
12
497
3 28
449
83
782
5 97
01 7
257
695
7 07
01 2
338
303
5 84
01 1
376
977
4 29
897
05
268
3 68
31 0
724
755
Sira
ha
7 50
62
7 50
89
532
119
543
10 2
837
10 2
909
212
119
223
13 9
1727
13 9
4417
173
1817
191
17 0
3421
17 0
5514
483
2514
508
16 0
5825
16 0
83
Solu
khum
bu
765
1377
886
853
921
940
3297
21 0
9311
81 2
111 6
0826
21 8
701 7
7225
12
023
1 929
346
2 27
51 3
9027
81 6
681 2
0831
31 5
21
Suns
ari
4 34
664
4 41
05
776
147
5 92
36
463
157
6 62
07
325
298
7 62
310
984
611
11 5
9512
295
479
12 7
7412
626
502
13 12
810
830
388
11 2
189
759
506
10 2
65

73Labour Migration for Employment | A Status Report for Nepal: 2015/2016 – 2016/2017
Dis
tric
t20
08/0
920
09/1
020
10/1
120
11/1
220
12/1
320
13/1
420
14/1
520
15/1
620
16/1
7
MF
Tota
lM
FTo
tal
MF
Tota
lM
F
Tota
lM
FTo
tal
MF
Tota
lM
FTo
tal
MF
Tota
lM
F To
tal
Surk
het
5 84
258
61 0
736
1 079
1 578
81 5
861 3
497
1 356
2 82
573
2 89
83
545
403
585
3 89
656
3 95
22
875
532
928
2 78
962
2 85
1
Syan
gja
3 29
417
3 31
13
267
253
292
4 28
641
4 32
74
604
824
686
7 61
516
37
778
6 85
911
56
974
7 06
617
27
238
5 87
112
96
000
4 91
914
15
060
Tana
hu
4 39
516
4 41
14
853
334
886
5 35
329
5 38
26
208
626
270
8 21
116
58
376
8 21
214
98
361
8 03
717
68
213
6 54
616
66
712
5 66
615
15
817
Tapl
ejun
g 2
075
62
081
2 23
438
2 27
22
072
312
103
2 03
678
2 11
42
861
146
3 00
73
176
133
3 30
93
210
159
3 36
92
553
137
2 69
02
472
137
2 60
9
Tehr
athu
m
1 451
101 4
611 7
5215
1 767
1 868
181 8
861 9
4934
1 983
2 86
484
2 94
82
956
933
049
2 99
795
3 09
22
399
842
483
2 33
310
72
440
Uda
ypur
2
946
432
989
3 88
794
3 98
13
690
823
772
4 14
412
74
271
6 01
334
76
360
7 29
533
77
632
7 31
834
07
658
5 56
328
35
846
5 51
737
45
891
Tota
l 162
484
1 402
163 8
8622
1 760
3 440
225 2
0023
7 95
13 0
2624
0 97
725
3 534
6 496
260
030
378 4
8517
176
395 6
6142
6 427
14 69
044
1 117
431 8
6916
651
448 5
2035
2 456
14 46
536
6 921
337 3
3916
643
353 9
82

Labour Migration for Employment | A Status Report for Nepal: 2015/2016 – 2016/2017 74
District 2012/13 2013/14 2014/15 2015/16 2016/17 Total
Acham 31 51 39 34 22 177Argakhanchi 766 1 060 726 506 359 3 417Baglung 1 550 2 306 1 927 1 739 1 015 8 537Baitadi 56 94 94 63 63 370Bajhang 9 20 17 10 16 72Bajura 6 10 10 7 8 41Banke 817 970 529 290 233 2 839Bara 729 935 755 532 463 3 414Bardiya 439 613 278 216 173 1 719Bhaktapur 176 292 218 187 208 1 081Bhojpur 562 972 538 425 287 2 784Chitwan 1 367 2 196 1 466 1 162 956 7 147Dadeldhuda 58 80 68 48 38 292Dailekh 102 186 104 86 70 548Dang 511 876 406 315 326 2 434Darchula 40 50 45 39 37 211Dhading 620 970 715 489 428 3 222Dhankuta 576 798 490 313 202 2 379Dhanusha 3 248 4 083 2 527 1 656 1 222 12 736Dolakha 348 555 387 267 257 1 814Dolpa 1 7 1 4 1 14Doti 42 62 47 25 23 199Gorkha 764 1 224 905 612 506 4 011Gulmi 1 737 2 316 1 865 1 469 996 8 383Humla 7 1 3 1 2 14Ilam 559 910 482 319 275 2 545Jajarkot 32 43 19 23 20 137Jhapa 2 880 4 174 2 187 1 509 1 340 12 090Jumla 2 12 6 6 2 28Kailali 226 280 150 118 135 909Kalikot 5 12 6 4 9 36Kanchanpur 231 343 185 130 157 1 046Kapilvastu 2 000 2 121 1 509 1 151 663 7 444Kaski 1 687 2 162 1 427 1 123 873 7 272Kathmandu 918 1 383 1 102 893 964 5 260Kavrepalanchowk 576 1 024 696 556 452 3 304Khotang 786 1 131 764 474 333 3 488
DATASET 2. Number of workers issued a labour permit who applied on their own (individual applicants), by 75 origin districts, 2012/13 – 2016/17
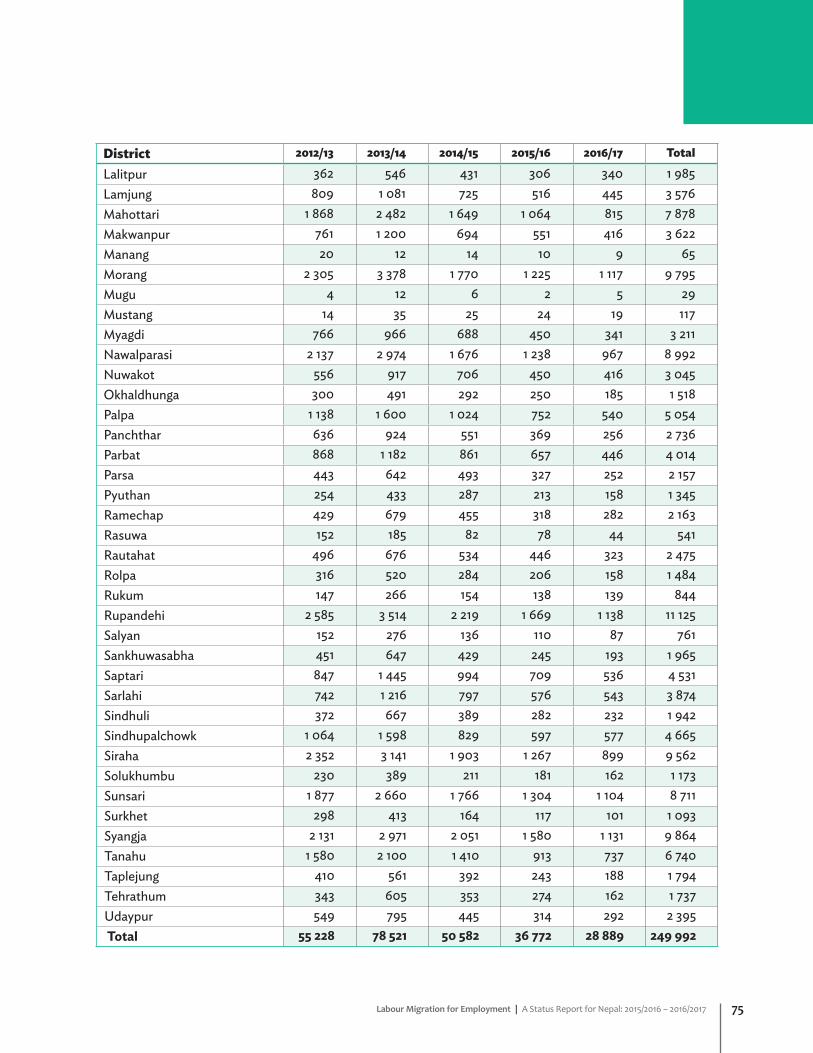
75Labour Migration for Employment | A Status Report for Nepal: 2015/2016 – 2016/2017
District 2012/13 2013/14 2014/15 2015/16 2016/17 Total
Lalitpur 362 546 431 306 340 1 985Lamjung 809 1 081 725 516 445 3 576Mahottari 1 868 2 482 1 649 1 064 815 7 878Makwanpur 761 1 200 694 551 416 3 622Manang 20 12 14 10 9 65Morang 2 305 3 378 1 770 1 225 1 117 9 795Mugu 4 12 6 2 5 29Mustang 14 35 25 24 19 117Myagdi 766 966 688 450 341 3 211Nawalparasi 2 137 2 974 1 676 1 238 967 8 992Nuwakot 556 917 706 450 416 3 045Okhaldhunga 300 491 292 250 185 1 518Palpa 1 138 1 600 1 024 752 540 5 054Panchthar 636 924 551 369 256 2 736Parbat 868 1 182 861 657 446 4 014Parsa 443 642 493 327 252 2 157Pyuthan 254 433 287 213 158 1 345Ramechap 429 679 455 318 282 2 163Rasuwa 152 185 82 78 44 541Rautahat 496 676 534 446 323 2 475Rolpa 316 520 284 206 158 1 484Rukum 147 266 154 138 139 844Rupandehi 2 585 3 514 2 219 1 669 1 138 11 125Salyan 152 276 136 110 87 761Sankhuwasabha 451 647 429 245 193 1 965Saptari 847 1 445 994 709 536 4 531Sarlahi 742 1 216 797 576 543 3 874Sindhuli 372 667 389 282 232 1 942Sindhupalchowk 1 064 1 598 829 597 577 4 665Siraha 2 352 3 141 1 903 1 267 899 9 562Solukhumbu 230 389 211 181 162 1 173Sunsari 1 877 2 660 1 766 1 304 1 104 8 711Surkhet 298 413 164 117 101 1 093Syangja 2 131 2 971 2 051 1 580 1 131 9 864Tanahu 1 580 2 100 1 410 913 737 6 740Taplejung 410 561 392 243 188 1 794Tehrathum 343 605 353 274 162 1 737Udaypur 549 795 445 314 292 2 395 Total 55 228 78 521 50 582 36 772 28 889 249 992
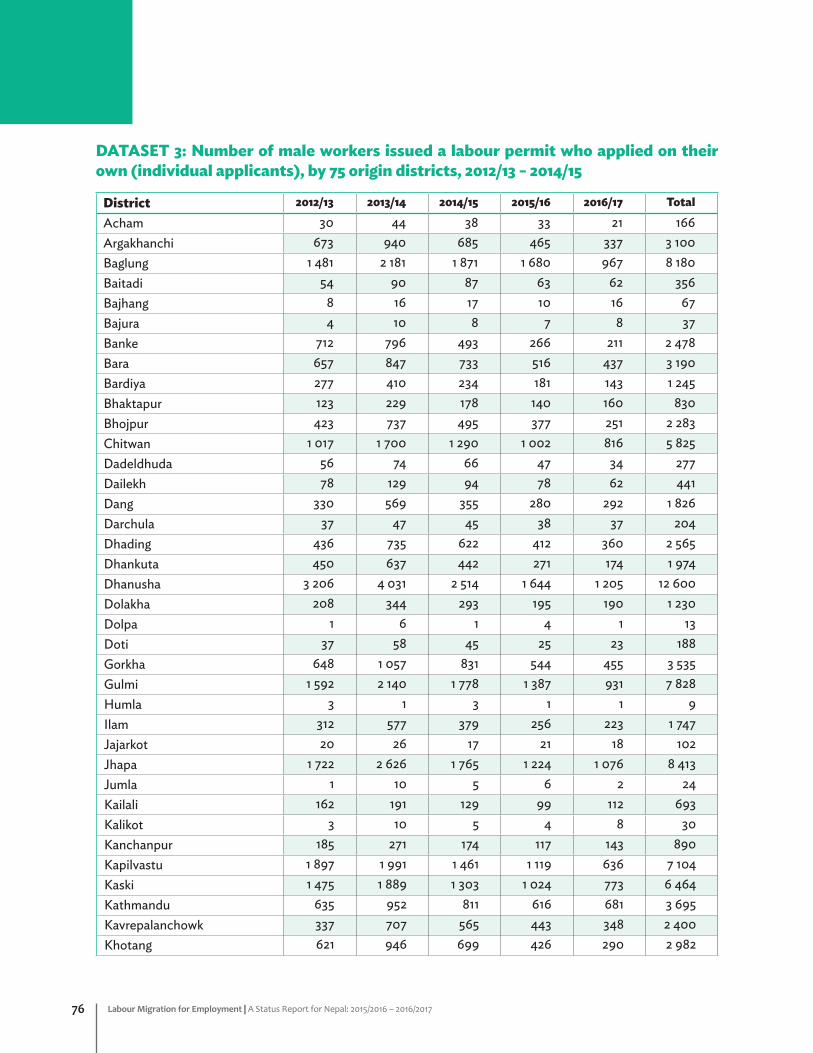
Labour Migration for Employment | A Status Report for Nepal: 2015/2016 – 2016/2017 76
DATASET 3: Number of male workers issued a labour permit who applied on their own (individual applicants), by 75 origin districts, 2012/13 – 2014/15
District 2012/13 2013/14 2014/15 2015/16 2016/17 Total
Acham 30 44 38 33 21 166Argakhanchi 673 940 685 465 337 3 100Baglung 1 481 2 181 1 871 1 680 967 8 180Baitadi 54 90 87 63 62 356Bajhang 8 16 17 10 16 67Bajura 4 10 8 7 8 37Banke 712 796 493 266 211 2 478Bara 657 847 733 516 437 3 190Bardiya 277 410 234 181 143 1 245Bhaktapur 123 229 178 140 160 830Bhojpur 423 737 495 377 251 2 283Chitwan 1 017 1 700 1 290 1 002 816 5 825Dadeldhuda 56 74 66 47 34 277Dailekh 78 129 94 78 62 441Dang 330 569 355 280 292 1 826Darchula 37 47 45 38 37 204Dhading 436 735 622 412 360 2 565Dhankuta 450 637 442 271 174 1 974Dhanusha 3 206 4 031 2 514 1 644 1 205 12 600Dolakha 208 344 293 195 190 1 230Dolpa 1 6 1 4 1 13Doti 37 58 45 25 23 188Gorkha 648 1 057 831 544 455 3 535Gulmi 1 592 2 140 1 778 1 387 931 7 828Humla 3 1 3 1 1 9Ilam 312 577 379 256 223 1 747Jajarkot 20 26 17 21 18 102Jhapa 1 722 2 626 1 765 1 224 1 076 8 413Jumla 1 10 5 6 2 24Kailali 162 191 129 99 112 693Kalikot 3 10 5 4 8 30Kanchanpur 185 271 174 117 143 890Kapilvastu 1 897 1 991 1 461 1 119 636 7 104Kaski 1 475 1 889 1 303 1 024 773 6 464Kathmandu 635 952 811 616 681 3 695Kavrepalanchowk 337 707 565 443 348 2 400Khotang 621 946 699 426 290 2 982

77Labour Migration for Employment | A Status Report for Nepal: 2015/2016 – 2016/2017
District 2012/13 2013/14 2014/15 2015/16 2016/17 Total
Lalitpur 255 394 341 230 253 1 473Lamjung 715 963 680 475 401 3 234Mahottari 1 827 2 434 1 631 1 053 805 7 750Makwanpur 361 674 532 404 305 2 276Manang 13 9 8 9 6 45Morang 1 477 2 351 1 494 1 006 928 7 256Mugu 3 5 5 2 3 18Mustang 14 29 23 20 12 98Myagdi 725 893 651 412 312 2 993Nawalparasi 1 649 2 361 1 529 1 091 866 7 496Nuwakot 351 616 565 325 323 2 180Okhaldhunga 231 408 255 207 155 1 256Palpa 984 1 428 937 683 499 4 531Panchthar 477 696 499 329 211 2 212Parbat 782 1 067 816 618 411 3 694Parsa 411 587 480 306 240 2 024Pyuthan 201 363 263 195 144 1 166Ramechap 281 463 387 257 226 1 614Rasuwa 39 66 56 41 29 231Rautahat 463 638 524 436 318 2 379Rolpa 274 456 267 198 150 1 345Rukum 119 218 142 126 130 735Rupandehi 2 226 2 945 2 019 1 512 1 019 9 721Salyan 86 178 127 92 79 562Sankhuwasabha 334 523 377 218 159 1 611Saptari 810 1 407 984 697 524 4 422Sarlahi 606 1 062 748 534 506 3 456Sindhuli 232 443 329 217 195 1 416Sindhupalchowk 338 597 491 323 343 2 092Siraha 2 334 3 120 1 891 1 256 893 9 494Solukhumbu 148 251 159 130 120 808Sunsari 1 421 2 046 1 595 1 182 982 7 226Surkhet 134 201 132 87 84 638Syangja 1 995 2 719 1 957 1 497 1 057 9 225Tanahu 1 437 1 933 1 340 861 672 6 243Taplejung 326 434 352 214 174 1 500Tehrathum 279 506 328 248 146 1 507Udaypur 368 582 376 258 243 1 827Total 44 637 64 090 45 821 32 770 25 427 212 745

Labour Migration for Employment | A Status Report for Nepal: 2015/2016 – 2016/2017 78
DATASET 4: Number of female workers issued a labour permit who applied on their own (individual applicants), by 75 origin districts, 2012/13 – 2016/17
District 2012/13 2013/14 2014/15 2015/16 2016/17 Total
Acham 1 7 1 1 1 11Argakhanchi 93 120 41 41 22 317Baglung 69 125 56 59 48 357Baitadi 2 4 7 0 1 14Bajhang 1 4 0 0 0 5Bajura 2 0 2 0 0 4Banke 105 174 36 24 22 361Bara 72 88 22 16 26 224Bardiya 162 203 44 35 30 474Bhaktapur 53 63 40 47 48 251Bhojpur 139 235 43 48 36 501Chitwan 350 496 176 160 140 1 322Dadeldhuda 2 6 2 1 4 15Dailekh 24 57 10 8 8 107Dang 181 307 51 35 34 608Darchula 3 3 0 1 0 7Dhading 184 235 93 77 68 657Dhankuta 126 161 48 42 28 405Dhanusha 42 52 13 12 17 136Dolakha 140 211 94 72 67 584Dolpa 0 1 0 0 0 1Doti 5 4 2 0 0 11Gorkha 116 167 74 68 51 476Gulmi 145 176 87 82 65 555Humla 4 0 0 0 1 5Ilam 247 333 103 63 52 798Jajarkot 12 17 2 2 2 35Jhapa 1 158 1 548 422 285 264 3 677Jumla 1 2 1 0 0 4Kailali 64 89 21 19 23 216Kalikot 2 2 1 0 1 6Kanchanpur 46 72 11 13 14 156Kapilvastu 103 130 48 32 27 340Kaski 212 273 124 99 100 808Kathmandu 283 431 291 277 283 1 565Kavrepalanchowk 239 317 131 113 104 904Khotang 165 185 65 48 43 506

79Labour Migration for Employment | A Status Report for Nepal: 2015/2016 – 2016/2017
District 2012/13 2013/14 2014/15 2015/16 2016/17 Total
Lalitpur 107 152 90 76 87 512Lamjung 94 118 45 41 44 342Mahottari 41 48 18 11 10 128Makwanpur 400 526 162 147 111 1 346Manang 7 3 6 1 3 20Morang 828 1 027 276 219 189 2 539Mugu 1 7 1 0 2 11Mustang 0 6 2 4 7 19Myagdi 41 73 37 38 29 218Nawalparasi 488 613 147 147 101 1 496Nuwakot 205 301 141 125 93 865Okhaldhunga 69 83 37 43 30 262Palpa 154 172 87 69 41 523Panchthar 159 228 52 40 45 524Parbat 86 115 45 39 35 320Parsa 32 55 13 21 12 133Pyuthan 53 70 24 18 14 179Ramechap 148 216 68 61 56 549Rasuwa 113 119 26 37 15 310Rautahat 33 38 10 10 5 96Rolpa 42 64 17 8 8 139Rukum 28 48 12 12 9 109Rupandehi 359 569 200 157 119 1 404Salyan 66 98 9 18 8 199Sankhuwasabha 117 124 52 27 34 354Saptari 37 38 10 12 12 109Sarlahi 136 154 49 42 37 418Sindhuli 140 224 60 65 37 526Sindhupalchowk 726 1 001 338 274 234 2 573Siraha 18 21 12 11 6 68Solukhumbu 82 138 52 51 42 365Sunsari 456 614 171 122 122 1 485Surkhet 164 212 32 30 17 455Syangja 136 252 94 83 74 639Tanahu 143 167 70 52 65 497Taplejung 84 127 40 29 14 294Tehrathum 64 99 25 26 16 230Udaypur 181 213 69 56 49 568Total 10 591 14 431 4 761 4 002 3 462 37 247

Labour Migration for Employment | A Status Report for Nepal: 2015/2016 – 2016/2017 80
DATA
SET
5: D
estin
atio
n co
untr
ies a
nd te
rrito
ries o
f mig
rant
wor
kers
, exc
ludi
ng in
divi
dual
app
lican
ts fo
r lab
our
perm
its,
by
sex,
200
8/09
- 20
16/1
7
Coun
try/
terr
itory
20
08/0
920
09/1
020
10/1
120
11/1
220
12/1
320
13/1
420
14/1
520
15/1
620
16/1
7
Mal
e Fe
mal
e To
tal
Mal
e Fe
male
To
tal
Mal
e Fe
male
To
tal
Mal
e Fe
male
To
tal
Mal
e Fe
male
To
tal
Mal
e Fe
male
To
tal
Mal
e Fe
male
To
tal
Mal
e Fe
mal
eTo
tal
Mal
e Fe
male
To
tal
Mala
ysia
29 17
914
129
320
110
685
681
111 3
6610
4 64
41 3
8510
6 02
994
070
2 20
296
272
150
021
7 18
215
7 20
320
032
26
005
206
327
188
550
5 68
219
4 23
256
443
1 562
58 0
0592
290
2 00
294
292
UAE
23 9
2113
624
057
17 18
759
117
778
23 0
041 0
4324
047
31 7
572
746
34 5
0344
146
7 27
351
419
38 7
133
880
42 5
9337
702
5 92
743
629
38 2
786
416
44 6
9444
454
6 39
350
847
Qat
ar54
678
4554
723
25 5
5062
25 6
1235
857
8635
943
44 4
9638
744
883
85 15
268
585
837
102
116
1 952
104
068
103
814
2 12
310
5 93
711
4641
1344
1159
8511
1 150
2 35
411
3504
Leba
non
976
650
1 626
1 168
1 840
3 00
820
2141
20
230
151
181
162
285
447
4313
818
10
00
61
7
Cypr
us0
00
00
00
00
140
4137
326
363
431 1
721 2
1535
1 271
1 306
7214
1914
9193
1 246
1 339
Saud
i Ara
bia
45 0
0737
45 0
4459
445
104
59 5
4962
356
143
62 4
9967
923
180
68 10
385
787
339
86 12
674
568
442
75 0
1089
402
415
89 8
1712
9 68
714
2513
1 112
70 8
031 0
8171
884
Kuwa
it41
00
410
2 26
224
2 28
67
895
867
981
8 82
833
79
165
7 68
320
77
890
8 63
733
48
971
7 29
234
87
640
8249
387
8 63
611
601
471
12 0
72
Bahr
ain4
284
424
326
1 226
721 2
981 7
4113
61 8
772
834
266
3 10
02
430
105
2 53
51 5
5295
1 647
1 975
269
2 24
42
033
248
2 28
1 3
032
193
3 22
5
Jord
an12
012
202
020
213
00
130
441
117
558
183
337
520
185
255
440
129
256
385
255
952
1207
554
2172
2726
Om
an1 7
780
1 778
1 860
21 8
6299
97
1 006
1 841
431 8
841 9
7735
42
331
1 027
121
1 148
1028
5410
8215
5349
420
4719
6726
62
233
Israe
l89
535
11 2
4615
015
580
584
37
00
00
00
00
00
00
00
0
Japa
n0
00
23
541
3172
8385
168
6610
016
694
8918
369
2998
8018
9890
1210
2
Turk
ey0
00
00
06
1925
643
492
5456
135
361
7172
059
5928
330
158
4
Mald
ives
300
3047
047
2314
370
77
025
2528
7610
445
045
1747
6443
4285
Hon
g Kon
g,
Chin
a 61
061
4019
5946
2167
123
1714
013
013
143
127
1213
912
934
163
182
1920
114
616
162
Mau
ritiu
s0
00
642
480
00
300
3013
30
133
142
014
217
20
172
140
1442
042
Rom
ania
00
00
00
00
052
1971
1718
3510
414
10
15
2025
6061
121
Polan
d0
00
00
027
3158
00
00
00
00
00
00
230
2386
086
Mac
au, C
hina
17
70
177
380
3823
93
242
356
335
931
17
318
380
1139
145
133
484
339
2736
622
723
250
Seyc
helle
s4
04
450
4529
029
106
110
740
040
130
134
04
00
023
023
Afgh
anist
an18
90
189
306
030
642
90
429
486
048
618
50
185
279
027
938
00
380
212
021
223
60
236
Alge
ria0
00
00
099
099
480
480
00
00
00
00
660
6658
058
Egyp
t0
00
00
00
00
250
250
00
00
00
00
132
013
215
015
Lao
Peop
le’s
Dem
ocra
tic
Repu
blic
00
00
00
00
00
00
500
5057
057
00
00
00
00
0
Liby
a*84
40
844
1 659
01 6
5929
10
291
00
00
00
00
00
00
00
00
00
Portu
gal
00
00
00
00
00
00
350
3536
036
123
012
312
40
124
250
25
Dem
ocra
tic
Repu
blic
of
Cong
o0
00
00
00
00
00
046
046
380
3857
057
290
290
00

81Labour Migration for Employment | A Status Report for Nepal: 2015/2016 – 2016/2017
Coun
try/
terr
itory
20
08/0
920
09/1
020
10/1
120
11/1
220
12/1
320
13/1
420
14/1
520
15/1
620
16/1
7
Mal
e Fe
mal
e To
tal
Mal
e Fe
male
To
tal
Mal
e Fe
male
To
tal
Mal
e Fe
male
To
tal
Mal
e Fe
male
To
tal
Mal
e Fe
male
To
tal
Mal
e Fe
male
To
tal
Mal
e Fe
mal
eTo
tal
Mal
e Fe
male
To
tal
Russ
ian
Fede
ratio
n 10
010
40
44
04
00
06
06
30
34
04
00
00
00
Sing
apor
e0
00
00
00
00
90
90
00
00
00
00
00
00
00
Uzb
ekist
an0
00
00
00
00
00
00
00
00
042
00
420
00
00
00
Kaza
khst
an0
00
00
00
00
00
00
00
00
011
011
00
00
00
Uni
ted
Stat
es
290
2913
013
130
1313
013
00
00
00
00
00
00
00
0
Zam
bia
00
00
00
00
00
00
00
00
00
100
100
00
00
0
Uni
ted
King
dom
00
00
00
00
00
00
180
1827
027
230
230
00
00
0
Finl
and
00
00
00
00
00
00
00
00
00
00
00
11
00
0
Czec
h Re
publ
ic0
00
00
00
00
00
00
00
00
00
00
2722
4959
968
Tota
l16
2 484
1 402
163
886
221 7
603 4
4022
5 200
237 9
513 0
2624
0 97
725
3 534
6 49
626
0 03
037
8 485
17 17
639
5 661
428 5
6014
7 68
443 3
2843
1 870
16 6
5044
8 520
352 4
6114
460
366
921
337 3
4316
643
353 9
86

Labour Migration for Employment | A Status Report for Nepal: 2015/2016 – 2016/2017 82
DAT
ASE
T 6:
Des
tina
tion
coun
trie
s and
terr
itor
ies o
f ind
ivid
ual a
pplic
ants
issu
ed a
labo
ur p
erm
it, b
y se
x,20
12/1
3 – 0
16/1
7
S.N
. C
ount
ry/t
erri
tory
2012
/13
2013
/14
2014
/15
2015
/16
2016
/17
Mal
eFe
mal
eTo
tal
Mal
eFe
mal
eTo
tal
Mal
eFe
mal
eTo
tal
Mal
eFe
mal
eTo
tal
Mal
eFe
mal
eTo
tal
1A
fgha
nist
an16
83
171
319
632
51 1
396
1 145
1 205
21 2
071 1
284
1 132
2A
frica
20
020
190
191
01
30
32
02
3A
lban
ia0
00
00
00
00
10
10
00
4A
lger
ia1
01
20
22
02
30
30
00
5A
ngol
a5
05
120
129
09
50
55
05
6A
ntig
ua &
Bar
buda
00
00
00
00
02
02
01
17
Arg
entin
a0
00
00
00
00
10
10
00
8A
rmen
ia1
01
00
00
00
00
00
00
9A
ustra
lia43
851
5812
7044
1256
643
6711
91
120
10A
ustr
ia1
34
23
53
47
12
33
36
11A
zerb
aija
n2
02
123
1511
314
65
113
25
12Ba
ham
as0
00
61
71
01
04
41
01
13Ba
hrai
n1 5
1620
41 7
202
384
387
2 77
11 6
5227
21 9
2477
874
852
607
7968
614
Bang
lade
sh1
01
10
12
13
10
13
14
15Ba
rbad
os0
00
10
10
00
10
14
04
16Be
laru
s0
00
00
00
00
01
10
00
17Be
lgiu
m0
11
00
01
12
01
10
00
18Be
nin
00
01
01
00
00
00
40
419
Berm
uda
41
523
023
70
711
011
131
1420
Braz
il1
12
103
133
25
83
1116
016
21Br
itish
Virg
in Is
land
s0
00
10
10
00
20
21
12
22Br
unei
Dar
ussa
lam
234
824
220
86
214
135
413
914
92
151
156
215
823
Burk
ina
Faso
00
00
00
10
10
00
00
024
Buru
ndi
00
01
01
00
00
00
10
125
Cam
bodi
a13
013
163
199
413
141
1512
517
26Ca
mer
oon
00
00
00
10
10
00
00
027
Cana
da67
1986
173
3620
915
432
186
6827
9539
1958
28Ca
yman
Isla
nds
171
1817
421
328
4039
1655
8016
9629
Chile
00
03
14
70
715
015
324
3630
Chin
a56
258
103
110
448
654
170
1118
117
79
186

83Labour Migration for Employment | A Status Report for Nepal: 2015/2016 – 2016/2017
S.N
. C
ount
ry/t
erri
tory
2012
/13
2013
/14
2014
/15
2015
/16
2016
/17
Mal
eFe
mal
eTo
tal
Mal
eFe
mal
eTo
tal
Mal
eFe
mal
eTo
tal
Mal
eFe
mal
eTo
tal
Mal
eFe
mal
eTo
tal
31Co
lom
bia
00
06
06
00
00
00
00
032
Com
oros
00
06
06
00
04
04
90
933
Cong
o24
125
290
2913
114
310
3122
022
34Co
ok Is
land
s0
00
00
01
01
10
10
00
35Cr
oatia
20
20
00
10
18
08
51
636
Cypr
us34
4377
911
206
814
57
1212
820
37Cz
ech
Repu
blic
80
810
010
120
1228
028
105
2012
538
Den
mar
k7
1320
1123
349
2231
732
3916
2339
39D
jibou
ti7
18
90
919
019
80
85
05
40D
omin
ican
Rep
ublic
00
00
00
00
01
01
10
141
East
Tim
or0
00
10
10
00
00
01
01
42Eg
ypt
1721
3826
1743
188
2628
3058
1916
3543
Eritr
ea0
00
10
11
01
00
01
01
44Es
toni
a3
03
40
42
02
20
20
00
45Et
hiop
ia0
00
20
22
02
00
02
02
46Fi
ji0
00
00
02
02
00
04
15
47Fi
nlan
d51
253
5710
6772
577
444
4845
045
48Fr
ance
104
1415
116
182
2028
230
191
2049
Fren
ch P
olyn
esia
10
10
00
00
00
00
00
050
Gab
on4
48
12
32
02
30
317
017
51G
eorg
ia1
01
00
01
01
10
10
00
52G
erm
any
2214
516
762
285
347
8427
936
346
432
478
8440
248
653
Gha
na8
08
120
124
04
20
25
05
54G
reec
e0
00
181
197
29
184
224
48
55G
uine
a5
05
62
84
04
20
22
02
56H
ong
Kong
, Chi
na
109
1991
1610
714
013
153
153
716
011
213
57H
unga
ry5
27
10
13
03
10
10
00
58Ic
elan
d4
26
40
43
25
50
54
15
59In
done
sia5
05
110
1112
012
60
60
00
60Isl
amic
Repu
blic
of Ir
an0
00
30
31
01
00
01
01
61Ire
land
50
53
03
20
20
00
20
262
Isra
el70
7014
017
950
067
913
632
646
282
108
190
5676
132

Labour Migration for Employment | A Status Report for Nepal: 2015/2016 – 2016/2017 84
S.N
. C
ount
ry/t
erri
tory
2012
/13
2013
/14
2014
/15
2015
/16
2016
/17
Mal
eFe
mal
eTo
tal
Mal
eFe
mal
eTo
tal
Mal
eFe
mal
eTo
tal
Mal
eFe
mal
eTo
tal
Mal
eFe
mal
eTo
tal
63Ita
ly41
1455
6329
9237
1249
177
2417
1229
64Iv
ory C
oast
00
01
01
10
10
00
10
165
Jam
aica
41
53
03
10
15
05
20
266
Japa
n1 0
4926
1 075
1 785
501 8
352
696
652
761
3 64
510
23
747
2065
702
135
67Jo
rdan
433
4655
055
344
3825
328
82
1068
Kaza
khst
an1
01
40
43
03
80
86
17
69Ke
nya
200
2027
027
200
207
18
211
2270
Repu
blic
of K
orea
207
321
01 2
3748
1 285
129
113
078
280
891
9071
Koso
vo1
01
00
04
04
00
01
01
72Ku
wai
t2
185
7 30
19
486
2 74
98
476
11 2
251 4
2057
21 9
9293
536
91 3
0469
936
31 0
62
73La
o Pe
ople
’sD
emoc
ratic
Rep
ublic
2
02
31
41
01
40
41
01
74La
tvia
10
12
02
40
43
03
50
575
Leba
non
189
210
399
144
539
683
9533
042
551
116
167
3910
013
976
Libe
ria1
01
100
108
08
60
61
01
77Li
bya*
00
00
00
00
00
00
00
078
Lith
uani
a1
01
20
23
03
70
710
10
101
79Lu
xem
bour
g9
09
70
710
010
140
143
36
80M
acau
, Chi
na22
24
226
405
2342
835
616
372
215
722
216
712
179
81M
adag
asca
r1
01
60
66
06
120
126
06
82M
alaw
i2
13
70
73
03
80
84
04
83M
alay
sia1 4
2634
1 460
3 60
874
3 68
21 9
6136
1 997
996
321 0
2892
527
952
84M
aldi
ves
301
7737
852
111
363
440
713
454
144
221
265
458
128
586
685
Mal
i1
01
60
66
06
70
712
012
86M
alta
00
04
04
100
1010
1020
9254
146
87M
aurit
ania
20
20
00
10
12
02
10
188
Mau
ritiu
s11
011
170
1712
012
60
612
012
89M
exic
o0
00
30
30
00
10
13
03
90M
ongo
lia3
03
10
11
01
20
21
01
91M
oroc
co1
01
100
107
18
00
03
03
92M
ozam
biqu
e6
06
150
157
07
100
1010
010
93M
yanm
ar1
01
10
10
00
40
41
01

85Labour Migration for Employment | A Status Report for Nepal: 2015/2016 – 2016/2017
S.N
. C
ount
ry/t
erri
tory
2012
/13
2013
/14
2014
/15
2015
/16
2016
/17
Mal
eFe
mal
eTo
tal
Mal
eFe
mal
eTo
tal
Mal
eFe
mal
eTo
tal
Mal
eFe
mal
eTo
tal
Mal
eFe
mal
eTo
tal
94N
amib
ia0
00
10
11
01
00
01
01
95N
ethe
rland
42
66
06
50
518
119
163
1996
New
Zea
land
3313
4651
1364
509
5978
1795
144
2817
297
Nig
eria
202
2227
027
150
1516
016
81
998
Nor
way
190
1933
336
133
1625
530
170
1799
Om
an1 0
4655
41 6
001 2
771 0
282
305
851
375
1 226
686
303
989
579
254
833
100
Paki
stan
52
75
16
43
74
04
02
210
1Pa
lau
50
512
012
20
21
23
106
1610
2Pa
pua
New
Gui
nea
354
3935
540
250
2533
235
343
3710
3Pe
ru0
00
00
00
00
00
01
01
104
Phili
ppin
es0
00
20
22
02
00
06
06
105
Pola
nd54
155
5416
7038
341
904
9438
932
421
106
Port
ugal
111
1226
430
342
365
05
00
010
7Q
atar
17 7
6533
018
095
24 14
433
824
482
17 9
2417
118
095
11 7
7314
511
918
7 47
814
67
624
108
Equa
toria
l Gui
nea
10
18
19
00
05
05
00
010
9Iv
ory C
oast
10
10
00
00
00
00
00
011
0Re
publ
ic of
Mac
edon
ia0
00
21
30
00
00
00
00
111
Rom
ania
31
41
67
21
33
14
32
511
2Ru
ssia
n Fe
dera
tion
127
313
011
68
124
168
717
526
026
191
2011
3Rw
anda
40
42
02
10
14
04
10
111
4Sa
ipan
82
101
01
22
44
26
70
711
5Sa
moa
00
00
00
00
00
00
10
111
6Sa
udi A
rabi
a10
475
302
10 7
7711
177
426
11 6
036
720
258
6 97
83
599
973
696
1 923
852
008
117
Sene
gal
30
32
02
20
23
03
30
311
8Se
yche
lles
121
712
816
67
173
160
116
123
426
260
287
3632
311
9Si
erra
Leo
ne1
01
00
01
01
50
58
08
120
Sing
apor
e38
240
119
712
672
375
845
8914
35
148
121
Slov
enia
00
00
00
10
10
00
00
012
2So
mal
ia2
02
70
78
08
310
318
08
123
Sout
h A
frica
120
1224
125
102
1235
136
187
319
012
4So
uth
Suda
n0
00
70
76
06
40
47
07
125
Spai
n9
09
7913
9247
552
387
4515
419

Labour Migration for Employment | A Status Report for Nepal: 2015/2016 – 2016/2017 86
S.N
. C
ount
ry/t
erri
tory
2012
/13
2013
/14
2014
/15
2015
/16
2016
/17
Mal
eFe
mal
eTo
tal
Mal
eFe
mal
eTo
tal
Mal
eFe
mal
eTo
tal
Mal
eFe
mal
eTo
tal
Mal
eFe
mal
eTo
tal
126
Sri L
anka
170
1712
12
123
991
100
431
4410
30
103
127
Suda
n12
113
180
189
09
120
122
02
128
Swaz
iland
00
07
07
80
80
00
00
012
9Sw
eden
610
165
510
51
67
07
73
1013
0Sw
itzer
land
01
11
34
12
34
26
02
213
1Sy
ria1
01
00
00
00
00
00
00
132
Taiw
an P
rovin
ce o
f Ch
ina
00
00
11
00
00
00
10
1
133
Tajik
istan
00
00
00
10
10
00
40
413
4Ta
nzan
ia27
027
350
3525
025
210
2123
023
135
Tim
or-L
este
10
10
00
10
10
00
00
013
6Th
aila
nd42
446
536
5936
137
192
2124
226
137
Trin
idad
20
20
00
31
43
14
00
013
8Tu
nisia
00
03
03
10
11
01
00
013
9Tu
rkey
13
413
013
123
1517
1835
378
4514
0Tu
rkm
enist
an0
00
10
12
02
10
10
00
141
Turk
s and
Cai
cos
Isla
nd0
00
90
99
09
21
35
05
142
Uni
ted
Ara
b Em
irate
s 6
149
1 018
7 16
711
125
1 708
12 8
337
858
1 594
9 45
25
780
1 617
7 39
75
914
1 126
7 04
014
3U
gand
a22
224
120
1220
121
200
2016
016
144
Ukr
aine
50
50
00
00
00
00
00
014
5U
nite
d Ki
ngdo
m89
2311
213
635
171
6233
9549
2675
3028
5814
6U
rugu
ay1
01
00
01
01
20
21
01
147
Uni
ted
Stat
es
251
6031
150
110
660
740
985
494
384
7545
925
662
318
148
Uzb
ekist
an1
01
00
02
02
00
00
00
149
Vanu
atu
10
10
00
00
00
00
30
315
0Vi
et N
am5
05
10
13
03
80
86
06
151
Wes
t Ind
ies
41
52
02
20
22
02
00
015
2Ye
men
120
1213
013
40
40
00
00
015
3Za
mbi
a2
02
50
54
04
60
621
122
Tot
al44
637
10 59
155
228
64 0
9014
431
78 5
2145
821
4 76
150
582
32 7
664
000
36 7
6625
483
3 477
28 9
60

87Labour Migration for Employment | A Status Report for Nepal: 2015/2016 – 2016/2017
DATASET 7: Reported number of deaths, country wise, 2008/09 – 2016/17
Country 2008/09 2009/10 2010/11 2011/12 2012/13 2013/14 2014/15 2015/16 2016/17 Total
Malaysia 15 105 219 237 253 306 424 337 258 2 154Saudi Arabia 27 124 133 179 206 220 275 223 251 1 638Qatar 26 114 125 130 151 208 181 126 142 1 203United ArabEmirates 13 53 37 50 47 69 59 54 45 427
Kuwait 3 10 22 22 39 33 40 17 186Bahrain 2 5 12 8 14 8 12 10 6 77Republic of Korea 1 1 6 6 14 15 10 13 11 77Oman 4 4 1 6 7 14 3 4 4 47Lebanon 2 6 4 3 3 2 20Israel 1 3 3 7Japan 2 2 2 1 2 4 13Afghanistan 2 1 1 3 12 19Sri Lanka 1 1 2Russia 2 1 3Germany 1 1Maldives 1 2 2 5Papua New Guinea 1 1United States 1 1Libya 1 1Italy 1 1Canada 1 1Mauritius 1 1Poland 1 1Uganda 1 1Sierra Leone 1 1Tanzania 1 1Egypt 1 1Nigeria 1 1Unknown 1 1Total 90 418 549 646 727 888 1 006 813 755 5 892

Labour Migration for Employment | A Status Report for Nepal: 2015/2016 – 2016/2017 88
Ann
ex II
: Nat
ure
of co
mpl
aint
s
2071
/72
2072
/73
2073
/74
Nat
ure
Indi
vidu
alIn
stit
utio
nal
Tota
lN
atur
eIn
divi
dual
Inst
itut
iona
lTo
tal
Nat
ure
Indi
vidu
alIn
stit
utio
nal
Tota
l
Act
ion
agai
nst
the
culp
rit a
nd
the
amou
nt a
nd
com
pens
atio
n
270
620
890
Act
ion
agai
nst
the
culp
rit a
nd
the
amou
nt a
nd
com
pens
atio
n
671
485
1156
Com
pens
atio
n10
352
362
Act
ion,
refu
nd
and
repa
tria
tion
alon
g w
ith
com
pens
atio
n
634
034
6
Act
ion,
refu
nd
and
repa
tria
tion
alon
g w
ith
com
pens
atio
n
723
824
5A
ctio
n an
d co
mpe
nsat
ion
145
119
264
Com
pens
atio
n0
198
198
Act
ion
and
com
pens
atio
n0
188
188
Act
ion
agai
nst
the
culp
rit a
nd
the
amou
nt a
nd
com
pens
atio
n
4334
77
Com
pens
atio
n1
192
193
Act
ion
agai
nst
the
culp
rit
and
retu
rn th
e pa
sspo
rt
486
90Re
patr
iatio
n an
d co
mpe
nsat
ion
344
47
Resc
ue a
nd
repa
tria
tion
414
514
9Re
turn
the
pass
port
089
89
Act
ion,
refu
nd
and
repa
tria
tion
alon
g w
ith
com
pens
atio
n
127
28
Retu
rn th
e pa
sspo
rt0
102
102
Act
ion
agai
nst
the
culp
rit a
nd
repa
tria
tion
063
63Ta
ke n
eces
sary
ac
tion
and
prov
ide
sala
ry4
2226
Act
ion
and
co
mpe
nsat
ion
092
92
Act
ion
agai
nst
the
culp
rit
and
retu
rn th
e pa
sspo
rt
054
54A
ctio
n ag
ains
t th
e cu
lprit
re
fund
916
25
Act
ion
agai
nst
the
culp
rit
and
retu
rn th
e pa
sspo
rt a
nd
the
amou
nt
677
83Co
mpe
nsat
ion
046
46Re
turn
the
pass
port
023
23

89Labour Migration for Employment | A Status Report for Nepal: 2015/2016 – 2016/2017
2071
/72
2072
/73
2073
/74
Nat
ure
Indi
vidu
alIn
stit
utio
nal
Tota
lN
atur
eIn
divi
dual
Inst
itut
iona
lTo
tal
Nat
ure
Indi
vidu
alIn
stit
utio
nal
Tota
l
Repa
tria
tion
and
com
pens
atio
n0
6464
Com
pens
atio
n0
3030
Act
ion
agai
nst
the
culp
rit a
nd
repa
tria
tion
219
21
Am
ount
co
mpe
nsat
ion
349
52Re
scue
and
re
patr
iatio
n0
2828
Am
ount
co
mpe
nsat
ion
317
20
Act
ion
agai
nst
the
culp
rit a
nd
repa
tria
tion
041
41A
ctio
n0
2020
Act
ion
agai
nst
the
culp
rit
and
retu
rn th
e pa
sspo
rt a
nd
the
amou
nt
117
18
Act
ion
agai
nst
the
culp
rit
and
retu
rn th
e pa
sspo
rt
235
37Re
patr
iatio
n al
ong
with
co
mpe
nsat
ion
017
17Re
patr
iatio
n0
1414
Act
ion
agai
nst
the
culp
rit a
nd
refu
nd6
2632
Act
ion
agai
nst
the
culp
rit a
nd
refu
nd2
810
Act
ion
agai
nst
the
culp
rit
and
retu
rn th
e pa
sspo
rt
013
13
Retu
rn th
e pa
sspo
rt a
nd
the
amou
nt0
2525
Repa
tria
tion
and
co
mpe
nsat
ion
06
6Re
turn
the
pass
port
and
th
e am
ount
47
11
Act
ion
222
24Re
patr
iatio
n an
d co
mpe
nsat
ion
15
6Re
scue
and
ac
tion
agai
nst
the
culp
rit4
610
Repa
tria
tion
alon
g w
ith
com
pens
atio
n 0
1818
Take
nec
essa
ry
actio
n an
d pr
ovid
e sa
lary
06
6M
edic
al
treat
men
t0
88
Refu
nd0
1414
Retu
rn th
e pa
sspo
rt a
nd th
e am
ount
04
4Re
fund
4
48
Fore
ign
empl
oym
ent
fraud
23
5Re
fund
04
4Re
mun
erat
ion
07
7

Labour Migration for Employment | A Status Report for Nepal: 2015/2016 – 2016/2017 90
2071
/72
2072
/73
2073
/74
Nat
ure
Indi
vidu
alIn
stit
utio
nal
Tota
lN
atur
eIn
divi
dual
Inst
itut
iona
lTo
tal
Nat
ure
Indi
vidu
alIn
stit
utio
nal
Tota
l
Prov
ide
just
ice
and
com
pens
atio
n0
55
Prov
ide
just
ice
and
com
pens
atio
n0
33
Resc
ue
06
6
Take
nec
essa
ry
actio
n an
d pr
ovid
e sa
lary
04
4Pr
ovid
e th
e in
sura
nce
amou
nt1
12
Resc
ue a
nd
repa
tria
tion
04
4
Repa
tria
tion
of a
nd re
ceiv
e de
ad b
ody a
nd
com
pens
atio
n
03
3
Repa
tria
tion
of a
nd re
ceiv
e de
ad b
ody a
nd
com
pens
atio
n
10
1Re
patr
iatio
n al
ong
with
co
mpe
nsat
ion
03
3
Nec
essa
ry
assis
tanc
e0
33
Resc
ued
and
actio
n ag
ains
t th
e cu
lprit
01
1Re
scue
and
co
mpe
nsat
ion
03
3
Prov
ide
the
insu
ranc
e am
ount
21
3M
edic
al
treat
men
t0
11
Sett
lem
ent
11
2
Resc
ue a
nd
com
pens
atio
n0
33
Att
empt
to
char
ge m
ore
amou
nt th
an th
e ac
tual
cos
t
01
1
Sala
ry
diffe
renc
e fro
m
the
cont
ract
pr
ovisi
on
02
2
Resc
ue a
nd
actio
n ag
ains
t th
e cu
lprit
02
2Re
scue
01
1
Repa
tria
ted
whi
le n
ot
rece
ivin
g sa
lary
an
d fa
cilit
ies a
s pe
r the
con
tract
02
2
Refu
nd a
fter
dedu
ctin
g th
e de
posit
02
2Sa
lary
diff
eren
ce
from
the
cont
ract
pr
ovisi
on0
11
Repa
tria
tion
of a
nd re
ceiv
e de
ad b
ody a
nd
com
pens
atio
n
01
1
Resc
ue0
11
Insu
ranc
e am
ount
and
co
mpe
nsat
ion
01
1N
eces
sary
as
sista
nce
01
1

91Labour Migration for Employment | A Status Report for Nepal: 2015/2016 – 2016/2017
2071
/72
2072
/73
2073
/74
Nat
ure
Indi
vidu
alIn
stit
utio
nal
Tota
lN
atur
eIn
divi
dual
Inst
itut
iona
lTo
tal
Nat
ure
Indi
vidu
alIn
stit
utio
nal
Tota
l
Sala
ry
diffe
renc
e fro
m
the
cont
ract
pr
ovisi
on
01
1Ju
stic
e1
01
Act
ion
01
1
Just
ice
01
1Vi
sa c
ance
llatio
n0
11
Prov
ide
just
ice
and
com
pens
atio
n0
11
Visa
ca
ncel
latio
n0
11
Rem
uner
atio
n0
11
Retu
rn th
e ci
tizen
ship
ce
rtifi
cate
01
1
Rele
ase
from
th
e pr
ison
and
prov
ide
empl
oym
ent
01
1
Repa
tria
ted
whi
le
not r
ecei
ving
th
e sa
lary
and
fa
cilit
ies a
s per
th
e co
ntra
ct
01
1To
tal
1009
Retu
rn th
e ci
tizen
ship
ce
rtifi
cate
10
1To
tal
2078
Rem
uner
atio
n0
11
Tota
l 23
97

Labour Migration for Employment | A Status Report for Nepal: 2015/2016 – 2016/2017 92

93Labour Migration for Employment | A Status Report for Nepal: 2015/2016 – 2016/2017

Labour Migration for Employment | A Status Report for Nepal: 2015/2016 – 2016/2017 94
Government of NepalMinistry of Labour and Employment
Kathmandu, Nepal