Labour and Social Trends in Indonesia 2012: Working for a ...
22
Labour and Social Trends in Indonesia 2012: Working for a sustainable and equitable economy Emma Allen ILO Country Office of Indonesia and Timor-Leste Jakarta, Indonesia
Transcript of Labour and Social Trends in Indonesia 2012: Working for a ...
Labour and Social Trends in Indonesia 2012:
Working for a sustainable and equitable economy
Emma Allen
ILO Country Office of Indonesia
and Timor-Leste
Jakarta, Indonesia
Introduction
Today’s presentation will discuss a number of trends in
the labour market, including:
•Economic growth trends
•Labour force participation
•Unemployment and educational attainment
•Working hours
•Vulnerability and formality
•Sectoral structure
•Wages
We then move to discuss issues related to:
•Economic inclusion
•Social protection
•Environmental sustainability
“Economic growth,
social inclusion
and environmental
sustainability are
inseparable goals
and employment is
a key intersection
that can bring these
goals together.”
Peter van Rooij,
Director, ILO Country
Office for Indonesia

Economic trends
Positive
growth trends
have
continued in
2012 thanks
to strong
focus on
economic
infrastructure,
robust
household
consumption
and growing
investment.
-15
-10
-5
0
5
10
1519
62
19
64
19
66
19
68
19
70
19
72
19
74
19
76
19
78
19
80
19
82
19
84
19
86
19
88
19
90
19
92
19
94
19
96
19
98
20
00
20
02
20
04
20
06
20
08
20
10
An
nu
al
GD
P g
row
th in
perc
en
tag
e p
oin
ts
Indonesia GDP growth (annual %) World GDP growth (annual %)
Indonesia decade average for GDP annual growth World decade average for GDP annual growth

Labour force participation
An additional
1,137,755 jobs
were added to
the economy
between
August 2011
and August
2012
Employment
growth
continued to
outpace labour
force growth.
Unemployment
continues to
decline.
5%
6%
7%
8%
9%
10%
65%
66%
67%
68%
69%
70%
Aug 2007 Aug 2008 Aug 2009 Aug 2010 Aug 2011 Aug 2012
Un
em
plo
ym
en
t R
ate
(%
)
Lab
ou
r F
orc
e P
art
icip
ati
on
Rate
(%
)
Labour force participation rate Unemployment rate

Unemployment
Unemployment was
6.14 per cent in
August.
Unemployment was
highest among senior
high school
graduates.
Unemployment
remains high for youth
- Youth are still 5.97
times more likely to be
unemployed than
those aged 25 years
and above.
0%
2%
4%
6%
8%
10%
12%
14%
No schooling Not yetcompleted
primaryschool
Primaryschool
Junior highschool
Senior highschool
(General)
Senior highschool
(Vocational)
Diploma University
2010 2011 2012

Working hours
• Part-time employment has been growing in Indonesia and plays an important role in expanding employment opportunities.
• In August 2012, 19.42% of employed people worked part-– an increase from previous years.
Part-time
• An underemployed worker is one who works for 35 hours or less and is willing to work more.
• In August 2012 11.52% of the employed population were underemployed – a decline from the previous year.
Underemployment
• Many people in Indonesia work long hours. Long hours are considered those totalling more than 40 hours per week as specified by Indonesia’s Manpower Act No. 13/2003.
• 55.96 per cent of employed people worked more than 40 hours per week in August 2012 – a consistent trend,
Long hours

Vulnerable workers
•A vulnerable worker is defined as the sum of own-
account workers and contributing family workers as
well as casual workers and employers assisted by
temporary worker/unpaid workers.
•Vulnerable workers typically work in the informal
economy and lack decent working conditions. They
have inadequate earnings, low productivity and
working conditions that undermine rights.
•In 2012 it was estimated that 60 to 63 per cent of
all those employed could be considered
“vulnerable workers”.
•Women are three times more likely than men to be
considered vulnerable workers due to their status as
“family workers”, while men are more likely to be
vulnerable workers due to their employment status as a
“casual” or “own-account workers”.

Formality
Between 2001 and
2009 the share of
employment that was
in the informal
economy was
between 61 to 66 per
cent.
Trends over the last
three years have
seen a substantial
shift towards
formality emerging.
In 2012 it was
estimated at 53.6 per
cent per cent of
employed people
were working in the
informal economy.
0%
10%
20%
30%
40%
50%
60%
70%
80%
90%
100%
2001 2002 2003 2004 2005 2006 2007 2008 2009 2010 2011 2012
Per
cen
t
Total Informal Total Formal

Sectoral structure
•Structural shifts in the sectoral composition of the
Indonesian economy have continued to unfold in
2012, with employment in the agricultural sector
declining and jobs in the services sector on the rise.
•Employment in the manufacturing sector has been
growing rapidly and is now higher (in terms of %
and No.) than it has been in over a decade.
•Investments from the public and private sector are
accelerating construction and therefore employment
in the construction sector is growing.
•Employment in the finance, insurance, real estate
and business services sector is expanding, and now
the sector employs almost double the number of
workers it employed in 2008.

Trends in minimum and average wages for
Indonesia, 2001-2012
Over time the gap
between average
minimum wages
and average
nominal wages
has been
narrowing.
In 2001 the
minimum wage
was 58.5% of the
average wage. In
2012 this gap had
narrowed to
68.8%.

Economic inclusion
•Closing the social protection floor gap
•Why to gender wage gap?

Output elasticities of employment by sector
Sector Pre-crisis
1993-97
Post-crisis
2000-06
SBY 1st term
2005-09
Agriculture, forestry, hunting and fisheries 1.576 1.132 0.653
Mining and quarrying - 0.492
0.287
Electricity, gas and water - 0.825
Manufacturing 2.488 0.408 0
Construction 0.931 0.563 0.753
Wholesale trade, retail trade, restaurant and hotels 1.345 0.874 0.524
Transportation, storage and communication 1.16 0.703 -
Financing, insurance, real estate and business
services 1.008 0.632 -
Community, social, and personal services 0.411 0.316 0.460
While Indonesia is on track to achieve many of its targets, there has been a
significant decline in the growth-to-employment elasticity across economic sectors.

Why the gender wage gap?
•Differences in the hourly and monthly
compensation of men and women is a
persistent feature of labour markets throughout
the world.
•Factors such as educational attainment, work
experience, industry and occupation choice
contribute to differences in pay equity between
the genders. However, discrimination also plays
role.
•In general, women are paid between 25% to
35% less than men.
•Overall regression analysis estimates that
approximately 59 per cent of the gender pay
gap is unexplainable and could therefore be
attributed to gender discrimination.
Social protection
•Productivity and the quality of social
security provision
•The economy wide effects of public
works programmes and cash transfer
programmes

Does social security quality impact on firm
productivity?
•Existing policies and laws require
employers provide workers with a minimum
level of health care insurance – but does
the quality of service impact on firm
productivity?
•BetterWork Indonesia designed a study to
examine the connection between social
benefits and productivity in manufacturing
firms that surround DKI Jakarta.
•It was found that firms which spend more
on social benefits typically have lower
production gaps and lower workforce
turnover rates.

What are the economy wide impacts of
public works programs and cash transfers?
Method: 'Dynamic
Social Accounting
Matrix„ with a very
detailed employment
satellite account and
information on
“technology choice” in
the construction sector.
Conclusion: the two
types of social protection
programmes work
together in a
complementary fashion -
stimulating the economy
and reaching different
target groups.
Household income:
Cash transfer programmes have stronger impacts on the household income of
poor households than public works options.
Employment impact:
Public works programmes will
create 30 per cent more jobs than cash transfer programmes.
Economic impact:
Cash transfers and public works both
have a positive impact on the economy.
However, public works programmes have a
greater impact on economic growth than
cash transfers.

Environmental sustainability
•Identifying and estimating
“green jobs”
•Strategic plan for
sustainable tourism and
green jobs

Environmental sustainability
A “green job” is the “direct employment created in different sectors of the economy
and through related activities that reduces the environmental impact of those
sectors and activities, and ultimately brings it down to sustainable levels.”
In 2008 approximately 8.5% of all jobs could be considered “environmentally
friendly” and 3.8% of all jobs could be considered “green jobs”.
In terms of numbers, environmentally friendly jobs and green jobs are highest in
agriculture. In terms of proportion (%), environmentally friendly jobs are highest in
forestry and green jobs are highest in fisheries .
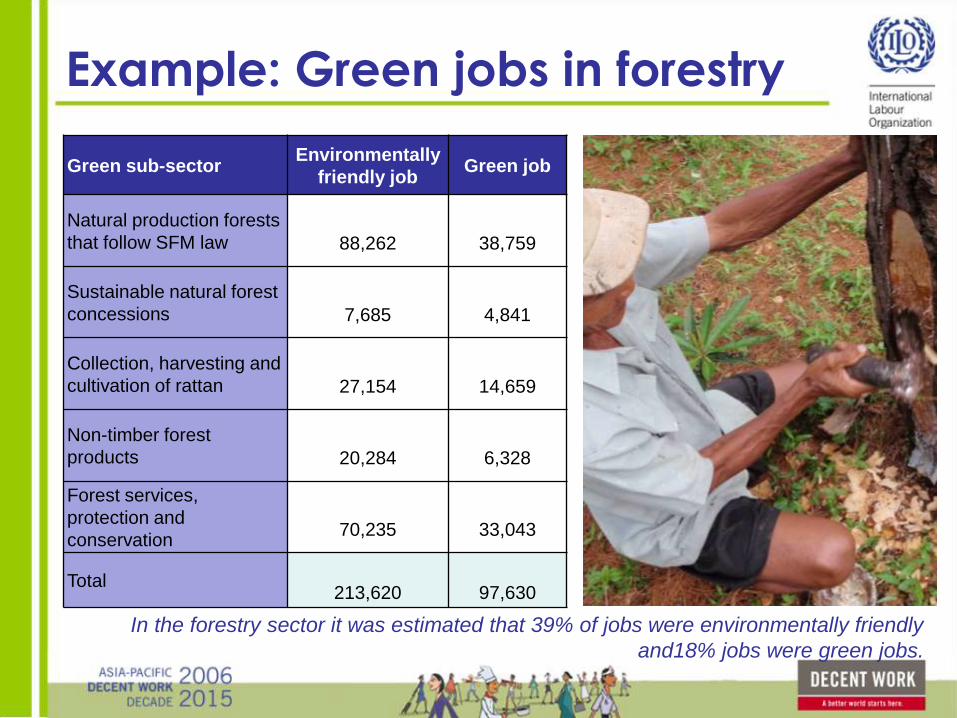
Example: Green jobs in forestry
Green sub-sector Environmentally
friendly job Green job
Natural production forests
that follow SFM law
88,262
38,759
Sustainable natural forest
concessions
7,685
4,841
Collection, harvesting and
cultivation of rattan
27,154
14,659
Non-timber forest
products
20,284
6,328
Forest services,
protection and
conservation
70,235
33,043
Total
213,620
97,630
In the forestry sector it was estimated that 39% of jobs were environmentally friendly
and18% jobs were green jobs.
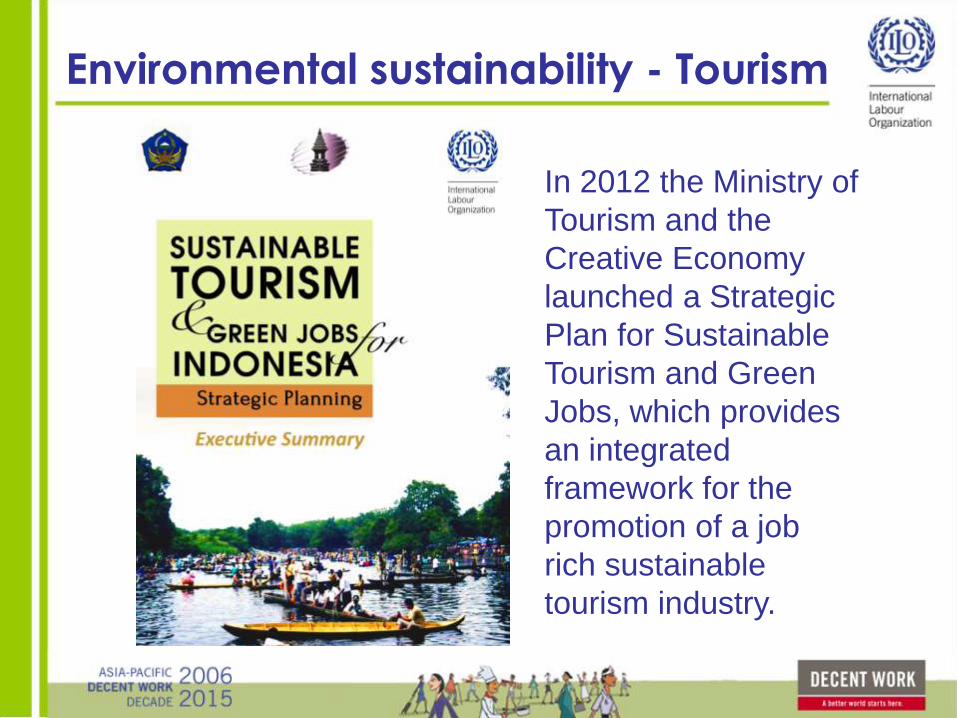
Environmental sustainability - Tourism
In 2012 the Ministry of
Tourism and the
Creative Economy
launched a Strategic
Plan for Sustainable
Tourism and Green
Jobs, which provides
an integrated
framework for the
promotion of a job
rich sustainable
tourism industry.
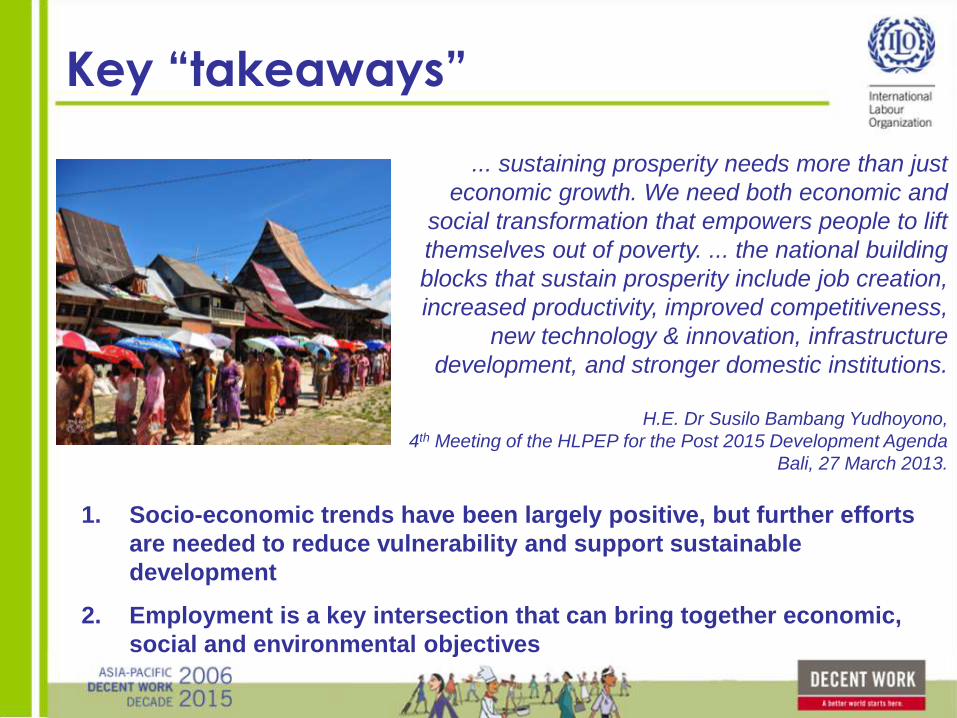
Key “takeaways”
1. Socio-economic trends have been largely positive, but further efforts
are needed to reduce vulnerability and support sustainable
development
2. Employment is a key intersection that can bring together economic,
social and environmental objectives
... sustaining prosperity needs more than just
economic growth. We need both economic and
social transformation that empowers people to lift
themselves out of poverty. ... the national building
blocks that sustain prosperity include job creation,
increased productivity, improved competitiveness,
new technology & innovation, infrastructure
development, and stronger domestic institutions.
H.E. Dr Susilo Bambang Yudhoyono,
4th Meeting of the HLPEP for the Post 2015 Development Agenda
Bali, 27 March 2013.

Thank you
For more information, please contact:
Emma Allen
E-mail: [email protected]
Phone: 081385661374
www.ilo.org/jakarta