laboratory study of weathered rock for surface excavation works
55
LABORATORY STUDY OF WEATHERED ROCK FOR SURFACE EXCAVATION WORKS (KAJIAN MAKMAL KE ATAS BATUAN TERLULUHAWA UNTUK KERJA-KERJA PENGOREKAN PERMUKAAN) FAKULTI KEJURUTERAAN AWAM UNIVERSITI TEKNOLOGI MALAYSIA VOT 75055 AZMAN KASSIM EDY TONNIZAM MOHAMMAD 2007
-
Upload
truongminh -
Category
Documents
-
view
236 -
download
4
Transcript of laboratory study of weathered rock for surface excavation works

LABORATORY STUDY OF WEATHERED ROCK FOR SURFACE EXCAVATION WORKS
(KAJIAN MAKMAL KE ATAS BATUAN TERLULUHAWA UNTUK KERJA-KERJA PENGOREKAN PERMUKAAN)
FAKULTI KEJURUTERAAN AWAM UNIVERSITI TEKNOLOGI MALAYSIA
VOT 75055
AZMAN KASSIM EDY TONNIZAM MOHAMMAD
2007

CONTENTS PAGE CHAPTER 1 INTRODUCTION
1.1 Introduction 1
1.2 Objective of Study 2
1.3 Scope of Study 2
CHAPTER 2 PREVIOUS RESEARCH ON EXCAVATION
ASSESSMENTS
2.1 Introduction 3
2.2 Relevant Rock Material Properties Related To Excavation 4
2.3 Rock Weathering 7
2.4 Rock Weathering Quantitative Classification 11
2.5 Rock Type 13
2.6 Strength 14
2.7 Abrasiveness 14
2.8 Material density 14
2.9 Rock fabric 15
CHAPTER 3 METHODOLOGY
3.1 Introduction 17
3.2 Laboratory Work 17
3.2.1 Uniaxial Compression Strength 18
3.2.2 Indirect Tensile (Brazilian) Test 20

3.2.3 Point Load Test 22
3.2.4 Slake Durability Test 26
3.2.5 Pundit Test 28
CHAPTER 4 ANALYSIS OF LABORATORY RESULTS
4.1 Introduction 31
4.2 Discussion of Test Result 31
4.2.1 Point Load Test 33
4.2.2 Uniaxial Compression Test 34
4.2.3 Slake Durability 36
4.2.4 Pundit Test 38
4.2.5 Dry Density 39
4.3 Correlation of Laboratory Index Test 41
4.3.1 Correlation of Slake Durability and 41
Point Load Test
4.3.2 Correlation of Uniaxial Compressive Test 43
(UCT) and Point Load Test (Is50)
4.4 Summary of Laboratory Test Result 44
CHAPTER 5 CONCLUSION
5.1 Conclusion 47
REFERENCES 49

LIST OF TABLES
PAGE
Table No.
2.1 Summary of rock properties influencing the excavation 5
design in surface mines
2.2 Summary of parameters considered for excavation assessment 6
2.3 Weathering profile classifications of rock mass 9
2.4 Grain Size Classification 16
4.1 The list sandstone observed on site 32
4.2 The List of shale observed on site 32
4.3 Is50 of sandstone 33
4.4 Is50 of Shale 34
4.5 Uniaxial Compression Test result of sandstone 35
4.6 Uniaxial Compression Test result of shale 36
4.7 Id2 of sandstone 37
4.8 Id2 of shale 37
4.9 Pundit test result of sandstone 38
4.10 Pundit test result of shale 39
4.11 Dry density of sandstone 40
4.12 Dry density of shale 41
4.13 Summary of Test Results for Sandstone 45
4.14 Summary of Test Results for Shale 46

LIST OF FIGURES
PAGE
Figure No.
3.1 Samples collected from site for laboratory work preparation 18
3.2 Apparatus for Brazillian Test (Tensile Strength Test) 22
3.3 Sample tested using Brazilian Test apparatus 22
3.4 Description of Point Load Test (using Universal Testing Machine) 24
3.5 Sample tested using Universal Testing Machine 25
3.6 Universal Testing Machine 25
3.7 Apparatus for Slake Durability Test 27
3.8 Samples prepared for Slake Durability Test 27
3.9 Samples after tested by Slake Durability Test 28
3.10 Pundit Test apparatus 29
3.11 Research Methodology Flow Chart 30
4.1 Graph Slake Durability vs Point Load Test (Is50) 42
4.2 Graph Uniaxial Compressive Test (UCT) vs Point Load Test (Is50) 43

ABSTRACT
This research focuses on the most problematic rock type for ripping
works in Malaysia particularly weathered sedimentary rocks. The weathering zone that
normally requires ripping are zone II-V and these zones has always be problematic zone
for excavation in term of selecting the most suitable method and cost evaluation. This
research is to examine the relationship of rock material properties and the weathering
grades. The information gathered from the monitoring was used for determining the
rippability of rocks. Monitored ripping tests were conducted at Bukit Indah which
consisted of sandstone and shale. Samples which have been known for their rippability
were collected and brought back to the laboratory to determine their parameters for their
uniaxial compressive strength test, Brazillian tensile strength, point load test, slake
durability and Pundit test. Results from the laboratory tests are presented and their
relation with the weathering grade was established. Some of the standard strength tests
were not able to test very weak materials with weathering grade V (completely
weathered), due to sampling difficulties. By measuring the ripping process, the
relationships between the rock properties and the rippability were established. It was
revealed that, the laboratory test results alone would not represent the actual behaviour of
rock material during rippability assessment. Some of the material found to be weak, are
found to be not rippable and vice versa. Thorough field assessments, which need to
include discontinuity analysis, are vital and these data are to substantiate the laboratory
results.

ABSTRAK
Kajian ini memfokus kepada batuan sedimen terluluhawa yang selalu menjadi
masalah di Malaysia dalam penentuan kaedah pengorekan yang sesuai. Masalah
berkenaan batuan terluluhawa ini adalah signifikan bagi gred terluluhawa sedikit (II)
sehingga terluluhawa lengkap (V) di dalam profil luluhawa. Data-data daripada
keputusan makmal digunakan bagi menilai keboleh korekan batuan sedimen terluluhawa
ini iaitu dari jenis batu pasir dan syal. Kajian kebolehkorekan dilakukan di Bukit Indah,
Johor di mana samplel-sampel telah dipungut dan di bawa balik ke makmal untuk kajian
selanjutnya. Jenis-jenis ujian yang dilakukan adalah ujian mampatan sepaksi, ujian
ketegangan Brazillian, ujian beban titik, keperoian dan ujian Pundit. Keputusan daripada
ujian-ujian tersebut telah dinilai dengan gred luluhawa masing-masing. Semasa ujian
dilakukan, didapati bahawa ujian piawai mekanik batuan tidak dapat dilakukan kepada
sampel dari gred V (terluluhawa lengkap) kerana sampel yang mudah pecah. Dengan
data-data yang didapati, dapat disimpulkan bahawa penilaian makmal sahaja tidak cukup
bagi menilai kebolehkorekan batuan kerana data-data ini memerlukan sokongan dengan
data lapangan seperti jarak kekar.

1
UTM/RMC/F/0014 (1998)
UNIVERSITI TEKNOLOGI MALAYSIA Research Management Centre
PRELIMINARY IP SCREENING & TECHNOLOGY ASSESSMENT FORM
(To be completed by Project Leader submission of Final Report to RMC or whenever IP protection arrangement is required) 1. PROJECT TITLE IDENTIFICATION :
Laboratory Studies of Weathered Rock For Surface Excavation Works
Vote No:
2. PROJECT LEADER :
Name : Assoc Prof Ir. Azman Bin Kassim
Address : Fakulti Kejuruteraan Awam, University Teknologi Malaysia 81310 UTM – Skudai, Johor
Tel : 07-5531725 Fax : 07-5566157 e-mail : [email protected]
3. DIRECT OUTPUT OF PROJECT (Please tick where applicable)
4. INTELLECTUAL PROPERTY (Please tick where applicable)
Not patentable Technology protected by patents
Patent search required Patent pending
Patent search completed and clean Monograph available
Invention remains confidential Inventor technology champion
No publications pending Inventor team player
No prior claims to the technology Industrial partner identified
Secientific Research Applied Research Product/Process Development Algorithm Method/Technique Product / Component Structure Demonstration / Process Prototype Data Software
Other, please specify Other, please specify Other, please specify ___________________ __________________ ___________________________ ___________________ __________________ ___________________________ ___________________ __________________ ___________________________
75055
Lampiran 6

2
UTM/RMC/F/0014 (1998)
5. LIST OF EQUIPMENT BOUGHT USING THIS VOT
Laser printer hp 1100, External Hard Disk,External Drive A (RM 2250)
_____________________________________________________________________________
_____________________________________________________________________________
_____________________________________________________________________________
6. STATEMENT OF ACCOUNT
a) APPROVED FUNDING RM : ……19,000.00..………
b) TOTAL SPENDING RM : ……19,652.49..………
c) BALANCE RM : …… (652.49) ……..… 7. TECHNICAL DESCRIPTION AND PERSPECTIVE
Please tick an executive summary of the new technology product, process, etc., describing how it works. Include brief analysis that compares it with competitive technology and signals the one that it may replace. Identify potential technology user group and the strategic means for exploitation. a) Technology Description
The result shows that the strength and qualities of mateial deteriorates with increasing of weathering grade. Testing
and analysis of weathered rock material should be given special attention as most of the standard rock mechanics
testing equipment are designed for testing the hard rock material. It is also found that the laboratory data alone is
not sufficient to assess the rippability of weathered rock masses accurately. Field data is essential to estimate the
rock mass properties.
b) Market Potential
The determination of material properties of weathered rock is a challenging task. Advancement and modification of
standard rock mechanics testing equipment is required.
…………………………………………. Name : ……………………………….
Signature and stamp of Date : ………………………………. JKPP Chairman

3
c) Commercialisation Strategies
None at the moment
____________________________________________________________________________
____________________________________________________________________________
____________________________________________________________________________
____________________________________________________________________________
____________________________________________________________________________
____________________________________________________________________________
____________________________________________________________________________
_____________________________________________________________________________
8. RESEARCH PERFORMANCE EVALUATION
a) FACULTY RESEARCH COORDINATOR Research Status ( ) ( ) ( ) ( ) ( ) ( ) Spending ( ) ( ) ( ) ( ) ( ) ( ) Overall Status ( ) ( ) ( ) ( ) ( ) ( ) Excellent Very Good Good Satisfactory Fair Weak
Comment/Recommendations : _____________________________________________________________________________
_____________________________________________________________________________
_____________________________________________________________________________
_____________________________________________________________________________
____________________________________________________________________________
…………………………………… Name : ……………………………..
Signature and stamp of Date : …………………………….
JKPP Chairman
………………………………………… Name : ………………………………………
Signature and stamp of Date : ……………………………………… JKPP Chairman
UTM/RMC/F/0014 (1998)

4
RE
b) RMC EVALUATION
Research Status ( ) ( ) ( ) ( ) ( ) ( ) Spending ( ) ( ) ( ) ( ) ( ) ( ) Overall Status ( ) ( ) ( ) ( ) ( ) ( ) Excellent Very Good Good Satisfactory Fair Weak
Comments :- _____________________________________________________________________________
_____________________________________________________________________________
_____________________________________________________________________________
_____________________________________________________________________________
_____________________________________________________________________________
_____________________________________________________________________________
Recommendations :
Needs further research
Patent application recommended
Market without patent
No tangible product. Report to be filed as reference
……………………………………………….. Name : ……………………………………
Signature and Stamp of Dean / Deputy Dean Date :…………………………………… Research Management Centre
UTM/RMC/F/0014 (1998)

UNIVERSITI TEKNOLOGI MALAYSIA
UTM/RMC/F/0024 (1998)
BORANG PENGESAHAN
LAPORAN AKHIR PENYELIDIKAN
TAJUK PROJEK : LABORATORY STUDY OF WEATHERED ROCK FOR SURFACE
EXCAVATION WORKS
Saya PROF. MADYA IR. AZMAN BIN KASSIM_ (HURUF BESAR)
Mengaku membenarkan Laporan Akhir Penyelidikan ini disimpan di Perpustakaan Universiti Teknologi Malaysia dengan syarat-syarat kegunaan seperti berikut :
1. Laporan Akhir Penyelidikan ini adalah hakmilik Universiti Teknologi Malaysia.
2. Perpustakaan Universiti Teknologi Malaysia dibenarkan membuat salinan untuk tujuan rujukan sahaja.
3. Perpustakaan dibenarkan membuat penjualan salinan Laporan Akhir
Penyelidikan ini bagi kategori TIDAK TERHAD.
4. * Sila tandakan ( / )
SULIT (Mengandungi maklumat yang berdarjah keselamatan atau Kepentingan Malaysia seperti yang termaktub di dalam AKTA RAHSIA RASMI 1972). TERHAD (Mengandungi maklumat TERHAD yang telah ditentukan oleh Organisasi/badan di mana penyelidikan dijalankan). TIDAK TERHAD TANDATANGAN KETUA PENYELIDIK
Nama & Cop Ketua Penyelidik Tarikh : 6 OGOS 2007
CATATAN : * Jika Laporan Akhir Penyelidikan ini SULIT atau TERHAD, sila lampirkan surat daripada pihak berkuasa/organisasi berkenaan dengan menyatakan sekali sebab dan tempoh laporan ini perlu dikelaskan sebagai SULIT dan TERHAD.
Lampiran 20

1
CHAPTER 1
INTRODUCTION
1.1 Introduction
In tropical region where thick profile of weathered zone can be encountered,
ripping works is always accepted as the limit of mechanical breaking before blasting
works is opted due to the economical reason. However, as we know, the nature of rock
type and its weathering profile plays a very significant role in evaluating the excavation
assessment. Great challenges in ripping works can be expected in sedimentary area
where the occurrence of discontinuity such as bedding thickness, folding, foliation and
the inhomogeniety of rocks can greatly influence its excavatability
Excavation assessment on rippability can be assessed by using two different
methods that is direct and indirect method. Direct method is where ripper machine will
be tested on the actual ground and the assessment will be based on the productivity.
Indirect excavation assessment includes seismic velocity, graphical and grading method.
Grading system was introduced by Weaver (1975), by taking into account various
geotechnical parameters in the assessment. Since then, this type of assessment being
further developed by Kirsten (1982), Muftuoglu (1983), Smith (1986), Abdullatif and
Cruden (1983), Singh et al (1987), Karpuz (1990), MacGregor et al. (1993),
Kramadibrata (1996) and Basarir and Karpuz (2004).

2
Excavatability of rocks is believed to be depending on numbers of
geomechanical properties of intact rock and rock mass such as discontinuities,
weathering grade, grain size and strength. The mechanical properties can be determined
by field and laboratory test such as rebound tests, rock strength index tests, wave
velocity and durability testing. Apart from the geo-properties, working condition and the
equipment variables may influence the excavatability. Based on these factors, rock mass
and rock material properties are graded with respect to their importance in excavatability
in the grading method. This research tries to establish the laboratory data for the rock
material sampled during the ripping works.
1.2 Objective of Study
The objectives of this research are: -
i. To determine engineering characteristic of weathered rock mass related for
ripping works.
ii. To establish engineering parameter those are related to rock excavation.
1.3 Scope of Study
Scopes of this study are focus on the most problematic rock type for ripping
works in Malaysia particularly weathered sedimentary rocks. The weathering zone that
normally requires ripping are zone II-V and these zones has always be problematic zone
for excavation in term of selecting the most suitable method and cost evaluation.
Samples which have been known for their rippability were collected and brought back to
the laboratory to determine their parameters.

3
CHAPTER 2
PREVIOUS RESEARCH ON EXCAVATION ASSESSMENT
2.1 Introduction
Most researchers agree that rippability depends on numerous geomechanical
properties of intact rock and rock mass (Thuro et al., 2003). Factors that are influencing
an excavating machine are suggested by the International Society of Rock Mechanics –
Commision on Rock Borability, Cuttability and Drillability and other sources (Fowell et
al., 1991 and Braybrooke, 1988). Although most of them suggested different variables
involved, most of them agree that material strength and discontinuity characteristics play
an important role in rippability. Although rock mechanical properties play a key role in
excavation, geological parameters are more significant than varying rock properties
(Thuro et al., 2002).
One of the requirements in assessing rippability of a rock mass by grading
method, is by determination of the rock material properties. Parameters that are related
to excavation such as compressive strength, tensile strength, density and sonic wave
velocity are used in these assessments. Previous researches found that there are many
factors affecting the rippability of ground such as the rock mass behaviour, strength of
rock material, size of machineries employed and the economical factors. Bozdag (1988)
4
found that among the rock mass properties involved are the rock type, strength, and
degree of alteration, structure, fabric abrasiveness, moisture content and the seismic
velocity. Pettiffer et al. (1994) suggested that the ripping operations are greatly
influenced by the strength of the intact rock and the joint behaviour of the rock mass. In
rippability assessment, the significant rock mass and intact rock parameters should be
included and examined to predict rock mass behaviour.
2.2 Relevant Rock Material Properties Related To Excavation
From the literatures, it is noted that the excavatability of rocks are depending on
numbers of geomechanical properties of intact rock and rock mass such as
discontinuities, weathering grade, grain size and strength. The properties can be
determined by rebound tests, rock strength index tests, rock mass classifications and
other specific tests. Basically, no single test can uniquely define rock material
properties. Instead, there are numerous tests giving either direct or indirect value to each
property. Derivation of strength values for the assessment of rock cuttability has always
been one of the most frequently cited indices.
Other than the geo-properties, working condition and the equipment variables
also may influence the excavatability. Based on these factors, rock mass and rock
material properties are graded with respect to their importance in excavatability. The
importance of certain parameters used for this system is noted for different researchers,
perhaps due to the difference of rock nature. Table 2.1 lists some other factors that are
considered relevant for assessing the engineering design in rock performance.
References and influence of variables on excavation are also provided in the table.

5
Table 2.1: Summary of rock material properties influencing the excavation design in
surface mines
Rock
Property Variables Reference
Influence
on design
of surface
mines
Intact Rock Properties
Physical
Properties
-Moisture content
-Density
ISRM, 1981
ISRM, 1981
SS, EXC.
SS, EXC.
Rock Substance
Hardness
-Dynamic rebound tests
Shore sclerescope
Schmidt rebound hammer
Modified Schmidt hammer
ISRM, 1981
Gehring, 1992
EXC.
EXC & SS
Standard Rock
Strength
-Unconfined compressive strength-
UCS
-Brazillian tensile strenth
ISRM, 1981
ISRM, 1981
SS, EXC.
EXC.
Constitutive
behaviour pf
UCS test
-Young’s Modulus
-Specimen Specific Fracture Energy
-Toughness Index (Singh et al., 1983)
EXC.
EXC.
EXC.
Rock Strength
Index
-Pont Load Index-PLI
ISRM, 1985
EXC.
Dynamic
Property -Laboratory seismic velocity ISRM, 1981
EXC.
The influence of geology is not only relevant during the equipment selection, but
also during the operations stage. Table 2.2 shows a list of variables considered relevant
for assessing the engineering design and geotechnical parameters used by researchers
respectively. In majority of the systems proposed, uniaxial compressive strength (UCS)
and seismic velocity are the two most common parameters used. These system proposed
by Weaver (1975), Kirsten (1982), Muftuoglu (1983), Smith (1986), Singh et al. (1987)
and Karpuz (1990).

7
Table 2.2: Summary of parameters considered for excavation assessment
Parameters Strength Joint/Discontinuity
SV
Gra
in si
ze
UC
S
Poin
t Lo
ad
Test
SH
TS
RQ
D
No
of jo
int
sets
Vol
umet
ric
join
t cou
nt
Join
t ro
ughn
ess
Join
t al
tera
tion
Join
t or
ient
atio
n
Join
t spa
cing
Join
t co
ntin
uity
Join
t gou
ge
Bed
S
A
W
Caterpillar (2001)
X Atkinson (1971) X Franklin et al. (1971)
X X X X Bailey (1975) X Weaver (1975) X X X X X X Church (1981) X Kirsten (1982) X X X X X X X X Muftuoglu (1983)
X X X X X Abdullatif et al. (1983)
X X Smith (1986) X X X X X X Anon (1987) X Singh et al. (1987)
X X X X X X Bozdag’s (1988)
X X Karpuz (1990) X X X X X Mac Gregor et al.(1993)
X X X X X X X X Pettifer et al. (1994)
X X X X Kramadibrata (1996)
X X X X X X X Hadjigeorgiou (1998)
X X X X Rucker (1999) X X Basarir and Karpuz (2004)
X X X X X
SV-seismic velocity, UCS-uniaxial compressive strength, PLT-point load test, SH-schmidt hammer, TS-tensile strength RQD-rock quality designation, BedS-bedding spacing, A -abrasiveness, W-weathering

7
2.3 Rock Weathering
Since this research is regarding the weathered rock material properties, thus it is
useful to understand about the rock material weathering processes. Rock weathering
process is a dynamic process and multi is factors involve in the physical and chemical
reactions to weathering agents and conditions. Chemical weathering is defined as a
decaying process of rocks cause by reactions to water, carbon dioxide and humidity of
rock composition mineralogy. Whereas, physical weathering is a slaking and
fragmentation process cause by force from water, air movements and the changes of
inner stress. Continuous weathering process that occurred during this geologic period
has caused the decreasing in rock physical nature.
Primary weathering process is when the rock mass undergoes chemical and
physical weathering process which the effect will change its color, fabrics, mineralogy,
texture, sizes and decompose to residual soil. The chemical and physical weathering
may happen at the same time, or otherwise. Chemical and, or physical weathering rate is
determine through the factors of lithology, climate, topography, and groundwater.
Tropical weathering on rock minerals is far more aggressive but it is less effective in
cool climate. High humidity in air causes chemical weathering process can be more
aggressive in decreasing physical behavior than crushing and erosion.
Weathering of rock takes place under the influence of the hydrosphere and
atmosphere. Weathering I either in the form of mechanical disintegration or chemical
decomposition or both. Mechanical weathering leads to opening of discontinuities by
rock fracture, opening of grain boundaries and the fracture on cleavage of individual
mineral grains, whereas chemical weathering results in chemical changes in the mineral.
Under the influence of weathering, the strength, density and volumetric stability of the
rock will be educed, whilst deformability, porosity and weatherability is increased. This

8
can lead to significant reductions in rock strength and assist the excavation process
(Hadjigeorgiou, 1988). The need to establish the weathering zones in the classification
was made clear by Hadjegeorgiou (1988) to help the assessment process. The
weathering classification, as recommended by the Core Logging Committee of South
Africa (1976), ranks from unweathered, via slightly, medium and highly weathered to
completely weathered. It is clear from the table that the classification takes extent of
discoloration, and conditions of discontinuities i.e. filling and separation, into
consideration.
Tropic country has sunny flux all the year (220-320 C), high moisture content in
air and underground, high quantity of rain (>1200 mm) and underground water of 280C
(Thomas, 1994). With these characters, climate has great influence to exogenic process
especially to chemical weathering process where the high intensity of rain and high
temperature will accelerate the weathering process.
Several studies have been done to understand geotechnical properties of
weathered sedimentary rock in Peninsular Malaysia (Ibrahim Komoo, 1995a). The
results showed that material properties deteriorate from the fresher material as more
intense weathering taken place. The weathering effect can take place up to 100m down
from the earth surface in tropical area (Ibrahim Komoo, 1995b). IAEG (1981) classified
the weak rock will have uniaxial compressive strength from 1.5 – 50 MPa.
Generally, sedimentary rock mass consists of more than a type of rock and
always forms alternate laminated because of natural forming process and also exposed
to tectonic effect and pressure. The weak rock in grade III to V (please see Table 2.3)
has always been the grey area in ripping and excavation. This is because the layer where
grade III to V is found to be interbedded or sandwiched between different layers.

9
Fresh Rocks
No changes of forms or color in earth materials. Slightly or no iron stains in discontinuity spacing. Geology Hammer rebounds and rings on hit.
Classification Weathering Zone
Log Description
Highly Weathered
Residual Soil
Completely Weathered
VI
Upper Soil All rock materials changed into soil. No texture or rock mass structure preserved. Homogenic.
Vc
V Vb
Va
IVb
IV
IVa
Zone is rich in Iron Concretion. Unclear texture, less than 25% preserved fabric. Preserved structure. Whole materials changed to soil. Stained. Whole Materials changed into soil. Reddish color, Stained with original material 25-75% fabrics are preserved. Materials disintegrate in water or crushable by hand.
Materials changed into soil preserving original color and textures. >75% preserved texture, easy to disintegrate in water and crushable by hand. Slaking. Material is in transition to IVb condition. Texture & structure intact. Small fragments formed when crush in hand or immerse in water. Geology Hammer does not rebound
Moderately Weathered
III
Color changes in all earth materials (original color increases). Whole texture & structure of rock mass unchanged. Edges of rock material are hard to break by hand. Schmidt Hammer average value is less than 30. Geology Hammer rebounds by hit but does not rings, discontinuity filled with iron oxide.
Slightly Weathered
Slightly changes of color in material. Most materials are still fresh. Changes of color on discontinuity clearly exceed 1cm. Schmidt Hammer average value is more than 30. Geology Hammer rebounds and rings. Discontinuity spacing is filled with iron oxides.
II
I
Table 2.3: Weathering profile classifications of rock mass (Ibrahim Komoo, 1995)

10
Mohd For et al. (2003) and Tajul et al. (2000) reported that, hard material has
always become an argument issues by contractors and clients if it cannot be classified as
rock or soil. This statement always refers to grade III (moderately weathered) to V
(completely weathered) in the weathering scale. Existing excavation assessments have
always considered the strength factor to be one of its major factors in deciding whether
the material can be ripped or otherwise. However if strength is the only parameter
considered, overall results may be ambiguous especially if sandstone and shale is
evaluated separately as both materials may not have the same strength even though they
are in one massive rock body.
Weathering impacts is not limited to rock surfaces; it reaches deeper with water
flows and reactions to atmosphere. Whereas, weathering rates are determined by the free
flows of weathering agents, usual temperature and compositions of rock minerals.
Ibrahim Komoo (1995c) found that humidity in air and earth has always become the
main agent of weathering reactions and pathogenesis to tropical climate. The basic of
silicate decomposition in weathering process is the formation of hydrate aluminous
silicate minerals.
Although weathering of rock mass occur in geological periods, the importance to
understanding the changes of physical behavior and mass engineering must be given
much attentions. This is because demands of infrastructural developments for a
country’s development often expose outcrops and cuttings of rock mass in varying
weathering zones.

11
2.4 Rock Weathering Quantitative Classification
Many efforts have been done to measure the rock weathering degree
systematically and not just relying on individual skills. A few of engineering
practitioners has suggested that rating system are to be given to certain weathering
grades.
Ibrahim Komoo (1995c) suggested that civil engineering practitioners
should give special attentions to tropical terrains such as in Malaysia. This is because
there are conspicuous differences of climate surroundings where heavy rain pours
conditions, wide variation of temperature and high humidity happens all year round.
This encourages intensive chemical weathering rate and high erosions on the rock
surface. There are big differences in weathering characteristics between different
climates. In wet tropical climate, we may find very thick of overburden as a result of
extensive chemical weathering (Ibrahim Komoo, 1995b). Weathering profile in this
tropical climate has very distinctive difference as existence of boulders is difficult to be
predicted and the zonation between the grades might be in sudden changes. The study of
weathering profile is still in early stage in Malaysia and the need to understand the
behaviour of this weathered rock is vital as majority of construction works are in these
zones (Ibrahim Komoo, 1995c).
A comparison about rock mass weathering grades classification contained in
standard documents; ISRM (1981), IAEG (1981) and BSI (1981) was done by Ibrahim
Komoo (1995). Following the comparison done, it was found that there is similarity of
rock mass weathering grade classification between IAEG (1981), ISRM (1981) and BSI
(1981) except for grade III and IV. IAEG suggested that grade IV is identified by
percentage one per third of mass decomposed to soil while ISRM and BSI counted half
of rock mass decomposed into soil. However, he found that the basic and explanation of
rock weathering details in the three documents developed in subtropical climate are

12
almost the same. His attempts to use the reference for explaining weathering profile in
damp tropical region in Malaysia was found unsuitable.
The main issue is focused on rock types; classification method limited to knowledge of
practitioners, and finally the importance and needs for engineering index. The rock mass
strength nature is found to be one of important rock mass classification index and is very
meaningful in engineering works. Most of rock mass classification for engineering
purposes is done based on strength of rock material.
Classification of weathered rock material begins with the sampling problems
because it is too weak and easily broken caused by chemical weathering. The main issue
often discussed is the sampling ability of high lamination materials such as shale, soft
rocks like clay or highly weathered granites. Furthermore, the research cost will be
higher as the samples need to be brought back to the laboratory for strength testing.
Until now, few efforts have been carried out to classify weathered rocks for engineering
purposes (Santi, 1995).
The most popular strength test that is often be used as design index is the
uniaxial compression strength. However, the uniaxial compression strength can only be
carried out on cylindrical shaped samples (ISRM 1981). Alternatively, point load
strength is prefered for irregular shaped samples.
2.5 Rock Type
Basically, there are three rock types by origin that are
i) Igneous rock are formed by cooling of molten magma or lava originated within
the earth such as granite and basalt. This type of rock is known to be very difficult to rip

13
especially in highly weathered zone due to the lack of stratification and weakness planes
(Weaver, 1975). In Malaysia, most parties will opt for blasting in this rock type area as
presence of boulders is significant and due to economical reason. Intense weathering in
this tropical area decayed this rock type unevenly, hence leaving abundant boulders.
ii) Sedimentary rock consist of material derived from destruction of previously
existing rocks (Weaver, 1975) such as sandstone and shale are usually the most easily
ripped material due to the presence of weakness planes. Their most prominent
characteristic is bedding or stratification. In Malaysia, most ripping works are done in
this rock type area.
iii) Metamorphic rock can be igneous or sedimentary rocks origins, which have
undergone severe changes in pressure, stresses, chemical or temperature. The changes of
this extreme condition may change the original mineral and texture or both, producing
different type of rock, namely gneiss (originated from granite), shale, slate and quartzite
(from sedimentary origins). Depending on the origins, ripping may be possible in
sedimentary originated rock type where degrees of lamination or cleavage are present.
Basically, the identification of basic type of rock may provide immediate
indications for likely engineering behaviour of rock (Muftuoglu, 1983).
2.6 Strength
Compressive and tensile failures of rock are both involved in the fracture
mechanism generated during ripping. Tensile strength is believed to be more significant
than compressive strength when classifying rock in terms of its rippability (Singh,
1986). It is worth noting that tensile and compressive strengths for a given rock are

14
closely correlated with each other, thus either of them can be selected as material
strength. Smart et al. (1982) have found a close correlation between the uniaxial strength
and quartz content. He found that the increase of quartz in rock material would increase
the strength of rock material. Hadjigeorgiou et al. (1988) suggested that point load test
offers both technical and logistic advantages in estimating the strength of rock material.
2.7 Abrasiveness
Abrasiveness of rock is a complex function of various properties including rock
competency, harness and the mineralogical composition and proportions. The
parameters affecting abrasiveness are therefore, as follows (Singh, 1986): -
(a) Mineral composition and proportions including hardness of constituent minerals,
grain shape and size, harness and strength of matrix material. This is determined
by petrographic examinations.
(b) Physical properties of rocks including strength and hardness.
2.8 Material density
Density is also another factor to be considered in assessing the rippability of rock
material. Kramadibrata (1996) has used this parameter in his study.
2.9 Rock fabric

15
Fabric is a term used to describe the micro structural and textural features of rock
material. Researchers have found that rock fabric is another factor affecting the
rippability (Weaver, 1975). Coarse-grained rocks (grain size > 5mm) such as pegmatite,
coal and sandstone can be generally more easily ripped than fine-grained rocks (grain
size < 1 mm) such as quartzite, basalt and limestone. It can also generally be assumed
that acidic rocks are more easily ripped than basic rocks (Weaver, 1975). A most widely
accepted grain size classification, based on British Standard Methods of Test for Soils
for Civil Engineering Purposes (BS 1377, 1981) is given in Table 2.4.

16
Equiv Equiv
Description Size Recognition Soil Rock (mm) Type Type
Very grained < 0.06 Individual grains Clays & Claystone & cannot be seen Silts Siltstone with a hand lens
Fine grained 0.06 - 0.2 Just visible as Fine sand individual grains under hand lens
Medium Grained 0.2 - 0.6 Grains clearly Medium Sand Sandstone visible under hand lens, just visible to naked eye.
Coarse Grained 0.6 - 2.0 Grains clearly Coarse visible to naked sand eye
Very Coarse > 2.0 Grains measurable Gravel Conglomerate Grained
Table 2.4: Grain Size Classification

17
CHAPTER 3
METHODOLOGY
3.1 Introduction
The strength properties of weathered shale and sand stone are studied to quantify
the weathering impact to these materials. The standard testing procedures will become
more difficult as rock material become weaker. This research focused on the basic
physical properties of sedimentary rock, which can be the basic to compare the behavior
of shale and sandstone. One of the main scopes in this research is focused on field study.
Field study concentrates field recognition on nature of different type of rock to problems
in excavation. Samples were collected from the field in accordance to the field study and
classification. Samples representing particular group of weathering classification had
been brought back to the laboratory for further study.
3.2 Laboratory work
After the samples have been collected, it has been brought to the laboratory to
be tested as in Figure 3.2. In order to analyse rock mass character and its behaviour an
extensive laboratory test programme has been performed throughout the research
project. The test programme included the follows: -

18
i) Uniaxial Compression Strength (using rock core)
ii) Indirect Tensile (Brazilian) Test
iii) Point Load Test (Sand Stone and Mud Stone)
iv) Slake Durability Test
v) Pundit Test
Figure 3.1: Samples collected from site for laboratory work preparation
3.2.1 Uniaxial Compression Strength
Universal Testing Machine (UTM) has the persistent loading about 1000kN and
capable to bounce movement of the failure rock. This machine has the characteristic of
‘servo control’, which makes the procedure of testing easier and applicable. Besides, it
gives flexible rate of loading with accurate data till two decimal points.
The Universal Testing Machine is very usable for any rock strength testing such as
Uniaxial Compressive Testing, Point Load Test and Brazillian Test.

19
Uniaxial Compression Strength is the most widely used in measuring strength
with the method clearly standardized (ISRM 1981). Whilst the determination of
compressive strength appears quite simple, practically, difficulties occur in creating a
uniform stress field in a rock specimen. Principally this due to end effects associated
with the elastic mismatch between the rock and the testing machine. There are four main
factors, which control the test result other than rock properties.
i. Friction between platen and the end surface
ii. Specimen geometry
- Shape
- Height to diameter ratio
- Size
iii. Rate of Loading
iv. Water Content
The Uniaxial Compressive Strength is probably the most universally applied
rock test especially when combined with other functions such as the determination of
Young’s modulus or rock toughness. However the test does require a significant amount
of rock in order to produce sufficient cores to give the test the required significance.
This can lead to a prohibitively long preparation time and high cost
This is the most common method in measuring strength, deformation and
fracture characteristics of rock. The strength of rock material is identified by the stress
value at failure and given by the relationship (ISRM, 1981):
σc = P / A
In which,
P is failure load and
A is cross section area
20
A height to diameter ratio of 2 will be employed and testing procedure will
follow ISRM, 1981 suggested method. Testing on fresher samples will be conducted as
guidance to the strength of weathered rocks (weathered rock samples may be broken
during sample preparation).
The core samples were compressed in the Universal Testing Machine (UTM).
The stiff press rather than the ordinary soft press is used because the controlling
computer continually downloads displacement and load data to disc.
Due to the problems in establishing a uniform stress field associated with the
elastic mismatch between the platens and the specimen and specimen geometry, a
standardised test procedure has been proposed (ISRM 1981) in order to minimise these
effects.
3.3.2 Indirect Tensile (Brazilian) Test
The diametric loading of a small rock disc is performed by a Universal Testing
Machine (UTM), which complies with the ISRM requirements for the indirect testing of
tensile strength.
The test method consists of loading the disc until failure occurs along its diametric axis.
The disc is prepared from 48mm core samples with a thickness to diameter ratio of 1:2.
There is a danger that the failure of the specimen may occur in a biaxial rather
than uniaxial stress field. In order to ensure a uniaxial failure and hence the validity of
the test, the failure of the disc should initiate at the centre of the specimen. In additions
of the problems of establishing a pure uniaxial stress field, and effects problems (similar
to those) for the uniaxial compressive strength test can exist. Due to the induction of
high shear stresses at the point of contact, it is recommended that this test is only for
specimens with a high shear to tensile stress ratio (Aleman 1982).

21
It was noted that during the testing or rocks with a high tensile strength, the
failure often takes place with considerable violence. This violent failure is often
accompanied by the shattering of the specimen into several smaller pieces. On the RDP
testing machine, the disc always split into two pieces with no violent displacement of
either fragment. Since the only difference between the two test machines is the
unloading rate, the violent fragmentation must therefore be accounted for by the release
of energy stored within a conventional soft press. Figure 3.3 shows the design of
Brazilian apparatus and Figure 3.4 shows sample are tested using Brazilian Test
apparatus.
There are many difficulties with performing a direct uniaxial tensile test on rock
and this has led to a number of indirect methods being proposed. The most common of
these, the Brazilian test, involves loading a rock cylinder diamerally between two
platens.
The measurement of the tensile strength by the tensile strength by the Brazilian
method gives reproducible results that are found with direct methods. Because of the
smaller size of specimen required for the test, a smaller initial sample is required.
However the necessity for machining and grinding make the preparation time
inconvenient.
The tensile strength of the specimen σt, has been calculated using the following
formula:
σt = 0.636 P/ Dt
In which,
P is the load at failure (N),
D is the diameter of the test specimen (mm),

22
t is the thickness of the test specimen measured at the centre (mm).
Figure 3.2: Apparatus for Brazillian Test (Tensile Strength Test)
Figure 3.3: Sample tested using Brazilian Test apparatus
3.3.3 Point Load Test
The point load test is an indirect measure of failure of a rock specimen between
two points. Also, the point load strength test is a versatile field based index method
capable of deriving values, which show excellent correlations with both UCS and tensile
strength (Broch and Franklin, 1972; Hassani 1980). Unlike the Brazillian test, which
uses a line load on a machined rock disc, the point load can be applied to either rock

31
CHAPTER 4
ANALYSIS OF LABORATORY RESULT
4.1 Introduction
It is important to consider that the mechanical and physical properties of rock
may be inter-related. It may be possible to relate these properties by either in-situ or
laboratory testing techniques. Using the linear regression techniques the laboratory test
data are examined to evaluate the effectiveness with which one rock property may be
estimated from another known property or alternatively to define the degree of influence
that one rock property may have on others. Assessment of weathered sedimentary mass
is quite difficult as the weathering grade increased. The lacking of physical quality on
sedimentary rock such as sand stone and shale effectuate the difficulty on sampling
work. The samples were brought back to the laboratory and tested to determine the
engineering characteristic of weathered rock mass related for ripping works.
4.2 Discussion of Test Result
Several samples of sandstone and shale have been tested and the result is
discussed in subtopic below. Table 4.1 and Table 4.2 show the listed sample of
sandstone and shale which is observed on site

32
Table 4.1: The list sandstone observed on site
No. Sample Grade Remark
RL 3 A L3 IVa Unrippable
RL 1 (b) L3 IVa Unrippable
RL 3 A L1 IVa Unrippable
RL 1 (b) L2 III Rippable
RL 1 L6 III Rippable
RL1 L5 III Rippable
RL 3 C L2 III Rippable
RL 3 C L1 II Rippable
RL 3 E L1 III Rippable
RL 3 Slope Area 2 L3 III Rippable
RL 3 Slope Area 2 L2 IVa Unrippable
RL 3 Slope Area 1 L5 (Zone B) IVa Unrippable
RL 3 Slope Area 1 L5 (a) IVa Unrippable
RL 3 Slope Area 1 L1 IVb Unrippable
Table 4.2: The List of shale observed on site
No. Sample Grade Remark
RL 1 L3 II Rippable
RL 1 (a) L3 III Rippable
RL 1 (b) L1 III Rippable
RL 1 L1 IVa Unrippable
RL1 L4 IVa Unrippable
RL1 L7 IVa Unrippable
Along foliation Va Rippable
RL 1 L2 Va Rippable

33
4.2.1 Point Load Test
Point load test is an alternative method to determine the strength of material,
which cannot be sampled specifically. All the 14 samples of sandstones ranging from
grade IVa to II and 8 samples of shale (Grade IVa – III) were ale to be tested using this
method. Table 4.3 and Table 4.4 show the result of the test. From the result, it shows
that Is50 of material increased with the weathering grade for sandstone and shale. This
shows that the material strength increase with the quality of samples. For grade III
sandstone, the Is50 ranges from 1.028 to 2.898. Whereas for shale the Is50 is 1.496. The
grade II sandstone gives the highest value of Is50 of 3.669 and the shale gives 3.445. The
lowest value of Is50 was to grade Va, which carry the value of 0.033.
Table 4.3: Is50 of sandstone
No. Sample Grade Grain Size Is50
RL 3 A L3 IVa Very Fine 0.959
RL 1 (b) L3 IVa Medium 0.033
RL 3 A L1 IVa Medium 0.111
RL 1 (b) L2 III Very Fine 1.143
RL 1 L6 III Very Fine 1.028
RL1 L5 III Very Fine 2.623
RL 3 C L2 III Fine 1.143
RL 3 C L1 II Very Fine 3.669
RL 3 E L1 III Very Fine 2.898
RL 3 Slope Area 2 L3 III Fine 2.009
RL 3 Slope Area 2 L2 IVa Fine 0.713
RL 3 Slope Area 1 L5 (Zone B) IVa Fine 0.868
RL 3 Slope Area 1 L5 (a) IVa Very Fine 0.491
RL 3 Slope Area 1 L1 IVb Medium 0.033

34
Table 4.4: Is50 of shale
No. Sample Grade Is50
RL 1 L3 II 3.445
RL 1 (a) L3 III 2.682
RL 1 (b) L1 III 1.496
RL 1 L1 IVa 0.967
RL1 L4 IVa 0.402
RL1 L7 IVa 0.543
Along foliation Va 0.033
RL 1 L2 Va 0.033
4.2.2 Uniaxial Compression Test
11 samples out of 14 of weathered sandstones and 8 samples of weathered shale
sample that in grade Va, IVa, III, and II can be cored into cylindrical shape and
compressed. Whereas medium grained sandstones, which fall in grade IVa, are more
friable than the finer grained and easily broken during the coring. Thus performing UCS
test on this samples are very difficult. As a result, there are no values for grade Va.
Summary of the test results are tabulated in Table 4.5 and Table 4.6. Parameters
that been recorded are time, force and the displacement of samples during loading. The
compressive strength of samples is calculated by dividing the maximum force with the
area of cross-section. Previous research shows that ratio of L/D give a significant effect
to the UCS value. ISRM (1980) recommended the UCS value should be determined
from L/D of 2.5 to 3.0. However, it is quite impossible to get L/D of 2.5 to 3.0 for
weathered rock mass as cylindrical sampling of that length can be easily broken. With
equation from σmg of L/D ≠ 2 can be adjusted to L/D = 2 value (σ 2p). From the result
shown in Table , σ2p are found to be lower than σmp with % to %. Most of the
samples from grade IVa are unable to achieve L/D =2 showing that the sampling will be
35
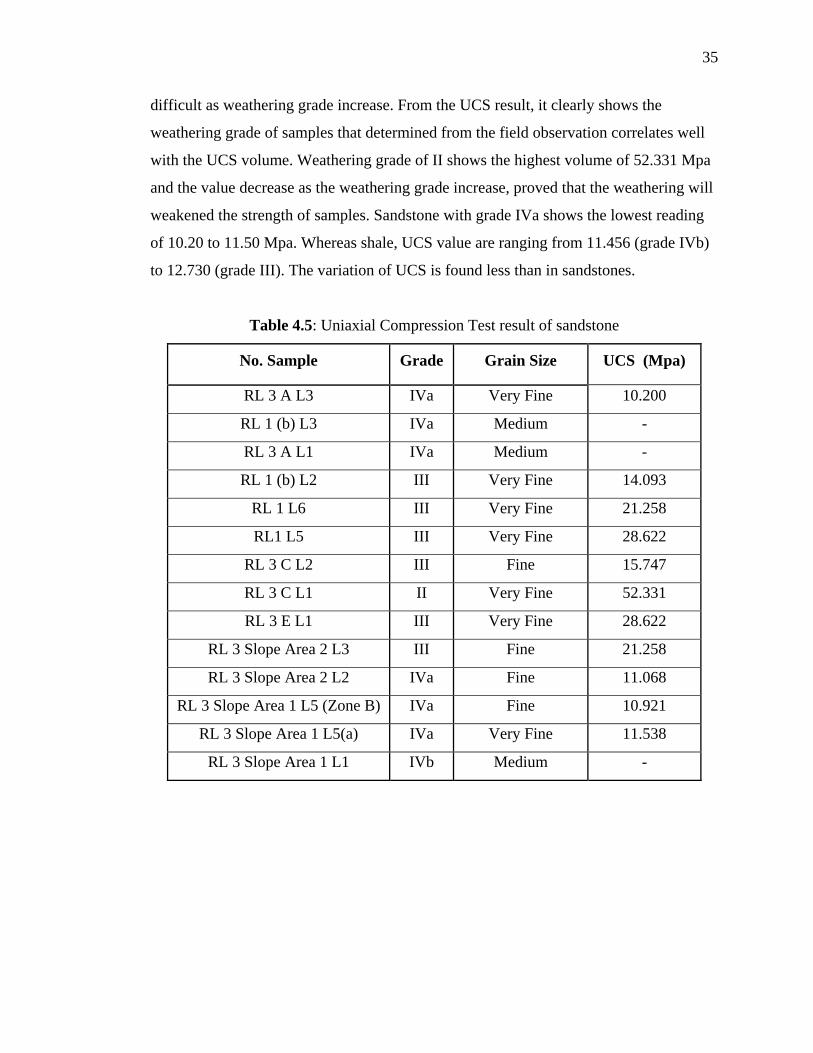
difficult as weathering grade increase. From the UCS result, it clearly shows the
weathering grade of samples that determined from the field observation correlates well
with the UCS volume. Weathering grade of II shows the highest volume of 52.331 Mpa
and the value decrease as the weathering grade increase, proved that the weathering will
weakened the strength of samples. Sandstone with grade IVa shows the lowest reading
of 10.20 to 11.50 Mpa. Whereas shale, UCS value are ranging from 11.456 (grade IVb)
to 12.730 (grade III). The variation of UCS is found less than in sandstones.
Table 4.5: Uniaxial Compression Test result of sandstone
No. Sample Grade Grain Size UCS (Mpa)
RL 3 A L3 IVa Very Fine 10.200
RL 1 (b) L3 IVa Medium -
RL 3 A L1 IVa Medium -
RL 1 (b) L2 III Very Fine 14.093
RL 1 L6 III Very Fine 21.258
RL1 L5 III Very Fine 28.622
RL 3 C L2 III Fine 15.747
RL 3 C L1 II Very Fine 52.331
RL 3 E L1 III Very Fine 28.622
RL 3 Slope Area 2 L3 III Fine 21.258
RL 3 Slope Area 2 L2 IVa Fine 11.068
RL 3 Slope Area 1 L5 (Zone B) IVa Fine 10.921
RL 3 Slope Area 1 L5(a) IVa Very Fine 11.538
RL 3 Slope Area 1 L1 IVb Medium -

36
Table 4.6: Uniaxial Compression Strength (UCS) Test result of shale
No. Sample Grade UCS (MPa)
RL 1 L3 II 59.000
RL 1 (a) L3 III 17.731
RL 1 (b) L1 III 12.730
RL 1 L1 IVa 11.456
RL1 L4 IVa 12.013
RL1 L7 IVa 11.975
Along foliation Va -
RL 1 L2 Va -
4.2.3 Slake Durability
Table 4.7 and table 4.8 show the result of slake durability of Id2 (%) for
sandstones and shale that been tested. All samples were tested to second cycles (Id2) and
the weight retained after the second cycles were recorded against the original weight
before slaking. From the result it shows that sandstones from grade II grade the highest
reading of 94.32%, followed by grade III (78.98 - 90.24 %) grade IVa (43.28 - 57.10%)
and 29.015 % for grade IVb. Generally, it found that the percentage of Id2 decrease with
increase of weathering grade.
After all in shale, the same phenomena were also noted 10.563 – 17.014 %
(grade Va), 30.82 – 62.02 % (Grade IVa), 82.47 - 87.14 % (Grade III) and 91.57 %. The
results suggested that the increase of weathering grade would decrease the quality of
stones through the cementation and hardness of the material.

37
Table 4.7: Id2 of sandstone
No. Sample Grade Grain Size Id2 (%)
RL 3 A L3 IVa Very Fine 49.03
RL 1 (b) L3 IVa Medium 43.28
RL 3 A L1 IVa Medium 45.74
RL 1 (b) L2 III Very Fine 90.24
RL 1 L6 III Very Fine 89.55
RL1 L5 III Very Fine 89.47
RL 3 C L2 III Fine 82.16
RL 3 C L1 II Very Fine 94.32
RL 3 E L1 III Very Fine 78.98
RL 3 Slope Area 2 L3 III Fine 80.78
RL 3 Slope Area 2 L2 IVa Fine 57.10
RL 3 Slope Area 1 L5 (Zone B) IVa Fine 48.65
RL 3 Slope Area 1 L5 (a) IVa Very Fine 50.63
RL 3 Slope Area 1 L1 IVb Medium 29.015
Table 4.8: Id2 of shale
No. Sample Grade Id2 (%)
RL 1 L3 II 91.57
RL 1 (a) L3 III 87.14
RL 1 (b) L1 III 82.47
RL 1 L1 IVa 30.82
RL1 L4 IVa 62.02
RL1 L7 IVa 59.13
Along foliation Va 17.014
RL 1 L2 Va 10.563

38
4.2.4 Pundit Test
Seismic velocity test is another test that were conducted in the laboratory. Table
4.9 and Table 4.10 show the result of the P wave velocity for the sandstones and shale
tested. It found that the lowest reading is detected from grade IVa (medium sandstone),
followed by grade Va shale and the highest readings were recorded in grade II and III
materials. The results also show that the grain size of material plays an important role
affecting the same grade gave higher velocity compared to coarser ones. This might
suggest the wave travels faster in the more compacted material compared to the looser
ones.
Table 4.9: Pundit test result of sandstone
No. Sample Grade Grain Size Pundit (m/s)
RL 3 A L3 IVa Very Fine 2576
RL 1 (b) L3 IVa Medium 1795
RL 3 A L1 IVa Medium 1645
RL 1 (b) L2 III Very Fine 2857
RL 1 L6 III Very Fine 2857
RL1 L5 III Very Fine 2994
RL 3 C L2 III Fine 2620
RL 3 C L1 II Very Fine 2857
RL 3 E L1 III Very Fine 2620
RL 3 Slope Area 2 L3 III Fine 2417
RL 3 Slope Area 2 L2 IVa Fine 2030
RL 3 Slope Area 1 L5 (Zone B) IVa Fine 1795
RL 3 Slope Area 1 L5 (a) IVa Very Fine 2030
RL 3 Slope Area 1 L1 IVb Medium 1366

39
Table 4.10: Pundit test result of shale
No. Sample Grade Pundit (m/s)
RL 1 L3 II 2857
RL 1 (a) L3 III 2576
RL 1 (b) L1 III 2417
RL 1 L1 IVa 1620
RL1 L4 IVa 2620
RL1 L7 IVa 1952
Along foliation Va 1366
RL 1 L2 Va 1366
4.2.5 Dry Density
Table 4.11 shows the dry density of tested samples. Grade III sandstone has dry
density of 2539 kg/m3, followed by Grade IVa sandstone which has the highest value of
2248 kg/m3. The dry density decrease to 1742 kg/m3 for grade IVa and the lowest dry
density is found in grade IVb that is 2150 kg/m3. Whereas shale, the dry density between
different grades does not show big variations as sandstone.
Dry density is one of the most important factors in assessing the mechanical
properties of samples. The density of samples may tell us on the compactness of the
grain, which will affect the overall properties of the rock.
From the result, it shows that certain range of value may overlap with samples
for other grade. It also shows that the material from the same grade might not have the
similar density. However, a very significant different can be detected from solid fresh
sandstone with most friable (Grade IVb) that has the volume of to respectively.

40
The condition of shale does not show big different in which the value noted 1985
- 2205 kg/m3 (grade Va), 2218 - 2861 kg/m3 (grade IVa), 2266 -2268 kg/m3 (grade III)
and 2524 kg/m3 for grade II.
Table 4.11: Dry density of sandstone
No. Sample Grade Grain Size
Dry Density
(kg/m3)
RL 3 A L3 IVa Very Fine 2340
RL 1 (b) L3 IVa Medium 1742
RL 3 A L1 IVa Medium 1777
RL 1 (b) L2 III Very Fine 2149
RL 1 L6 III Very Fine 2248
RL1 L5 III Very Fine 2539
RL 3 C L2 III Fine 2097
RL 3 C L1 II Very Fine 2286
RL 3 E L1 III Very Fine 2437
RL 3 Slope Area 2 L3 III Fine 2624
RL 3 Slope Area 2 L2 IVa Fine 2130
RL 3 Slope Area 1 L5 (Zone B) IVa Fine 2248
RL 3 Slope Area 1 L5 (a) IVa Very Fine 2243
RL 3 Slope Area 1 L1 IVb Medium 2150

41
Table 4.12: Dry density of shale
No. Sample Grade Dry Density
(kg/m3)
RL 1 L3 II 2524
RL 1 (a) L3 III 2268
RL 1 (b) L1 III 2266
RL 1 L1 IVa 2218
RL1 L4 IVa 2861
RL1 L7 IVa 2861
Along foliation Va 2205
RL 1 L2 Va 1985
4.3 Correlation of Laboratory Index Test
Based on the laboratory work, the samples of sandstone that are found from the
site are about 20 types with different size and different weathering grade. The samples
sizes are consist of very fine, fine and medium.
4.3.1 Correlation of Slake Durability (Id2) and Point Load Test (Is50)
Figure 4.1 shows a correlation between Slake durability and Point Load Test for
sandstone and shale. Slake durability is a test which is describing a weathering process
in real situation whereas point load test is a more flexible way to detect strength of
material.

42
The graph is plotted from the Id2 (%) and Is50 values of the same material tested.
The grade of samples determined from the field tests were marked with different symbol
to show if there is any relationship that can be drawn.
From the graph, it shows that the test of weathered material, give the higher Is50
and Id2. The values for these two parameters deteriorate with the increase of the
weathering grade. It also shows that the Is50 of 0.5 to 6 shows small variance in the Id2
value. However value of Is50 that is lesser than 0.5, shows a significant variance in the
Id2 value. This might due to fresher and stranger material be able to resist the slaking
better than the weaker ones. The weaker material may lose their weight faster through
the slaking process compared to fresher material.
Figure 4.1: Graph Slake Durability vs Point Load Test (Is50)
P L T v s S la k e D u r a b i l i t y
y = 5 3 .4 7 8 x + 2 1 .2 2 9R 2 = 0 .4 4 9 3
y = 0 .9 8 0 6 x + 8 6 .5 6 3R 2 = 0 .0 5 1 7
0 .0 0
2 0 .0 0
4 0 .0 0
6 0 .0 0
8 0 .0 0
1 0 0 .0 0
1 2 0 .0 0
0 .0 0 1 0 .0 1 0 0 .1 0 0 1 .0 0 0 1 0 .0 0 0
Is ( 5 0 )
Slak
e

43
4.3.2 Correlation of Uniaxial Compressive Test (UCS) and Point Load Test (Is50)
Figure 4.2 show a correlation between UCS and Is50 for sandstone. A
graph is plotted to show the relationship of these two parameters. Many researcher trials
to develop relationship of UCS and Is50, value Is50 value is preferred to be used in the
material strength test in weathered rock due to the flexibility in sampling.
Same material within the same grade was tested and the selections of samples
that are going to be used are properly selected to minimize variance in sampling.
In the graph, the correlation is divided into two, i.e. when Is50 < 1 (for completely and
highly weathered material) and Is50 > 1 (for slightly to moderately weathered material).
In the section of Is50 <1, the linear correlation is simplified as follow: -
y = 12.228x + 1.7475
Whereas for Is50 >1, the linear correlation is simplified to:-
y = 14.451x + 0.0965
Figure 4.2: Graph Uniaxial Compressive Test (UCS) vs Point Load Test (Is50)
P L T v s U C T
y = 1 2 .2 2 8 x + 1 .7 4 7 5R 2 = 0 .6 0 8 3
y = 1 4 .4 5 1 x + 0 .0 9 6 5R 2 = 0 .6 5 1 2
0
1 0
2 0
3 0
4 0
5 0
6 0
7 0
8 0
9 0
0 . 0 0 1 0 . 0 1 0 0 . 1 0 0 1 . 0 0 0 1 0 . 0 0 0 1 0 0 . 0 0 0
Is ( 5 0 )
UC
T

44
4.4 Summary of Laboratory Test Result
The result for each test is tabulated in Table 4.13 for sandstone and Table 4.14 for
shale. The results show the quality of rock deteriorated with the increase of weathering
grade. However, ripping results showed that grade IVa could not be ripped on site, not
merely because of the rock materials properties but also being influenced by the joints
developed in the rock mass. As such, field study is required to supplement the findings
of the laboratory results.

45
Table 4.13: Summary of Test Results for Sandstone
No. Sample Grade Grain Size Is50 UCS (MPa) Id2 (%) Pundit (m/s) Dry Density
(kg/m3) Remark
RL 3 A L3 IVa Very Fine 0.959 10.200 49.03 2576 2340 Unrippable
RL 1 (b) L3 IVa Medium 0.033 43.28 1795 1742 Unrippable
RL 3 A L1 IVa Medium 0.111 45.74 1645 1777 Unrippable
RL 1 (b) L2 III Very Fine 1.143 14.093 90.24 2857 2149 Rippable
RL 1 L6 III Very Fine 1.028 21.258 89.55 2857 2248 Rippable
RL1 L5 III Very Fine 2.623 28.622 89.47 2994 2539 Rippable
RL 3 C L2 III Fine 1.143 15.747 82.16 2620 2097 Rippable
RL 3 C L1 II Very Fine 3.669 52.331 94.32 2857 2286 Rippable
RL 3 E L1 III Very Fine 2.898 28.622 78.98 2620 2437 Rippable
RL 3 Slope Area 2 L3 III Fine 2.009 21.258 80.78 2417 2624 Rippable
RL 3 Slope Area 2 L2 IVa Fine 0.713 11.068 57.10 2030 2130 Unrippable
RL 3 Slope Area 1 L5
(Zone B) IVa Fine 0.868 10.921 48.65 1795 2248 Unrippable
RL 3 Slope Area 1 L5
(a) IVa Very Fine 0.491 11.538 50.63 2030 2243 Unrippable
RL 3 Slope Area 1 L1 IVb Medium 0.033 29.015 1366 2150 Unrippable

46
Table 4.14: Summary of Test Results for Shale
No. Sample Grade Is50 UCS (MPa) Id2 (%) Pundit (m/s) Dry Density
(kg/m3) Remark
RL 1 L3 II 3.445 59.000 91.57 2857 2524.80 Rippable
RL 1 (a) L3 III 2.682 17.731 87.14 2576 2268.36 Rippable
RL 1 (b) L1 III 1.496 12.730 82.47 2417 2266.00 Rippable
RL 1 L1 IVa 0.967 11.456 30.82 1620 2218.00 Unrippable
RL1 L4 IVa 0.402 12.013 62.02 2620 2861.00 Unrippable
RL1 L7 IVa 0.543 11.975 59.13 1952 2861.00 Unrippable
Along
foliation Va 0.033 17.014 1366 2205.65 Rippable
RL 1 L2 Va 0.033 10.563 1366 1985.21 Rippable

47
CHAPTER 5
CONCLUSION
5.1 Conclusion
From the results, it is shown that the strength and qualities of material deteriorates
with increasing of weathering grade observed at the site. Testing and analysis engineering
approach have given the attention on weathered matter issue and also resolving the
sampling problem for weak weathered rock to obtain the aspired data. Therefore,
throughout weathering grade spectrum with deteriorating of sandstone strength and shale
have been formed. Initial development technique of uniaxial compressive test is most
appropriate to be done to evaluate weak rock mass properties and weathered.
The laboratory test results alone would not represent the actual behaviour of rock
material during rippability assessment. Some of the material found to be weak, are found
to be not rippable and vice versa. Thorough field assessments, which need to include
discontinuity analysis, are vital and these data are to substantiate the laboratory results.

48
From the site observation we knew that weak weathered rock which is affected by
humid tropical climate specifically grade IVa, and IVb included V supposes can be
ripped based on the rock mass properties. The result from this research denote that the
weak weathered sample that been found could not be ripped. After through all tests
involve in this research, the writer found that those type of weathered rock need
supported from field data. The field data is significant, and the combination of field and
laboratory result will ensure whether the rock can be ripped or not.

59
REFERENCES Abdul Latif, O.M. and Cruden, B, Chacon, E., Gutierrez, V. and Hidalgo, E., 1983. Application of Geomechanical Classification to Predict Convergence of Coal Mine Galleries and to Design Their Support, Proc. 5th Int. Congress Rock Mechanics, ISRM, Melbourne, Vol. 2, pp E15-E19. Atkinson, T, 1971, Selection of open pit excavating and loading equipment, Trans Ins. Of Mining and Metallurgy, vol: 80 Bozdag, T., 1988, Indirect rippability assessment of coal measure rocks, MSc Thesis, METU, Ankara, Turkey. Bradybrooke, J.C., 1988, The state of art of rock cuttability and rippability prediction, Fifth Australia-New Zealand Conference on Geomechanics, Sydney, 22-23 August. Broch, E. & Franklin, J.A. 1972. Point-load strength test. Int. Journal Rock Mech. Mining Science. 9: 669-697. Caterpillar Performance Handbook (2001). Chigira, M., Sone, K. 1991. Chemical weathering mechanisms and their effects on engineering properties of soft sandstone and conglomerate cemented by zeolite in a mountanious area. Quarterly Intel. Journal Engineering Geology. 30:195-219. Chigira, M. 1990. A mechanism of chemical weathering of mudstone in a mountainous area. Quarterly Intel.Journal Engineering Geology 29 : 119-139. Cripps, J.C., Coulthard, J.M., Culshaw, M.G. & Forster, A., Hencher, S.R., Moon, C.F. ed, . 1993. The Engineering Geology of Weak Rock. 26th Annual Conference of the Engineering Geology Group of the Geological Society. The Engineering Geology Of Weak Rock.: Deere, D.U., Miller, R.P. 1966. Engineering clssification and index properties for intact rock. Tech. Rep. AFWL-TR-65-116, Air Force Weapons Lab., Kirtland Air Force Base.: 308. F. MacGregor, R. Fell, G.R. Mostyn, G. Hocking & G. McNally (1993); Estimation of rock rippability pp 122-144(File 4). Franklin, J.A.,Broch, E. and Walton, G., 1971. Logging the Mechanical Character of Rock, Trans. Ins. Of Mining and Metallurgy, vol: 80.
Hakan Basarir (2001) PhD Thesis, Turkey (Own file 10).

60
Hassani, F.P., Scoble, M.J. & Whittaker, B.N. 1980. Application of the point load index test to strength determination of rock and proposals for new size-correction chart.Proc. 21st U.S. Symp. Rock Mechanics, Rolla, Md.:. 543-564. Hencher S.R, Ebuk E.J, Abrams J.H, Lumsden A.C (1990); Field Description and Classification of Hydrotermally Altered Granite from SW England, Tenth Southeast Asian Geotechnical Conference, 16-20 April, 1990, Taipei, pp 303-308. Hencher S.R. and Martin R.P. (1982) The description and classification of weathered rocks in Hong Kong for Engineering Purposes, Proceedings of the seventh Southeast Asian Geotechnical Conference/22-26 November 1982, Hong Kong. Hill, S. E.,Rosenbaum, M.S 1998. Assessing the significant factors in a rock weathering system. Quarterly Intel. Journal Engineering Geology 31 : 85-94. ISRM .1981. Rock Characterization, Testing and Monitoring –ISRM Suggested Methods,.E.T. Brown ed. Pergamon Press, Oxford. Karpuz, C., 1990. A Classification System for Excavation of Surface Coal Measures. Min. Sci. Technology, 11: 157-163. Kirsten, H. A. D. (1982), A classification system for excavation in natural materials, Die Siviele Ingenieur in Suid Afrika, July 1982. Komoo, I. 1995. Weathering as an important factor in assessing engineering properties of rock materials. Forum on Soil and Rock Properties, Geological Society Malaysia. Universiti Malaya, Kuala Lumpur. Komoo, I. 1995. Syarahan Perdana Geologi Kejuruteraan Perspektif Rantau Tropika Lembap, Universiti Kebangsaan Malaysia. Kramadibrata, Suseno, 1996. The Influence of Rock Mass and Intact Rock Properties on the Design of Surface Mines with Particular Reference to the Excavatability of Rock. PhD Thesis, University of Curtin, Australia. Knill, J.K. 1993 . Material Weathering. 26th Annual Conference of the Engineering Geology Group of the Geological Society. The Engineering Geology of Weak Rock. :155-158. Mohamed, Z., Komoo, I., Rafek, A.G. 2001 . Review of weathered rock mass characterization and its significannce to civil engineering works. Proceeding 3rd Asian Symposium Engineering Geology and the Environment. Indonesia. Muftuoglu, Y.V., 1983, A study of factors affecting diggability in British surface coal mines, PhD Thesis, University of Nottingham, England.

61
Pettifer G.S. & Fookes P.G. (1994), A revision of the graphical method for assessing the excavatability of rock, Quarterly Journal of Engineering Geology, 27, pg 145-164 Santi, P.M. 1998. Refined Field Methods For Identifying, Describing, and Testing Shale and Weak Rock. Proc. Of the 29th Ohio River Valley Soil Seminar. Louisville, Kentucky. U.S.A. Singh, R.N., Denby, B., Egretli, I., 1987, Development of new rippability index for coal measures excavation, Proc. 28th US Symp. On Rock Mechanics, Tuscon. Singh, M., Boo, T.C., Yusoff, Z.M. 1990. Emphasis of geotechnics and engineering geology in cut slopes. Proceeding of Seminar on Geotechnical Aspects of North- South Expressway.PLUS Berhad. Malaysia. : 97-108. Smith, H.J., 1986, Estimating rippability of rock mass classification, Proc. 27th US Symp. On Rock Mechanics, University of Alabama Tugrul, A. Gurpinal, O. 1997. A Proposed Weathering Classification for Basalts and their Engineering Properties. . Bull.of Engineering Geology. 55 : 139-149. Weaver, J.M., 1975, Geological factors significant in the assessment of rippability, Civil Eng. In South Africa, Vol:17 Zhao, J., Broms, B.B. 1993. Machanical and Physical properties of the weahered Bukit Timah granite of Singapore. Proceeding of the ISRM Symposium ISSMFE/IAEG/ISRM. Geotechnical Engineering of Hard Soils-Soft Rocks.:883- 890.