Laboratory Evaluation of Select Engineering-Related ... Cullet... · Laboratory Evaluation of...
26
Laboratory Evaluation of Select Engineering-Related Properties of Glass Cullet
-
Upload
dinhnguyet -
Category
Documents
-
view
220 -
download
1
Transcript of Laboratory Evaluation of Select Engineering-Related ... Cullet... · Laboratory Evaluation of...
Laboratory Evaluation of
Select Engineering-Related Properties of Glass Cullet
y
De
May 2001
i
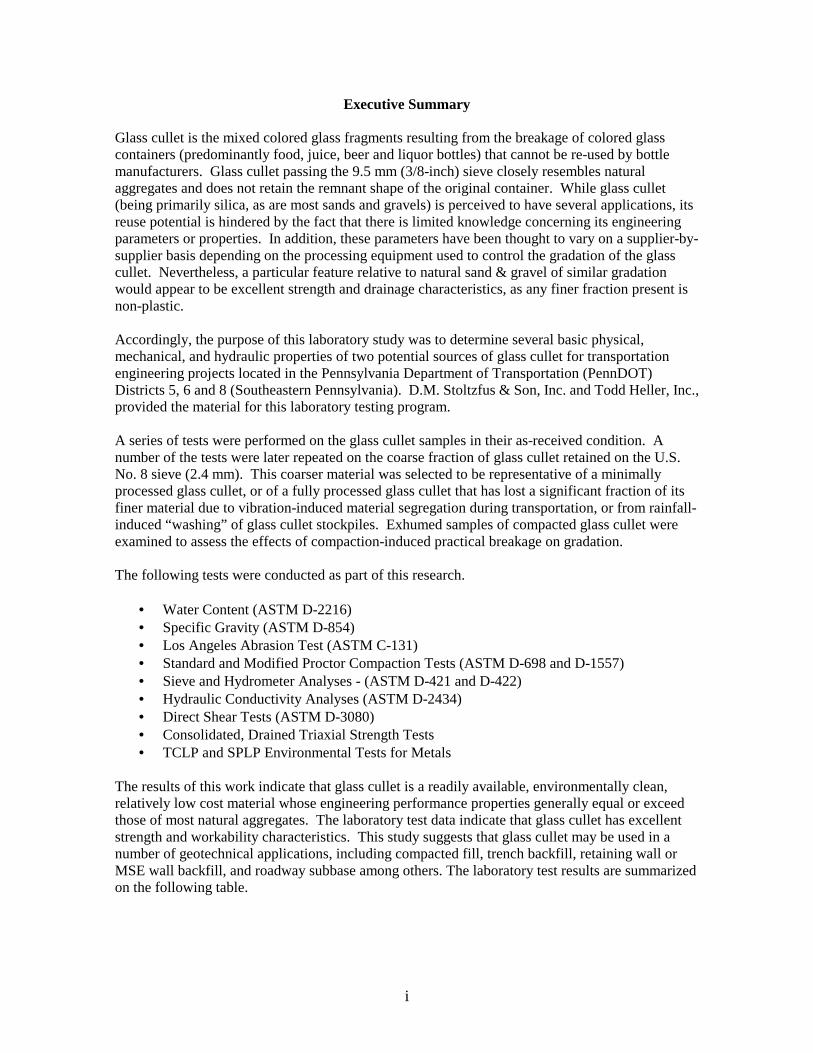
Executive Summary Glass cullet is the mixed colored glass fragments resulting from the breakage of colored glass containers (predominantly food, juice, beer and liquor bottles) that cannot be re-used by bottle manufacturers. Glass cullet passing the 9.5 mm (3/8-inch) sieve closely resembles natural aggregates and does not retain the remnant shape of the original container. While glass cullet (being primarily silica, as are most sands and gravels) is perceived to have several applications, its reuse potential is hindered by the fact that there is limited knowledge concerning its engineering parameters or properties. In addition, these parameters have been thought to vary on a supplier-by-supplier basis depending on the processing equipment used to control the gradation of the glass cullet. Nevertheless, a particular feature relative to natural sand & gravel of similar gradation would appear to be excellent strength and drainage characteristics, as any finer fraction present is non-plastic. Accordingly, the purpose of this laboratory study was to determine several basic physical, mechanical, and hydraulic properties of two potential sources of glass cullet for transportation engineering projects located in the Pennsylvania Department of Transportation (PennDOT) Districts 5, 6 and 8 (Southeastern Pennsylvania). D.M. Stoltzfus & Son, Inc. and Todd Heller, Inc., provided the material for this laboratory testing program. A series of tests were performed on the glass cullet samples in their as-received condition. A number of the tests were later repeated on the coarse fraction of glass cullet retained on the U.S. No. 8 sieve (2.4 mm). This coarser material was selected to be representative of a minimally processed glass cullet, or of a fully processed glass cullet that has lost a significant fraction of its finer material due to vibration-induced material segregation during transportation, or from rainfall-induced “washing” of glass cullet stockpiles. Exhumed samples of compacted glass cullet were examined to assess the effects of compaction-induced practical breakage on gradation. The following tests were conducted as part of this research.
• Water Content (ASTM D-2216) • Specific Gravity (ASTM D-854) • Los Angeles Abrasion Test (ASTM C-131) • Standard and Modified Proctor Compaction Tests (ASTM D-698 and D-1557) • Sieve and Hydrometer Analyses - (ASTM D-421 and D-422) • Hydraulic Conductivity Analyses (ASTM D-2434) • Direct Shear Tests (ASTM D-3080) • Consolidated, Drained Triaxial Strength Tests • TCLP and SPLP Environmental Tests for Metals
The results of this work indicate that glass cullet is a readily available, environmentally clean, relatively low cost material whose engineering performance properties generally equal or exceed those of most natural aggregates. The laboratory test data indicate that glass cullet has excellent strength and workability characteristics. This study suggests that glass cullet may be used in a number of geotechnical applications, including compacted fill, trench backfill, retaining wall or MSE wall backfill, and roadway subbase among others. The laboratory test results are summarized on the following table.
i
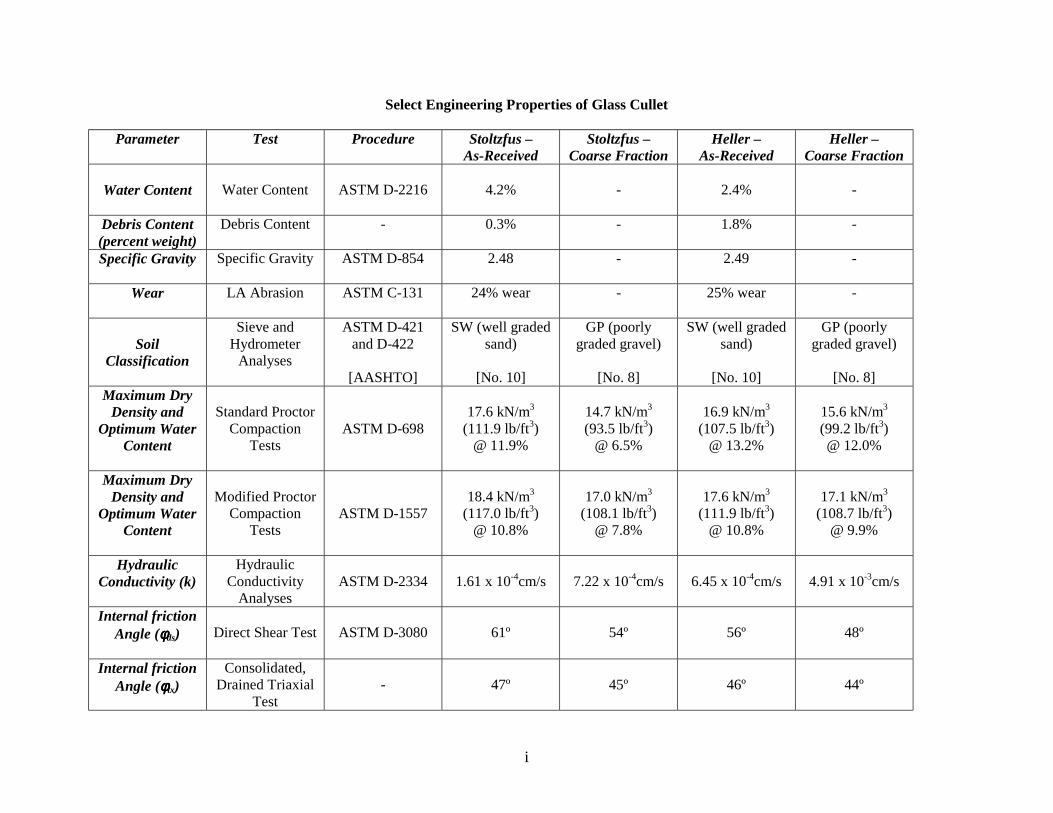
Select Engineering Properties of Glass Cullet
Parameter Test Procedure Stoltzfus – As-Received
Stoltzfus – Coarse Fraction
Heller – As-Received
Heller – Coarse Fraction
Water Content
Water Content
ASTM D-2216
4.2%
-
2.4%
-
Debris Content (percent weight)
Debris Content - 0.3% - 1.8% -
Specific Gravity
Specific Gravity ASTM D-854 2.48 - 2.49 -
Wear
LA Abrasion ASTM C-131 24% wear - 25% wear -
Soil
Classification
Sieve and Hydrometer
Analyses
ASTM D-421 and D-422
[AASHTO]
SW (well graded sand)
[No. 10]
GP (poorly graded gravel)
[No. 8]
SW (well graded sand)
[No. 10]
GP (poorly graded gravel)
[No. 8]
Maximum Dry Density and
Optimum Water Content
Standard Proctor
Compaction Tests
ASTM D-698
17.6 kN/m3
(111.9 lb/ft3) @ 11.9%
14.7 kN/m3
(93.5 lb/ft3)
@ 6.5%
16.9 kN/m3
(107.5 lb/ft3) @ 13.2%
15.6 kN/m3
(99.2 lb/ft3) @ 12.0%
Maximum Dry Density and
Optimum Water Content
Modified Proctor
Compaction Tests
ASTM D-1557
18.4 kN/m3
(117.0 lb/ft3) @ 10.8%
17.0 kN/m3
(108.1 lb/ft3) @ 7.8%
17.6 kN/m3
(111.9 lb/ft3) @ 10.8%
17.1 kN/m3
(108.7 lb/ft3) @ 9.9%
Hydraulic Conductivity (k)
Hydraulic Conductivity
Analyses
ASTM D-2334
1.61 x 10⁻⁴cm/s
7.22 x 10⁻⁴cm/s
6.45 x 10⁻⁴cm/s
4.91 x 10⁻³cm/s
Internal friction
Angle (φφφφds)
Direct Shear Test
ASTM D-3080
61º
54º
56º
48º
Internal friction Angle (φφφφtx)
Consolidated, Drained Triaxial
Test
-
47º
45º
46º
44º

iii
Table of Contents Executive Summary i 1.0 Introduction and Background 1
1.1 Glass Cullet Suppliers 1 1.2 Sample Collection 2
2.0 Laboratory Testing Program 2
2.1 Test Procedures and Results 2 2.1.1 General Observations 2 2.1.2 Laboratory Test Results 3
Water Content 3 Debris Content 3 Specific Gravity 3 Los Angeles Abrasion Test 3 Sieve and Hydrometer Analyses 4 Standard and Modified Proctor Compaction Tests 5 Hydraulic Conductivity Analyses 5 Direct Shear Tests 6 Consolidated, Drained Triaxial Strength Tests 7 TCLP and SPLP Environmental Tests 8
3.0 Conclusions 8 4.0 References 9 Appendix A Los Angeles laboratory data report Appendix B TCLP and SPLP laboratory data report
Tables Table 1 – Glass cullet supplier information 1 Table 2 – Summary of water content data 3 Table 3 – USCS and AASHTO classifications of glass cullet samples 4 Table 4 – Summary of compaction test data 5 Table 5 – Summary of hydraulic conductivity test results 7 Table 6 – Summary of direct shear test results 7 Table 7 – Summary of shear test results 8
Figures Figure 1 – Glass stockpile at Stoltzfus facility containing waste glass from local suppliers 11 Figure 2 – Stockpile at Stoltzfus facility containing crushed glass cullet 11 Figure 3 – Stockpile at Heller facility containing unprocessed glass cullet 12 Figure 4 – As-received glass cullet sample from Stoltzfus 13 Figure 5 – As-received glass cullet from sample Heller 13
iv
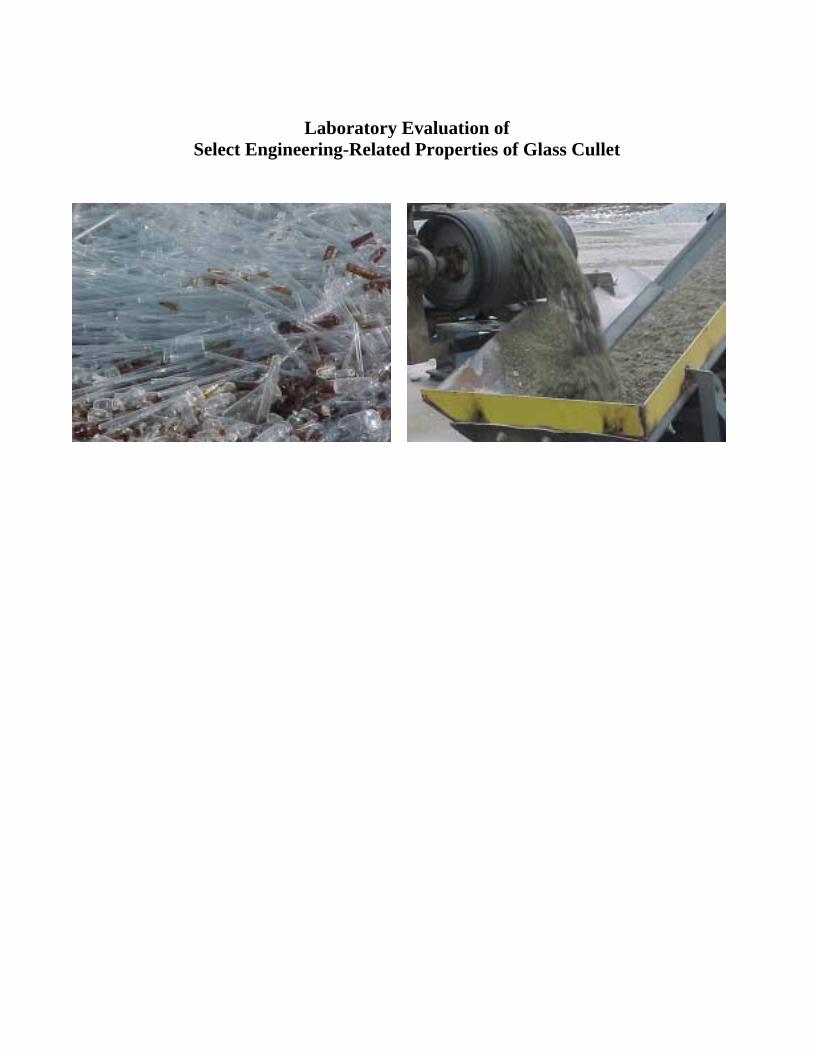
Figure 6 – Grain size distribution for as-received, post-compacted glass cullet specimens 14 Figure 7 – Moisture-density compaction relationships for as-received glass cullet 15 Figure 8 – Moisture-density compaction relationships for coarse fraction glass cullet 15 Figure 9a – Direct shear displacement-shear diagrams for the as-received Stoltzfus glass cullet 16 Figure 9b – Direct shear displacement-shear diagrams for the coarse fraction Stoltzfus glass cullet 16 Figure 10a – Direct shear displacement-shear diagrams for the as-received Heller glass cullet 17 Figure 10b – Direct shear displacement-shear diagrams for the coarse fraction Heller glass cullet 17 Figure 11 – Shear stress-normal stress data from direct shear tests 18 Figure 12 – Photograph of a failed coarse fraction glass cullet sample due to compressive loading 18 Figure 13a – Triaxial test axial strain-shear stress for the as-received Stoltzfus glass cullet samples 19 Figure 13b – Triaxial test axial strain-shear stress for the as-received Heller glass cullet samples 19 Figure 14a – Triaxial test axial strain-shear stress for coarse fraction Stoltzfus glass cullet samples 20 Figure 14b – Triaxial test axial strain-shear stress for the coarse fraction Heller glass cullet samples 20 Figure 15 – Triaxial summary p-q plot 21 Cover photographs – glass stockpile at Stoltzfus facility containing waste glass from local suppliers (left) and glass cullet being transported on a conveyer at Heller facility (right)
1
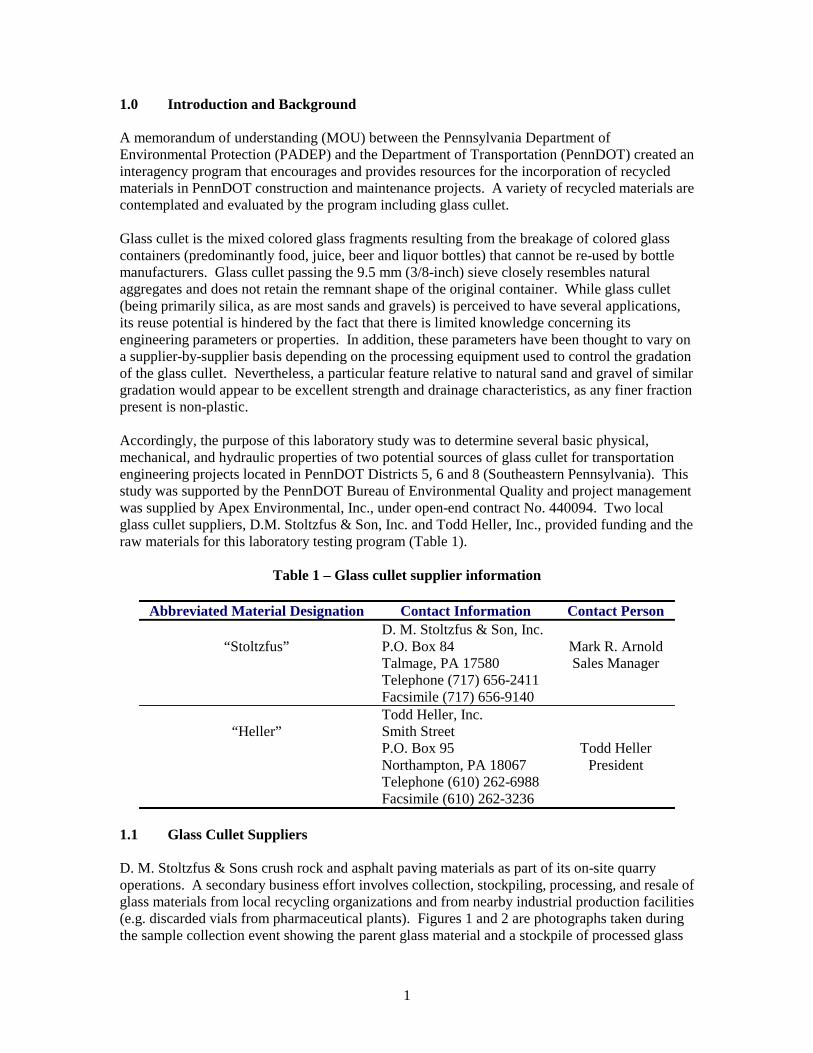
1.0 Introduction and Background A memorandum of understanding (MOU) between the Pennsylvania Department of Environmental Protection (PADEP) and the Department of Transportation (PennDOT) created an interagency program that encourages and provides resources for the incorporation of recycled materials in PennDOT construction and maintenance projects. A variety of recycled materials are contemplated and evaluated by the program including glass cullet. Glass cullet is the mixed colored glass fragments resulting from the breakage of colored glass containers (predominantly food, juice, beer and liquor bottles) that cannot be re-used by bottle manufacturers. Glass cullet passing the 9.5 mm (3/8-inch) sieve closely resembles natural aggregates and does not retain the remnant shape of the original container. While glass cullet (being primarily silica, as are most sands and gravels) is perceived to have several applications, its reuse potential is hindered by the fact that there is limited knowledge concerning its engineering parameters or properties. In addition, these parameters have been thought to vary on a supplier-by-supplier basis depending on the processing equipment used to control the gradation of the glass cullet. Nevertheless, a particular feature relative to natural sand and gravel of similar gradation would appear to be excellent strength and drainage characteristics, as any finer fraction present is non-plastic. Accordingly, the purpose of this laboratory study was to determine several basic physical, mechanical, and hydraulic properties of two potential sources of glass cullet for transportation engineering projects located in PennDOT Districts 5, 6 and 8 (Southeastern Pennsylvania). This study was supported by the PennDOT Bureau of Environmental Quality and project management was supplied by Apex Environmental, Inc., under open-end contract No. 440094. Two local glass cullet suppliers, D.M. Stoltzfus & Son, Inc. and Todd Heller, Inc., provided funding and the raw materials for this laboratory testing program (Table 1).
Table 1 – Glass cullet supplier information
Abbreviated Material Designation Contact Information Contact Person
“Stoltzfus” D. M. Stoltzfus & Son, Inc. P.O. Box 84 Talmage, PA 17580 Telephone (717) 656-2411 Facsimile (717) 656-9140
Mark R. Arnold Sales Manager
“Heller”
Todd Heller, Inc. Smith Street P.O. Box 95 Northampton, PA 18067 Telephone (610) 262-6988 Facsimile (610) 262-3236
Todd Heller President
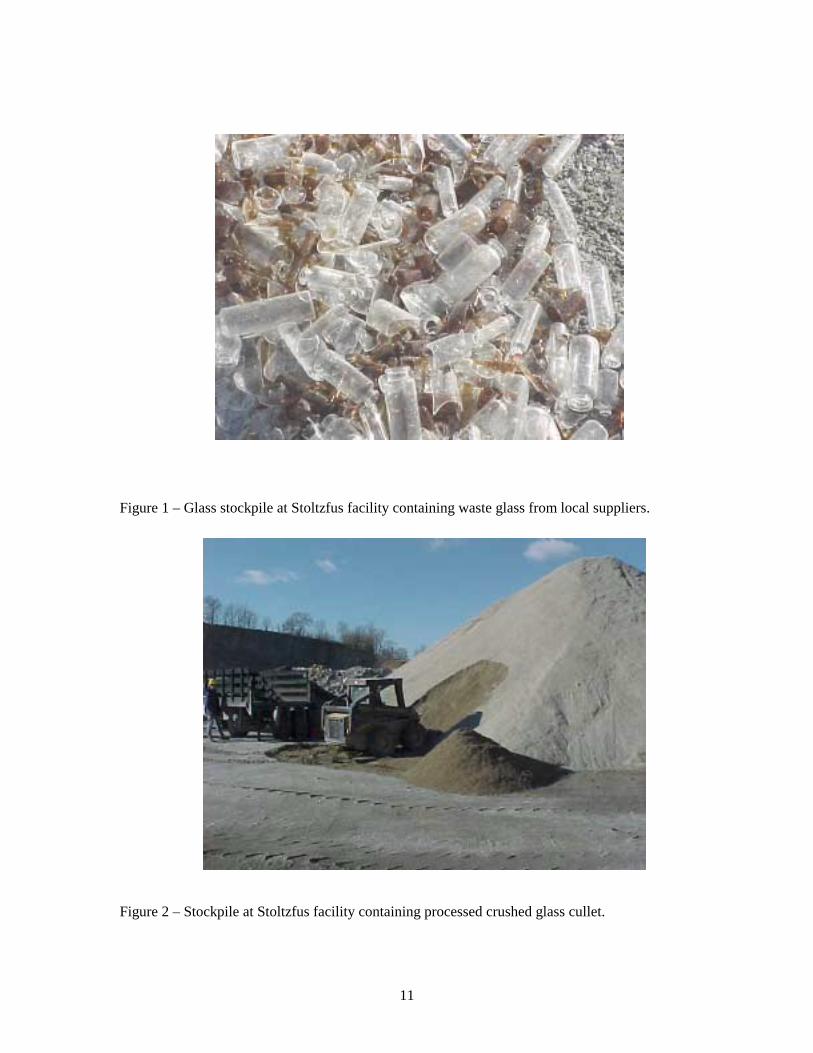
1.1 Glass Cullet Suppliers D. M. Stoltzfus & Sons crush rock and asphalt paving materials as part of its on-site quarry operations. A secondary business effort involves collection, stockpiling, processing, and resale of glass materials from local recycling organizations and from nearby industrial production facilities (e.g. discarded vials from pharmaceutical plants). Figures 1 and 2 are photographs taken during the sample collection event showing the parent glass material and a stockpile of processed glass
2
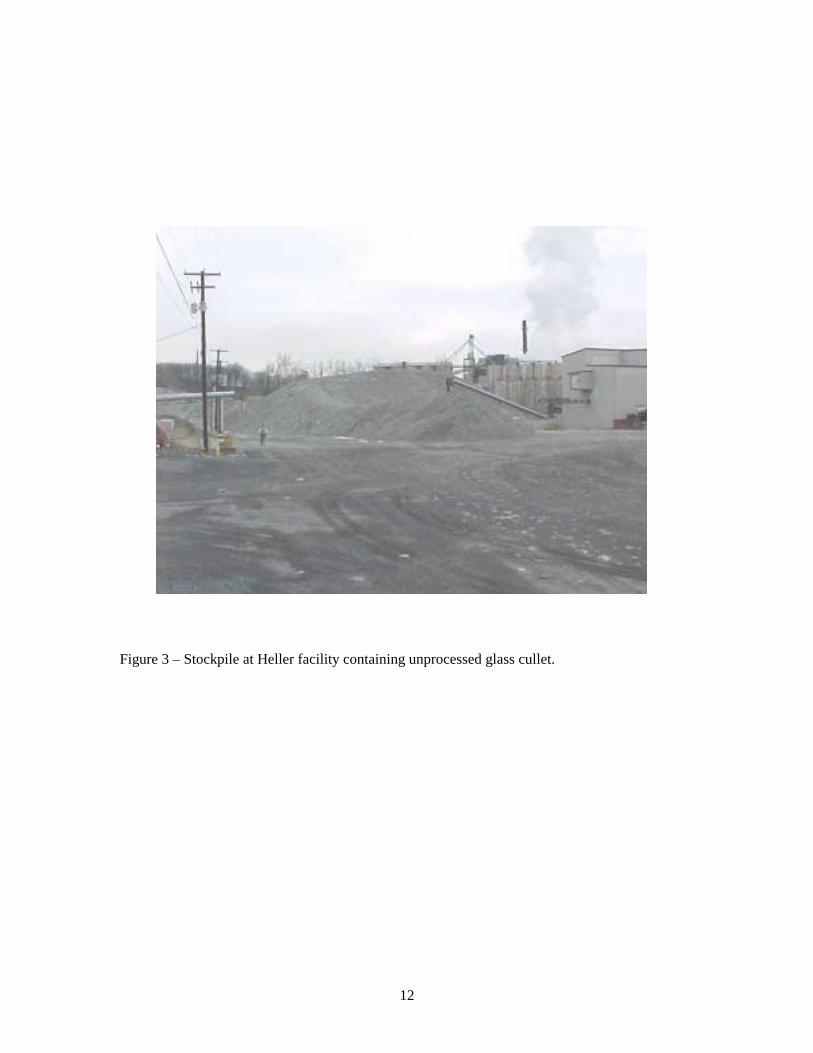
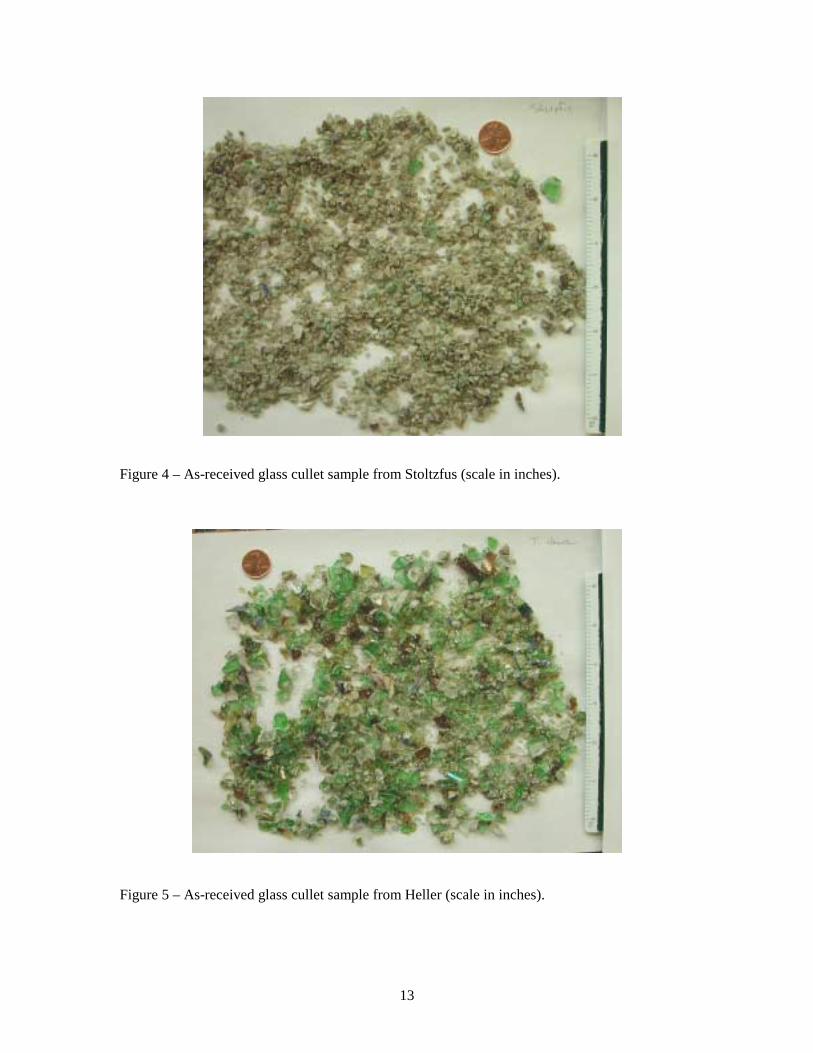
cullet. Using on-site rock crushing machinery, D. M. Stoltzfus & Sons produce a glass cullet product that bears little resemblance to its parent container shape. Todd Heller, Inc. is a recycling corporation that accepts, processes, and separates commingled waste; and resells the glass, plastics, paper, aluminum and other renewable materials. The commingled waste is manually sorted and the larger containers of glass are separated by color. Glass containers and large glass fragments are placed on a conveyer belt and manually sorted according to color, and then sold to bottle manufactures. Smaller, mixed color broken glass shards and fragments and broken ceramics (less then about 3/4 inches in length) cannot be efficiently separated by manual or mechanical means. These materials accumulate in a large stockpile (see Figure 3). Because the processing plant does not contain crushers (only sorting screens), Todd Heller, Inc. produces a glass cullet product that is nominally larger than that of Stoltzfus & Sons, and also retains the remnant shape of the original container (e.g. portions of container labels are sometimes visible on the larger glass particles). 1.2 Sample Collection Representative samples of glass cullet were collected from each of the two suppliers, placed in plastic 210-liter drums, and shipped to Drexel University. The plastic drums were sealed to prevent loss of moisture during shipping. Drs. Joseph Wartman (Drexel University) and Dennis Grubb (Apex Environmental, Inc.) selected the sample locations and monitored the sample collection activities on 12 -13 December 2000. 2.0 Laboratory Testing Program Upon receipt at Drexel University, the sample containers were logged, and labeled to indicate the supplier and container number (e.g. “Stoltzfus-1”). For brevity, the remainder of this report will refer to the samples only by their abbreviated designations (“Stoltzfus” or “Heller”). Note that the commercial laboratory reports contained in Appendix A refer to samples “A-Northampton” or “B-Lancaster.” These samples correspond to materials from Heller and Stoltzfus, respectively. The laboratory tests were performed at Drexel University’s Roy F. Weston Geotechnical and GeoEnvironmental Research Laboratory unless otherwise noted. As discussed in the following sections of this report, a select series of tests were performed on the glass cullet samples in their as-received condition. Figures 4 and 5 show representative samples of the glass cullet from Stoltzfus and Heller, respectively. A number of the tests were later repeated on the coarse fraction of glass cullet that was retained on the U.S. No. 8 sieve (2.4 mm). This coarser material was selected to be representative of a minimally processed glass cullet, or of a fully processed glass cullet that has lost a significant fraction of its finer material due to vibration-induced material segregation during transportation, or from rainfall-induced “washing” of glass cullet stockpiles. 2.1 Test Procedures and Results 2.1.1 General Observations The Heller samples were noticeably coarser and contained more debris than the Stoltzfus material. The debris consisted primarily of bottle labels, and metal and plastic caps. The quantity of debris was not sufficient to affect the engineering properties of the glass cullet (less than 2% by weight). The Stoltzfus material contained virtually no debris (less than 0.5%).
3
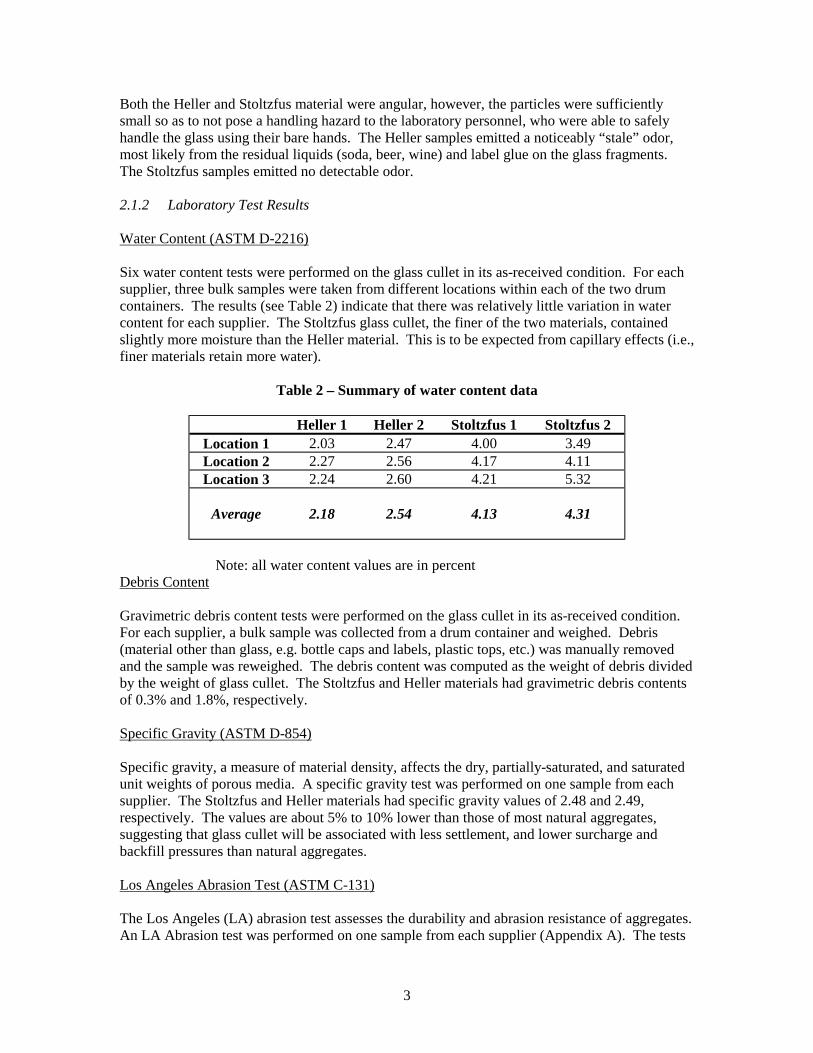
Both the Heller and Stoltzfus material were angular, however, the particles were sufficiently small so as to not pose a handling hazard to the laboratory personnel, who were able to safely handle the glass using their bare hands. The Heller samples emitted a noticeably “stale” odor, most likely from the residual liquids (soda, beer, wine) and label glue on the glass fragments. The Stoltzfus samples emitted no detectable odor. 2.1.2 Laboratory Test Results Water Content (ASTM D-2216) Six water content tests were performed on the glass cullet in its as-received condition. For each supplier, three bulk samples were taken from different locations within each of the two drum containers. The results (see Table 2) indicate that there was relatively little variation in water content for each supplier. The Stoltzfus glass cullet, the finer of the two materials, contained slightly more moisture than the Heller material. This is to be expected from capillary effects (i.e., finer materials retain more water).
Table 2 – Summary of water content data
Heller 1 Heller 2 Stoltzfus 1 Stoltzfus 2 Location 1 2.03 2.47 4.00 3.49 Location 2 2.27 2.56 4.17 4.11 Location 3 2.24 2.60 4.21 5.32
Average
2.18
2.54
4.13
4.31
Note: all water content values are in percent
Debris Content Gravimetric debris content tests were performed on the glass cullet in its as-received condition. For each supplier, a bulk sample was collected from a drum container and weighed. Debris (material other than glass, e.g. bottle caps and labels, plastic tops, etc.) was manually removed and the sample was reweighed. The debris content was computed as the weight of debris divided by the weight of glass cullet. The Stoltzfus and Heller materials had gravimetric debris contents of 0.3% and 1.8%, respectively. Specific Gravity (ASTM D-854) Specific gravity, a measure of material density, affects the dry, partially-saturated, and saturated unit weights of porous media. A specific gravity test was performed on one sample from each supplier. The Stoltzfus and Heller materials had specific gravity values of 2.48 and 2.49, respectively. The values are about 5% to 10% lower than those of most natural aggregates, suggesting that glass cullet will be associated with less settlement, and lower surcharge and backfill pressures than natural aggregates. Los Angeles Abrasion Test (ASTM C-131) The Los Angeles (LA) abrasion test assesses the durability and abrasion resistance of aggregates. An LA Abrasion test was performed on one sample from each supplier (Appendix A). The tests
4
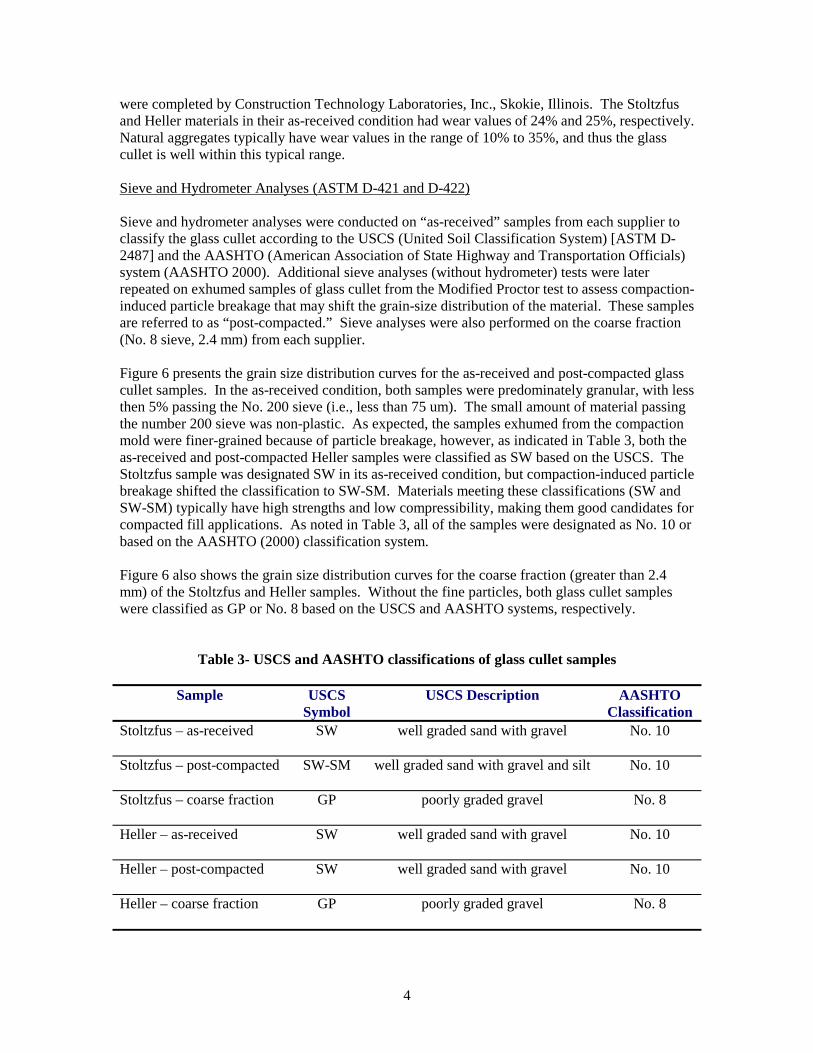
were completed by Construction Technology Laboratories, Inc., Skokie, Illinois. The Stoltzfus and Heller materials in their as-received condition had wear values of 24% and 25%, respectively. Natural aggregates typically have wear values in the range of 10% to 35%, and thus the glass cullet is well within this typical range. Sieve and Hydrometer Analyses (ASTM D-421 and D-422) Sieve and hydrometer analyses were conducted on “as-received” samples from each supplier to classify the glass cullet according to the USCS (United Soil Classification System) [ASTM D-2487] and the AASHTO (American Association of State Highway and Transportation Officials) system (AASHTO 2000). Additional sieve analyses (without hydrometer) tests were later repeated on exhumed samples of glass cullet from the Modified Proctor test to assess compaction-induced particle breakage that may shift the grain-size distribution of the material. These samples are referred to as “post-compacted.” Sieve analyses were also performed on the coarse fraction (No. 8 sieve, 2.4 mm) from each supplier. Figure 6 presents the grain size distribution curves for the as-received and post-compacted glass cullet samples. In the as-received condition, both samples were predominately granular, with less then 5% passing the No. 200 sieve (i.e., less than 75 um). The small amount of material passing the number 200 sieve was non-plastic. As expected, the samples exhumed from the compaction mold were finer-grained because of particle breakage, however, as indicated in Table 3, both the as-received and post-compacted Heller samples were classified as SW based on the USCS. The Stoltzfus sample was designated SW in its as-received condition, but compaction-induced particle breakage shifted the classification to SW-SM. Materials meeting these classifications (SW and SW-SM) typically have high strengths and low compressibility, making them good candidates for compacted fill applications. As noted in Table 3, all of the samples were designated as No. 10 or based on the AASHTO (2000) classification system. Figure 6 also shows the grain size distribution curves for the coarse fraction (greater than 2.4 mm) of the Stoltzfus and Heller samples. Without the fine particles, both glass cullet samples were classified as GP or No. 8 based on the USCS and AASHTO systems, respectively.
Table 3- USCS and AASHTO classifications of glass cullet samples
Sample USCS
Symbol USCS Description AASHTO
Classification Stoltzfus – as-received
SW well graded sand with gravel No. 10
Stoltzfus – post-compacted
SW-SM well graded sand with gravel and silt No. 10
Stoltzfus – coarse fraction
GP poorly graded gravel No. 8
Heller – as-received
SW well graded sand with gravel No. 10
Heller – post-compacted
SW well graded sand with gravel No. 10
Heller – coarse fraction
GP poorly graded gravel No. 8
5
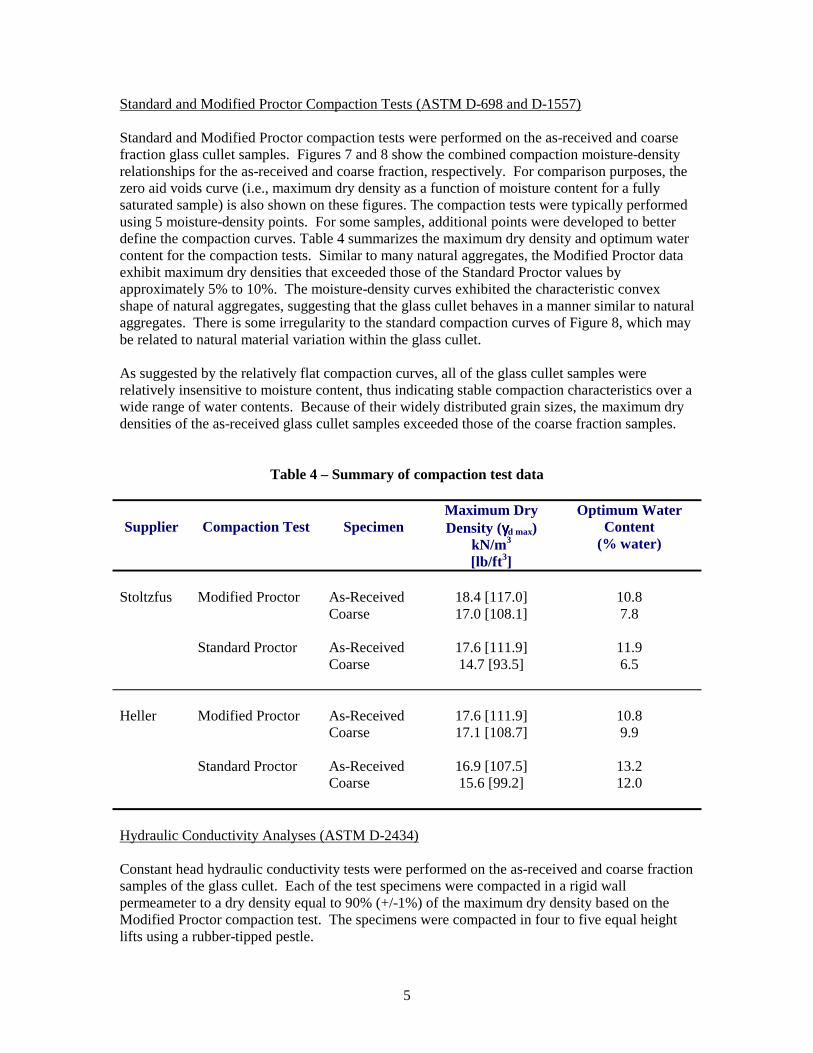
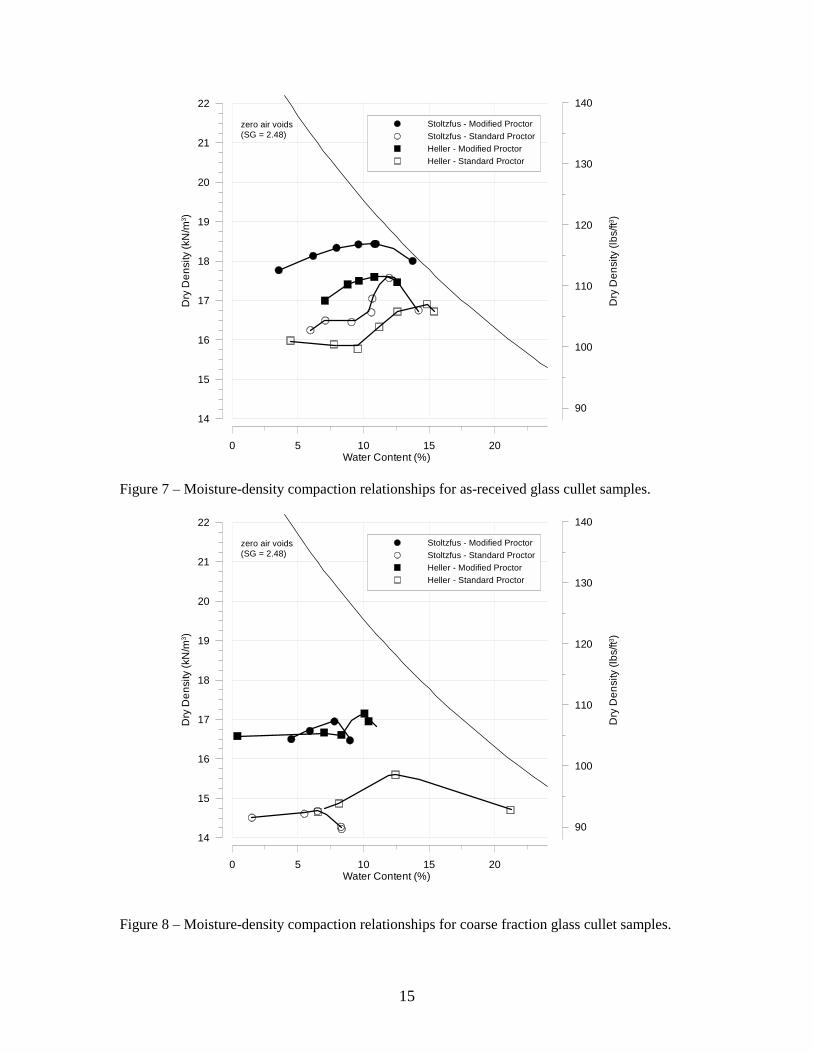
Standard and Modified Proctor Compaction Tests (ASTM D-698 and D-1557) Standard and Modified Proctor compaction tests were performed on the as-received and coarse fraction glass cullet samples. Figures 7 and 8 show the combined compaction moisture-density relationships for the as-received and coarse fraction, respectively. For comparison purposes, the zero aid voids curve (i.e., maximum dry density as a function of moisture content for a fully saturated sample) is also shown on these figures. The compaction tests were typically performed using 5 moisture-density points. For some samples, additional points were developed to better define the compaction curves. Table 4 summarizes the maximum dry density and optimum water content for the compaction tests. Similar to many natural aggregates, the Modified Proctor data exhibit maximum dry densities that exceeded those of the Standard Proctor values by approximately 5% to 10%. The moisture-density curves exhibited the characteristic convex shape of natural aggregates, suggesting that the glass cullet behaves in a manner similar to natural aggregates. There is some irregularity to the standard compaction curves of Figure 8, which may be related to natural material variation within the glass cullet. As suggested by the relatively flat compaction curves, all of the glass cullet samples were relatively insensitive to moisture content, thus indicating stable compaction characteristics over a wide range of water contents. Because of their widely distributed grain sizes, the maximum dry densities of the as-received glass cullet samples exceeded those of the coarse fraction samples.
Table 4 – Summary of compaction test data
Supplier
Compaction Test
Specimen
Maximum Dry Density (γγγγd max)
kN/m3
[lb/ft3]
Optimum Water Content
(% water)
Stoltzfus
Modified Proctor Standard Proctor
As-Received Coarse As-Received Coarse
18.4 [117.0] 17.0 [108.1]
17.6 [111.9] 14.7 [93.5]
10.8 7.8
11.9 6.5
Heller
Modified Proctor Standard Proctor
As-Received Coarse As-Received Coarse
17.6 [111.9] 17.1 [108.7]
16.9 [107.5] 15.6 [99.2]
10.8 9.9
13.2 12.0
Hydraulic Conductivity Analyses (ASTM D-2434) Constant head hydraulic conductivity tests were performed on the as-received and coarse fraction samples of the glass cullet. Each of the test specimens were compacted in a rigid wall permeameter to a dry density equal to 90% (+/-1%) of the maximum dry density based on the Modified Proctor compaction test. The specimens were compacted in four to five equal height lifts using a rubber-tipped pestle.
6
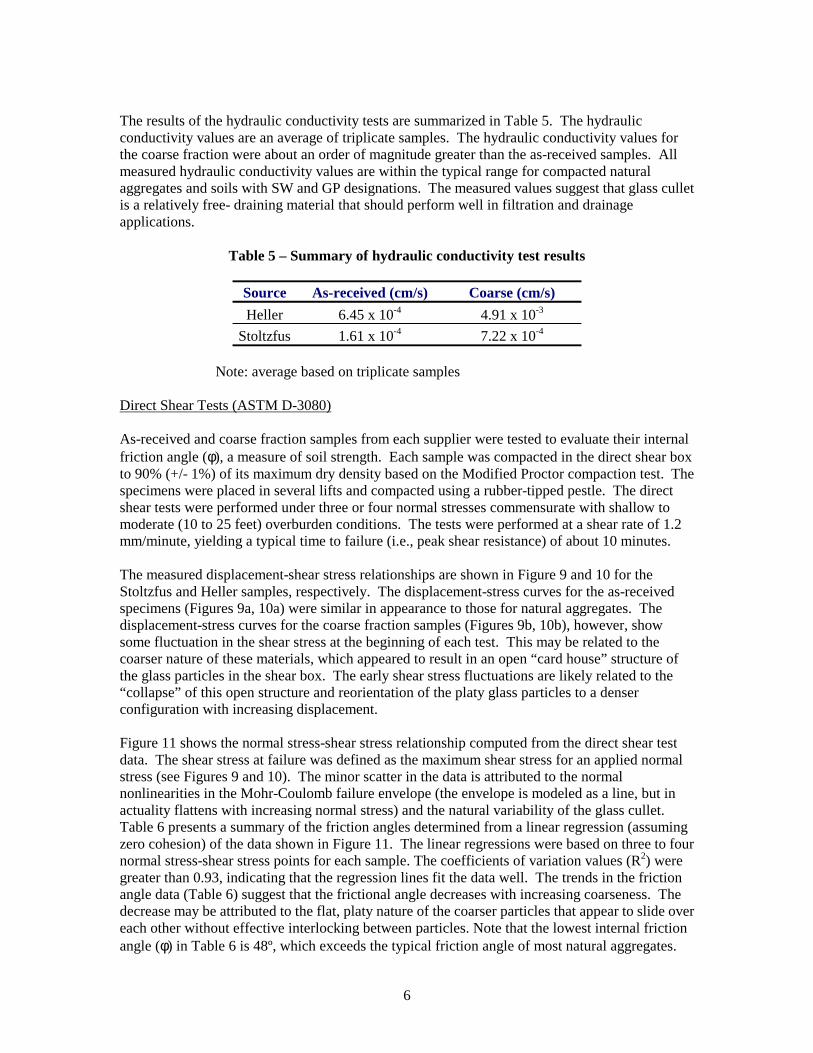
The results of the hydraulic conductivity tests are summarized in Table 5. The hydraulic conductivity values are an average of triplicate samples. The hydraulic conductivity values for the coarse fraction were about an order of magnitude greater than the as-received samples. All measured hydraulic conductivity values are within the typical range for compacted natural aggregates and soils with SW and GP designations. The measured values suggest that glass cullet is a relatively free- draining material that should perform well in filtration and drainage applications.
Table 5 – Summary of hydraulic conductivity test results
Source As-received (cm/s) Coarse (cm/s) Heller 6.45 x 10⁻⁴ 4.91 x 10⁻³
Stoltzfus 1.61 x 10⁻⁴ 7.22 x 10⁻⁴
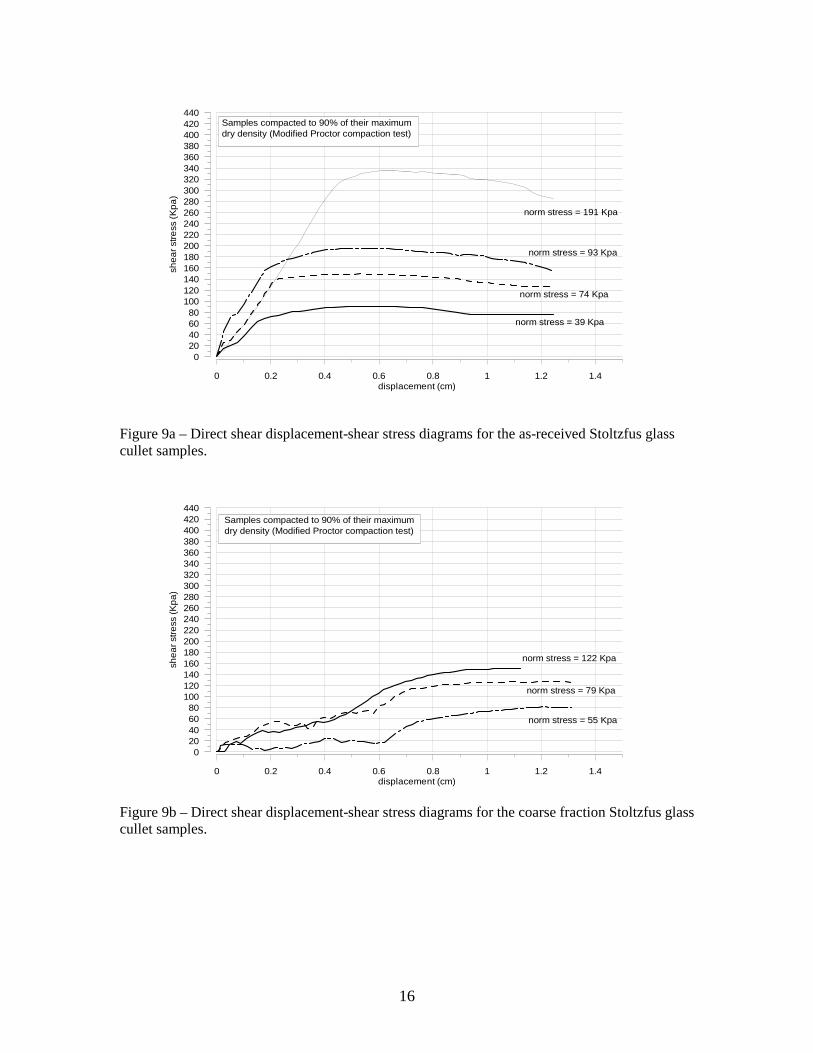
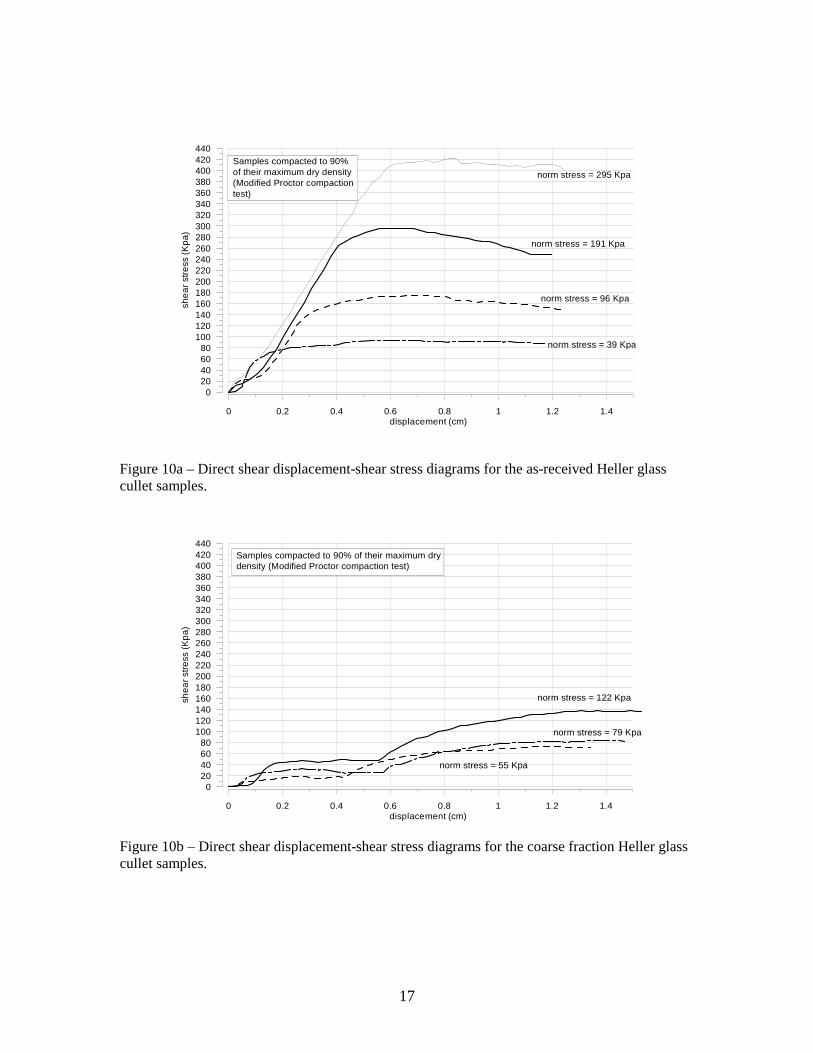
Note: average based on triplicate samples Direct Shear Tests (ASTM D-3080) As-received and coarse fraction samples from each supplier were tested to evaluate their internal friction angle (φ), a measure of soil strength. Each sample was compacted in the direct shear box to 90% (+/- 1%) of its maximum dry density based on the Modified Proctor compaction test. The specimens were placed in several lifts and compacted using a rubber-tipped pestle. The direct shear tests were performed under three or four normal stresses commensurate with shallow to moderate (10 to 25 feet) overburden conditions. The tests were performed at a shear rate of 1.2 mm/minute, yielding a typical time to failure (i.e., peak shear resistance) of about 10 minutes. The measured displacement-shear stress relationships are shown in Figure 9 and 10 for the Stoltzfus and Heller samples, respectively. The displacement-stress curves for the as-received specimens (Figures 9a, 10a) were similar in appearance to those for natural aggregates. The displacement-stress curves for the coarse fraction samples (Figures 9b, 10b), however, show some fluctuation in the shear stress at the beginning of each test. This may be related to the coarser nature of these materials, which appeared to result in an open “card house” structure of the glass particles in the shear box. The early shear stress fluctuations are likely related to the “collapse” of this open structure and reorientation of the platy glass particles to a denser configuration with increasing displacement. Figure 11 shows the normal stress-shear stress relationship computed from the direct shear test data. The shear stress at failure was defined as the maximum shear stress for an applied normal stress (see Figures 9 and 10). The minor scatter in the data is attributed to the normal nonlinearities in the Mohr-Coulomb failure envelope (the envelope is modeled as a line, but in actuality flattens with increasing normal stress) and the natural variability of the glass cullet. Table 6 presents a summary of the friction angles determined from a linear regression (assuming zero cohesion) of the data shown in Figure 11. The linear regressions were based on three to four normal stress-shear stress points for each sample. The coefficients of variation values (R2) were greater than 0.93, indicating that the regression lines fit the data well. The trends in the friction angle data (Table 6) suggest that the frictional angle decreases with increasing coarseness. The decrease may be attributed to the flat, platy nature of the coarser particles that appear to slide over each other without effective interlocking between particles. Note that the lowest internal friction angle (φ) in Table 6 is 48º, which exceeds the typical friction angle of most natural aggregates.

7
Table 6 – Summary of direct shear test results
Source As-Received Coarse Fraction
Stoltzfus
61º
54º
Heller
56º
48º
Note: internal friction angles determined assuming zero cohesion
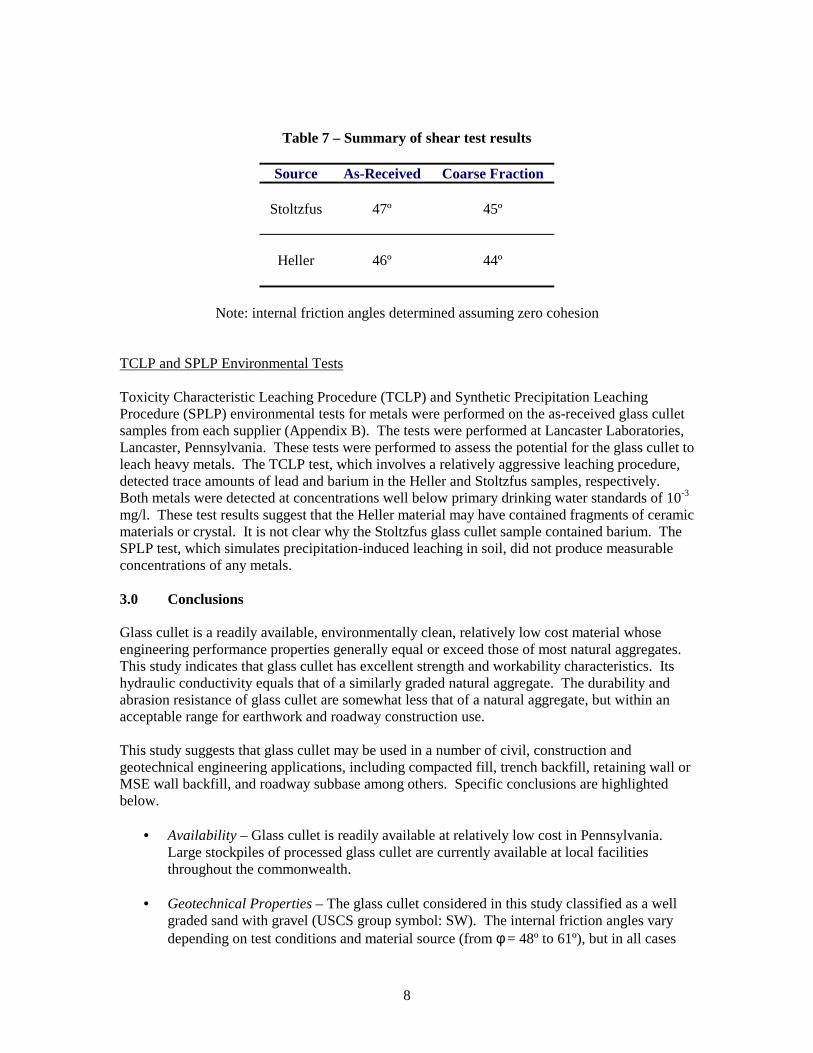
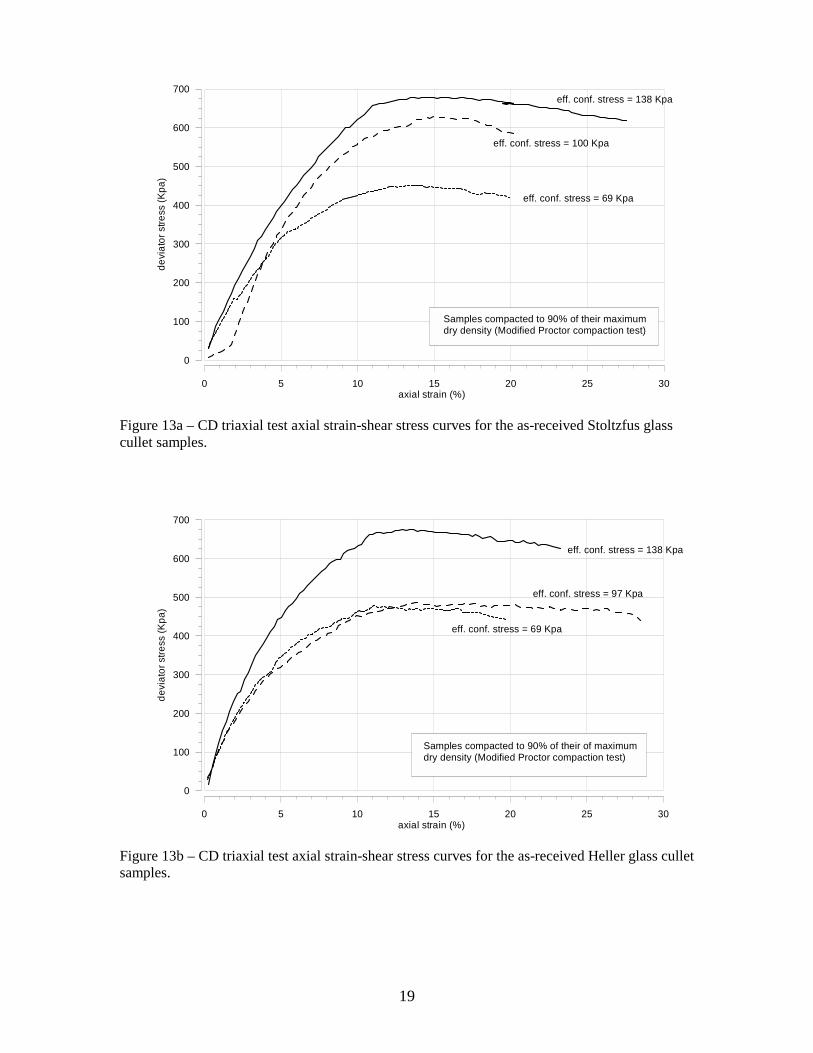
Consolidated, Drained Triaxial Strength Tests The friction angle of the as-received and coarse fraction samples was also assessed under consolidated, drained (CD) conditions in a triaxial cell. Each sample was compacted in a cylindrical spilt mold to 90% (+/- 1%) of its maximum dry density based on the Modified Proctor compaction test. The specimens were placed in four to five lifts and compacted with a rubber-tipped pestle. The tests were performed under three confining stresses commensurate with shallow to moderate (10 to 25 feet) overburden conditions. The tests were performed at an axial load rate of 1.25 mm/min, yielding a typical time to failure (i.e., peak deviator stress) of about 10 to 15 minutes. The specimens were monitored with a pressure transducer to ensure that pore water pressures were not generated during shearing. Figure 12 presents a photograph of a CD test specimen, showing the characteristic bulging of the failed sample. The axial strain-shear stress curves are shown in Figure 13 and 14 for the as-received and coarse fraction samples, respectively. The trends suggest strain hardening during triaxial compression. It is noted that upon placement of the triaxial cell confining stress, a brief, but clearly audible “crunching” sound was emitted from the cell. These acoustic emissions were more pronounced for the coarse fraction samples. It is believed that this phenomenon was related to the rearrangement of the “card house” structure into a denser configuration, as previously discussed. Figure 15 is a “p-q” diagram plot of the peak stress (“q”) and corresponding average normal stress (“p”) at 10% axial strain. Because of the strain hardening nature of the glass cullet, the deviatoric stresses were developed assuming failure corresponded to 10% axial strain. Table 7 presents a summary of the friction angles based on a linear regression (assuming zero cohesion) of the individual specimen data shown in Figure 15. The linear regressions were based on three normal stress-shear stress points for each sample. The coefficients of variation values (R2) were greater than 0.95, indicating that the regression lines fit the data well. The data in Table 7 again suggests that the friction angle decreases slightly for the coarser grained specimens. In contrast to the direct shear test, the shear failure plane(s) of a test specimen are not predetermined in a triaxial test. As a result, the friction angles measured in a triaxial test are typically 10% to 20% lower than those measured in the direct shear test. This observation is supported by the results of this research, which indicate that the friction angles measured in the triaxial shear test are slightly lower than those of the direct shear test. As the triaxial test conditions best replicate most field situations, the friction angles measured using this technique are typically adopted for design. A conservative interpretation of the data presented in Figure 15 yields an internal friction angle (φ) of 44º, which again exceeds typical values of natural aggregate under similar levels of compaction.
8
Table 7 – Summary of shear test results
Source As-Received Coarse Fraction
Stoltzfus
47º
45º
Heller
46º
44º
Note: internal friction angles determined assuming zero cohesion
TCLP and SPLP Environmental Tests Toxicity Characteristic Leaching Procedure (TCLP) and Synthetic Precipitation Leaching Procedure (SPLP) environmental tests for metals were performed on the as-received glass cullet samples from each supplier (Appendix B). The tests were performed at Lancaster Laboratories, Lancaster, Pennsylvania. These tests were performed to assess the potential for the glass cullet to leach heavy metals. The TCLP test, which involves a relatively aggressive leaching procedure, detected trace amounts of lead and barium in the Heller and Stoltzfus samples, respectively. Both metals were detected at concentrations well below primary drinking water standards of 10-3 mg/l. These test results suggest that the Heller material may have contained fragments of ceramic materials or crystal. It is not clear why the Stoltzfus glass cullet sample contained barium. The SPLP test, which simulates precipitation-induced leaching in soil, did not produce measurable concentrations of any metals. 3.0 Conclusions Glass cullet is a readily available, environmentally clean, relatively low cost material whose engineering performance properties generally equal or exceed those of most natural aggregates. This study indicates that glass cullet has excellent strength and workability characteristics. Its hydraulic conductivity equals that of a similarly graded natural aggregate. The durability and abrasion resistance of glass cullet are somewhat less that of a natural aggregate, but within an acceptable range for earthwork and roadway construction use. This study suggests that glass cullet may be used in a number of civil, construction and geotechnical engineering applications, including compacted fill, trench backfill, retaining wall or MSE wall backfill, and roadway subbase among others. Specific conclusions are highlighted below.
• Availability – Glass cullet is readily available at relatively low cost in Pennsylvania. Large stockpiles of processed glass cullet are currently available at local facilities throughout the commonwealth.
• Geotechnical Properties – The glass cullet considered in this study classified as a well
graded sand with gravel (USCS group symbol: SW). The internal friction angles vary depending on test conditions and material source (from φ = 48º to 61º), but in all cases
9
equaled or exceeded those of natural aggregate. The hydraulic conductivity of the glass cullet varied with its grain size distribution, but was on the order of 10-3 to 10-4 cm/sec, which is typical for a natural aggregate of a similar gradation. The durability and abrasion resistance (L.A Abrasion wear values of 24-25%) of the glass cullet was comparable to that of most natural aggregates.
Both glass cullet suppliers were able to process glass cullet with consistent, reproducible properties. The engineering characteristics of the glass cullet varied slightly between suppliers, although it appears that these variations are more closely related to grain size distribution then parent glass characteristics or processing procedures. This suggests that as long as glass cullet meets AASHTO No.8 or No. 10 classifications, its properties will be comparable to or exceed those of natural aggregate, regardless of processing procedures (i.e., quarry crushing equipment versus recycling equipment screening). This is an important finding because with gradation as the only control variable, it is possible for local municipalities to generate their own glass cullet using relatively low cost processing operations (i.e. sophisticated crushing equipment is not required). This glass cullet could be marketed for use in local applications.
• Environmental Characteristics – Precipitation and groundwater flow will not leach
metals from the glass cullet under typical in situ conditions.
• Safety and Other Considerations – The glass cullet was angular, however, the particles were sufficiently small so as to not pose a handling hazard to the laboratory personnel, who handled the glass with their bare hands. The Heller samples emitted a noticeably “stale” odor, most likely from the residual liquids (soda, beer, wine) and label glue on the glass partials. The Stoltzfus samples emitted no detectable odor.
4.0 References AASHTO (2000) Cited in “Pennsylvania Dept. of Transportation Specifications 408/2000-4,” Pennsylvania Dept. of Transportation, Harrisburg, Pennsylvania. Resistance to abrasion of small size coarse aggregate by use of the Los Angeles machine; C 131 (1989), ASTM, West Conshohocken, Pennsylvania. Standard Test Method for Laboratory Determination of Water (Moisture) Content of Soil and Rock by Mass, D2216-98 (1998), ASTM, West Conshohocken, Pennsylvania. Standard Test Methods for Specific Gravity of Soil Solids by Water Pycnometer, D854-00 (2000), ASTM, West Conshohocken, Pennsylvania. Standard Practice for Dry Preparation of Soil Samples for Particle-Size Analysis and Determination of Soil Constants, Practice D421-85 (1998), ASTM, West Conshohocken, Pennsylvania. Standard Test Method for Particle-Size Analysis of Soils, D422-63 (1998), ASTM, West Conshohocken, Pennsylvania. Standard Test Method for Direct Shear Test of Soils Under Consolidated Drained Conditions, D3080-98, ASTM, West Conshohocken, Pennsylvania.
10
Standard Test Method for Permeability of Granular Soils (Constant Head) D2434-68 (2000), ASTM, West Conshohocken, Pennsylvania. Standard test method for particle size analysis of soils; D422 (1990), ASTM, West Conshohocken, Pennsylvania. Synthetic Precipitation Leaching Procedure (SPLP), Method 1312, Federal Register, March 29, 1991 55 Fed. Reg. 11798, Environmental Protection Agency. Test method for laboratory compaction characteristics of soil using standard effort; D698-91 (1991), ASTM, West Conshohocken, Pennsylvania. Test method for laboratory compaction characteristics of soil using Modified effort; D1557-91 (1991), ASTM, West Conshohocken, Pennsylvania. Toxicity Characteristic Leaching Procedure (TCLP), Method 1311, Federal Register, March 29, 1991 55 Fed. Reg. 11798, Environmental Protection Agency.
11
Figure 1 – Glass stockpile at Stoltzfus facility containing waste glass from local suppliers. Figure 2 – Stockpile at Stoltzfus facility containing processed crushed glass cullet.
12
Figure 3 – Stockpile at Heller facility containing unprocessed glass cullet.
13
Figure 4 – As-received glass cullet sample from Stoltzfus (scale in inches). Figure 5 – As-received glass cullet sample from Heller (scale in inches).

Figure 6 – Grain size distribution for as-received, post-compacted, and coarse glass cullet specimens.
100 10 1 0.1 0.01 0.001Grain Size (mm)
0
20
40
60
80
100Pe
rcen
t Fin
er
Stoltzfus - As-RecievedStoltzfus - Post-CompactedStoltzfus - Coarse FractionHeller - As RecievedHeller - Post-CompactedHeller - Coarse Fraction
gravel sand silt or clay
15
Figure 7 – Moisture-density compaction relationships for as-received glass cullet samples.
Figure 8 – Moisture-density compaction relationships for coarse fraction glass cullet samples.
0 5 10 15 20Water Content (%)
14
15
16
17
18
19
20
21
22
Dry
Den
sity
(kN
/m3 )
Stoltzfus - Modified ProctorStoltzfus - Standard ProctorHeller - Modified ProctorHeller - Standard Proctor
90
100
110
120
130
140
Dry
Den
sity
(lbs
/ft3 )
zero air voids(SG = 2.48)
0 5 10 15 20Water Content (%)
14
15
16
17
18
19
20
21
22
Dry
Den
sity
(kN
/m3 )
Stoltzfus - Modified ProctorStoltzfus - Standard ProctorHeller - Modified ProctorHeller - Standard Proctor
90
100
110
120
130
140
Dry
Den
sity
(lbs
/ft3 )
zero air voids(SG = 2.48)
16
Figure 9a – Direct shear displacement-shear stress diagrams for the as-received Stoltzfus glass cullet samples.
Figure 9b – Direct shear displacement-shear stress diagrams for the coarse fraction Stoltzfus glass cullet samples.
0 0.2 0.4 0.6 0.8 1 1.2 1.4displacement (cm)
020406080
100120140160180200220240260280300320340360380400420440
shea
r stre
ss (K
pa)
norm stress = 191 Kpa
norm stress = 93 Kpa
norm stress = 74 Kpa
norm stress = 39 Kpa
Samples compacted to 90% of their maximum dry density (Modified Proctor compaction test)
0 0.2 0.4 0.6 0.8 1 1.2 1.4displacement (cm)
020406080
100120140160180200220240260280300320340360380400420440
shea
r stre
ss (K
pa)
norm stress = 122 Kpa
norm stress = 79 Kpa
norm stress = 55 Kpa
Samples compacted to 90% of their maximumdry density (Modified Proctor compaction test)
17
Figure 10a – Direct shear displacement-shear stress diagrams for the as-received Heller glass cullet samples.
Figure 10b – Direct shear displacement-shear stress diagrams for the coarse fraction Heller glass cullet samples.
0 0.2 0.4 0.6 0.8 1 1.2 1.4displacement (cm)
020406080
100120140160180200220240260280300320340360380400420440
shea
r stre
ss (K
pa)
norm stress = 295 Kpa
norm stress = 191 Kpa
norm stress = 96 Kpa
norm stress = 39 Kpa
Samples compacted to 90% of their maximum dry density(Modified Proctor compactiontest)
0 0.2 0.4 0.6 0.8 1 1.2 1.4displacement (cm)
020406080
100120140160180200220240260280300320340360380400420440
shea
r stre
ss (K
pa)
norm stress = 122 Kpa
norm stress = 79 Kpa
norm stress = 55 Kpa
Samples compacted to 90% of their maximum dry density (Modified Proctor compaction test)

18
Figure 11 – Shear stress-normal stress data from direct shear tests (data points obtained from Figures 9 and 10). Figure 12 - Photograph of a failed coarse fraction glass cullet triaxial specimen due to compressive loading.
0 50 100 150 200 250 300normal stress (Kpa)
0
50
100
150
200
250
300
350
400
450
shea
r stre
ss (K
pa)
Stoltzfus, as-recievedStoltzfus, coarse fractionHeller, as-recievedHeller, coarse fraction
Data compiled from Figures 9 and 10
19
Figure 13a – CD triaxial test axial strain-shear stress curves for the as-received Stoltzfus glass cullet samples.
Figure 13b – CD triaxial test axial strain-shear stress curves for the as-received Heller glass cullet samples.
0 5 10 15 20 25 30axial strain (%)
0
100
200
300
400
500
600
700
devi
ator
stre
ss (K
pa)
eff. conf. stress = 138 Kpa
eff. conf. stress = 100 Kpa
eff. conf. stress = 69 Kpa
Samples compacted to 90% of their maximumdry density (Modified Proctor compaction test)
0 5 10 15 20 25 30axial strain (%)
0
100
200
300
400
500
600
700
devi
ator
stre
ss (K
pa)
eff. conf. stress = 138 Kpa
eff. conf. stress = 97 Kpa
eff. conf. stress = 69 Kpa
Samples compacted to 90% of their of maximum dry density (Modified Proctor compaction test)

20
Figure 14a – CD triaxial test axial strain-shear stress curves for the coarse fraction Stoltzfus glass cullet samples.
Figure 14b – CD triaxial test axial strain-shear stress curves for the coarse fraction Heller glass cullet samples.
0 5 10 15 20 25 30axial strain (%)
0
100
200
300
400
500
600
700
devi
ator
stre
ss (K
pa)
eff. conf. stress = 138 Kpa
eff. conf. stress = 100 Kpa
eff. conf. stress = 69 Kpa
Samples compacted to 90% of their maximum dry density (Modified Proctor compaction test)
0 5 10 15 20 25 30axial strain (%)
0
100
200
300
400
500
600
700
devi
ator
stre
ss (K
pa)
eff. conf. stress = 138 Kpa
eff. conf. stress = 97 Kpa
eff. conf. stress = 69 Kpa
Samples compacted to 90% of their maximumdry density (Modified Proctor compaction test)

21
Figure 15 – Triaxial summary p-q plot.
0 100 200 300 400 500P (sigma 1+ sigma 3)/2
0
100
200
300
400
Q
(s
igm
a 1-
sig
ma
3)/2
Stoltzfus, as-recievedStoltzfus, coarse fractionHeller, as-recievedHeller, coarse fraction
Data compiled from Figures 13 and 14(shear stresses correspond to 10% axial strain)