REDUNDANCY IN GAUSSIAN RANDOM FIELDS · redundancy in gedundancy in g
Laboratory 6 Metals Tested in Tension
Jeremy Wheeless
Group Members: entire laboratory section
Submittal date: 4/10/2014
Section Information: Thursday, 9:30a-1230p
Laboratory TA: Wenyu Cai
Results and Discussion
Contents Introduction .................................................................................................................................................. 1
Procedures .................................................................................................................................................... 1
Results and Discussion .................................................................................................................................. 2
General Expectations and Information ..................................................................................................... 2
Comparative Analysis of Ultimate Strength .............................................................................................. 4
Comparative Analysis of Young’s Modulus ............................................................................................... 4
Comparative Analysis of 0.2% offset yield strength ................................................................................. 5
Comparative Analysis of Ductility ............................................................................................................. 6
Conclusion ..................................................................................................................................................... 8
References .................................................................................................................................................... 9
Appendix A ............................................................................................................................................ A1-A6
Appendix B ................................................................................................................................................. B-1
Appendix C ................................................................................................................................................. C-1

Introduction & Procedures
1
Introduction Materials science is one of the most important and relevant industries with respect to
engineering and manufacturing of safe and reliable products. Materials scientists test materials to
define desirable and undesirable attributes and provide this information to the engineering community,
which allows for the proper utilization of materials in specific applications. Typically these types of tests
are performed to “demonstrate the conformance of the material to the product specification" that has
been created by an engineer (Ferron-Folliard).
The primary focus of this report is to discuss an experiment that is done on metals that are
placed in tension to the point at which they fail. The three metals to be tested and analyzed, steel,
aluminum, and cast iron, are heavily used in the civil and architectural engineering industries. On the
outset of this experiment, detailed information was provided in supplementary lab documentation
about all three specimen with respect to their chemical compositions. This information allowed for
assumptions to be made about how the metals would be predicted to perform when tested in tension.
However, the information provided in the lab documentation was somewhat incomplete and required
further testing and analysis of data. This report concludes with the results of this testing and provides
for a more thorough understanding of each material that will allow a professional engineer to properly
make use of the specific materials tested in specific applications.
Procedures The execution of the procedures of this experiment were governed by ASTM E8/E8M “Standard
Test Methods for Tension Testing of Metallic Materials” (Ferron-Folliard). Mild steel, aluminum, and
cast iron were the specimens analyzed, and all three were tested using the 810 Material Test System,
which is a product manufactured by MTS Systems Corporation. The testing machine applied tensile
loads up to the point of failure for all specimens. Tests such as these are “ordinarily, the only way to
determine how materials behave when they are subjected to loads" (Gere-Goodno). The test was
computer automated, generating a high level of accuracy in the deployment, and the data was recorded
on 1/2 second intervals using a “computer-controlled data acquisition system” (Ferron-Folliard). During
this test, both an imposed "constant rate of displacement" and "constant loading rate" were
implemented to measure the data that is analyzed herein (Ferron-Folliard). All three specimens had
approximately similar dimensions, which were machined such that failure would occur in a specific
region of the specimen’s volume. By machining the specimens in this way it allowed for the close study
necessary to present findings with the high level of accuracy as those provided in this report.

Results and Discussion
2
Results and Discussion
General Expectations and Information In an effort to reduce redundancy in this report, general properties and expectations of the
material response will be provided here.
All three specimens differ in chemical composition, which greatly effects their response to the
tensile loads that will be applied. Mild steel, and cast iron differ chemically in subtle ways, but the
carbon content is the overwhelming governing factor that allows them to withstand tensile loading.
Aluminum is chemically different than steel and cast iron in many ways. However, “aluminum alloys can
be formulated with strengths similar to steel products” and exhibit many qualities similar to that of steel
when placed under tensile loads. Given the specific chemical compositions, as well as the parameters of
this experiment, it is expected that the steel will always outperform the aluminum and cast iron in terms
of desirable attributes. These attributes include, ductility, modulus of elasticity, yield strength and
ultimate strength, and will be discussed in detail in the body of the report.
Further general expectations were extracted from external resources. The textbook titled
Mechanics of Materials contains information about commonly used engineering materials. Close study
of table H-3 in the textbook shows that a decreasing trend can be observed amongst the materials with
respect to the performance in offset yield stress, ultimate strength, and ductility. From the text it can
be deduced that the order of performance generally exhibited will be steel will as the highest, aluminum
in the middle, and cast iron as the lowest. This table offers very general information, and lacks specifics
about the exact components of the material tested in this experiment and is therefore only used as a
way to check that the testing was properly administered.
For illustrative purposes a stress-strain diagram (figure 1), which models the material response
of all three specimens has been included in this report. A majority of the data presented in this report
came from this figure by empirical methods. The diagram will include labels that illustrate regions in
which values were empirically derived, as well as general regions of the diagram that are discussed. The
diagram is very complex due to constraining all three materials to one plot. This constraint decreases
fineness needed to properly represent the data. Due to this constraint, the diagram will not be
referenced throughout the report but instead acts as an illustrative guide that shows where the values
were found. It is worth noting that when all three material responses are placed on the same diagram it
gives the observer a broad sense of how the materials differ, it however lacks detail that is needed to
accurately determine the values provided in this report. Therefore, separate diagrams are also provided
for each material, which will be referenced and can be found in the Appendix A: Engineering
Calculations & Models.
For all of the calculations and measurements provided in the following discussion, a calibrated
measuring device was used for each procedure, and the figures conveyed herein reflect the significant
figures provided by each measuring device.

Results and Discussion
3
Figure 1: graphical modeling of stress and strain of the steel, aluminum, and cast iron specimens tested. This diagram displays the ultimate strengths of all three specimens, which are designated by a large X. The diagram also shows the elongation of each specimen.

Results and Discussion
4
Comparative Analysis of Ultimate Strength A clear definition of stress, and ultimate strength helps in understanding the information provided in the following analysis. A stress is an internal force that acts on the molecular level which holds the material together. Stress is a measure of a force that acts over a given area of material. The ultimate strength, or often called ultimate stress, of a material is related to the maximum amount of load that can be imposed upon a given area of the material. With any material, after the ultimate stresses have been achieved through loading, the material will deform without any further increase of the load. In engineering practice, knowing the ultimate stress values associated with a given material allows for safe, appropriate, and affordable designs to meet specific applications of use. Some expectations with respect to the ultimate strength can be provided. It is common
knowledge in civil engineering practice that cast iron is" weak and brittle in tension, but strong and less
brittle in compression" (Ferron-Folliard). Therefore it is expected that cast iron will underperform when
compared to steel. From Table 1 in Lab 6 – Material Response to Tensile Loading, we can expect to
observe the aluminum to have a minimum ultimate strength of 62 ksi.
Table 1: Provided in this table are the tensile strengths of steel, aluminum, and cast iron. These values were determined empirically by carefully analyzing the data generated by the computer controlled acquisition system employed during the experiment.
Steel Aluminum Cast Iron
Ultimate Tensile Strength (ksi) 73.65 68.082 39.5
The values of this table conform to the expectations previously listed. The ultimate stress of steel is greater than aluminum, which is greater than that of cast iron. The value determined for the aluminum shows that this specimen performed higher than the minimum value provided in the laboratory documentation. These results show that the test was performed correctly, and also offer information about these materials that would allow for proper implementation in an engineering application. Values reported in Table 3 were empirically determined from Figures A.1, A.2, and A.3 in Appendix A: Engineering Calculations & Models.
Comparative Analysis of Young’s Modulus When a force is applied to an object, the object physically responds. The response may be
bending, buckling, stretching, or all of the above. In engineering practice the response is typically not
something that should be observable in an engineered product, like a beam or column in a building.
Most materials used in civil engineering practice are typically elastic up to a point, which means that if
deformations occur, due to loading, the materials bounce back after the load is removed. When a
material is loaded with tensile forces the material stretches. When the load is removed and was low in
magnitude (i.e., below the proportional limit), the material returns to its original shape. Materials
scientists have found that most materials respond proportionally to imposed loads. Which essentially
means, if you apply more load you get more response. "For most metals, when a uniaxial load is
applied, the metal deforms immediately and the stress [or internal forces] is proportional to the strain
Results and Discussion
5
up to a certain load level" (Ferron-Folliard). This proportionality is quantified by what is called modulus
of elasticity, which is often referred to as “Young's Modulus, after… [an] English scientist, Thomas Young
(1773-1829), in connection with an investigation [he performed] of tension and compression of
prismatic bars” (Gere-Goodno).
Some expectations can be presented with respect to the comparison of Young’s modulus
amongst the specimens tested in this experiment. Due to a higher carbon content, "cast iron is
significantly weaker and much less ductile compared to mild steel when tested in tension" which leads
one to expect that the Young’s modulus of the cast iron specimen will be lower than that of the mild
steel (Mamlouk-Zaniewski). It is common knowledge in the civil engineering industry that “aluminum
alloys can be formulated with strengths similar to steel products, [however] the modulus of elasticity of
aluminum is only about one-third that of steel” (Mamlouk-Zaniewski). This knowledge allows one to
surmise that steel will outperform both the aluminum and cast iron, with respect to their Moduli of
elasticity, but do not imply any relevant information about the differences that will be noticed between
the cast iron and aluminum. The testing methods used will allow for further discussion in this regard
and no assumptions can be made without purely speculating, or retrieving information from the
manufacturer of these specific specimens, which at this time is unavailable.
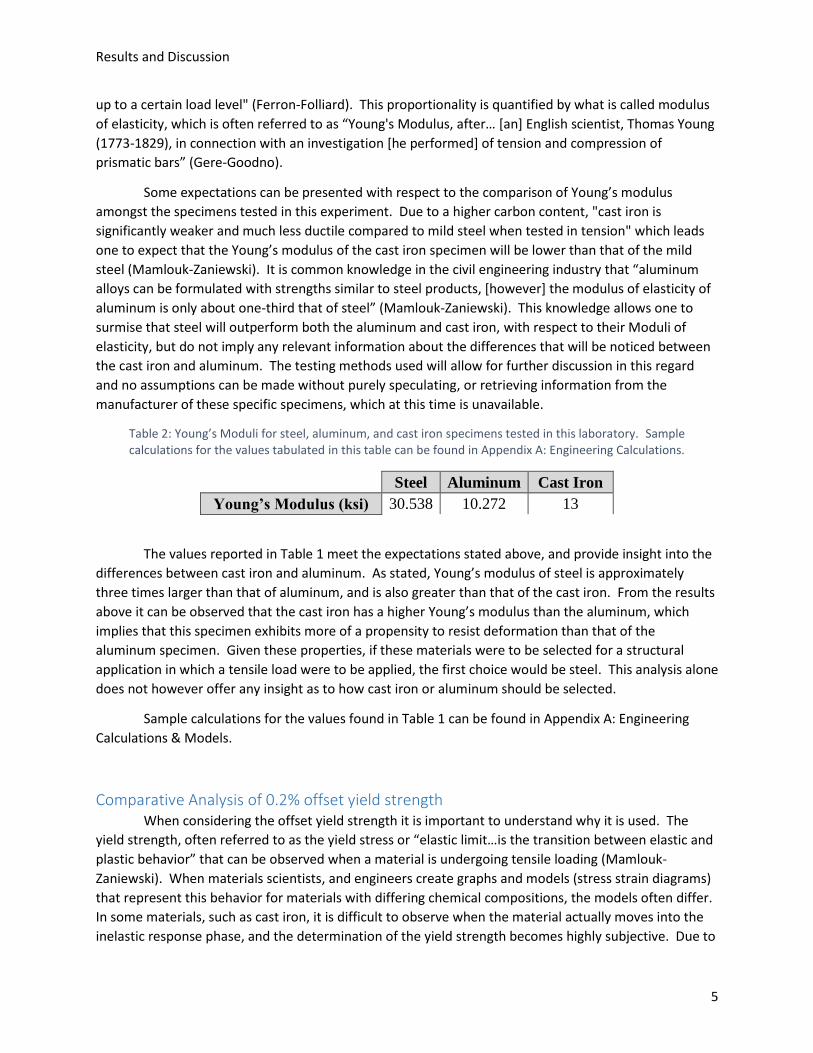
Table 2: Young’s Moduli for steel, aluminum, and cast iron specimens tested in this laboratory. Sample calculations for the values tabulated in this table can be found in Appendix A: Engineering Calculations.
Steel Aluminum Cast Iron
Young’s Modulus (ksi) 30.538 10.272 13
The values reported in Table 1 meet the expectations stated above, and provide insight into the
differences between cast iron and aluminum. As stated, Young’s modulus of steel is approximately
three times larger than that of aluminum, and is also greater than that of the cast iron. From the results
above it can be observed that the cast iron has a higher Young’s modulus than the aluminum, which
implies that this specimen exhibits more of a propensity to resist deformation than that of the
aluminum specimen. Given these properties, if these materials were to be selected for a structural
application in which a tensile load were to be applied, the first choice would be steel. This analysis alone
does not however offer any insight as to how cast iron or aluminum should be selected.
Sample calculations for the values found in Table 1 can be found in Appendix A: Engineering
Calculations & Models.
Comparative Analysis of 0.2% offset yield strength When considering the offset yield strength it is important to understand why it is used. The
yield strength, often referred to as the yield stress or “elastic limit…is the transition between elastic and
plastic behavior” that can be observed when a material is undergoing tensile loading (Mamlouk-
Zaniewski). When materials scientists, and engineers create graphs and models (stress strain diagrams)
that represent this behavior for materials with differing chemical compositions, the models often differ.
In some materials, such as cast iron, it is difficult to observe when the material actually moves into the
inelastic response phase, and the determination of the yield strength becomes highly subjective. Due to
Results and Discussion
6
the error that is involved with this subjectivity, the materials testing industry as a whole, has
created a standardized method by which “an arbitrary yield stress may be determined by the offset
method,” in which “a straight line is drawn on the stress-strain diagram parallel to the initial linear part
of the curve [i.e., Young’s modulus] but offset by some standard strain such as 0.002” (Gere-Goodno).
The intersection of the offset line and the stress-strain curve defines the offset yield strength, affectively
reduces ambiguity in modeling material response, and unifies the material testing industry. The .2%
offset yield cannot be observed in Figure 1, because the resolution of this figure is too course to display
an appropriate representation.
Table 1 in Lab 6 – Material Response to Tensile Loading, provides detailed information about the
chemical composition of the aluminum specimen tested in this experiment and allows for a more exact
expectation, which is that the minimum yield strength of the aluminum will be 45 ksi (Ferron-Folliard).
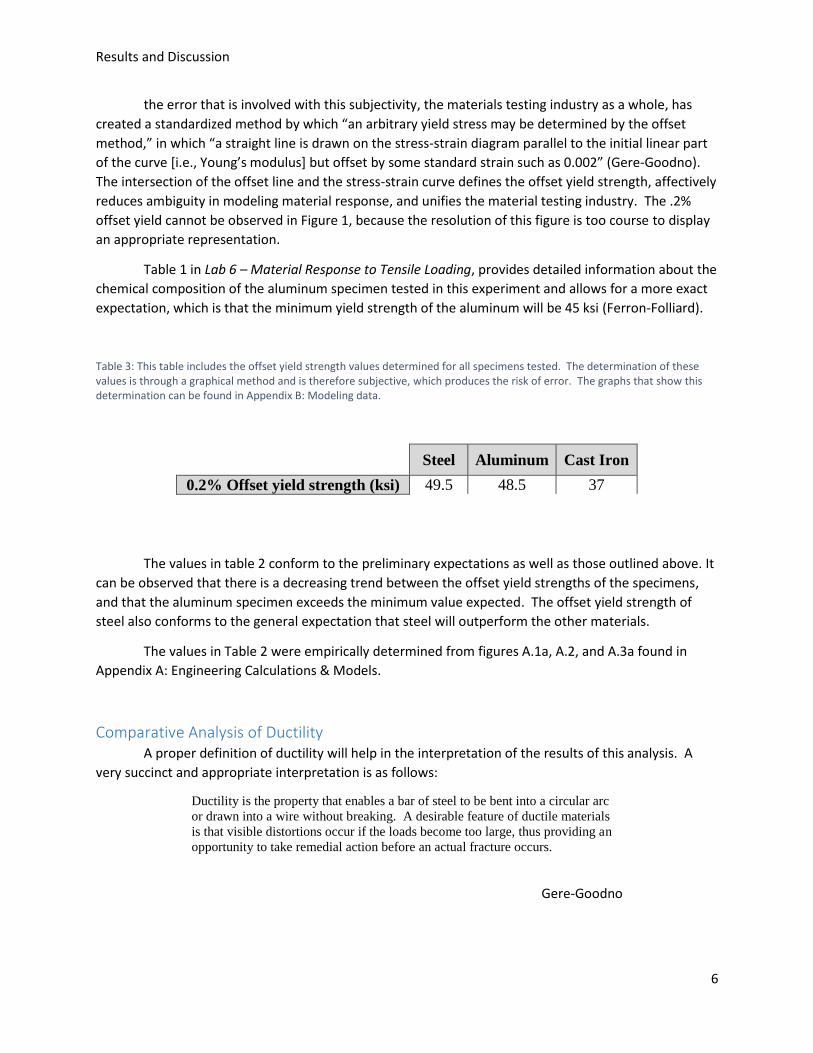
Table 3: This table includes the offset yield strength values determined for all specimens tested. The determination of these values is through a graphical method and is therefore subjective, which produces the risk of error. The graphs that show this determination can be found in Appendix B: Modeling data.
Steel Aluminum Cast Iron
0.2% Offset yield strength (ksi) 49.5 48.5 37
The values in table 2 conform to the preliminary expectations as well as those outlined above. It
can be observed that there is a decreasing trend between the offset yield strengths of the specimens,
and that the aluminum specimen exceeds the minimum value expected. The offset yield strength of
steel also conforms to the general expectation that steel will outperform the other materials.
The values in Table 2 were empirically determined from figures A.1a, A.2, and A.3a found in
Appendix A: Engineering Calculations & Models.
Comparative Analysis of Ductility A proper definition of ductility will help in the interpretation of the results of this analysis. A
very succinct and appropriate interpretation is as follows:
Ductility is the property that enables a bar of steel to be bent into a circular arc
or drawn into a wire without breaking. A desirable feature of ductile materials
is that visible distortions occur if the loads become too large, thus providing an
opportunity to take remedial action before an actual fracture occurs.
Gere-Goodno
Results and Discussion
7
Ductility is a characterization that allows for a comparison amongst engineering materials. This
comparison may be established by measuring how much elongation, and reduction in cross sectional
area which has occurred in a specimen when it has fractured due to tensile loading.
Some expectations may be presented with respect to the ductility of the materials tested in this
experiment. It is common knowledge that “high strength, ductility, [and] the ability to carry tensile
loads … are the primary positive attributes of steel as a structural material” (Mamlouk-Zaniewski). From
table 1 provided in Lab 6 – Material Response to Tensile Loading it can be expected that approximately
10% elongation will be observed from the aluminum specimen (Ferron-Folliard). It is also expect that
due to a higher carbon content, "cast iron is significantly weaker and much less ductile compared to mild
steel when tested in tension" (Mamlouk-Zaniewski). Given these expectations it is assumed that the
materials will conform to the general expectations laid out previously.
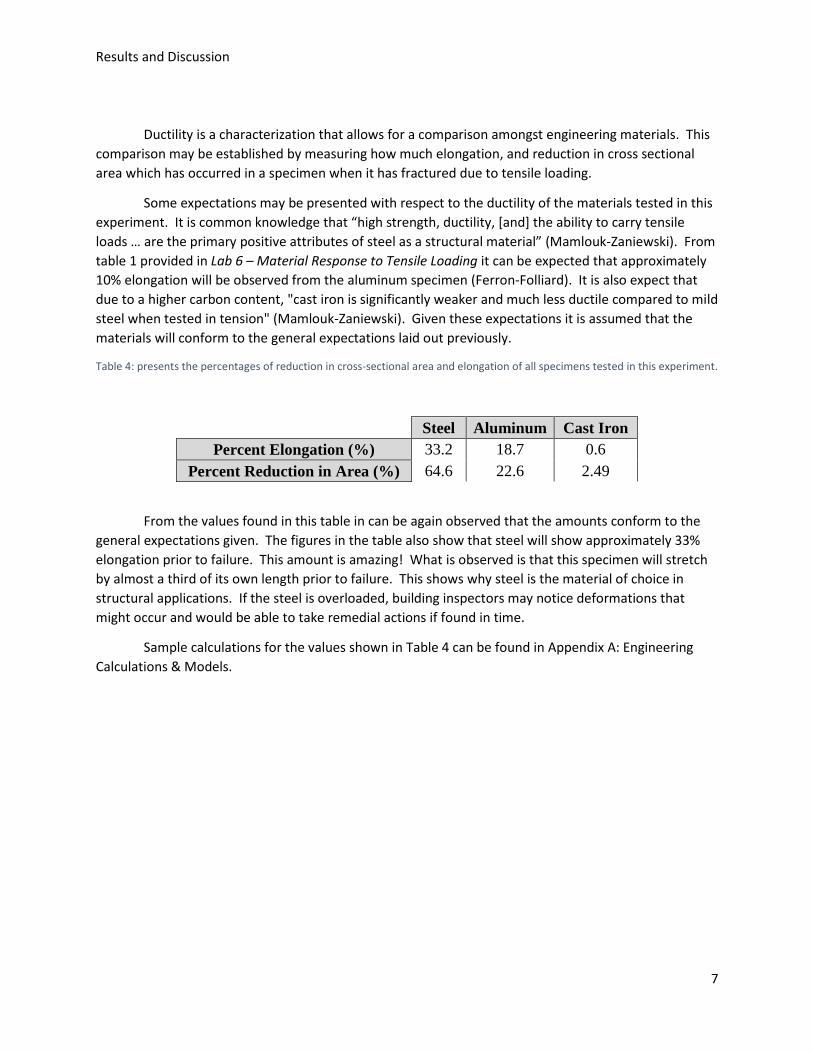
Table 4: presents the percentages of reduction in cross-sectional area and elongation of all specimens tested in this experiment.
Steel Aluminum Cast Iron
Percent Elongation (%) 33.2 18.7 0.6
Percent Reduction in Area (%) 64.6 22.6 2.49
From the values found in this table in can be again observed that the amounts conform to the
general expectations given. The figures in the table also show that steel will show approximately 33%
elongation prior to failure. This amount is amazing! What is observed is that this specimen will stretch
by almost a third of its own length prior to failure. This shows why steel is the material of choice in
structural applications. If the steel is overloaded, building inspectors may notice deformations that
might occur and would be able to take remedial actions if found in time.
Sample calculations for the values shown in Table 4 can be found in Appendix A: Engineering
Calculations & Models.

Conclusion
8
Conclusion This experiment has given many insights into the typical behavior of metals loaded in tension. It
has shown that iron rich metals such as cast iron and mild steel can have varying attributes that depend
upon their chemical composition. The results and discussion of Young’s modulus, ductility, and ultimate
strength show that the experiment, calculations, and measurements employed therein, all yielded
outcomes that show that steel performs better than both aluminum and cast iron in terms of desirable
attributes for engineering applications. These results also help to explain why steel is one of the most
commonly used civil engineering materials used in tensile loading applications. The discussion of offset
yield strengths shed light on a common engineering practice that unifies the material science field of
study, by reducing ambiguity in a commonly needed and used value. The offset yield discussion also
helped to further prove that steel is more desirable for tensile applications than cast iron or aluminum.
With the results from the tests performed on the cast iron and steel, and the analysis performed in this
document a more complete, and robust list of properties is now available that can now accompany the
detailed information previously provided for the aluminum specimen. Given this detailed information,
the specific materials tested in this experiment can now be used in specific applications, with a higher
level of confidence in their performance. Higher levels of confidence correlate to safer products, and
peace of mind.

References
R-1
References Ferron-Folliard. Laboratory 6, Tensile Testing of Aluminum, Mild Steel, and Cast Iron. Austin: Department
of Civil, Architectural and Environmental Engineering, University of Texas at Austin, 2014. print.
Gere-Goodno. Mechanics of Materials. Toronto: Cengage, 2009. Book.
Mamlouk-Zaniewski. Materials for Civil and Construction Engineers. New Dehli: Pearson, 2011.

Appendix A: Engineering Calculations & Models
A-1

Appendix A: Engineering Calculations & Models
A-2

Appendix A: Engineering Calculations & Models
A-3
Appendix A
Figure A.1: Stress-Strain diagram illustrating the entire material response to loading. This figure demonstrates the ductility and ultimate stress level of the steel specimen tested in the experiment.

Appendix A: Engineering Calculations & Models
A-4
Figure A.1a: Stress-Strain diagram illustrating the entire material response to loading. This figure demonstrates the .2% offset yield strength of the steel specimen tested in this laboratory. Other labels on this graph are for reference only.

Appendix A: Engineering Calculations & Models
A-5
Figure A.2: Stress-Strain diagram illustrating the entire material response to loading. This figure demonstrates the ductility, ultimate stress level, and .2% offset of the cast iron specimen tested in the experiment.

Appendix A: Engineering Calculations & Models
A-6
Figure A.3: Stress-Strain diagram illustrating the entire material response to loading. This figure demonstrates the ductility, and ultimate stress level of the aluminum specimen tested in the experiment.
Figure A.3a: Stress-Strain diagram illustrating the entire material response to loading. This figure demonstrates the ductility, and ultimate stress level of the aluminum specimen tested in the experiment.

Appendix B: Measured Data
B-1
Appendix B
Steel Specimen Data
Before Testing
Diameter1 (in) Diameter2 (in) Diameter3(in) Average (in) Average Area (in.²)
0.494 0.501 0.498 0.498 0.195
After Testing
Diameter1 (in) Diameter2 (in) Average (in) Average Area (in.²)
0.304 0.288 0.296 0.069
Maximum Load (kips)
14.33
Aluminum Data
Before Testing
Diameter1 (in) Diameter2 (in) Diameter3(in) Average (in) Average Area (in.²)
0.501 0.501 0.508 0.503 0.199
After Testing
Diameter1 (in) Diameter2 (in) Average (in) Average Area (in.²)
0.436 0.45 0.443 0.154
Maximum Load (kips)
13.55
Cast Iron Data
Before Testing
Diameter1 (in) Diameter2 (in) Diameter3(in) Average (in) Average Area (in.²)
0.506 0.507 0.505 0.506 0.201090204
After Testing
Diameter1 (in) Diameter2 (in) Average (in) Average Area (in.²)
0.495 0.504 0.500 0.196
Maximum Load (kips)
7.94

Appendix C: Notations
C-1
Appendix C
Stress: 𝜎 = 𝐹𝐴𝑖
⁄
Stress: 𝜎
Force: 𝐹
Initial cross-sectional area: 𝐴𝑖
Strain: 𝜀 = 𝜎𝐸⁄
Strain: 𝜀
Young’s Modulus: 𝐸
Instantaneous cross-sectional area: 𝐴∆
Percent Elongation: %𝐸
Length at fracture: 𝐿𝑓
Original length: 𝐿0
Percent area reduction: %𝑅𝐴
Original area: 𝐴0
Area at fracture: 𝐴𝑓
Young’s Modulus: 𝐸 = 𝜎𝜀⁄
True Stress: 𝜎𝑇 = 𝐹𝐴∆
⁄
%𝐸 = 𝐿𝑓−𝐿0
𝐿0∗ 100
%𝑅𝐴 = 𝐴0−𝐴𝑓
𝐴0∗ 100