Laboratories for Research on Freight Systems and Planning
25
Chapter 12 Laboratories for Research on Freight Systems and Planning André Romano Alho, Takanori Sakai, Fang Zhao, Linlin You, Peiyu Jing, Lynette Cheah, Christopher Zegras, and Moshe Ben-Akiva Abstract Advancements in information and communication technologies (ICT) and the advent of novel mobility solutions have brought about drastic changes in the urban mobility environment. Pervasive ICT devices acquire new sources of data that can inform detailed transportation simulation models, and are useful in analyzing new policies and technologies. In this context, we developed software laboratories that leverage the latest technological developments and enhance freight research. Future mobility sensing (FMS) is a data-collection platform that integrates tracking devices and mobile apps, a backend with machine-learning technologies and user interfaces to deliver highly accurate and detailed mobility data. The second platform, SimMo- bility, is an open-source, agent-based urban simulation platform which replicates urban passenger and goods movements in a fully disaggregated manner. The two A. R. Alho (B ) · T. Sakai · F. Zhao Future Urban Mobility Interdisciplinary Research Group, Singapore-MIT Alliance for Research and Technology, Queenstown, Singapore e-mail: [email protected] L. You School of Intelligent Systems Engineering, Sun Yat-sen University, Guangzhou, China e-mail: [email protected] P. Jing Intelligent Transportation Systems Lab, Massachusetts Institute of Technology, Cambridge, USA e-mail: [email protected] L. Cheah Department of Engineering Systems and Design, Singapore University of Technology and Design, Tampines, Singapore e-mail: [email protected] C. Zegras Department of Urban Studies and Planning, Massachusetts Institute of Technology, Cambridge, USA e-mail: [email protected] M. Ben-Akiva Department of Civil and Environmental Engineering, Massachusetts Institute of Technology, Cambridge, USA e-mail: [email protected] © The Author(s) 2021 W. Shi et al. (eds.), Urban Informatics, The Urban Book Series, https://doi.org/10.1007/978-981-15-8983-6_12 171
Transcript of Laboratories for Research on Freight Systems and Planning
Chapter 12Laboratories for Research on FreightSystems and Planning
André Romano Alho, Takanori Sakai, Fang Zhao, Linlin You, Peiyu Jing,Lynette Cheah, Christopher Zegras, and Moshe Ben-Akiva
Abstract Advancements in information and communication technologies (ICT) andthe advent of novelmobility solutions have brought about drastic changes in the urbanmobility environment. Pervasive ICT devices acquire new sources of data that caninform detailed transportation simulation models, and are useful in analyzing newpolicies and technologies. In this context, we developed software laboratories thatleverage the latest technological developments and enhance freight research. Futuremobility sensing (FMS) is a data-collection platform that integrates tracking devicesand mobile apps, a backend with machine-learning technologies and user interfacesto deliver highly accurate and detailed mobility data. The second platform, SimMo-bility, is an open-source, agent-based urban simulation platform which replicatesurban passenger and goods movements in a fully disaggregated manner. The two
A. R. Alho (B) · T. Sakai · F. ZhaoFuture Urban Mobility Interdisciplinary Research Group, Singapore-MIT Alliance for Researchand Technology, Queenstown, Singaporee-mail: [email protected]
L. YouSchool of Intelligent Systems Engineering, Sun Yat-sen University, Guangzhou, Chinae-mail: [email protected]
P. JingIntelligent Transportation Systems Lab, Massachusetts Institute of Technology, Cambridge, USAe-mail: [email protected]
L. CheahDepartment of Engineering Systems and Design, Singapore University of Technology and Design,Tampines, Singaporee-mail: [email protected]
C. ZegrasDepartment of Urban Studies and Planning, Massachusetts Institute of Technology, Cambridge,USAe-mail: [email protected]
M. Ben-AkivaDepartment of Civil and Environmental Engineering, Massachusetts Institute of Technology,Cambridge, USAe-mail: [email protected]
© The Author(s) 2021W. Shi et al. (eds.), Urban Informatics, The Urban Book Series,https://doi.org/10.1007/978-981-15-8983-6_12
171

172 A. R. Alho et al.
platforms have been used jointly to advance the state of the art in behavioralmodelingfor passenger and goods movements. In this chapter, we review recent developmentsin freight-transportation data-collection techniques, including contributions to trans-portation modeling, and state-of-the-art transportation models. We then introduceFMS and SimMobility and demonstrate a coordinated application using three exam-ples. Lastly,wehighlight potential innovations and future challenges in these researchdomains.
12.1 Introduction
The urban mobility system, including passenger and goods movements, is becomingmore complex. Demand for mobility is growing and, at the same time, the roles tobe played, modes available, and system-wide synergies are becoming more diverse.These changes have been stimulated by the evolution of information and communi-cation technologies (ICT). For example, crowdsourcing initiatives allow individualsto become temporary freight carriers. These and other changes show a clear needfor simulation tools that allow researchers, industry practitioners, and urban plan-ners to better grasp the potential impacts of technologies and policies in the urbanmobility system. Despite their predominantly passenger-centric development, state-of-the-art behavioral simulation models are now capable of replicating business-to-business transactions between agents that can play multiple roles (shipper, carrier,and receiver) in a disaggregate manner. The next generation of models is expectedto extend its capabilities to cover business-to-consumer and consumer-to-consumerflows,which are becomingmore important as e-commerce plays a larger role in urbangoods movements. Moreover, as the boundaries between passenger and goods move-ments become dimmer, new challenges to the development of integrated models willarise. The increasing ability to comprehensively represent relevant agents’ decisionsand behaviors is associated with a need for fine-resolution data. Still, data collectionfor freight remains a challenge, plagued by low participation rates for surveys andhard-to-reach key respondents. Innovations in the methods for collecting freight-transportation data are sought, leading to expectations of relying on sensing tech-nologies and Big Data sources to overcome the data limitations. At this point in time,these new sources of data are minimally incorporated into transportation models fortesting a wide range of policies and technologies.
This chapter consists of four sections, presenting (1) future mobility sensing(FMS), a freight data-collection platform, (2) SimMobility, an urban land-useand transport-simulation platform, and (3) examples of their coordinated use tomove forward the current domain knowledge. The first two sections start withself-contained literature reviews on relevant research, including basic techniques,methods and applications. They are followed by a detailed account of the laborato-ries, FMS and SimMobility, as well as past and current applications. In Sect. 12.4, weprovide examples of the coordinated use of the laboratories, and finally, we concludewith a summary and future research directions in Sect. 12.5.

12 Laboratories for Research on Freight Systems and Planning 173
12.2 Future Mobility Sensing, a Behavioral Laboratory
12.2.1 Background
The practice of transportation modeling and planning relies on a variety of data forboth passenger and goods movements. Particularly for freight-transportation, high-quality data is required for the development of simulation models for commodityflows and freight-vehicle operations. Data-collection efforts in the urban freightdomain need to deal with a variety of agents (e.g., companies, establishments, andvehicle drivers) in terms of decision-making mechanisms and behaviors. The hetero-geneity of agents and agent types makes it challenging, compared to passengermovements, to collect a comprehensive dataset that portrays their joint decisions.As a result, multiple data-collection approaches are used which, in broad terms, canbe categorized into four main groups.
12.2.1.1 Static and Count Data
These are data collected through fixed location sensors such as inductive loop detec-tors, automatic vehicle classifier systems,weight-in-motion (WIM) systems, or videosystems. Although road-based sensors, such as inductive loop detectors, are inher-ently limited to capture fine-resolution freight counts, Tok (2008) developed a high-fidelity inductive loop sensor to achieve commercial vehicle classification based onthe inductive signatures of vehicle types, demonstrating their potential to provideinformation-rich commercial vehicle traffic-count data.
The installation of video cameras made traffic counts easier than in the past,particularly for congested settings or when attempting to disaggregate the data byvehicle types. Zhang et al. (2007) detailed a video-based vehicle detection and clas-sification (VVDC) system for collecting vehicle count and classification data usinguncalibrated video images. The proposed approach was demonstrated with highaccuracy, although there are a series of enhancements suggested to deal with longi-tudinal vehicle occlusions, severe camera vibrations, and headlight reflection prob-lems. Mammes and Klatsky (2017) presented a video-based system to assess freightloading-bay demand and availability. Sun et al. (2017) have used video camerasfor monitoring local freight traffic movements with fine resolution by developingcomputer-vision algorithms.
12.2.1.2 Dynamic and Mobile Data
These are data collected through sensors that move with vehicles, using devices suchas GNSS, on-board diagnostics (OBD), or similar telematics. GPS data are oftencollected by companies for monitoring their vehicles. One of the most widely knowntruck GPS datasets is published by the American Transportation Research Institute
174 A. R. Alho et al.
(ATRI). This dataset considerably contributes to freight research in the USA and hasbeen used for multiple purposes, including the development of truck route-choicedata (Kamali 2015) and the generation of statewide freight-truck flows (Zanjani2014). It is often fused with other datasets because, despite its large size, it lacksdetails on commodities carried or trip purposes (Eluru et al. 2018). An alternativeto data fusion is to complement GPS tracking with surveys, which will be discussedlater in this chapter.
12.2.1.3 Survey Data
Data can also be collected through surveys that target drivers, fleetmanagers, orware-house employees, among others. There are various designs of freight surveys. Freightsurvey design and its applications are summarized by Allen et al. (2012), coveringestablishment surveys, vehicle observation surveys, parking surveys, driver surveys,commodity-flow surveys, roadside-interview surveys, and other surveys. Cheah et al.(2017) provided a literature review focused on commodity and establishment-basedfreight surveys.
12.2.1.4 Indirect Data
This refers to data from sources that are not designed to inform freight models orderive freight-related insights, but could be used for such purposes. Some sources ofBig Data would fit this category.
A challenge for freight-transportation data collection is that a single method onlyallows for a partial view of the urban freight distribution system, as indicated byHolguín-Veras and Jaller (2013). The same authors also detailed the strengths andweaknesses of several of the data-collection methods. Some of the above-mentionedsurveys have leveraged novel technologies, although not to a great extent. Despite agreater number of freight data-collection efforts taking place, several surveys are stillpaper-based, although Web-based surveys reduce the burden of data entry and asso-ciated errors and are becoming more common (e.g., the Lisbon Establishment-basedFreight survey described by Alho and de Abreu e Silva 2015). A major challengelies in the fact that user-reported data are prone to inaccuracies as respondents oftenneed to recall past activities. Furthermore, the aforementioned high-resolution dataneeded for modeling and simulation purposes can easily lead to extensive surveyswhich respondents might not be willing to fill in. Jeong et al. (2016) highlightedthe challenges of ensuring sufficient participation to achieve a meaningful samplesize, based on the experience of pairing a Web-based fleet manager survey and asmartphone app-based driver survey to pilot a preliminary design for the CaliforniaVehicle Inventory and Use Survey (CAL-VIUS).
In summary, we found three main research thrusts in freight data collection thatcall for greater attention. First, the innovative use of technology, including sensingtechnologies, as a means to reduce user burden requires further advances. Second, as

12 Laboratories for Research on Freight Systems and Planning 175
it is challenging to recruit participants for freight surveys, there is a need to designincentivemethods that can effectively increase response rate and encourage long-termparticipation. Some of these efforts have been piloted in household travel surveys(Nahmias-Biran et al. 2018) and are related to informational incentives, which cancomplement or be alternatives to monetary incentives. Third, new and alternativedata sources have to be explored. Ludlow and Sakhrani (2017), present a report(NCFRP 49—NewSource of Freight Data for Urban andMetropolitanMobility) thatfocuses on new data sources to address urban and metropolitan freight challenges.The highlighted novel and potentially useful data sources include crowdsourceddata, road and vehicle sensors (Bluetooth, RFID, connected vehicles), vehicle datastreams, or image data (such as satellite-based). The FMS platform aims to addressthese three research areas and is a flexible and comprehensive behavioral laboratoryfor freight data collection.
12.2.2 FMS Architecture
Future mobility sensing (FMS) is a data-collection and visualization platform thatleverages mobile sensing technology, machine-learning algorithms, and user verifi-cation to provide details of mobility behavior of passengers or freight. It was firstdeveloped as a smartphone-based automated household travel survey system. In asecond iteration, it was extended to support commodity-flow surveys and track freightand commercial vehicles (FMS-Freight). FMS-Freight collects and processes surveydata frombusiness establishments related to the role(s) they play in goodsmovements(shipping, receiving, and transporting), associated shipments, and vehicle operations,and it also collects trip information from the drivers. FMSconsists of the three distinctbut interconnected components illustrated in Fig. 12.1:
• A mobile app and tracking devices that leverage various sensing technologies;
Fig. 12.1 Future mobility sensing (FMS) platform architecture
176 A. R. Alho et al.
• A backend consisting of a server system with (a) a database and (b) customalgorithms to infer stops, trip purposes, and other trip details, to reduce userburden; and
• User interfaces, both mobile and Web-based, used for verification of activitiesby respondents and displaying summarized information (e.g., a dashboard asdescribed by You et al. 2018).
WhenFMS is used to support freight data collection, the details of each componentare as follows.
12.2.2.1 Mobile App/Tracking Devices
FMS-Freight supports the collection of rawdata fromvariousmobile sensing devices,such as tablets, GPS loggers, and OBD devices. GPS loggers and OBD devices areprimary tools to collect data. Data are gathered from several sensors and uploadedto the backend for analysis. These devices can be easily installed and attached,respectively, to vehicles and shipments, and can collect location information withhigh accuracy. In the case of collecting vehicle trajectory data, the use of the vehiclebattery to power the device allows for uninterrupted multi-day data collection.
12.2.2.2 Backend
Backend machine-learning algorithms process collected raw data together with theuser-verified timeline (i.e., records of activities, verified through user interfacesdetailed below) and contextual information (e.g., POI data) to infer stops and stopactivities (Zhao et al. 2015). For shipment tracking, travel modes are also detected,which can be used to further reduce the user’s verification burden. Verified dataare fused and post-processed to support the identification of vehicle and shipmentpatterns.
12.2.2.3 User Interfaces
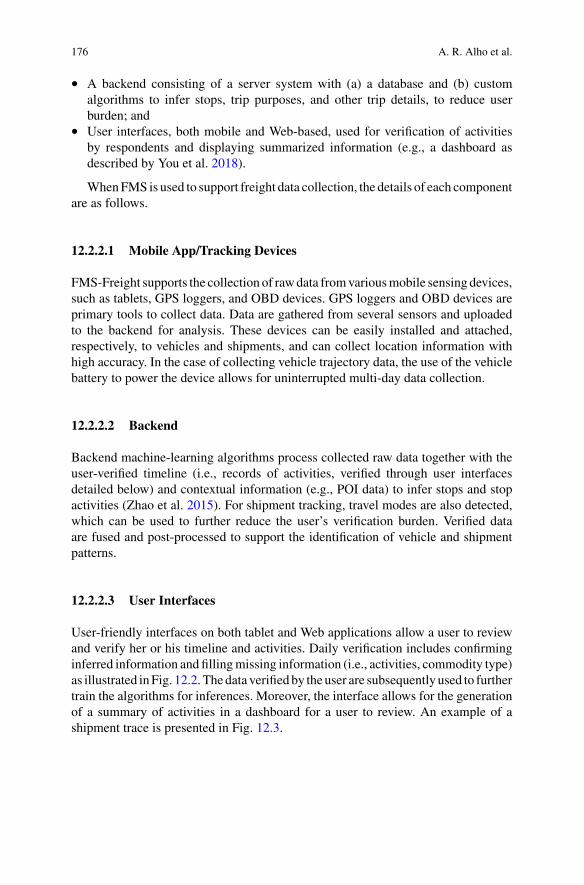
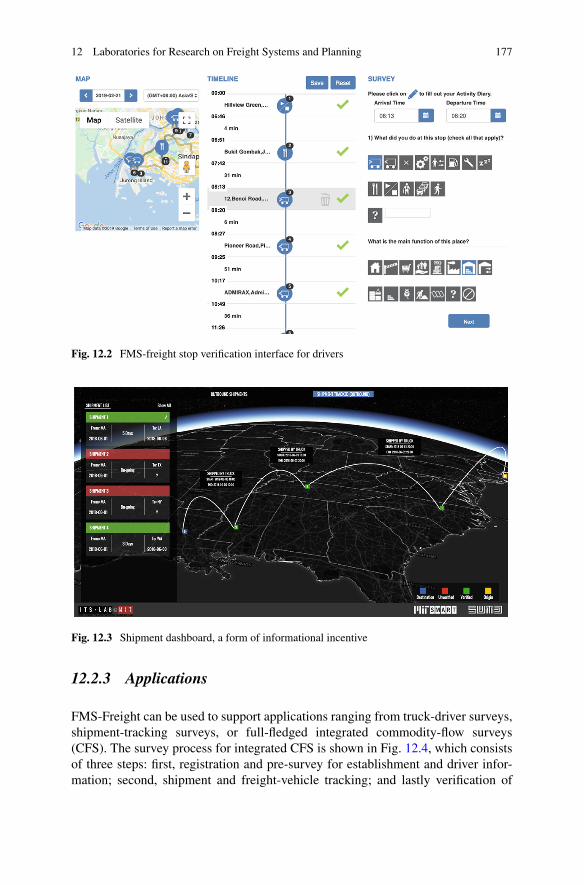
User-friendly interfaces on both tablet and Web applications allow a user to reviewand verify her or his timeline and activities. Daily verification includes confirminginferred information and fillingmissing information (i.e., activities, commodity type)as illustrated inFig. 12.2. Thedata verifiedby the user are subsequently used to furthertrain the algorithms for inferences. Moreover, the interface allows for the generationof a summary of activities in a dashboard for a user to review. An example of ashipment trace is presented in Fig. 12.3.
12 Laboratories for Research on Freight Systems and Planning 177
Fig. 12.2 FMS-freight stop verification interface for drivers
Fig. 12.3 Shipment dashboard, a form of informational incentive
12.2.3 Applications
FMS-Freight can be used to support applications ranging from truck-driver surveys,shipment-tracking surveys, or full-fledged integrated commodity-flow surveys(CFS). The survey process for integrated CFS is shown in Fig. 12.4, which consistsof three steps: first, registration and pre-survey for establishment and driver infor-mation; second, shipment and freight-vehicle tracking; and lastly verification of

178 A. R. Alho et al.
General Business Info.
Shipper questionnaire Carrier questionnaireReceiver questionnaire
Tag Shipments
Shipment Timelines Driver Timelines
Track Vehicles
Driver pre-survey
Phase 1Registration & pre-survey
Phase 2Tracking
Phase 3Verification
Fig. 12.4 Integrated commodity-flow survey process
inferred activities based on the tracking data. The tracking and verification steps arean iterative process that can span days or weeks depending on the survey needs.
While being continuously developed and enhanced, the FMS-Freight platformhas so far been employed in the following pilots:
• A GPS-based inter-city truck-driver survey, which includes tracking, verificationand stated preferences survey on driver routing behavior (Ben-Akiva et al. 2016).
• A large-scale GPS-based vehicle tracking and driver-activity survey to a sampleof season parking ticket holders of the Urban Redevelopment Authority heavyvehicle parks to understand movements and parking patterns (Alho et al. 2018).
• A pilot of a commodity-flow survey in Singapore (Cheah et al. 2017), whichis being followed by a larger deployment, to understand commodity flows andassociated business characteristics.
• A shipment-tracking pilot in the USA and Singapore to gain additional under-standing of the supply chain structures that shipments go through.
12.3 SimMobility, a Simulation Laboratory
12.3.1 Background
Simulationmodels have been developed and used tomeet analytical and policy needsin city planning for decades.Regarding transportation, themodels that simulate trafficflows are used to predict the future transportation environment and evaluate tech-nology and the impacts of policy measures, providing the basis for policy decisions.With the increasing need for models that are able to handle a variety of technology
12 Laboratories for Research on Freight Systems and Planning 179
and policy changes, the past few decades saw remarkable progress in the capability oftransportation simulation tools. Classical aggregate models are being replaced withdisaggregate, agent-based models. These novel simulation tools capture the complexmechanism of decisions associated with the movements of passenger and goods. Assuch, they enable the use of simulations to support the analysis of land-use and trans-portation systems changes, infrastructure management (e.g. dynamic road pricing),and emerging mobility services (e.g., shared and on-demand vehicles) among others.
The above-mentioned trend also applies to urban freight models for whichadvanced frameworks were proposed around 2000 and after. A number of agent-based urban freight models, which take into account behavioral mechanics in supplychain and logistics operations, have been proposed as alternatives to traditionalaggregate commodity- or truck-based models (Chow et al. 2010). Those modelssimulate the decisions and behaviors of different agents, such as shippers, receivers,carriers (including drivers), and policymakers, and their interactions for commodityflows, logistics and transportation services, and transportation infrastructure usage(Boerkamps et al. 2000; Wisetjindawat et al. 2005; Fischer et al. 2005; Roordaet al. 2010). The resultant improvement of the granularity in decisions and behav-iors allows a model to capture the inter-relations among them in a reasonable andreliable manner. The increase in data availability for specific regions and the adventof new data-science techniques further promote the development and applicationof disaggregate models, which, by their nature, require extensive data inputs. Thus,the potential for using them in real-world planning practices has been increasing.However, at a global level, a shortage of suitable data hampers the widespread appli-cations of such models. In the USA, agent-based freight models were developedfor some metropolitan regions, including the Chicago region (Outwater et al. 2013;RSG 2015) and the Arizona Sun Corridor Megaregion (Livshits et al. 2018). Oneexample of this type of model is SimMobility (Adnan et al. 2016), an open-sourceurban simulation platform developed by the Singapore-MIT Alliance for Researchand Technology (SMART) and the Intelligent Transportation Systems (ITS) Labat Massachusetts Institute of Technology. Targeting urban freight modeling, a setof SimMobility components was estimated and calibrated for Singapore. This set ofcomponents adds the capability of simulating goodsmovements across supply chains,as well as agents’ reactions to freight-focused policies. Examples of the latter areroute restrictions, urban consolidation schemes, off-hour deliveries, and overnight,pickup, and delivery parking choices. We provide an overview of the simulation toolin this section. The details of the tool, including model specifications, are availablein the paper by Sakai et al. (2019).
12.3.2 SimMobility Architecture
SimMobility is an agent-based simulation platform consisting of models for land-use changes and passenger and goods movements at the metropolitan scale. Thesimulations in SimMobility are fully disaggregated and maintain the consistency of
180 A. R. Alho et al.
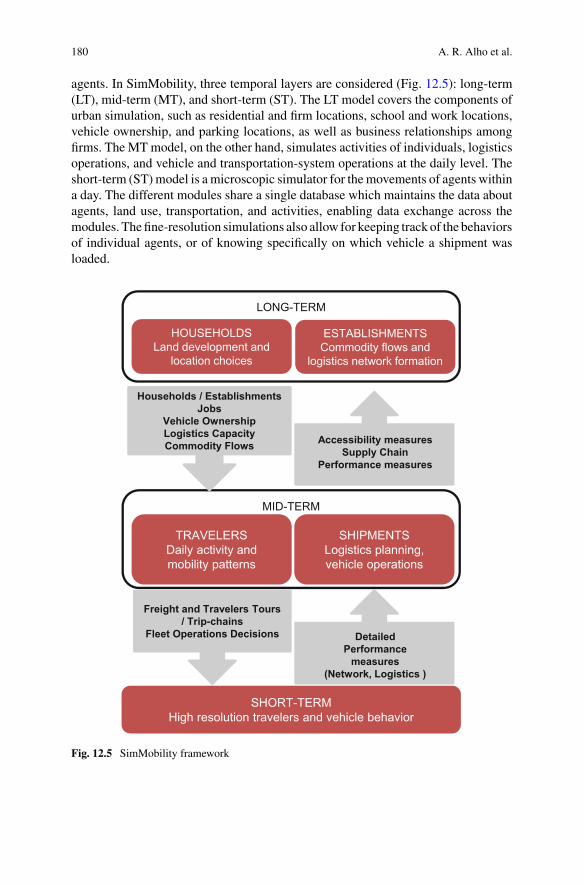
agents. In SimMobility, three temporal layers are considered (Fig. 12.5): long-term(LT), mid-term (MT), and short-term (ST). The LT model covers the components ofurban simulation, such as residential and firm locations, school and work locations,vehicle ownership, and parking locations, as well as business relationships amongfirms. The MTmodel, on the other hand, simulates activities of individuals, logisticsoperations, and vehicle and transportation-system operations at the daily level. Theshort-term (ST)model is amicroscopic simulator for themovements of agents withina day. The different modules share a single database which maintains the data aboutagents, land use, transportation, and activities, enabling data exchange across themodules. Thefine-resolution simulations also allow for keeping track of the behaviorsof individual agents, or of knowing specifically on which vehicle a shipment wasloaded.
1
MID-TERM
LONG-TERM
HOUSEHOLDSLand development and
location choices
ESTABLISHMENTSCommodity flows and
logistics network formation
TRAVELERSDaily activity and mobility patterns
SHIPMENTSLogistics planning, vehicle operations
SHORT-TERMHigh resolution travelers and vehicle behavior
Households / EstablishmentsJobs
Vehicle OwnershipLogistics CapacityCommodity Flows
Freight and Travelers Tours / Trip-chains
Fleet Operations Decisions
Accessibility measuresSupply Chain
Performance measures
DetailedPerformance
measures (Network, Logistics )
Fig. 12.5 SimMobility framework
12 Laboratories for Research on Freight Systems and Planning 181
To date, the platform has been deployed for the Greater Boston area, the Balti-more region, and Singapore as well as several prototypical cities. The freight modelsare currently estimated for Singapore. Further details of different components ofSimMobility are available in the literature (Adnan et al. 2016; Zhu et al. 2018; Luet al. 2015; Azevedo et al. 2017). The models incorporated in SimMobility weredeveloped using a variety of datasets, including those obtained from FMS.
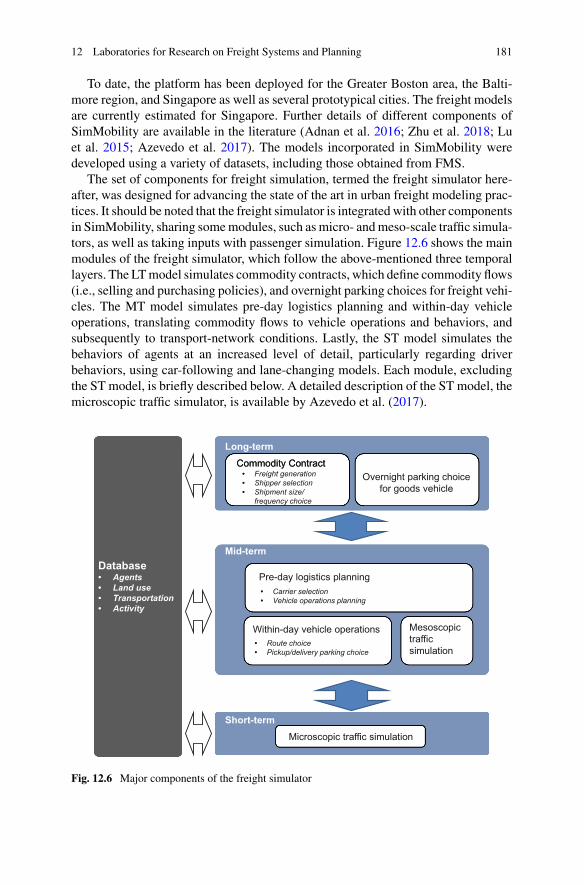
The set of components for freight simulation, termed the freight simulator here-after, was designed for advancing the state of the art in urban freight modeling prac-tices. It should be noted that the freight simulator is integrated with other componentsin SimMobility, sharing somemodules, such asmicro- andmeso-scale traffic simula-tors, as well as taking inputs with passenger simulation. Figure 12.6 shows the mainmodules of the freight simulator, which follow the above-mentioned three temporallayers. The LTmodel simulates commodity contracts, which define commodity flows(i.e., selling and purchasing policies), and overnight parking choices for freight vehi-cles. The MT model simulates pre-day logistics planning and within-day vehicleoperations, translating commodity flows to vehicle operations and behaviors, andsubsequently to transport-network conditions. Lastly, the ST model simulates thebehaviors of agents at an increased level of detail, particularly regarding driverbehaviors, using car-following and lane-changing models. Each module, excludingthe ST model, is briefly described below. A detailed description of the ST model, themicroscopic traffic simulator, is available by Azevedo et al. (2017).
Commodity ContractOvernight parking choice
for goods vehicle
Pre-day logistics planning
Within-day vehicle operations
• Freight generation• Shipper selection• Shipment size/
frequency choice
• Carrier selection• Vehicle operations planning
• Route choice• Pickup/delivery parking choice
Long-term
Mid-term
Short-termMicroscopic traffic simulation
Database• Agents• Land use• Transportation• Activity
Mesoscopic traffic simulation
Commodity Contract•••
••
••
••••
Fig. 12.6 Major components of the freight simulator

182 A. R. Alho et al.
In freight simulations, business establishments play a key role.An establishment ischaracterized by location, employment and floor sizes, function, and industry. Estab-lishments can play multiple roles, being able to behave as a receiver (or consumer),a shipper (or supplier), and a carrier (or a third-party logistics service provider).Commodity contracts and logistics planning are associated with establishment-level decisions. As for the application in Singapore, the synthetic population ofestablishments was developed based on various business statistics (Le et al. 2016).
12.3.2.1 Commodity Contract Estimation (LT Model)
Commodity contracts define selling and purchasing policies and are the basis ofthe commodity flows between establishments. Each commodity contract specifiesshipper and receiver locations, commodity type, amount of goods, and shipment sizeand frequency. The commodity contract estimation is composed of three separatesteps: (1) freight generation, (2) shipper selection, and (3) size and frequency choice(Fig. 12.7). Freight generation starts with identifying whether each establishment isa shipper or receiver, using a logit model. Then, multinomial logit models simulatethe selection of commodity types for outbound and inbound shipments. Finally,
Shipper selection
Contract-based demand
Establishments(employment, floor area, function, industry)
Shipper/receiver identification
Outbound commodity
type
Production (Quantity-weight)
Inbound commodity
type
Consumption (Quantity-weight)
Shipment size & order frequency
Commodity Contracts(receiver & shipper, commodity type, size/frequency)
Freight Generation
Shipper Selection
Size & Frequency
Fig. 12.7 Flow of the commodity contract estimation

12 Laboratories for Research on Freight Systems and Planning 183
the quantities of production and consumption, which are quantities shipped andreceived, respectively, for a certain time period, are determined using linear models.In the following step—shipper selection—the estimated consumptions are used togenerate contract-based demands. Each contract-based demand requires a singleshipper (supplier), and each contract is made for a single receiver–shipper pair. Areceiver can make one or more contracts with shippers. Logit mixture models witherror components simulate shipper selection, considering the correlations among thealternative shippers with the same distribution channel type (Sakai et al. 2018). Inthe third step, linear models estimate shipment size and order frequency based onfactors associated with the volume of goods, and transportation and inventory costs.
12.3.2.2 Overnight Parking Choice (LT Model)
Overnight parking choice is considered a long-term decision. We simulate the deci-sions of vehicle owners to assign parking lots for freight vehicles using multino-mial logit models, using freight-vehicle population and overnight parking supplyfor freight vehicles as inputs. This module enables the simulations to evaluate theimpacts of parking supply policies and to define their starting and end point of dailytrips.
12.3.2.3 Pre-day Logistics Planning (MT Model)
Logistics planning processes convert shipment demand into vehicle-operation plans(VOPs). The VOPs define trips or tours of vehicles to be performed in a given day,including details about stop locations and the purposes (e.g., delivery of a specificshipment) and duration of stops. The logistics planning process has sub-modulesfor carrier selection and vehicle-operation planning, both of which are rule-based. Acarrier is assigned to each shipment based on the distances from the shipment originto potential carriers (i.e., transportation service providers), subject to their transportcapacities. Vehicle-operation planning simulates the process of assigning shipmentsto vehicles as well as determining the orders of pickups and deliveries. In this sub-module, a custom algorithm is applied to consolidate shipments and estimate stopduration for pickups and deliveries in a realistic manner.
12.3.2.4 Within-Day Vehicle Operations (MT Model)
VOPs are used as inputs for simulating vehicle operations and network trafficwithin agiven day.Multinomial logit models simulate route choices for trips (i.e., movementsfrom one location to another) based on route attributes, and driver and vehicle charac-teristics. Furthermore, another set of multinomial logit models simulates pickup anddelivery parking choices considering cost, capacity, and congestion of parking facili-ties near the stop points (i.e., the activity locations), subject to parking-infrastructure
184 A. R. Alho et al.
data availability. Amesoscopic traffic simulation is run jointly with these simulationswhile updating network conditions.
12.3.2.5 Visualization of Outputs
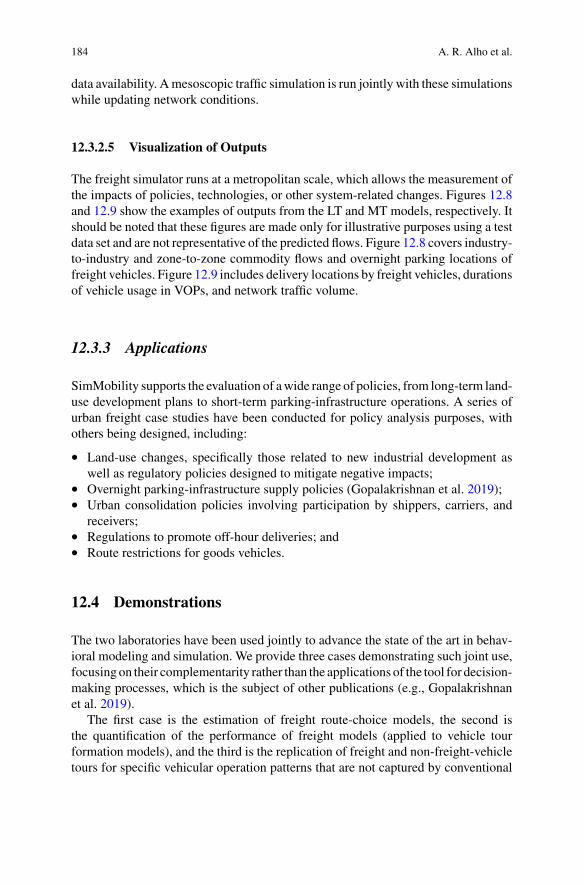
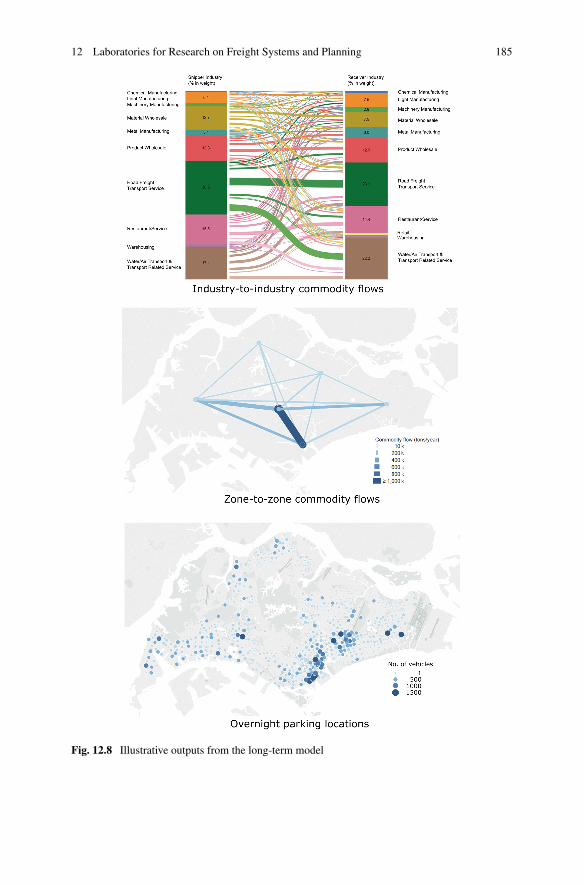
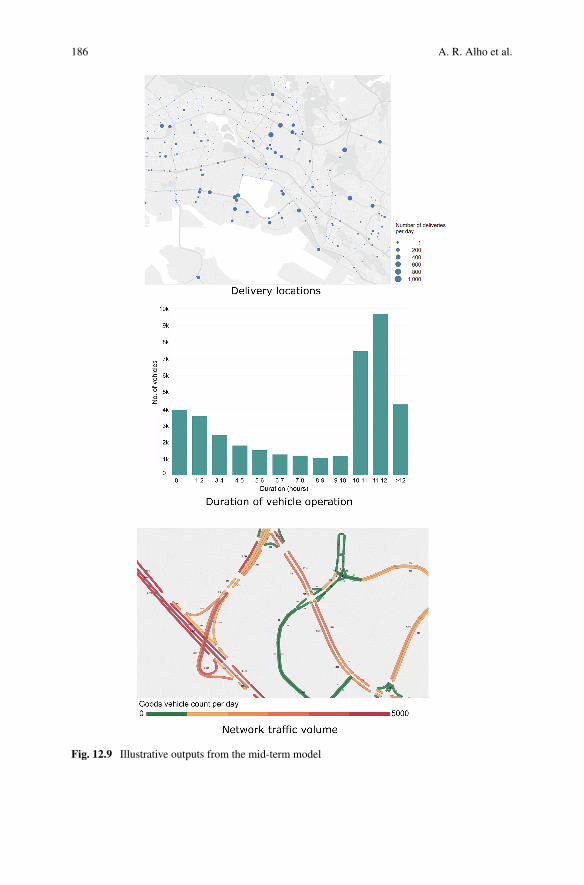
The freight simulator runs at a metropolitan scale, which allows the measurement ofthe impacts of policies, technologies, or other system-related changes. Figures 12.8and 12.9 show the examples of outputs from the LT and MT models, respectively. Itshould be noted that these figures are made only for illustrative purposes using a testdata set and are not representative of the predicted flows. Figure 12.8 covers industry-to-industry and zone-to-zone commodity flows and overnight parking locations offreight vehicles. Figure 12.9 includes delivery locations by freight vehicles, durationsof vehicle usage in VOPs, and network traffic volume.
12.3.3 Applications
SimMobility supports the evaluation of awide range of policies, from long-term land-use development plans to short-term parking-infrastructure operations. A series ofurban freight case studies have been conducted for policy analysis purposes, withothers being designed, including:
• Land-use changes, specifically those related to new industrial development aswell as regulatory policies designed to mitigate negative impacts;
• Overnight parking-infrastructure supply policies (Gopalakrishnan et al. 2019);• Urban consolidation policies involving participation by shippers, carriers, and
receivers;• Regulations to promote off-hour deliveries; and• Route restrictions for goods vehicles.
12.4 Demonstrations
The two laboratories have been used jointly to advance the state of the art in behav-ioral modeling and simulation. We provide three cases demonstrating such joint use,focusingon their complementarity rather than the applications of the tool for decision-making processes, which is the subject of other publications (e.g., Gopalakrishnanet al. 2019).
The first case is the estimation of freight route-choice models, the second isthe quantification of the performance of freight models (applied to vehicle tourformation models), and the third is the replication of freight and non-freight-vehicletours for specific vehicular operation patterns that are not captured by conventional
12 Laboratories for Research on Freight Systems and Planning 185
Fig. 12.8 Illustrative outputs from the long-term model
186 A. R. Alho et al.
Fig. 12.9 Illustrative outputs from the mid-term model

12 Laboratories for Research on Freight Systems and Planning 187
demand models. More details about these applications can be found in the followingreferences: Toledo et al. (2018),Alho et al. (2019b), andGopalakrishnan et al. (2019).
12.4.1 Freight-Vehicle Route-Choice Model
The first application is the estimation of a freight-vehicle route-choice model. Theroute-choice decision of freight-vehicle drivers differs from that of passenger-vehicledrivers in terms of higher sensitivity to traffic conditions, and greater heterogeneityamong driver types and associated commodity attributes, among other factors. Thefirst step was to develop a truck-driver survey using FMS-Freight, which wasconducted in the USA (Ben-Akiva et al. 2016). The survey collected user-annotatedGPS data and characteristics of operational practices, vehicles, and drivers. A multi-nomial logitmodelwas estimated using the dataset and applied to simulate thewithin-day route choice of drivers in SimMobility using the mid-term model. Explanatoryvariables include (1) traffic network attributes, which are generated by the supplysimulation (e.g., travel time) or stored in the SimMobility database (e.g., road class,distance); and (2) characteristics of the driver and the vehicle, which are generatedin the SimMobility long-term model. The model takes the value of explanatory vari-ables as inputs and predicts the route between a given set of OD pairs with a MonteCarlo procedure. Figure 12.10 illustrates how the data collected using FMS-Freightare used to develop a freight route-choice model and how the model is applied inSimMobility.
Supply simulation
Pre-day logistics planning model
Raw GPS data StopsStop detection algorithm
Userinput/verification
Data
FMS
SimMobility
Vehicle trips / routes
Trips to be simulated
Within-day route choice
Driver and vehicle characteristics
Driver and vehicle characteristics
Path set database
Predicted route choice
Alternative routes
Fig. 12.10 Data and model flow for freight-vehicle route choice
188 A. R. Alho et al.
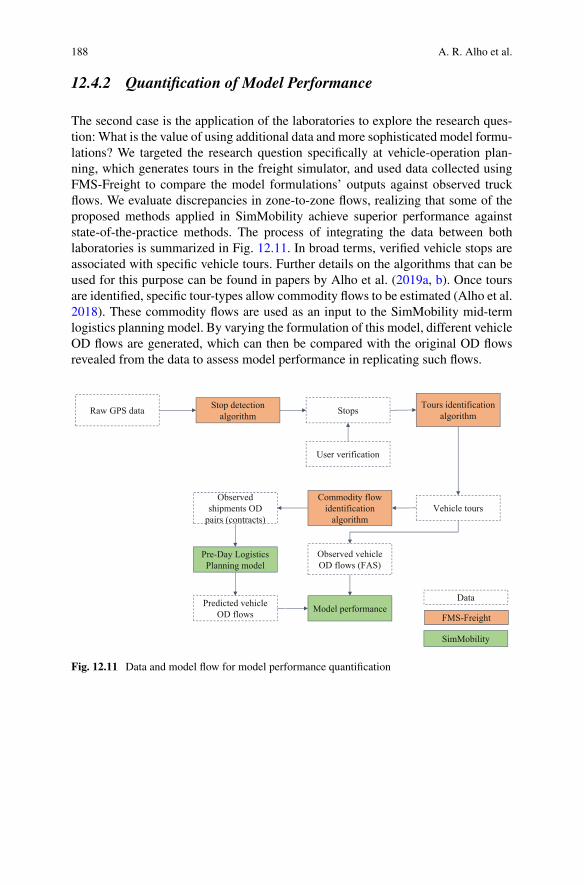
12.4.2 Quantification of Model Performance
The second case is the application of the laboratories to explore the research ques-tion: What is the value of using additional data and more sophisticated model formu-lations? We targeted the research question specifically at vehicle-operation plan-ning, which generates tours in the freight simulator, and used data collected usingFMS-Freight to compare the model formulations’ outputs against observed truckflows. We evaluate discrepancies in zone-to-zone flows, realizing that some of theproposed methods applied in SimMobility achieve superior performance againststate-of-the-practice methods. The process of integrating the data between bothlaboratories is summarized in Fig. 12.11. In broad terms, verified vehicle stops areassociated with specific vehicle tours. Further details on the algorithms that can beused for this purpose can be found in papers by Alho et al. (2019a, b). Once toursare identified, specific tour-types allow commodity flows to be estimated (Alho et al.2018). These commodity flows are used as an input to the SimMobility mid-termlogistics planning model. By varying the formulation of this model, different vehicleOD flows are generated, which can then be compared with the original OD flowsrevealed from the data to assess model performance in replicating such flows.
Observedshipments OD
pairs (contracts)
Pre-Day Logistics Planning model
Predicted vehicle OD flows Model performance
Observed vehicle OD flows (FAS)
Raw GPS data StopsStop detection algorithm
User verification
Tours identification algorithm
Vehicle toursCommodity flow
identificationalgorithm
Data
FMS-Freight
SimMobility
Fig. 12.11 Data and model flow for model performance quantification

12 Laboratories for Research on Freight Systems and Planning 189
12.4.3 Replication of Specific Freightand Non-Freight-Vehicle Tours
The final selected application is related to the replication of specific freight and non-freight-vehicle tours. The research team has performed a case-study in Singaporewhere simulation was used to assess a hypothetical scenario of overnight parking-infrastructure re-organization, and associated tours performance. If the overnightparking infrastructure and the assignment of vehicles to it are optimized, this cancontribute to reducing empty travel, and reducing traffic congestion and air pollution.For this purpose, vehicle trips to and from overnight parking locations had to bereplicated. Since the overnight parking lots are not only occupied by conventionalfreight vehicles, but also by private buses (on-demand, for use by companies, tourism,among other uses) and service vehicles (e.g., some construction vehicles such ascranes), there was a need to replicate the tours of both these vehicle and operationtypes. It should be noted that demandmodels for these vehicle and operation types arecommonly estimated as OD matrices and not at a level of detail we required for oursimulations. Thus, the approach illustrated in Fig. 12.12 was applied. This requiredexpanding the sampled tours to the relevant vehicle populations of subscribers of theovernight parking lots.
Tours to be simulated
Pre-Day Logistics Planning model
Tours performance
Supply Simulation
Raw GPS data StopsStop detection algorithm
User verification
Tours identification algorithm
Vehicle tours
Tour cloning model
Data
FMS-Freight
SimMobility
Vehicle registry
Parkinginfrastructure
Long-term Overnight Parking
Subscription
Within-day Route Choice
Fig. 12.12 Data and model flow for sample replication of tours of specific vehicle types
190 A. R. Alho et al.
12.5 Concluding Remarks
Urban freight data-collection and modeling techniques are currently portrayed at atransition point. Meersman and Van de Voorde (2019) question whether past andcurrent data-collection methods are suitable to inform current and future modelingneeds. For all we know, the evolution of methods is predominantly incremental. Weput forward that laboratories such as those demonstrated in this chapter are key tothe assessment of new approaches to data collection and modeling, including a quan-titative assessment of the alternative’s performance against the prior. Furthermore,we demonstrate that the research progress in either data collection, or modeling andsimulation, can be augmented by coordinated use of their capabilities.
The pace of change in urban freight transport appears to grow faster, and withcritical implications to the relevance of freight models in assessing technological andpolicy impacts. This calls for further attention to the representation of relevant agentsin the urban freight system in simulations, as well as their behaviors and interactions.For the latter cases, the role of sensing technologies is key to reducing survey fatigueand allowing for lengthier and deeper data-collection efforts.
Acknowledgements This research is supported in part by the Singapore Ministry of NationalDevelopment and the National Research Foundation, Prime Minister’s Office, under the Land andLiveability National Innovation Challenge (L2 NIC) Research Programme (L2 NIC Award No L2NICTDF1-2016-1). Any opinions, findings, and conclusions or recommendations expressed in thismaterial are those of the author(s) only and do not reflect the views of the Singapore Ministryof National Development and National Research Foundation, Prime Minister’s Office, Singapore.We thank the Urban Redevelopment Authority of Singapore, JTC Corporation, Land TransportAuthority of Singapore and Housing and Development Board of Singapore for their support.
References
AdnanM, Francisco CP, Carlos LA, Kakali B, Milan L, Sebastian R, Yi Z, Joseph F, Christopher Z,Moshe B (2016) SimMobility: a multi-scale integrated agent-based simulation platform. Paperpresented at the 95th annual meeting of the transportation research board, Washington
Alho AR, de Abreu e Silva J (2015) Lisbon’s establishment-based freight survey: revealing retailestablishments’ characteristics, goods ordering and delivery processes. Eur Transp Res Rev 7:16.https://doi.org/10.1007/s12544-015-0163-7
Alho AR, You L, Lu F, Lynette C, Fang Z, Moshe B (2018) Next-generation freight vehicle surveysby supplementing truck GPS tracking with a driver activity survey: account and insights. In: 21stinternational conference on intelligent transportation systems (ITSC), Maui, 4–7 Nov 2018, pp2974–2979. https://doi.org/10.1109/ITSC.2018.8569747
Alho AR, Sakai T, Chua MH, Jeong K, Jing P, Ben-Akiva M (2019a) Exploring methods forrevealing freight vehicle tours, tour-types and tour-chains from GPS vehicle tracking and driversurvey data. J Big Data Anal Transp
Alho AR, Sakai T, Chua MH, Raven M, Hara Y, Ben-Akiva M (2019b) The influence of tour-formation assumptions on the reproducibility of freight vehicle flows. In: Proceedings of theeleventh city logistics conference, Dubrovnik

12 Laboratories for Research on Freight Systems and Planning 191
Allen J, Browne M, Cherrett T (2012) Survey techniques in urban freight transport studies. TranspRev Transnatl Transdiscipl J 32(3):287–311. https://doi.org/10.1080/01441647.2012.665949
Azevedo CL, Deshmukh NM, Marimuthu B, Oh S, Marczuk K, Soh H, Basak K, Toledo T, PehL, Ben-Akiva M (2017) SimMobility short-term: an integrated microscopic mobility simulator.Transp Res Rec 2622:13–23
Ben-AkivaME,ToledoT, Santos J,CoxN,ZhaoF,LeeYJ,MarzanoV (2016) Freight data collectionusing GPS and web-based surveys: insights from US truck drivers’ survey and perspectives forurban freight. Case Stud Transp Policy 4(1):38–44. https://doi.org/10.1016/j.cstp.2015.11.005
Boerkamps J, van Binsbergen A, Bovy P (2000) Modeling behavioral aspects of urban freightmovement in supply chains. Transp Res Rec 1725:17–25
Cheah L, Zhao F, Stinson M, Lu FP, Dingmastera J, Marzano V, Ben-Akiva M (2017) Next-generation commodity flow survey: a pilot in Singapore. Paper presented at city logisticsconference, Phuket
Chow JY, Yang CH, Regan AC (2010) State-of-the art of freight forecast modeling: lessons learnedand the road ahead. Transportation 37(6):1011–1030
Eluru N, Li X, Pinjari A, Abdelaty M, Anowar S, Momtaz SU, Iraganaboina NC, Keya N, DeyB, Zhao D, Balusu SPK, Sheela PV (2018) Freight data fusion from multiple data sources forfreight planning applications in Florida. Final report. University of Central Florida, Departmentof Civil, Environmental and Construction Engineering
FischerM,OutwaternM,ChengL,AhanotuDN,CalixR (2005) Innovative framework formodelingfreight transportation in Los Angeles County, California. Transp Res Rec 1906:105–112
Gopalakrishnan R, Alho AR, Sakai T, Cheah L, Ben-Akiva M (2019) Assessing overnightparking infrastructure policies for commercial vehicles in cities using agent-based simulation.In: Proceedings of the eleventh city logistics conference, Dubrovnik
Holguín-Veras J, Jaller M (2013) Comprehensive freight demand data collection framework forlarge urban areas. In: Gonzalez-Feliu J et al (eds) Sustainable urban logistics: concepts, methodsand information systems. EcoProduction. Springer-Verlag, Berlin Heidelberg, pp 91–112. https://doi.org/10.1007/978-3-642-31788-0_6
Jeong K, Tok A, Ritchie SG, Park J (2016) California vehicle inventory and use survey: pilot studyinsights. Transp Res Rec 2547(1):32–40. https://doi.org/10.3141/2547-06
Kamali M (2015) Development of truck route choice data using truck GPS.M.Sc. thesis, Universityof South Florida. https://scholarcommons.usf.edu/cgi/viewcontent.cgi?referer=https://www.google.com/&httpsredir=1&article=7164&context=etd. Accessed 27 Feb 2019
Le DT, Cernicchiaro G, Zegras C et al (2016) Constructing a synthetic population of establishmentsfor the simmobility microsimulation platform. Transp Res Procedia 19:81–93. https://doi.org/10.1016/j.trpro.2016.12.070
Livshits V, You D, Zhu H, Jeon K, Vallabhaneni L, Camargo P, Hong S, Nippani S, Sun A,Noh H, Tokishi J, Kuppam A, Selby B, Beagan D, Murray D, Smith D, Lemp J, ShortJ, Viswanathan K, Ehlen M, Stinson M, Khurana M, Bingham P, Bostrom R, Golub S,Carlin G, Ravulaparthy S, Pourabdollahi Z (2018) Mega-regional multi-modal agent-basedbehavioral freight model. Final report. Strategic highway research program 2 (SHRP2 C20IAP grant). https://www.azmag.gov/Portals/0/Documents/MagContent/TRANS_2017-02-13_SHRP2-TRANS_2017-06-06-C20-MAG-Next-Generation-Freight-Demand-Model-Update.pdf
Lu Y, Adnan M, Basak K, Pereira FC (2015) SimMobility mid-term simulator: a state of the artintegrated agent based demand and supply model. In: 94th annual meeting of the transportationresearch board, Washington
Ludlow D, Sakhrani V (2017) NCFRP 49—new source of freight data for urban and metropolitanmobility. In: 2017 international urban freight conference (I-NUF), Long Beach. https://www.metrans.org/sites/default/files/Special%20Session%201%20Ludlow%20.pdf. Accessed 27 Feb 2019
MammesN, KlatskyM (2017) Approaches tomonitor truck loading activity in NewYork City usingvideo analytics. In: TRB innovations in freight data workshop, Irvine, 18May 2017. https://onlinepubs.trb.org/onlinepubs/conferences/2017/FreightData/MammesPPT.pdf. Accessed 27 Feb 2019

192 A. R. Alho et al.
Meersman H, Van de Voorde E (2019) Freight transport models: ready to support transport policyof the future? Transp Policy 83:97–101. https://doi.org/10.1016/j.tranpol.2019.01.014
Nahmias-BiranB,HanY,Bekhor S,ZhaoF,ZegrasC,Ben-AkivaM(2018)Enriching activity-basedmodels using smartphone-based travel surveys. Transp Res Rec 2672(42):280–291
Outwater M, Smith C, Wies K et al (2013) Tour based and supply chain modeling for freight:integrated model demonstration in Chicago. Transp Lett 2:55–66
Resource Systems Group, Inc (2015) User’s guide and model documentation: agent-based supplychain modeling tool. The report for Chicago metropolitan agency for planning. https://www.cmap.illinois.gov/data/transportation/modeling
Roorda MJ, Cavalcante R, McCabe S, Kwan H (2010) A conceptual framework for agent-basedmodelling of logistics services. Transp Res Part E 46(1):18–31
Sakai T, Bhavathrathan BK, Alho AR, Hyodo T, Ben-Akiva M (2018) Commodity flow estimationfor a metropolitan scale freight modeling system: supplier selection considering distributionchannel using an error component logit mixture model. Transportation 1–29. https://doi.org/10.1007/s11116-018-9932-1
Sakai T, AlhoAR, Bhavathrathan BK,Dalla Chiara G, Gopalakrishnan R, Jing P, Hyodo T, Cheah L,Ben-Akiva M (2019) SimMobility freight: an agent-based urban freight simulator for evaluatinglogistics solutions. Transp Res Part E Logist Transp Rev
Sun X, Ding J, Dalla Chiara G, Cheah L, Cheung NM (2017) A generic framework for monitoringlocal freight trafficmovements using computer vision-based techniques In: 5th IEEE internationalconference on models and technologies for intelligent transportation systems (MT-ITS), Naples,pp 63–68. https://ieeexplore.ieee.org/abstract/document/8005592
TokYC (2008)Commercial vehicle classification systemusing advanced inductive loop technology.UC Berkeley: University of California Transportation Center. Retrieved from https://escholarship.org/uc/item/92x23786
Toledo T, Jing P, Atasoy B, Ding Mastera J, Santos JO, Ben-Akiva M (2018) Intercity truckdriver route choice incorporating drivers’ heterogeneity in toll road usage: data collection,model estimation, and model application. In: Transportation research board 97th annual meeting,Washington
Wisetjindawat W, Sano K, Matsumoto S (2005) Supply chain simulation for modeling theinteractions in freight movement. J East Asian Soc Transp Stud 6:2991–3004
You L, Zhao F, Cheah L, Jeong K, Zegras C, Ben-AkivaM (2018) Future mobility sensing: an intel-ligent mobility data collection and visualization platform. In: 21st IEEE international conferenceon intelligent transportation systems, Maui, 4–7 Nov
Zanjani AB (2014) Deriving statewide freight truck flows from global positioning system (GPS)data. M.Sc. dissertation, University of South Florida. https://scholarcommons.usf.edu/cgi/viewcontent.cgi?referer=https://www.google.com/&httpsredir=1&article=6373&context=etd.Accessed 17 Feb 2019
Zhang G, Avery RP, Wang Y (2007) A video-based vehicle detection and classification system forreal-time traffic data collection using uncalibrated video cameras. Transp Res Rec 1993(1):138–147. https://doi.org/10.3141/1993-19
ZhaoF,GhorpadeA, Pereira FC,ZegrasC,Ben-AkivaM(2015) Stop detection in smartphone-basedtravel surveys. Transp Res Procedia 11:218–226
Zhu Y, DiaoM, Ferreira J Jr, Zegras PC (2018) An integrated microsimulation approach to land-useand mobility modeling. J Transp Land Use 11(1):633–659
12 Laboratories for Research on Freight Systems and Planning 193
André Romano Alho is a Research Scientist in the FutureUrban Mobility Interdisciplinary Research Group, at theSingapore-MIT Alliance for Research and Technology. He ispassionate about developing and applying research methodsto provide innovative solutions for Transportation Systems,particularly focusing on Urban Freight operations.
Takanori Sakai is a Senior Postdoctoral Associate in theFuture Urban Mobility Interdisciplinary Research Group atthe Singapore-MIT Alliance for Research and Technology. Hisresearch mainly focuses on urban freight transportation planningand modeling and transportation geography. He is a memberof the Transportation Research Board—Freight TransportationPlanning and Logistics Committee.
Fang Zhao is a Research Scientist at the Singapore-MITAlliance for Research and Technology, Future Urban MobilityInterdisciplinary Research Group. She has an inter-disciplinarybackground with expertise in machine learning, communicationnetworks, and travel surveys. She received her Ph.D. degree inElectrical Engineering from the Massachusetts Institute of Tech-nology.

194 A. R. Alho et al.
Linlin You is an Associate Professor at the School of Intelli-gent Systems Engineering, Sun Yat-sen University, and also aResearch Affiliate at the Intelligent Transportation Systems Lab,Massachusetts Institute of Technology. He is a member of IEEEand ACM, and interested in Smart Service Orchestration, ITSand Multi-source data fusion.
Peiyu Jing is a Transportation Ph.D. candidate in the Depart-ment of Civil and Environmental Engineering at MassachusettsInstitute of Technology. Her research interest is freight datacollection, agent-based freight modeling and simulation, andfreight congestion pricing.
Lynette Cheah is an Associate Professor of EngineeringSystems at the Singapore University of Technology and Design.She leads the Sustainable Urban Mobility research group,which develops data-driven models and tools to reduce theenvironmental impacts of passenger and urban freight transport.
12 Laboratories for Research on Freight Systems and Planning 195
Christopher Zegras is Professor of Mobility and Urban Plan-ning at the Massachusetts Institute of Technology where he isHead of the Department of Urban Studies and Planning. He isalso a Principal Investigator of the Future of Urban MobilityInterdisciplinary Research Group, under the Singapore MITAlliance for Research and Technology.
Moshe Ben-Akiva is the Edmund K. Turner Professor of Civiland Environmental Engineering at Massachusetts Institute ofTechnology (MIT), Director of MIT’s Intelligent TransportationSystems Lab, and Principal Investigator at the Singapore-MITAlliance for Research and Technology. His interests includeSmart Mobility and discrete choice analysis with machinelearning capabilities.
Open Access This chapter is licensed under the terms of the Creative Commons Attribution 4.0International License (http://creativecommons.org/licenses/by/4.0/), which permits use, sharing,adaptation, distribution and reproduction in any medium or format, as long as you give appropriatecredit to the original author(s) and the source, provide a link to the Creative Commons license andindicate if changes were made.
The images or other third party material in this chapter are included in the chapter’s CreativeCommons license, unless indicated otherwise in a credit line to the material. If material is notincluded in the chapter’s Creative Commons license and your intended use is not permitted bystatutory regulation or exceeds the permitted use, you will need to obtain permission directly fromthe copyright holder.