Labor Market & Salary Report 2019 | 2020 · 2019-11-05 · 3 In partnership with Labor Market 2019...
56
In partnership with Labor Market & Salary Report 2019 | 2020 Brief Edition
Transcript of Labor Market & Salary Report 2019 | 2020 · 2019-11-05 · 3 In partnership with Labor Market 2019...

In partnership with
Labor Market & Salary Report
2019 | 2020Brief Edition

GERMAN CHAMBER OF COMMERCE IN CHINA
www.china.ahk.de/chamber
2019 | 2020
Labor Market & Salary Report
© 2019 by the German Chamber of Commerce in China. Thank you for not reproducing this report either in part or in full
without prior consent of the German Chamber of Commerce in China.
While every effort has been made to provide accurate information in the preparation of this report no responsibility or
liability is accepted for errors or omissions of fact or for any opinions expressed herein. Opinions, projections and estimates
are subject to change without notice. This report is for information purposes only. In no event shall the German Chamber of
Commerce in China, Direct HR Group or their employees be liable for any losses or other consequential, incidental,
exemplary or special damages relating in whole or part to the use of information contained in this report.
Cover picture by Kimi Lee on Unsplash
Brief Edition

3
In partnership with
Labor Market
2019 | 2020& Salary Report
BR
IEF
▪ After last year’s mild uptick, the expected wage increase
returns to a descending path that has been a trademark
feature since measurements started in 2012. German
companies anticipate a 5.53 percent increase in 2020.
▪ At the regional level, the slowdown is more pronounced in
East China. In North China, Beijing and Tianjin will put
forward increases above their 2019 expectation.
Shenzhen and Guangzhou in South China present the
highest expected increases.
▪ The automotive industry projects an increase of 5.26
percent in 2020, 1.37 percentage points (p.p.) below the
2019 forecast. In contrast, machinery / industrial
equipment presents a 5.84 percent expected wage
increase in 2020, 0.05 p.p. below that of 2019.
▪ The 5.87 percent effective increase reported in 2019
does not fall far from the 5.99 percent expected increase
reported last year.
▪ Beijing, Tianjin, Shenzhen, and Guangzhou report effective
wage increases in 2019 above their respective expected
increases as measured last year. Shanghai delivers an
effective 5.65 percent increase, 0.41 p.p. lower than
initially anticipated.
▪ The median total cost per employee for the 483
companies contributing to the survey this edition is RMB
15,000 / month. That is 2.2 times higher than the latest
official national average compensation in China, reported
by the NBS.
Productivity and HR Developments
▪ 52.5 percent of German companies consider wage levels
as reasonable given productivity and staff qualifications.
▪ 60.1 percent of the companies have no strategic changes
planned due to increasing labor costs. Relocation to lower
labor cost areas, either within China or abroad, is
considered by ten percent of contributors.
▪ Data management and analysis, creativity and innovation,
and critical thinking represent the set of skills from local
staff with the highest margin for improvement.
KEY DEVELOPMENTS
Economic Environment
▪ China’s GDP in the first half of 2019 registered a 6.3
percent growth, compared to the same period last year.
▪ Although the GDP is growing at its slowest pace since
1992, the outcome is still considerable given the global
context, where protectionism is on the rise, and there are
concerns on the U.S. economy slowing down in 2020.
▪ Despite all the narrative around trade disputes, the
underpinnings of China’s economy remain within its
domestic market. Imports, an internal demand-driven
metric, continued to plunge 5.6 percent in July year-on-
year (YoY). Inflation was at 2.8 percent in July, the second
highest since January 2016.
Labor Market and Wage Developments
▪ The annual wage in China averaged RMB 82,461 in 2018,
an 11 percent increase in comparison to 2017, according
to data from the National Bureau of Statistics in China
(NBS).
▪ For the first time since 2015, there has been a decrease
of 0.2 percent in the migrant population of China’s eastern
regions.
▪ The country will relax its hukou residency rules in small
and mid-size cities in 2019. Cities with a population under
three million are required to completely lift all restrictions
on household registrations. Cities with a population
between three and five million are required to relax or
comprehensively lift household restrictions. Super cities
(population between five and ten million) and megacities
(population over ten million) will be exempt from the
reform.
▪ In 2018, for the first time, the number of migrant workers
employed in the secondary sector (49.1 percent) was
lower than in the service sector (50.5 percent).
Wage Developments at German Companies
5.99 5.87
Expected Effective
Expected and Effective Wage Increases in China
(in 2019, in %)
Expected Wage Growth Development at
German Companies in China (%)
20
12
20
13
20
14
20
15
20
16
20
17
20
19
20
20
10.20
7.10
8.80
8.10
6.235.99
5.53
20
18
8.90
5.90

In partnership with
4
Labor Market
2019 | 2020& Salary Report
BR
IEF
Content
I Labor Market Environment
1. Growth Developments
2. Business Sentiment & Price Developments
3. Labor Market Structure
4. Labor Market Developments
5. Notes
II Wage Developments in China
1. National Wage Developments
2. Provincial Wage Developments
3. Minimum Wages and Wage Guidelines
4. Wages by Industry and Ownership
5. Productivity
6. Notes
III General Survey Results
1. Expected Wage Developments at German Chamber Companies
2. Regional Wage Developments
3. Effective Wage Developments
4. Wage Levels
5. Compensation Levels: Perception
6. Productivity
7. Wage Determination
8. HR Challenges
9. Gender Wage Equality
10. Additional HR Data
11. Foreigners
12. General Results Overview
13. About the Survey
14. Profile of Contributors
15. Notes
IV Appendix: Definitions
V Compensation Data
1. Introduction
2. Wages and Wage Increases
3. Segmentation Variables
4. Region
5. East
6. North
7. South & Southwest
8. Industry
9. Company Size
10. City Tier
11. Total Cost per Employee: Median and Percentiles
5
5
8
10
14
15
17
17
18
19
21
23
25
26
26
28
30
33
35
37
41
42
45
46
46
48
50
50
52
53
53
54
54
55
61
67
73
79
85
91
97
To access specific compensation data, please contact:
Ms. Philippa Hungar
Project Manager Communications
German Chamber of Commerce in China | Shanghai
Tel.: +86 21 5081 2266 Ext. 1846
CONTACT

5
In partnership with
Labor Market
2019 | 2020& Salary Report
BR
IEF
Source: NBS. Data is cumulative: the contribution to GDP from a sector in a quarter for any given year includes the previous quarter/s within that year.
Tertiary52.8 (7.0)
Secondary41.1 (5.6)
Primary6.1 (3.3)
(6.2) 2019Q2
China’s GDP Second Quarter and First Half 2019 (%)
Contribution to GDP by Sector. (Year-on-Year Growth rate)
I Labor Market Environment
1. Growth Developments
At 6.2 percent, the second quarter of 2019 remained within
the stated GDP growth target for the year (between 6.0 to
6.5 percent).
China’s GDP in Q2 2019 showed an economy that is growing
at its slowest pace since quarterly readings started almost
three decades ago in 1992.1 Despite consensus that a
slowing trajectory is laying ahead, a 6.2 percent growth is still
a considerable figure, especially in a global context where
protectionism is on the rise, and where one given concern is
the U.S. economy slowing down in 2020.2 Monthly indicators
also signaled a slow down: in July retail sales went up 7.6
percent YoY, 2.2 p.p. below June; industrial output grew 4.8
percent YoY, 1.5 p.p. down the growth rate from June; and
cumulative fixed-asset investment rose 5.7 percent YoY, 0.1
p.p. below June.
The most dynamic sector continues to be services: the
tertiary sector did not only contribute to nearly 55 percent of
the GDP in the first half of the year but grew seven percent
YoY. The secondary sector (mining, manufacturing,
construction) makes up for 39.9 percent of the GDP in the
first six months of 2019 and presents slower growth (5.8
percent YoY).
At a more granular level, if there is one area of the economy
that shows impressive growth that is information, software
and information technology services (information and
communication technology (ICT)). In the first half of the year,
it grew by 20.6 percent. As of today, it only contributes a
share of 4.1 percent of China’s economy. However, since
technology is an essential strategic asset at the center of any
economy that strives for innovation and enhanced
productivity, it is worth to highlight China’s growth in this
area. ICT combines, following the OECD definition, both
manufacturing and services industries: manufacturing of
computer, communication equipment and other electronic
equipment (both production of and investment in), software
programming and information services, publishing,
broadcasting, or telecommunications.3 The ICT industry,
according to the accounting from NBS refers only to services
and no further details are provided about the specific types
of services that have fueled the industry’s growth.
Other industries exceeding China's first half year's average of
6.3 percent were business services (7.8 percent YoY) and
finance (7.3 percent YoY).
The two largest contributors to GDP remain, on one side,
GDP Growth China (%)
Quarterly Data, 2012-2019
Source: National Bureau of Statistics China (NBS). Preliminary accounting results.
Source: NBS. Preliminary accounting results.
4%
5%
6%
7%
8%
9%
2012 2013 2014 2015 2016 2017 2018 2019
6.2
2019 Q1
2019 Q2
20
17
Q4
20
14
Q4
7.9
20
12
Q4
6.47.3
6.9
54
.6
52
.4
51
.3
50
.2
56
.5
54
.0
52
.8
51
.6
56
.3
54
.0
52
.8
51
.6
56
.6
54
.3
53
.4
52
.2
57
.3
54
.9
40
.2
41
.3
41
.0
40
.9 38
.0
39
.5
39
.6
39
.9 38
.9
40
.2
40
.2
40
.5 39
.0
40
.4
40
.5
40
.7 38
.6
39
.9
PrimarySecondaryTertiary
50
%
Contribution to GDP by Sector (%)
Quarterly Data, 2015-2019
Tertiary54.9 (7.0)
Secondary39.9 (5.8)
Primary5.1 (3.0)
(6.3) 2019H1
Q1 Q2 Q3 Q4
2015 2016 2017 2018
Q1 Q2
2019
Q1 Q2 Q3 Q4 Q1 Q2 Q3 Q4 Q1 Q2 Q3 Q4
5.4
29.5
6.19.5
4.5 1.8 8.4 6.9 4.1 2.8
16.63.2
5.8
6.05.9
7.36.2
7.3
2.5
20.6
7.8
5.4
Contribution to GDP and Growth by Industry (%)
First Semester 2019
Source: NBS.
Year-on-year GrowthContribution to GDP
Ag
ricu
ltu
re
Man
ufa
ctu
rin
g
Co
nst
ruct
ion
Wh
ole
sale
&
Re
tail
Tra
nsp
ort
atio
n
Ho
spit
alit
y
Fin
ance
Re
al E
stat
e
ICT
Bu
sin
ess
S
erv
ice
s
Oth
er
Se
rvic
es

In partnership with
6
Labor Market
2019 | 2020& Salary Report
BR
IEF
manufacturing (29.5 percent of China’s economy in the first
semester), and other services (16.6 percent). Other services
are miscellaneous and combines scientific research, services
to households, healthcare, education, and others: no further
breakdown is available to get individual information for each
of sector.
When looking at fixed asset investment (long-term use of
assets, such as land, buildings, and equipment), the total
investment reached RMB 34,889.2 billion during the first
seven months of 2019. At the time of this writing (August
2019), a breakdown of how investment trickles down for
specific industries has not been provided. The only
information available is the variation experienced on a YoY
basis. The industries that presented a higher increase in
investment were: mining, in the secondary sector, with a 27.4
percent increase YoY; education, 18.5 percent; culture,
sports, entertainment (equipment and infrastructure) 15.8
percent; railway transportation infrastructure, 12.7 percent;
and investments in the manufacturing of telecommunications
and computer equipment, 10.5 percent. The most significant
declines in fixed-asset investment came from the following
activities: investment in the manufacturing of railways,
shipbuilding, and aerospace, declined by 10.4 percent in
comparison to the first seven months of 2018; investment in
food processing, 7.6 percent YoY decline; and manufacturing
of electrical machinery and equipment, decreased by 7.5
percent YoY.4
Retail sales of consumer goods reached RMB 22,828.3 billion
in the first seven months of 2019, which marks an 8.3
percent YoY increase. Online sales of physical products
totaled RMB 4,423.3 billion, about 20 percent of all retail
sales and grew 20.9 percent YoY.
Retail data for specific sectors is available in absolute values
(sales volume). One of the most important contributors to
retail sales is automotive sales, which accounts to almost ten
percent of the total retail sales in the first seven months of
the year.
From January to July, according to data provided by the NBS,
automobile sales went up by just 0.6 percent, in stark
contrast to the 8.3 percent YoY increase in retail sales in the
same period. In July 2019, automobile sales declined by 2.6
percent YoY.5
During the first seven months of 2019, fixed-asset
investment in the automotive industry increased 1.8 percent
YoY, compared to 5.7 percent for all manufacturing; the
number of automobile units produced decreased 12.8
percent YoY, amid an overall 5.8 percent YoY increase of the
overall industrial output.
On its first seven months of the year review, China’s
Growth of Retail Sales, Production and Fixed-asset
Investment. Monthly (%)
Fixed-asset investment YoY (monthly)
Industrial production YoY (monthly)
Retail sales YoY (monthly)
Source: NBS. Retail sales and value-added in industrial production growth rates compared to the same period last year. Data is cumulative for fixed-asset investment (total amount of money invested in the in construction and purchase of fixed assets).
4%
6%
8%
10%
12%
14%
2019JulMarDecMar Jun SepMar Jun Sep DecMar Jun Sep DecMar Jun Sep Dec
2015 2016 2017 2018
7.6
5.7
4.8
Retail Sales of Consumer Goods, January - July 2019
Absolute value (RMB 100 million) and Year-on-Year Growth
Rate (%)
Grain, Oil, Food 1,107 9.9 8,064 10.3
Beverages 180 9.7 1,173 9.9
Tobacco and Liquor 287 10.9 2,199 6.6
Garment, Footwear, Knitwear 934 2.9 7,499 3.0
Cosmetics 202 9.4 1,666 12.7
God, Silver, Jewelry 175 -1.6 1,529 2.9
Commodities 462 13.0 3,294 13.9
Household appliances and AV Equipment 713 3.0 5,113 6.2
Traditional Chinese , Western Medicines 485 11.6 3,424 11.0
Cultural and Office Appliances 258 14.5 1,739 5.6
Furniture 163 6.3 1,062 5.8
Communication Appliances 338 1.0 2,581 6.5
Petroleum and Related Products 1,641 -1.1 11,288 2.5
Automobile 3,056 -2.6 22,147 0.6
Building and Decoration Materials 173 0.4 1,083 3.1
July
Value YoY
January to July
Value YoY
Source: NBS.

7
In partnership with
Labor Market
2019 | 2020& Salary Report
BR
IEF
Association of Automobile Manufacturers (CAAM) reported
similar results. The 13.9 million units produced in the first
seven months of 2019 represent a 12.1 percent decrease
YoY; the 14.1million units sold in the first seven months of
2019, a 11.4 percent decline YoY. In July alone, vehicle sales
totaled 1.8 million units, a decline of 4.3 percent YoY.6 In
2019, the main cause for such reduction seems to be the
decision, urged by the central government, by 15 cities and
provinces (which account for more than 60 percent of the
total auto sales in China) to fast-track the adoption of a new
regulatory framework imposing cars built under the so-called
China stage-6 emission standards, ahead of the original 1 July
2020 deadline. Such a move created a vacuum in the market:
consumers were uncertain about whether to buy stage-5 cars
fearing to be unable to resell them. Such uncertainties lead to
a prompting decline of demand and thus a decline of the
number of units sold.7 In addition, as such standard was not
due to apply until 2020, manufacturers and retailers were not
able to provide the market with enough stage-6 certified cars
due to lack of stock.8
The headwinds faced by the automotive industry predate
2019. The total number of cars produced in China had
already decreased by 4.1 percent in 2018 compared to 2017.
It was the first time since 2009 that car production went
down on a yearly basis. Such decline was due to a decrease
in output of passenger cars (5.2 percent decline), whereas
commercial vehicles stood up 1.7 percent.9
Readings on China’s macroeconomic data depends very much
on the vantage point of the observer. The fact that retail
sales have gone up by 8.3 percent in the first seven months
of 2019 does not affect actors invested in the automotive
sector, who have reasons for concern based on the recent
domestic market developments.
The case for the automotive sector shows that the
underpinnings of China’s economy remain within its domestic
market, despite all the focus on trade frictions might suggest.
In July, exports rose unexpectedly 3.3 percent YoY, after a
fall in June by 1.3 percent YoY. Imports, an internal demand-
driven metric, continued to plunge 5.6 percent in July,
following a 7.3 decrease in June.10 China’s exposure to the
world has fallen in relative terms, whereas the world’s
exposure to China has increased.11
However, the role of trade frictions should not be
underestimated. Apart from the effects of these tensions on
trade volumes, the impact on security and confidence is
severe in any well-functioning economy.
Manufacturing in China, January – July 2019 (%)
Fixed-asset Investment and Industrial Output. Evolution
Year-on-Year Growth Rate
ALL Manufacturing 3.3 6.1
Of Chemical Raw Material & Chemical Products 9.4 4.6
Of Medicines 6.9 6.7
Of Fabricated Metal Products -5.2 7.3
Of General-Purpose Machinery 2.1 4.5
Of Special Purpose Machinery 7.2 7.7
Of Automobile 1.8 -12.8
Of Railways, Shipbuilding, Aerospace, Other Transportation Equipment
-10.4 11.4
Of Electrical Machinery & Equipment -7.5 9.7
Of Telecommunications Equipment, Computers and Other Electronic Equipment
10.5 9.1
Fixed-asset investment. Increase Rate (YoY)
Industrial production. Increase Rate (YoY)
Source: NBS.

In partnership with
8
Labor Market
2019 | 2020& Salary Report
BR
IEF
4.3
1.8 1.91.1
-1.1
2.5 2.6
Price Level Development 2015-2018
Variation over the Same Month in the Previous Year (%)
Breakdown of Consumer Price Developments
Average Variations from January to June 2019 (%)
2. Business Sentiment & Price Developments
The unfolding of trade tensions between the U.S. and China,
which have been going on for more than a year, reached new
peaks in August.12 In addition, on 24 May 2019, the China
Banking and Insurance Regulatory Commission (CBIRC) took
over Inner Mongolia’s based Baoshang Bank alleging “severe
credit risk”.13 Despite being a minor player, the move rattled
Chinese markets, with fears that Baoshang Bank could be the
first of many. This prompted the People’s Bank of China
(PBOC) to announce that no further moves were planned to
intervene in other banks, and that it would inject additional
cash reserves into the banking system.14
Both events are taking their toll on the business sentiment.
China’s Caixin / Markit Purchasing Managers’ Index (PMI)
shrank considerably in June, although it attenuated its fall in
July. June’s mark at 49.4 was its lowest reading since January
when the indicator came in at 48.3. In July it bounced to
49.9. Caixin / Markit’s index monitors private companies and
smaller firms than the official PMI from NBS. The latter
focuses on big businesses and state-owned enterprises and
presented a similar trend: remaining at 49.7 in July, an
increase from 49.4 in June. Both manufacturing PMIs
indicate the manufacturing sector contracted (in both indexes
the 50-point mark separates growth from contraction).15
The deterioration in the PMI sentiment data was expected,
after the trade tension escalated in May 2019. From 11 May,
tariff increased to 25 percent from the earlier ten percent
rate – applied to USD 250 billion worth of Chinese imports
to the United States. The U.S. was also putting together a
tariff of up to 25 percent on a further USD 300 billion of
Chinese goods, turning up the pressure on the Chinese
economy. China reacted by placing variable tariffs on USD 60
billion of U.S. imports. Industrial profits stood at RMB 515.39
billion in April (only a month before the escalation of the
trade tensions), decreasing by 3.7 percent compared to a
year earlier. This was the largest percentage decline since
December 2015. With further tariffs about to kick in on
Chinese exports, there is a great possibility for the downward
trend to continue.16
The PMI is an important economic indicator globally watched
by investors to anticipate economic trends. The fall in the
headline index was mostly driven by weaker new orders
(weak demand).17 Export orders dropped sharply, suggesting
the U.S. latest tariff hike may already be undermining foreign
demand. While the official NBS and Caixin non-
manufacturing PMIs remained above contraction levels in
July, 53.7 and 51.6 respectively, their stagnation and decline
point to continued skepticism and challenges for China’s
economy.18
Business Sentiment 2019
Purchasing Managers’ Index (PMI)
Source: Caixin / Markit. PMI values >50 indicate expanding business; values <50 indicate contraction.
Source: NBS.
ManufacturingServices
Source: NBS.T
ran
spo
rtat
ion
&
Co
mm
un
icat
ion
Fo
od
, To
bac
co
&L
iqu
or C
loth
ing
Ho
usi
ng
Ho
use
ho
ld
arti
cle
s &
se
rvic
es
Ed
uca
tio
n
& L
eis
ure
He
alth
care
The only signal of détente came in the weeks leading to and
during the G20 Summit, held in Osaka (Japan) at the end of
June, where Presidents Xi and Trump agreed to resume trade
talks. However, such respite was short lived: on 1 August, the
Trump administration said U.S. would impose ten percent
tariffs on another USD 300 billion of Chinese goods, starting
1 September; on 5 August, the U.S. Department of Treasury
declared China in a press release to be a "currency
manipulator".19
-6%
-4%
-2%
0%
2%
4%
6%
8%
10%
JAN
MA
R
MA
Y
JUL
SE
P
NO
V
JAN
MA
R
MA
Y
JUL
SE
P
NO
V
JAN
MA
R
MA
Y
JUL
SE
P
NO
V
JAN
MA
R
MA
Y
JUL
Producer Price Index (PPI)Consumer Price Index (CPI)
-0.3
2.8
53.6
51.1
54.4 54.5
52.752
51.6
48.349.9
50.850.2 50.2
49.4 49.9
JAN FEB MAR APR MAY JUN JULY

9
In partnership with
Labor Market
2019 | 2020& Salary Report
BR
IEF
Weaker demand caused a slowdown in manufacturing
activity which decreased producer prices (0.3 percent decline
YoY). Particularly weak was the evolution of prices for oil and
natural gas extraction, and paper and paper product
manufacturing, which decreased by 8.3 percent and 7.1
percent, respectively, compared to the same period last
year.20
July’s consumer prices grew in annual terms (2.8 percent)
driven by higher food prices: fruit prices increased by 39.1
percent compared to a year earlier, while pork prices went up
27 percent. This increase was caused by extreme weather
conditions and an outbreak of African swine fever that has
reportedly cut the pig population in China by about a third
from 360 million.21 The 2.8 percent inflation in July 2019 is
the second highest since January 2016 (the highest being 2.9
percent, in February 2018).

In partnership with
10
Labor Market
2019 | 2020& Salary Report
BR
IEF
Secondary PrimaryTertiary
Distribution of Workforce Across Sectors (%)
China’s Age Demographic Composition of Population (%)
Source: NBS; *2025: Forecast from World Bank.
Source: NBS.
22.9 20.3 16.6 16.5 16.9 16.6
70.1 72.0 74.5 73.0 71.2 69.2
7.0 7.7 8.9 10.5 11.9 14.2
Aged 0 to 14 yearsAged 15 to 64 years>65 years
2000 2005 2010 2016 2025*
34.1 34.6 35.7 36.1 38.5 40.6 42.4 43.5 44.9 46.3
27.8 28.7 29.5 30.3 30.1 29.9 29.3 28.8 28.1 27.6
38.1 36.7 34.8 33.6 31.4 29.5 28.3 27.7 27.0 26.1
2009 2010 2011 2012 2013 2014 2015 2016 2017 2018
Distribution of Urban & Rural Population in China (%)
Source: NBS.
49.9 51.3 52.6 53.7 54.8 56.1 57.3 58.5 59.6
50.1 48.7 47.4 46.3 45.2 43.9 42.7 41.5 40.4
2010 2011 2012 2013 2014 2015 2016 2017 2018
RuralUrban
expectancy is 76.4 years, according to 2017 data from the
World Bank.27 Retirement age varies: 60 years for males, 55
for females in civil service jobs, 50 years otherwise. Increasing
the retirement age has been the subject of discussion for
several years now, as it could positively impact China's labor
force supply and pension system (in the short term).
However, there has not been any concrete policy
implementation.
China's working population decreased from its peak in 2011
of 925 million to 897 million in 2018. Back then, the ratio
worker to pensioner was 3.1-to-1. By 2050, a third of China’s
population will be over the age of 60. The Ministry of Human
3. Labor Market Structure
China’s decades-old household registration system, the
hukou, underwent a significant shift in 2019. The hukou
system designates a resident’s status as being either rural or
urban based on the resident’s registered birthplace. It
establishes a worker from the countryside not being entitled
to public services in a city, despite working and living there.
In yet another move to foster urbanization, the country will
relax its hukou residency rules in small and mid-size cities.
The announcement came on April 2019, via the National
Development and Reform Commission (NDRC).22 Under the
2019 Urban Development Plan, China aims to increase its
urbanization rate by one p.p. this year, to stay on the course
of its 60 percent urbanization target established at the 13th
Five Year Plan (FYP). China is well poised to achieve it: by the
end of 2018, the urban resident population in China totaled
831.4 million, 59.6 percent of the country’s total.23 At the
current pace, urban population could reach 61 percent by
2020.
The 2019 Urban Development Plan states that all cities with
a population under three million to “completely lift” all
restrictions, and cities between three and five million
“comprehensively lift or relax” restrictions on household
registration.24 Outside the scope of the reform are left
China’s super cities, between five and ten million (Chongqing,
Tianjin, Wuhan, Chengdu, Nanjing, Zhengzhou, Hangzhou,
Shenyang, Changsha), and megacities with populations over
ten million (Beijing, Shanghai, Shenzhen, Guangzhou).25
Therefore, the announcement aims mostly to tier-3 and tier-
4 cities, adding pressure to municipal governments to invest
in improving their public services offerings. The largest tier-1
and some tier-2 cities, often the most attractive to migrant
workers in terms of job expectations but not in living costs,
will continue to have more restrictive hukou policies.26
With the relaxation on household registration conditions, in
the context of a slowing economy and a rapidly aging
population, the government expectation is to reboot migrant
flows, by removing obstacles when relocating to small or mid-
size cities (more on migrant workers later in this section).
Under the new regulations, migration pressure should be
released of tier-1 cities – where labor and resources are
converging disproportionately – and redirect migrant worker
flows into tier-2, tier-3 and tier-4 cities, which are in higher
need of a boost in their urbanization, housing prices,
consumption, and productivity.
A further lever the Chinese government could implement to
alleviate the pressing issue of a shrinking labor force is an
increase in the age of retirement. China’s average life
2018

11
In partnership with
Labor Market
2019 | 2020& Salary Report
BR
IEF
Resources and Social Security (MOHRSS) estimates the ratio
worker to pensioner will decrease to only 1.3-to-1.28 In
mainland China, the number of citizens older than 60 hit 249
million in 2018, which amounts to about 18 percent of the
total population.29 According to an analysis by sociology Prof.
Wang Feng, University of California, if China was to maintain
the current welfare benefits at the current aging pace,
spending on education, healthcare, and pensions could go up
from ten percent of the GDP to 23 percent by 2050. 23
percent of the GDP equals the share of the total government
spending today.30
In 2016, China raised the limit of how many children all
families could have to two children, hoping to foster a baby
boom. Though 2016 saw a brief uptick, birth rates have fallen
in 2017 and 2018.31 There were 15.2 million births in 2018,
a decline of more than eleven percent from 2017.32 The
slowing rates of new births paired with an increase of life
expectancy creates challenges for the government. First, a
smaller working population in the future could cause
difficulties in paying pensions for an increasing retired
population; second, a shrinking labor force could reduce
consumer spending and have an impact on the economy in
China, reinforcing, in a negative loop, the difficulties to pay
pensions.33
According to a report from the World Social Security Center
at the Chinese Academy of Social Sciences, the urban worker
pension fund will reach its peak at RMB seven trillion in
2027. Following that, it will drop steadily reaching zero by
2035. Social security contribution rates are mandatory
(composed by up to 20 percent of the employees’ salaries by
the employer, and another eight percent by the employees).
To add further stress to the pension system, China’s State
Council announced in March 2019 the employer pension
contribution rate would be cut to 16 percent, as part of a
package of measures designed to support businesses.34
Despite China’s pension funds being critical to the country’s
social security system, the fund would run on a deficit
without subsidies from the central government: RMB 528.5
billion have been budgeted to support social security
payments in 2019, a 9.4 percent increase from the previous
year.35 Were those subsidies to be put on hold,
approximately half of China’s provinces would be geared
towards pension fund deficit by 2022, compared to just six
provinces in 2015.36 The central government created a
special fund in July 2018 to shift pension funds from
provinces with large working populations, like Guangdong, to
more impoverished regions where the number of retirees is
large, like Liaoning.37
Besides initiatives, like the 996 working hour system (working
from 9 am to 9 pm, six days a week),38 more sustainable
proposals have not been put forward to tackle the
fundamental imbalances currently present in China’s labor
market structure.

In partnership with
12
Labor Market
2019 | 2020& Salary Report
BR
IEF
5.44.4
3.9
2.4
1.91.3 1.5 1.7
0.6
5.5
3.43.0
1.71.3
0.4 0.31.5
0.5
5.2
5.95.4
3.6
2.8 2.73.4
2.0
0.9
2010 2011 2012 2013 2014 2015 2016 2017 2018
Source: NBS. Migrant workers outside inter province: Working in a province other than that of their household registration; Migrant workers outside inner province: Working in the same province of their household registration.
Local migrant workers
Migrant workers outside (inner+inter)
Total migrant workers
West27.5
East36.1
Central33.1
Northeast3.4
Source: NBS.
-0.2
0.9
1.3 1.3
2018 Growth over 2017 (in %)
Migrant Workers Distribution of Employment by Sector
of Economy 2015 - 2018 (%)
Migrant Worker Distribution and Evolution (%)
By Region in 2018 and Evolution Versus 2017
Source: NBS. Starting from 2016 the Northeast region was added into the official reporting.
Secondary PrimaryTertiary
44.5 46.7 48.0 50.5
55.1 52.9 51.5 49.1
0.4 0.4 0.5 0.4
2015 2016 2017 2018
Migrant Workers
Migrant workers have been contributing to China’s economic
success for the past three decades. As the country bet its
economic development to its eastern coast, millions migrated
to cities there. Workers settled around the three main
industrial regions: the Bohai Bay Economic Ring, the Yangtze
River Delta, and the Pearl River Delta.
Migrant workers amount to 20.6 percent of China’s total
population. As of 2018, the number of migrant workers
totaled 288.4 million, according to data from the NBS.39 That
is a 0.6 percent increase in comparison with 2017, the lowest
increase during the period from 2010 to 2018, putting an
end to two consecutive years of accelerated growth.
Among migrant workers, local migrant workers (those working
within the villages and towns where their hukou is) grew by
0.9 percent YoY, 1.1 p.p. below 2017. Migrant workers going
out (to work outside of the villages and towns where their
hukou is) grew at 0.5 percent YoY, one p.p. slower than in
2017.40 Migrant workers going out to seek jobs inside their
province increased by 1.7 percent (96.7 million in 2018, 95.1
million the year prior), whereas the number of migrant
workers going out seeking jobs across provinces experienced
a 1.2 percent decrease (75.9 million in 2018, 76.8 million in
2017).
Migrant workers concentrate mostly in China’s eastern and
central regions, accounting together for 69.2 percent of the
overall migrant working population.41 For the first time since
2015, there has been a slight decrease in the migrant
population in eastern regions (down 0.2 percent). In the other
areas, despite the growth, its pace has been reduced in some
instances by nearly a third. The migrant working population in
China’s central region grew 0.9 percent YoY, half the
increase in 2017; in Western China, the growth rate was 1.3
percent YoY in 2018, two p.p. below 2017; Northeast China,
which accounts only for 3.4 percent of the migrant working
population, saw a 1.3 percent YoY increase in 2018, 1.8 p.p.
below 2017’s growth.
As pointed out in previous editions of this report, the number
of migrant workers employed in the secondary industry
(manufacturing, mining, construction) has been steadily
declining. For the first time, in 2018 the number of migrant
workers employed in the secondary sector was lower than in
the services sector: 49.1 percent in the secondary sector,
50.5 in the services sector.
At the specific industry level, the largest number of migrant
workers are employed in manufacturing & mining (27.9
percent of all migrant workers) and construction (18.6
percent). Manufacturing & mining saw a decrease of two p.p.
Growth Rate of Migrant Workers (%)
Migrant Workers Distribution: 2017 & 2018
In millions: 2018, (2017)
Source: NBS.
288.4 Total
Local migrant workers
Migrant workers going outside: Inter-province
115.7
Migrant workers going outside: Inner-province
96.7
75.9
(114.7)
(76.8)
(95.1)(286.5)

13
In partnership with
Labor Market
2019 | 2020& Salary Report
BR
IEF
0.1
1.5
-3.9
-0.3
2.6
Migrant Workers Distribution of Employment by
Industry. 2017 and 2018 (%)
Source: NBS. No data provided for “Other services”.
3,4
44
3,9
18
3,0
48
4,0
48
3,0
19
3,0
22
3,4
85
3,7
32
4,2
09
3,2
63
4,3
45
3,1
48
3,2
02
3,7
21
8.47.4 7.0 7.3
4.3
6.06.8
0.0
1.0
2.0
3.0
4.0
5.0
6.0
7.0
8.0
9.0
10.0
2000
4000
Manufacturing & Mining
Construction Retail Transportation Hospitality Real estate ALL
in the total number of migrant workers in comparison with
2017. In 2018 construction experienced a decrease of 0.3
p.p. over its 2017 employment contribution.
In the tertiary sector the migrant worker percentage
increased for the following industries: real estate (residential
services, repairs, and other services), with 12.2 percent of the
total migrant worker employment; wholesale and retail, 12.1
percent; and other services, 12 percent.
According to official data, the monthly income of a migrant
worker averaged RMB 3,721 in 2018, a 6.8 percent YoY
increase. The highest industry-specific YoY increase is for
manufacturing and mining migrant workers, with an 8.4
percent jump and an average monthly income of RMB 3,732.
Construction and transportation present a 7.4 and 7.3
percent YoY increase, respectively. The current average
monthly income for migrant workers in construction
moderately rose to RMB 4,209, and in transportation RMB
4,345. The lowest income levels are for real estate,
hospitality, and retail workers.
The average age of a migrant worker is 40.2 years, 0.5 years
older than last year. China’s migrant working population is
aging rapidly: those older than 40 represent 47.9 percent of
the total as of 2018, whereas in 2011 they made up for 38.3
percent. The youngest cohort, aged 16 to 30 years, accounts
for 27.6 percent in 2018, as opposed to 39 percent in 2011.
Growth year-on-year (%)Income 2018Income 2017
Age Composition of Migrant Workers, 2015 - 2018 (%)
Source: NBS.
32.9 31.9 29.9 27.6
49.2 49 48.8 50
17.9 19.1 21.3 22.4
2015 2016 2017 2018
Aged 16 to 30 yearsAged 31 to 50 years>50 years
Tertiary10.9
No Schooling1.2
Elementary School15.5
Junior High School55.8
Senior Middle School16.6
Migrant Workers Distribution by Education in 2018 (%)
and Comparison with 2015 (p.p.)
Variation over 2015 (in p.p.)
Source: NBS.
No Schooling
Tertiary
29.9
18.9
12.3
6.6 6.2
11.3 11.6
27.9
18.6
12.1
6.6 6.7
12.2 12.0
Manufacturing & Mining
Construction Retail Transportation Hospitality Real estate
Other services
2017 2018
Migrant Workers Monthly Income (in RMB)
Source: NBS. Agriculture (0.4%) and other secondary industries (3.5%) not included in the graphic.
Secondary Sector
Tertiary Sector
Elementary
Jr. High School
Sr. Middle School

In partnership with
14
Labor Market
2019 | 2020& Salary Report
BR
IEF
42.138.0
31.9 32.0
47.3
2018 Q1 2018 Q2 2018 Q3 2018 Q4 2019 Q1
Zhaopin Ratio of Job Applications by Job Vacancies
Source: Competitive index by Zhaopin.com. * Number of resume applications divided by the number of job vacancies: How many applicants on average per job vacancy published.
4. Labor Market Developments
China’s urban unemployment rate, provided by the MOHRSS,
amounted to 3.67 percent in the first quarter of 2019.42 The
rate is below the surveyed unemployment rate of five percent
in June, provided by the NBS, which it is based on a monthly
31-city survey.43 Data from the NBS is considered to be more
reliable than that of the MOHRSS, as the former is elaborated
following the international standards by the International
Labor Organization (ILO). Additionally, quarterly
unemployment rates from the MOHRSS refers to urban
registered jobless rate: the rate of unemployment leaves out
those in search for a job in urban areas who do not have an
urban registration.44
Since 2014, the MOHRSS publishes quarterly ratios of job
vacancies to job seekers, to gauge labor shortages or labor
oversupply.45 Following on MOHRSS data, in Q1 2019, there
were 5.9 million job vacancies (3.3 percent increase over Q1
2018) and 4.6 million job seekers (0.3 percent decrease over
the same period last year). This results in a ratio of job
vacancies to job seekers of 1.28, signaling labor shortage.
Over the years, the ratio presents a steady upward trend. This
indicates that the labor market is unable to efficiently allocate
the required amount of human resources to cover all the job
openings. With every passing year this gap increases. The
pace has hastened from Q4 2017, with the ratio remaining
above the 1.20 level. At the regional level, MOHRSS data for
East, Central China reproduces similar labor shortages as seen
for China overall. In Western China, the ratio increases to
1.40. Although the number of job seekers went up there by
14.1 percent over the same period last year, job demand
increased by 21.4 percent.46
Private online recruitment platform Zhaopin tracks job
vacancies and job applications from white collar professionals
across 37 major cities. In contrast with MOHRSS trends, from
Zhaopin’s research in Q1 2019, there was an average of 47.3
job applicants per job vacancy, a 10.5 percent increase over
the first quarter of 2019.47 These percentages point directly
to oversupply, and not labor shortages as per the official data.
Two very different snapshots from two different sources of
the country’s job market, amid concerns of whether the
economic slowdown seen in 2019 will take its toll in job
losses.
In the first half of 2019, a total of 7.4 million people were
newly employed (67 percent of the annual target), according
to the NBS. By the end of the year, it is expected that 8.3
million new graduates will enter the labor market.
Summary of Labor Market Developments
Metrics Last Previous Reference Frequency
Employed Population(Tens of thousands)
77,586 77,640 Dec. 2018 Yearly
Unemployment Rate(%)
3.67 3.80 March 2019 Quarterly
Unemployed Population(Tens of thousands)
974 975 Dec. 2018 Quarterly
Wages(RMB/month)
6,872 6,343 Dec. 2018 Yearly
Minimum Wages*(RMB/month)
2,480 2,420 Dec. 2018 Yearly
Population(Million)
1,395 1,390 Dec. 2018 Yearly
Source: Tradingeconomics.com China Indicators, from NBS and China Ministry of Human Resources (MOHRSS) data. * Minimum wage in Shanghai (the highest minimum wage in China).
1.23 1.22 1.231.271.28
1.26 1.26
1.4
China East Central Western
2019Q12018Q1
MOHRSS Ratio of Job Vacancies to Job Seekers
Overall China and by Region 2018 Q1 vs. 2019 Q1
Source: MOHRSS based on the tracking of 90 cities. *A value > 1 indicates labor shortages (demand greater than supply); a value < 1 means oversupply.
Source: MOHRSS based on the tracking of 90 cities. * A value > 1 indicates labor shortages (demand greater than supply); a value < 1 means oversupply.
1.071.05
1.11.13 1.13
1.11
1.16
1.22 1.23 1.231.25
1.27 1.28
Q1 Q2 Q3 Q4 Q1 Q2 Q3 Q4 Q1 Q2 Q3 Q4 Q1
2016 2017 2018 2019
MOHRSS Ratio of Job Vacancies to Job Seekers
Overall China 2016 Q1 to 2019 Q1

15
In partnership with
Labor Market
2019 | 2020& Salary Report
BR
IEF
5. Notes
1. Miao Han et al., “China Economy Slips to Record Low Growth",
Bloomberg.com, 15 July 2019.
2. Neil Irwin, “How the Recession of 2020 Could Happen”, The New
York Times, 17 August 2019. “China and the world. Inside the
dynamics of a changing relationship”, McKinsey Global Institute,
July 2019.
3. Information and communication technology (ICT). OECD Library.
https://www.oecd-ilibrary.org/science-and-technology/
information-and-communication-technology-ict/indicator-
group/english_04df17c2-en, accessed 27 August 2019.
4. “Investment on Fixed Assets for the First Seven Months of 2019”,
National Bureau of Statistics (NBS) Press Release, 16 August
2019.
5. “Total Retail Sales of Consumer Goods up by 7.6 percent in July
2019”, NBS Press Release, 18 August 2019.
6. “China Flash Report, Sales Volume 2019”, Marklines.com, 5
September 2019. https://www.marklines.com/en/statistics/
flash_sales/salesfig_china_2019, accessed 6 September 2019.
7. In June 2019 authorities clarified that stage-5 cars could be
resold.
8. Yilei Sun, Norihiko Shirouzu, “Behind the plunge in China auto
sales”, Reuters.com, 1 July 2019.
9. “Production of cars in China from 2009 to 2019 (in 1,000 units)”,
Statista.com, https://www.statista.com/statistics/281133/car-
production-in-china/, accessed 27 August 2019.
10. Sidney Leng, “China’s exports and imports both fell in June, as
higher US trade war tariffs blitz Chinese economy”, SCMP, 12
July 2019.
11. “China and the world. Inside the dynamics of a changing
relationship”,McKinsey Global Institute, July 2019.
12. 29 June, trade talks to restart after presidents Xi and Trump
reached a tentative truce days before the G20 Summit. 9 July,
U.S. exempts 110 Chinese products from 25 percent tariffs. 16
July, Trumps threatens tariffs on USD 325 billion of Chinese
goods. 31 July, Shanghai trade talks end with little progress
being made. 1 August, Trump says U.S. will impose 10 percent
tariffs on another USD 300 billion of Chinese goods, starting 1
September. 5 August, the U.S. Department of Treasury declares
China to be a “currency manipulator”. That same day, Chinese
companies suspend new U.S. agricultural product purchases. 13
August, U.S. delays tariffs on certain products and removes
items from the list; U.S. and China agree to talk again in two
weeks. For a detailed timeline, see https://www.china-
briefing.com/news/the-us-china-trade-war-a-timeline/, accessed
27 August 2019.
13. “China's Baoshang Bank taken over for one year due to 'serious
credit risks’”, China Daily, 24 May 2019.
14. Andrew Galbraith, “China central bank urges calm after
Baoshang takeover”, Reuters.com, 3 June 2019.
15. Karen Yeung, “China factory activity contracted in June as US
trade war tariff increase in May starts to bite”, SCMP, 1 July
2019.
16. Finbarr Bermingham, John Carter, “China’s manufacturing index
drops into negative territory in May as economic pressures
mount”, SCMP, 31 May 2019.
17. The Caixin China PMI is compiled from surveys to business
owners and supply chain managers on a range of topics,
including new orders, employment trends or delivery times. The
answers are then boiled down into one number, in a scale
between 0 and 100. A mark above 50 indicates the economy is
expanding. Below 50 suggests it is contracting.
18. See Note 16.
19. “Treasury Designates China as a Currency Manipulator”, U.S.
Department of Treasury Press Release, 5 August 2019.
20. Yawen Chen, Ryan Woo, “China producer prices fall for first
time in three years, deflation worries resurface”, Reuters.com, 9
August 2019.
21. Huileng Tan, “China’s food prices jump 9.1% in July as the
country battles African swine fever”, CNBC, 9 August 2019.
Tom Hancock, “China swine fever hits small farmers and rural
communities hard”, Financial Times, 10 July 2019.
22. “China's comprehensive relaxation of settlement restrictions”,
BBC China, 11 April 2019. In Chinese.
23. NBS Database. http://data.stats.gov.cn/english/easyquery.htm
?cn=C01, accessed 27 August 2019.
24. Zheng Yangpeng,“What does China’s move to relax hukou
residency curbs mean for the property sector?”, SCMP, 11 April
2019.
25. Zoey Ye Zhang, “China is Relaxing Hukou Restrictions in Small
and Medium-Sized Cities”, China-Briefing.com, 17 April 2019.
26. See Note 25.
27. Life expectancy at birth, total (1960-2017). The World Bank.
https://data.worldbank.org/indicator/SP.DYN.LE00.IN?locations
=CN, accessed 26 August 2019.
28. Viola Rothschild, “China’s pension system is not aging well”, The
Diplomat, 6 March 2019.
29. Frank Tang, “China’s state pension fund to run dry by 2035”,
SCMP, 12 April 2019.
30. Wang Feng, Yong Cai, “China Isn’t Having Enough Babies”, The
New York Times, 26 February 2019.
31. Steven Lee Myers, “China’s Looming Crisis: A Shrinking
Population”, The New York Times, 21 January 2019.

In partnership with
16
Labor Market
2019 | 2020& Salary Report
BR
IEF
32. See Note 29.
33. See Note 31.
34. See Note 29.
35. See Note 29.
36. See Note 28.
37. See Note 29.
38. The 996 working hour system gained traction both in social
media and news outlets in China (and abroad) when, in April
2019, Jack Ma - founder of Alibaba Group - said in an internal
company post in Weibo: “996 is not a problem (…) doing
overtime is bliss”. Later, JD.com’s founder Richard Liu chimed in
to endorse Jack Ma words. The 996 working hour system is an
extremely polarizing subject: it is against China’s Labor Contract
Law to demand employees to work overtime without
compensation; additionally such working schedule imposes
serious hurdles on employees willing to balance personal with
professional life, an already daunting endeavor even in the
traditional 8:00 to 17:00 working schedule, given the pervasive
use of technology (email, wechat); finally, it does not take into
account health related issues (stress, fatigue, insufficient
reparatory sleep) that such working schedule induces, ultimately
impacting performance and productivity within the same
organizations that encourage it.
39. China has two types of hukou: agricultural and non-agricultural.
Migrant workers (农民工, nóng mín gōng) are workers whose
hukou remains in the country side but who have been working in
a non-agriculture activity for more than 6 months.
40. The NBS distinguishes between “Local Migrant Workers” (本地
农民工, běn dì nóng mín gōng) and “Migrant Workers who go
out” (外出农民工 , wài chū nóng mín gōng). Local migrant
workers are working within the villages and towns where their
hukou is; migrant workers who go out work outside of the
villages and towns where their hukou is in, either inside or
outside the province of their hukou.
41. The direct translation of 农民工 is “peasant workers”, referring
to people who have agriculture hukou but work in secondary or
tertiary related activities. However, since rural areas seldom
provide non-agricultural jobs, Chinese media uses 农民工 to
specifically refer to ‘peasant workers’ who ‘migrate’ to city areas
and do non-agricultural work.
42. A local migrant worker 本地农民工 indeed does not migrate.
Consider a Shanghainese holding a Shanghainese hukou that
happens to be an agricultural hukou (even Shanghai has rural
areas). He/she will be considered as a local migrant worker if
he/she is doing non-agricultural work in Shanghai (i.e., driving a
cab).
41. According to the NBS, Eastern region includes Beijing, Tianjin,
Hebei, Shanghai, Jiangsu, Zhejian, Fujian, Shandong, Guandong
and Hainan; Central: Shanxi, Anhui, Jianxi, Henan, Hubei;
Western: Inner Mongolia, Guangxi, Chongqing, Sichuan, Guizhou,
41. Yunnan, Tibet, Shaanxi, Gansu, Qinghai, Ningxia and Xinjiang;
Northeast: Liaoning, Jilin, and Heilongjiang.
42. China Economic Indicators 2019. Tradingecononics.com.
https://tradingeconomics.com/china/indicators, accessed 27
August 2019.
43. “China urban unemployment rate”, NBS Press Release, 15 July
2019.
44. Martin Hart-Landsberg, “China has an unemployment problem”,
Monthly Review Online, 14 March 2019.
45. The MOHRSS samples data from around 200 public
employment and talent service organizations. Each quarter
covers a varying number of cities (usually between 90 and 110).
The latest data available, by the time of this writing, was from
the first quarter of 2019 and the number of cities sampled was
90.
46. “Analysis Market Supply and Demand. First Quarter 2019”,
MOHRSS, 24 April 2019. http://www.cjob.gov.cn/rdzx/
100062.jhtml, accessed 27 August 2019. In Chinese.
47. “2019 Spring recruits. How much is the white collar salary?”,
Sina.com, 17 April 2019. In Chinese.

17
In partnership with
Labor Market
2019 | 2020& Salary Report
BR
IEF
Wage Growth Indicators China (%)
2012-2018. Nominal Growth
9.410.6
9.57.9 7.8 7.3 6.9 6.7 6.9 6.6 6.3
11.613.3
14.4
11.9 10.1 9.5 10.18.9
10.011.0
9.9
09 10 11 12 13 14 15 16 17 18 2019*
GDP and Wage Growth (%)
2009-2019
Wage growth (nominal)GDP growth
Source: NBS & German Chamber of Commerce in China analysis. *National wage growth estimate. The number of provinces issuing adjustments for wage guidelines & minimum wages varies every year.
Source: NBS & German Chamber of Commerce in China analysis. *2019 GDP growth until June. 2019 Wage growth: Estimates from the Chamber’s own analysis.
Minimum wageNational wageWage guidelines
Average Wage and Wage Growth
2009-2019
Wage growth, nominal (in %) Average wage RMB
32
,24
4
46
,76
9
82
,46
1
90
,61
3
0%
4%
8%
12%
16%
20%
24%
0
15,000
30,000
45,000
60,000
75,000
90,000
105,000
09 10 11 12 13 14 15 16 17 18 2019*
Source: NBS & German Chamber of Commerce in China analysis. * Average wage and wage growth: Estimates from the Chamber’s own analysis. Note: Annual wages based on 12 months; all wages are pre-tax.
II Wage Developments in China
1. National Wage Developments
The annual wage in China averaged RMB 82,461 in 2018 -
an increase of 11 percent in comparison to 2017 – according
to data from the NBS. The increase has been one p.p. above
the 10 percent forecasted by the German Chamber of
Commerce in China.1
According to online recruitment platform Zhaopin.com, the
annual salary in China averaged RMB 96,000 in the first
quarter of 2019: a 5.5 percent increase in comparison with a
year ago, but a drop of 0.6 percent from the last quarter of
2018.2
The German Chamber of Commerce in China estimates for
2019 project a wage increase of 9.9 percent and an average
annual compensation of RMB 90,613. Projections are based
on the current context of slower domestic growth and
inflationary pressures.
China’s per capita disposable income averaged RMB 15,294
year in the first six months of 2019, an increase of 8.8
percent YoY in nominal terms, according to preliminary
accounting results published by the NBS in July 2019.3 Since
inflation in China was at 2.7 percent YoY in June 2019, the
increase in real terms on per capita disposable income was
6.1 percent. The per capita disposable income of urban
households (RMB 21,342) represented 2.7 times that of rural
households (RMB 7,778).
11.9
10.1 9.5 10.1
8.910.0 11.0
9.9
14.0
13.6
11.610.2
8.57.8 7.6 6.4
20.2
17.0
13.112.4 12.8
10.7 11.2
8.6
2012 2013 2014 2015 2016 2017 2018 2019*

In partnership with
18
Labor Market
2019 | 2020& Salary Report
BR
IEF
Source: NBS & German Chamber of Commerce in China analysis.* 2019 Regional wage developments estimates.
2. Provincial Wage Developments
The most significant wage increases took place in Central
China regions (Shanxi, Anhui, Jiangxi, Henan, Hubei, and
Hunan). According to the latest official data available, the
overall increase for Central China regions was 12.7 percent in
2018. In 2017, Central China also claimed the highest wage
increase (10.7 percent). Contrary to what it might look based
on the developments for 2017 and 2018, the average salary
increase in Central China during the six years from 2013 to
2018 (9.5 percent) is lower than that of West (10.4 percent)
and East (9.7 percent) China regions.4
For the third consecutive year, Northeast China (Liaoning,
Jilin, and Heilongjiang) register the lowest wage increase: 8.9
percent, in 2018. It remains the region with the lowest
annual salaries (RMB 65,411). This is 0.70 times the average
compensation in East China, which is the highest paying
region (annual salary of RMB 93,253 in 2018, and an
estimated RMB 102,324 for 2019).
Since 2011, using East China as the baseline, only West
regions have produced salary increases closing the relative
gap in compensation: from West China salaries being 0.77
times those of the East in 2011, to be 0.81 in 2018. Central
China compensation in 2011 was 0.74 times that of East
China, the same proportion as in 2018. Northeast regions
have seen an increase in their compensation gap towards
East China during 2011 to 2018: the average compensation
in Northeast was 0.72 times that of the East in 2011,
whereas it was 0.70 times by 2018.
For an assessment of wage increases at the province level, an
overview is provided in the graph Average Wage Developments
by Province, which combines official data increases from 2014
to 2017 with projected increases for 2018 and 2019. Apart
the average increase for Tibet (addressed in detail in the 11th
Edition of the Salary Report),5 from the eleven provinces with
increases above China’s average, six are from Western China
(Yunnan, Guangxi, Guizhou, Gansu, Qinghai, and Tibet). The
other provinces are Hainan, Hebei, and Guangdong (which
includes Shenzhen and Guangzhou) in the East, and Hubei
and Hunan in Central China.
Wage Growth by Region (%)
2011-2019. Nominal Growth
Central, North East and West China Compensation
As Factor of East China’s Compensation 2011-2018
Source: NBS & German Chamber of Commerce in China analysis.
Average Wage Developments by Province (%)
2014-2019
West Central East =1Northeast
0.7
7
0.7
9
0.8
0
0.8
0
0.8
1
0.8
1
0.8
1
0.8
1
0.7
4
0.7
5
0.7
3
0.7
3
0.7
2
0.7
2
0.7
2
0.7
4
0.7
2
0.7
3
0.7
4
0.7
2
0.7
2
0.7
1
0.7
0
0.7
0
2011 2012 2013 2014 2015 2016 2017 2018
Source: NBS & German Chamber of Commerce in China analysis. According to data from the NBS
salary growth in Tibet in 2015 was 59.8%, due to a one-time transference of RMB 132.09 billion on
the 50th anniversary of the establishment of Tibet Autonomous Region, resulting in the region topping
the ranking of regional wage developments.
13.0
11.6
11.1
10.9
10.9
10.7
10.5
10.4
10.2
10.2
9.9
9.8
9.8
9.7
9.6
9.5
9.4
9.4
9.3
9.1
8.7
8.6
8.6
8.5
8.4
8.4
8.3
8.0
7.7
7.2
6.6
Tibet
Yunnan
Guangxi
Guizhou
Hainan
Hebei
Hubei
Hunan
Gansu
Guangdong
Qinghai
CHINA
Sichuan
Shandong
Jiangxi
Shanghai
Jilin
Zhejiang
Henan
Chongqing
Beijing
Tianjin
Fujian
Xinjiang
Ningxia
Heilongjiang
Jiangsu
Shaanxi
Anhui
Liaoning
Inner Mongolia
Shanxi
18.9
14.4
11.9
10.1 9.5 10.18.9
10.011.0
9.9
0%
4%
8%
12%
16%
2011 2012 2013 2014 2015 2016 2017 2018 2019*
West Central East ChinaNortheast

19
In partnership with
Labor Market
2019 | 2020& Salary Report
BR
IEF
3. Minimum Wages and Wage Guidelines
Wage guidelines are issued by provincial and local
governments, based on the economic development of the
regions they administer. They are not mandatory but meant
to provide a reference for wage increases by percentage over
base salary levels.6 Although the guidelines are supposed to
be published annually before the end of March, the reality is
that few local governments do. Publishing dates, when
guidelines are formulated, are usually pushed to the second
half of the year. For instance, 21 out of 31 provinces issued
wage guidelines in 2018. Of those, 14 were published in the
second half of the year.
At the time of this writing, only five provinces have issued
wage guidelines in 2019: Shanghai, and Shandong in East
China; Inner Mongolia, Shaanxi, and Xinjiang in West China.
For the first time, Shanghai issued recommended ranges and
not specific percentages, for the lower (minimum) guideline
and the reference (average) baseline: two percent to three
percent for the minimum tranche, and five to six percent for
the average. On March 2019, Shandong province issued its
guideline of seven percent for the average reference
(identical to that of 2018) but did not release guidelines for
the lower and upper tranches. Shaanxi kept the upper wage
guideline at 12 percent (same as last year) and reduced one
p.p. its minimum guideline (from three percent to two
percent), and 0.5 p.p. its average guideline (from 7.5 percent
to seven percent).
Additionally, China has a minimum wage system. In
opposition to wage guidelines, minimum wages are
mandatory. Although the system has been running since
1994, it was not enforced until 2004.
Like the wage guidelines, local governments issue minimum
wages. Those should be revised once every two years and
should stay between 40 to 60 percent of the region’s
average monthly salaries. In reality, minimum wages fall far
behind that. In 2019, in Shanghai and Beijing, the two areas
with the highest minimums, the minimum wages amount to
18.9 percent and 16.8 percent of the average salary
respectively. The closest provinces to meet such criteria were
Henan, where minimum wages were 34.7 percent of the
average compensation in 2019; and Heilongjiang where
minimum wages were 30.4 percent of the average salary. All
provinces considered, minimum wages represent 28 percent
of the minimum wage.7
In 2018, 15 provinces increased their minimum wages. By
August 2019, only four regions have issued minimum wage
rates this year: Beijing, Shanghai, Chongqing, and Shaanxi.
Other regions that are likely to put forward minimum wage
Wage Levels by Province
2017-2019. Average Monthly Wages, in RMB
Province 2017 2018* 2019* Factor**
Shanghai 10,816 11,959 13,102 1.74
Beijing 10,975 11,987 13,080 1.73
Tibet 9,068 10,672 12,686 1.68
Tianjin 7,878 8,585 9,336 1.24
Zhejiang 6,729 7,401 8,100 1.07
Guangdong 6,599 7,227 7,966 1.05
Jiangsu 6,522 7,117 7,712 1.02
Qinghai 6,308 6,956 7,666 1.02
Guizhou 5,983 6,689 7,433 0.98
Yunnan 5,759 6,505 7,349 0.97
Chongqing 5,907 6,485 7,085 0.94
Sichuan 5,785 6,387 7,015 0.93
Hainan 5,644 6,289 6,978 0.92
Ningxia 5,858 6,338 6,880 0.91
Shandong 5,673 6,252 6,865 0.91
Hubei 5,493 6,075 6,724 0.89
Xinjiang 5,661 6,160 6,688 0.89
Guangxi 5,318 5,953 6,641 0.88
Fujian 5,618 6,105 6,629 0.88
Gansu 5,281 5,861 6,472 0.86
Hunan 5,308 5,856 6,468 0.86
Hebei 5,253 5,794 6,425 0.85
Inner Mongolia
5,557 5,971 6,398 0.85
Shaanxi 5,432 5,901 6,394 0.85
Anhui 5,429 5,857 6,327 0.84
Jiangxi 5,119 5,620 6,165 0.82
Jilin 5,121 5,626 6,162 0.82
Liaoning 5,096 5,498 5,922 0.78
Shanxi 5,005 5,323 5,676 0.75
Heilongjiang 4,672 5,095 5,524 0.73
Henan 4,625 5,008 5,481 0.73
Source: German Chamber of Commerce in China analysis based on 2017 NBS data. *2018 and 2019 are
estimates considering GDP growth, inflation and wage increases in the past. ** Factor represents the
ratio of regional wage to national average for 2019. Monthly wages, based on 12-months year basis; all
wages are pre-tax.
Regional Wage Increase Guidelines 2019 (%)
Province Minimum Average Maximum
Shanghai 1 2.0 - 3.0 5.0 - 6.0 -
Inner Mongolia 2 - 7.5 11.0
Shandong 3 - 7.0 -
Shaanxi 2.0 7.0 12.0
Xinjiang 2.0 5.0 8.0
Average 2.2 6.4 10.3
Average 2018 4 3.2 7.6 11.8
Average 2017 3.0 7.8 12.2
Source: German Chamber of Commerce in China research and analysis. Annual averages for each tranche
are calculated based on regional adjustments identified during the year. Data as of 13 August 2019. 1.No
maximum increase guideline issued for Shanghai; 2.No minimum increase guideline issued for Inner
Mongolia; 3. No maximum and minimum increase guidelines issued for Shandong; 4.The 2018 average
includes all 17 provinces that issued new guidelines that year: five of them updated after the publication of
the last year’s Labor Market and Salary Report 2018/19. Therefore, data in the table for 2018 differs slightly
from the averages presented in last year’s report.

In partnership with
20
Labor Market
2019 | 2020& Salary Report
BR
IEF
Region ClassLast
Increase*
A B C D E F (%) Valid since
Beijing 2,200 - - - - - 3.8 Jul 2019
Tianjin 2,050 - - - - - 4.9 Jul 2017
Hebei 1,650 1,590 1,480 1,380 - - 12.5 Jul 2016
Shanxi 1,700 1,600 1,500 1,400 - - 5.4 Oct 2017
Inner Mongolia 1,760 1,660 1,560 1,460 - - 8.1 Aug 2017
Liaoning 1,620 1,420 1,300 1,120 - - 7.6 Jan 2018
Jilin 1,780 1,680 1,580 1,480 - - 18.1 Oct 2017
Heilongjiang 1,680 1,450 1,270 - - - 15.5 Oct 2017
Shanghai 2,480 - - - - - 2.5 Apr 2019
Jiangsu 2,020 1,830 1,620 - - - 14.7 Aug 2018
Zhejiang 2,010 1,800 1,660 1,500 - - 8.4 Dec 2017
Anhui 1,550 1,380 1,280 1,180 - - 2.3 Nov 2018
Fujian 1,700 1,650 1,500 1,380 1,280 - 19.9 Jul 2017
Jiangxi 1,680 1,580 1,470 - - 10.1 Jan 2018
Shandong 1,910 1,730 1,550 - - - 5.5 Jun 2018
Henan 1,900 1,700 1,500 - - - 17.1 Oct 2018
Hubei 1,750 1,500 1,380 1,250 - - 13.2 Nov 2017
Hunan 1,580 1,430 1,280 1,130 - - 12.9 Jul 2017
Guangdong 2,150 1,720 1,550 1,410 - - 6.2 Jul 2018
Guangxi 1,680 1,450 1,300 - - - 19.8 Feb 2018
Hainan 1,670 1,570 1,520 - - - 17.8 Dec 2018
Chongqing 1,800 1,700 - - - - 20.7 Jan 2019
Sichuan 1,780 1,650 1,550 - - - 20.4 Jul 2018
Guizhou 1,680 1,570 1,470 - - - 4.9 Jul 2017
Yunnan 1,670 1,500 1,350 - - - 9.0 May 2018
Tibet 1,650 - - - - - 17.9 Jan 2018
Shaanxi 1,800 1,700 1,600 - - - 7.6 May 2019
Gansu 1,620 1,570 1,520 1,470 - - 10.8 Jun 2017
Qinghai 1,500 - - - - - 19.1 Jun 2017
Ningxia 1,660 1,560 1,480 - - - 12.2 Oct 2017
Xinjiang 1,820 1,620 1,540 1,460 - - 10.4 Jan 2018
Shenzhen 2,200 - - - - - 3.3 Jul 2018
Minimum Wage Rates in China 2018
Source: Provincial Human Resources and Social Security Bureaus and German Chamber of Commerce in China analysis. “Class” refers to different wage districts or jurisdictions within a province. Local governments are responsible for setting minimum wages. *Increases are calculated as the average increases of adjustments for all categories in the region. With the exception of Shenzhen, only provinces and province-level municipalities set minimum wage levels.
increases, since they have not done so in the past two years:
Fujian, Hunan, Gansu, Guizhou, Tianjin, Qinghai,
and Zhejiang.8
Among the regions that have introduced minimum wage
increases this year, Chongqing presents the highest increase:
20.7 percent. Minimum wages had not been updated in
Chongqing since 2016. Minimum wages in Chongqing are
established for two different groups of districts: districts in
class A have seen minimum wage increasing from RMB 1,500
/ month to RMB 1,800 / month; districts in class B have gone
from RMB 1,400 / month to RMB 1,700 / month.9
Shanghai rose its minimum wage 2.5 percent in April, from
RMB 2,420 / month to RMB 2,480 / month; Beijing
increased it by 3.8 percent, from RMB 2,120 / month to
RMB 2,200 month. As opposed to Chongqing, minimum
wages in Shanghai and Beijing were updated just a year ago.
21
In partnership with
Labor Market
2019 | 2020& Salary Report
BR
IEF
Source: NBS. * Factor represents the ratio of INDUSTRY-specific average wage to national average wage for 2018. Monthly wages, based on 12-months year basis; all wages are pre-tax.
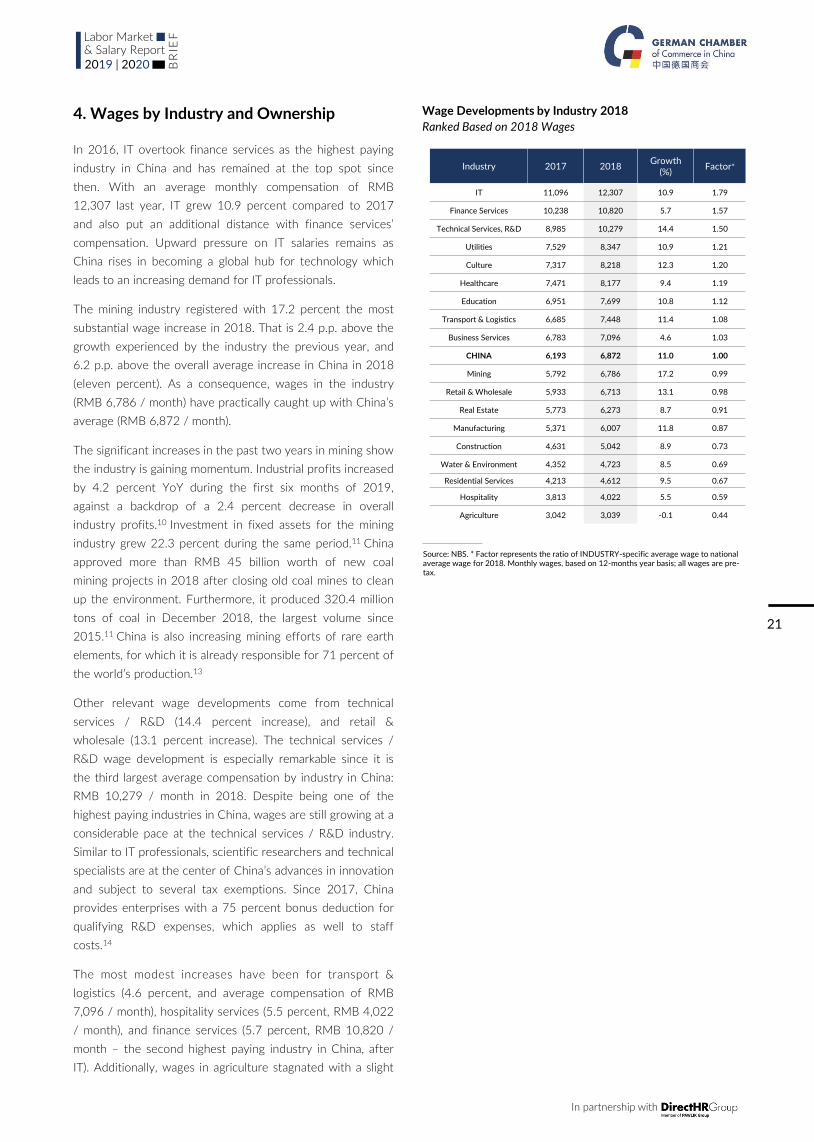
4. Wages by Industry and Ownership
In 2016, IT overtook finance services as the highest paying
industry in China and has remained at the top spot since
then. With an average monthly compensation of RMB
12,307 last year, IT grew 10.9 percent compared to 2017
and also put an additional distance with finance services’
compensation. Upward pressure on IT salaries remains as
China rises in becoming a global hub for technology which
leads to an increasing demand for IT professionals.
The mining industry registered with 17.2 percent the most
substantial wage increase in 2018. That is 2.4 p.p. above the
growth experienced by the industry the previous year, and
6.2 p.p. above the overall average increase in China in 2018
(eleven percent). As a consequence, wages in the industry
(RMB 6,786 / month) have practically caught up with China’s
average (RMB 6,872 / month).
The significant increases in the past two years in mining show
the industry is gaining momentum. Industrial profits increased
by 4.2 percent YoY during the first six months of 2019,
against a backdrop of a 2.4 percent decrease in overall
industry profits.10 Investment in fixed assets for the mining
industry grew 22.3 percent during the same period.11 China
approved more than RMB 45 billion worth of new coal
mining projects in 2018 after closing old coal mines to clean
up the environment. Furthermore, it produced 320.4 million
tons of coal in December 2018, the largest volume since
2015.11 China is also increasing mining efforts of rare earth
elements, for which it is already responsible for 71 percent of
the world’s production.13
Other relevant wage developments come from technical
services / R&D (14.4 percent increase), and retail &
wholesale (13.1 percent increase). The technical services /
R&D wage development is especially remarkable since it is
the third largest average compensation by industry in China:
RMB 10,279 / month in 2018. Despite being one of the
highest paying industries in China, wages are still growing at a
considerable pace at the technical services / R&D industry.
Similar to IT professionals, scientific researchers and technical
specialists are at the center of China’s advances in innovation
and subject to several tax exemptions. Since 2017, China
provides enterprises with a 75 percent bonus deduction for
qualifying R&D expenses, which applies as well to staff
costs.14
The most modest increases have been for transport &
logistics (4.6 percent, and average compensation of RMB
7,096 / month), hospitality services (5.5 percent, RMB 4,022
/ month), and finance services (5.7 percent, RMB 10,820 /
month – the second highest paying industry in China, after
IT). Additionally, wages in agriculture stagnated with a slight
Wage Developments by Industry 2018
Ranked Based on 2018 Wages
Industry 2017 2018Growth
(%)Factor*
IT 11,096 12,307 10.9 1.79
Finance Services 10,238 10,820 5.7 1.57
Technical Services, R&D 8,985 10,279 14.4 1.50
Utilities 7,529 8,347 10.9 1.21
Culture 7,317 8,218 12.3 1.20
Healthcare 7,471 8,177 9.4 1.19
Education 6,951 7,699 10.8 1.12
Transport & Logistics 6,685 7,448 11.4 1.08
Business Services 6,783 7,096 4.6 1.03
CHINA 6,193 6,872 11.0 1.00
Mining 5,792 6,786 17.2 0.99
Retail & Wholesale 5,933 6,713 13.1 0.98
Real Estate 5,773 6,273 8.7 0.91
Manufacturing 5,371 6,007 11.8 0.87
Construction 4,631 5,042 8.9 0.73
Water & Environment 4,352 4,723 8.5 0.69
Residential Services 4,213 4,612 9.5 0.67
Hospitality 3,813 4,022 5.5 0.59
Agriculture 3,042 3,039 -0.1 0.44

In partnership with
22
Labor Market
2019 | 2020& Salary Report
BR
IEF
0.1 percent decrease and an average salary of RMB 3,039 /
month, the lowest in China.
No remarkable compensation developments are recorded
with regard to ownership type. Limited liability corporations
(LLC) have the highest wage increases, with a 13.1 percent
increase in 2018. Hong Kong and Macau (SAR) and
Taiwanese firms followed, with a 12.3 percent. According to
data from the NBS, wages both at foreign companies and
state-owned enterprises (SOEs) increased by 10.3 percent;
and at shareholding companies by 9.7 percent.
The gap in annual compensation between shareholding and
SOEs, traditionally in favor of the former, has been narrowing
down. In 2014, the difference in compensation between the
two types was favorable to shareholding companies by RMB
10,125. In 2018, according to data by the NBS, the
difference in compensation between SOEs and shareholding
companies had narrowed down to RMB 3,842. If wages in
SOEs and shareholding companies were to continue to
develop at such pace, the Chamber estimates the difference
could get as low as RMB 2,060 by the end of 2019.
In 2018 foreign-owned companies remained the highest
paying (RMB 99,367 / year), followed by shareholding
companies (RMB 93,316 / year).
Average Annual Wages by Form of Ownership
2014-2019
SOEs Hong Kong and Macau (SAR), TaiwanShareholdingLLC
0
20,000
40,000
60,000
80,000
100,000
120,000
2014 2015 2016 2017 2018 2019*
Source: NBS & German Chamber of Commerce in China analysis. Average wages in RMB. *Estimates from the Chamber’s own analysis.
Wage Levels by Ownership in Relation to Foreign Companies
2006-2019. Foreign companies = 100
40%
50%
60%
70%
80%
90%
100%
110%
06 07 08 09 10 11 12 13 14 15 16 17 18 2019*
Source: NBS & German Chamber of Commerce in China analysis. Average wages in RMB. *Estimates from the Chamber’s own analysis.
SOEs Hong Kong and Macau (SAR), TaiwanShareholdingLLC

23
In partnership with
Labor Market
2019 | 2020& Salary Report
BR
IEF
Source: NBS & Chamber of Commerce in China analysis. GDP deflator (rebased, 2010=100) has been used to deflate prices. Productivity increase refers to the percent variation in output per worker (total) compared to the previous year.
0%
3%
6%
9%
12%
15%
18%
0
20,000
40,000
60,000
80,000
100,000
120,000
140,000
160,000
05 06 07 08 09 10 11 12 13 14 15 16 17 2018
PrimarySecondaryTertiary Total Productivity increase (%)
China’s Output per Worker: Overall and by Sector
RMB per Employed Person, at 2010 Prices
China’s Sources of Economic Growth (%)
Contribution to GDP Growth of Capital, Labor and Total
Factor Productivity (TFP)
5. Productivity
According to the Chamber calculations, productivity in China
increased by 6.6 percent YoY in 2018. Such productivity
level is in line with the World Bank’s data for China (6.7
percent). The output per employed person, used as a
measure of productivity, reached RMB 93,784 in 2018 (at
2010 prices).15 Most of the productivity gains came from the
secondary sector (manufacturing, mining, construction),
where productivity grew nine percent in 2018. Primary
sector followed (4.7 percent increase), and the services
sector yielded the most moderate increase in productivity
(3.9 percent).
China’s overall productivity gains have remained stable during
the period of 2014 to 2018, with an average productivity
growth of 6.7 percent. That is in contrast to the 8.5 percent
average increase in productivity for the period of 2009 to
2013. Were productivity to remain at the growth pace of the
last five years, China would achieve its target of RMB
120,000 per worker in 2020 (in nominal terms).
Government policies in 2017 and 2018 such as curbing on
risk lending, the clean-up in shadow banking (with the rise of
corporate defaults as a consequence), elimination of excess
industrial capacity (in steel and cement industries), and
exerting higher control on home prices, have resulted in
slower growth in the economy but also have supported
sustained productivity growth.16
Over the past three decades, economic growth in China, as in
the rest of Asia, has been mostly fueled by capital
investments (in non-IT assets mostly). During the period of
2000 to 2016, 56.7 percent of China’s economic growth was
contributed by capital investments (non-IT), according to data
from the 2018 Asian Productivity Databook. However, total
factor productivity (TFP) – a measure of efficient growth,
since it accounts for the growth that comes from the
combined use of different inputs (usually labor and capital) –
has contributed 34.4 percent of China’s growth in 2000 to
2016. Between 2005 and 2010, TFP accounted for 40
percent of China’s GDP growth, whereas from 2010 to 2016
TFP contributed 27 percent.17 GDP growth is increasingly
dependent on capital investment, but the pace at which the
growth comes has been declining.
Labor productivity has contributed 4.4 percent of China’s
GDP growth during 2000 to 2016. The raising quantity of
the labor force ended in 2012 when the ratio of the working-
age population to the total population peaked. The pace of
improvement in the quality of the labor force has also
slowed: as the Chinese labor force’s education and skills
expanded from the 70s to the 90s, further enhancements in
labor’s capabilities are becoming marginal.18 Because of a
Source: Asian Productivity Organization. Asian Productivity Databook 2018.
8.3
37.149.5
34.4
68.3
43.8
39.456.7
1.12.0 5.623.3 18.0
10.1 4.4
1970-1980 1980-1990 1990-2000 2000-2016
Labor inputCapital input (non-IT)TFP Capital input (IT)
China’s Productivity in an International Context
GDP per Employed Person (constant 2011 PPP $)
Ranked by Productivity Factor of China’s
Source: World Bank Data. Purchasing power parity (PPP) GDP is GDP converted to 2011 constant international dollars using PPP rates. An international dollar has the same purchasing power over GDP that a U.S. dollar has in the United States.
Country 2018 Factor of China’s
Increase 2017/18 (%)
United States 114,990 3.9 2.1
Germany 91,358 3.1 1.8
Japan 76,419 2.6 1.6
Turkey 73,147 2.5 2.5
Korea, Rep. 70,802 2.4 2.4
Slovak Republic 65,991 2.2 2.2
Hungary 60,702 2.1 4.1
Poland 60,538 2.1 3.5
Malaysia 58,687 2.0 3.1
Romania 55,054 1.9 4.9
Russian Federation 53,012 1.8 2.3
Bulgaria 42,994 1.5 3.5
Belarus 35,758 1.2 4.2
China 29,499 1.0 6.7
Indonesia 24,849 0.8 3.8
Philippines 19,918 0.7 4.2
India 18,565 0.6 5.8
Vietnam 11,142 0.4 5.6

In partnership with
24
Labor Market
2019 | 2020& Salary Report
BR
IEF
China’s Productivity in an International Context
Annual Productivity Growth (%)shrinking labor force, and the already high rate of
employment, it is improbable that future growth comes from
labor input (unless the retirement age is raised).
To ensure sustainable growth, data points to the need to
improve the efficiency of capital allocation, and to a better
combination of inputs (total factor productivity) that can only
come from further innovation.19
According to the World Intellectual Property Organization’s
(WIPO) Global Innovation Index, China ranked the 14th most
innovative economy (from a pool of nearly 130 economies
surveyed) in 2019, up from 17th in 2018. It remains the
highest ranked in WIPO index in patents by origin,
trademarks by origin, industrial designs, and high-tech net
exports, among others.20 Still, there has been little impact of
patents on productivity gains: most patents are design or
utility patents (improvements over existing products).
Besides, a high number of patents is not associated with high
utilization rates (not licensed to commercial partners).21
China’s productivity growth, in an international context,
shows remarkable performance. According to World Bank
data, the increase in 2018 for China is the highest among its
neighbors and surpasses that of developed economies. The
world’s second-largest economy, China’s productivity growth
exceeds that of the U.S. (the largest economy), Japan (the
world’s third), and Germany (the world’s fourth largest
economy).
Naturally, the actual output (GDP) per employed person of
China is small: USD 29,499 at constant 2011 purchasing
parity dollars (PPP $), one-fourth of that of the U.S. or about
one-third of Germany’s. However, China’s output is higher
than that of other developing economies in the region (e.g.
India, Philippines, and Vietnam).
-2%
0%
2%
4%
6%
8%
10%
12%
Source: World Bank Data. The annual increase in productivity has been calculated using GDP per Employed Person (constant 2011 PPP $). Purchasing power parity (PPP) GDP is GDP converted to 2011 constant international dollars using PPP rates. An international dollar has the same purchasing power over GDP that a U.S. dollar has in the United States.
20182010 2011 2012 2013 2014 2015 2016 2017
India
5.6
6.7
2.1 1.8
5.8
1.6
China Vietnam GermanyU.S. Japan

25
In partnership with
Labor Market
2019 | 2020& Salary Report
BR
IEF
6. Notes
1. The Chamber estimated an annual average wage of RMB 81,804
in 2018. See German Chamber of Commerce in China Labor
Market & Salary Report 2018/19, September 2018, page 12.
2. “Zhaopin: China’s demand and supply of white collar
professionals”, TopHR.net, 18 April 2019. See http://www.tophr.
net/news/index.asp?id=20935, accessed 27 August 2019. In
Chinese.
3. Disposable personal income is the money households have
available after income taxes have been deducted, and subsidies
added. To see the latest official data on disposable income in
China, as of August 2019, visit ww.stats.gov.cn/english/
PressRelease/201907/t20190715_1676034.html, accessed 27
August 2019.
4. Provinces in the West region, according to the NBS classification:
Inner Mongolia, Guangxi, Chongqing, Sichuan, Guizhou, Yunnan,
Tibet, Shaanxi, Gansu, Qinghai, Ningxia, and Xinjiang. East
regions: Beijing, Tianjin, Hebei, Shanghai, Jiangsu, Zhejiang, Fujian,
Shandong, Guangdong, Hainan.
5. In 2015 Tibet presented a wage increase of 59.8 percent
compared to 2014. That year, in commemoration of the 50th
anniversary establishment of the Tibet Autonomous Region, the
central government transferred RMB 132.09 billion to the region
(higher than the actual GDP of Tibet that year). Many of the
transferred payments were added directly to average wages, in
the form of subsidies or aid to ethnic minorities. With Tibet’s
fairly small population base (3.3 million) the grants translated into
a significant boost in the average wage.
6. “China’s Enterprise Salary Guidelines: Useful Roadmap or Glaring
Misdirection?”, China-Briefing.com, 14 September 2016.
7. To calculate the ratio minimum wage to average wage per
province, we have divided the minimum wage by the average
wage in the province. Since official data for provincial wages has
not yet been published, the Chamber used its own estimates for
2019. For example, in Beijing the minimum wage stands at RMB
2,200 as of July 2019, and the estimate average wage in Beijing is
RMB 13,080 / month in 2019. Therefore, the minimum wage in
Beijing amounts to 16.8 percent of the average wage. When a
province presents different minimum wages (i.e., Hebei has four
different tranches), the largest minimum wage has been used for
the calculations.
8. Alexander Chipman, Qian Zhou, “Minimum Wages in China
2019”, China-Briefing.com, 13 June 2019.
9. China does not have a unified minimum wage for the entire
nation. Since living standards vary greatly, local governments set
their own minimum wages. Provincial governments set out
multiple wage “classes” for the region, and each city and county
within the province chooses the appropriate minimum wage level
based on local economic conditions. For example, Zhejiang sets
four minimum wage “classes” (A, B, C, and D) but then it is up for
1. the cities and counties in the province to decide which “class” is
most suitable for them. A detailed account of cities adhering to a
specific “class” can be found here: https://www.china-
briefing.com/news/minimum-wages-china-2019/, accessed 27
August 2019.
10. "Industrial Profits decreased 2.4 percent in the First Six Months
of 2019”, National Bureau of Statistics (NBS) Press Release, 31
July 2019.
11. “Investment in Fixed Assets for the First Six Months of 2019”,
NBS Press Release, 17 July 2019.
12. Meng Meng, Dominique Patton, “China's coal output hits highest
in over 3 years as mines start up”, Reuters.com, 21 July 2019.
13. “Will Beijing weaponize its rare earth supply in the U.S.-China
trade war?”, SCMP, 28 June 2019.
14. Bing Yang, Benjamin Lu, Liang Wu, “R&D 2.0: Taking tax
incentives to the next level in China”, Internationaltaxreview.com,
10 December 2018.
15. China’s GDP for 2018 was RMB 90 trillion, based on the current
preliminary accounting results. The employed population that
year totaled 775.86 million. As a measure of labor productivity,
the Chamber has used the total output of the economy divided
by the total number of workers. That results in productivity of
RMB 116,040, at 2018 prices. To allow for comparisons across
time, we use the GDP deflator with 2010 as a base year to
convert prices: where 2010 = 100 and 2018 = 123.73.
Therefore, the output per worker in 2018 was RMB 93,784 at
2010 prices, a 6.6 percent increase compared with labor
productivity in 2017: RMB 87,958, at 2010 prices.
16. Kevin Hamlin, Enda Curran, “The Good News Hidden in China’s
Slowing Economy”, Bloomberg.com, 20 November 2018.
17. “2018 Asian Productivity Databook”, Asian Productivity
Organization, 2018. See pages 62, 67, and 69. https://www.apo-
tokyo.org/publications/wp-content/uploads/sites/5/APO-
Productivity-Databook-2018.pdf, accessed 27 August 2019.
18. Yuwa Hedrick-Wong, “The Reality Of China's Economic
Slowdown”, Forbes.com, 23 August 2018.
19. “China Economic Survey”, OECD, April 2019. See pages 41-42.
https://www.oecd.org/economy/surveys/China-2019-OECD-
economic-survey-overview.pdf, accessed 27 August 2019.
20. “Global Innovation Index 2019. Key Findings”, World Intellectual
Property Organization (WIPO), 2019. See page 6.
https://www.wipo.int/edocs/pubdocs/en/wipo_pub_gii_2019_ke
yfindings.pdf, accessed 27 August 2019.
21. See Note 19. Page 44.

In partnership with
26
Labor Market
2019 | 2020& Salary Report
BR
IEF
III General Survey Results
1. Expected Wage Developments at GermanChamber Companies
After last year’s mild uptick, in what now looks in hindsight
like a temporary deviation, the expected wage increase
returns to its descending path that has been a trademark
feature since measurements started in 2012.
According to this edition’s contribution of 483 member
companies of the German Chamber of Commerce in China,
the expected wage increase for 2020 is 5.53 percent, 0.46
p.p. below the projected growth for 2019.
In a market context characterized by high competition, lower
domestic and global growth, growing inflation, the RMB
depreciation, trade frictions, and a hard push for
organizational transformation towards digitalization, the 5.53
percent is read as a balancing act. The expected salary
increases from 2018 to 2020 experienced a growth
slowdown at an average of 0.23 p.p.; whereas in the period
2015 to 2017 the deceleration averaged 0.86 p.p. This
development suggests that compensation adjustments are
reaching their adaption limits. In recent years, the expected
wage increases move in conjunction with China's GDP
performance.
Dissecting the overall 5.53 percent by industry, company
size, and city tier offers additional insights (a regional
segmentation will be presented in the next section).
The most noticeable development is for the automotive
industry, on account of both the weight it carries on the
overall sample and the extent of its slowdown. Companies in
the automotive sector represent 17 percent of this year’s
contributions. According to this edition’s results, the
projected 5.26 percent wage increase in the automotive
industry for 2020 represents a forecast that is 1.37 p.p.
below that of 2019. In section 1. Growth Developments in the
first chapter, we presented information about the recent
weak evolution of the industry (units sold, and units
produced). From the survey itself, there are additional hints
to how the industry currently sees wage and productivity
developments: 55.56 percent of automotive companies
consider it likely that productivity gains will keep up with
wage increases, the third-lowest among the six industries
measured (see section 6. Productivity later on in this chapter).
In stark contrast to automotive, machinery / industrial
equipment (33.54 percent of the overall sample) barely
moved from its projected wage increase last year. The
expected wage increase for 2020, 5.84 percent, is only
Expected Wage Growth Development at German
Companies in China (%) Nominal Growth
Note: Wage growth is obtained as the average of the expected salary increases for allpositions surveyed.
5%
8%
11%
14%
17%
20%
23%
2012 2013 2014 2015 2016 2017 2018 2019* 2020
Wage Growth Indicators (%)
Source: German Chamber of Commerce in China analysis.*National wage growth: estimate.
Minimum wage
National wage
Wage guidelines
German companies expected wage growth
-3%
0%
3%
6%
9%
12%
15%
18%
21%
05 06 07 08 09 10 11 12 13 14 15 16 17 18 19 2020
GDP, Consumer Price Index and Wage Growth (%)
2005-2020
Source: German Chamber of Commerce in China analysis. 2019 Consumer inflation: year-on-year increase in July (2.8 percent). GDP growth: 6.3 percent in the first semester of2019; six percent in 2020, as per latest International Monetary Fund (IMF) forecast inJune 2019.
German companies expected wage growth Consumer pricesNational wageGDP
20
12
20
13
20
14
20
15
20
16
20
17
20
19
20
20
10.20
7.10
8.80
8.10
6.235.99
5.53
20
18
8.90
5.90

27
In partnership with
Labor Market
2019 | 2020& Salary Report
BR
IEF
4.8
4
5.5
6
5.8
9
6.1
4
5.7
9
6.6
3
5.2
6
5.8
0
6.0
4
5.9
0
5.8
4
5.8
1
5.2
7
5.2
6
5.2
5
4.8
7
0.05 p.p. below that of the previous year. However, the
ability to stick to projections is not a given: the effective
wage increase declared in 2019 has been 6.35 percent for
the machinery / industrial equipment industry, 0.46 p.p.
above the intended growth projected in the previous edition
(see section 3. Effective Wage Developments in this chapter).
Only two industries produce expected wage increases above
their expectations from last year’s edition. The most
notorious is consulting / legal services: its forecast increase
for 2020, at 6.04 percent, is 1.20 p.p. above the expectations
for 2019. Much more moderate is the second acceleration,
that of the chemicals industry, with a 5.90 percent expected
wage increase (0.34 p.p. above the previous year). These two
industries are again back at wage growth levels that are very
similar to those they reported in 2017 (6.06 percent for
consulting / legal services; 5.81 for chemicals).
By city tiers, it is in tier-2 where the slowdown is more
pronounced. They project a wage increase in 2020 of 5.30
percent, in comparison with last year’s report of 6.17
percent. More moderate in their adjusted projection for
2020, tier-1 cities estimate 5.77 percent, 0.24 p.p. below
their expectation for 2019. Finally, tier-3 cities do not
anticipate major changes, with a forecast 5.27 percent
increase that is only 0.08 p.p. below that of last year.
Based on company size (by number of employees), in a
context of decreasing salaries, smaller companies (less than
50 employees) present an expected wage increase of 5.83
percent. Thus, they are committed to sustaining the
anticipated wage growth they had for 2019 (5.87 percent).
On the other hand, the downward revision of expected wage
increases is most acute at the biggest companies (more than
250 employees), putting forward a wage increase of 5.32
percent in 2020, 0.75 p.p. below their projection last year.
6.016.17
5.35
5.77
5.30 5.27
Tier 1 Tier 2 Tier 3
5.875.99
6.07
5.83
5.60
5.32
<50 50-250 >250
2020 China average: 5.53
Expected Wage Increases by Industry (%)
2020 China average: 5.53
Expected Wage Increases by City Tier (%)
Expected Wage Increases by Company Size (%)
Company Size by Number of Employees
2019 2020
2020 China average: 5.532019 2020
2019 2020
Note: only industries with at least 10 different companies and more than 100 data pointsat the variable “Expected Wage Increase” at both this and the past edition.
Ele
ctro
nic
s
Co
nsu
me
r G
oo
ds
Au
tom
oti
ve
Co
nsu
ltin
g /
Le
gal
Sv
ces.
Me
dic
al
Su
pp
lies
Pla
stic
/ M
eta
l P
rod
uct
s
Ch
em
ical
s
Mac
hin
ery
/
Ind
ust
rial
E
qu
ipm
en
t

In partnership with
28
Labor Market
2019 | 2020& Salary Report
BR
IEF
6.1
1
6.2
0
6.5
6
6.3
6
5.9
7
5.2
1
5.6
3
6.1
3
6.1
7
5.9
4
5.7
7
4.9
3
5.2
8
5.6
9
5.5
9
5.3
3
5.1
7
7.1
5
6.5
9
5.5
6
6.0
6
6.0
4
6.4
2
6.2
9
5.7
5
5.0
4 5.5
7
5.9
4
6.0
9
5.7
5
5.5
7
4.9
0
4.9
1 5.8
0
5.8
2
5.3
5
5.0
9
6.7
4
6.6
3
5.5
5
Shanghai TAI/KUN Beijing Other North Guangzhou
Suzhou Other YRD Tianjin Shenzhen Other PRD
Expected Regional Wage Increases: Mid-Level Positions (%)
Expected Regional Wage Increases
TAI / KUN: Taicang & Kunshan; Other YRD: Other Yangtze River Delta areas; Other PRD:Other Pearl River Delta areas.
6.3
8
6.2
5
6.7
7
6.3
7
5.8
7
4.9
6 5.9
9
6.0
5
6.6
6
5.7
6
5.8
2
4.7
4
5.2
6 6.1
0
6.0
9
5.4
4
5.1
5
7.8
2
7.4
3
5.3
6
TAI / KUN: Taicang & Kunshan; Other YRD: Other Yangtze River Delta areas; Other PRD:Other Pearl River Delta areas.
6.4
7
6.2
9
6.4
7
6.1
8
6.7
4
5.7
1
5.2
0
7.4
4
5.6
5
5.9
2
5.6
6
5.5
0
4.9
1 5.9
8
6.4
2
5.9
1
5.2
2
5.6
0
5.8
3
5.7
7
Expected Regional Wage Increases: Production Workers (%)
TAI / KUN: Taicang & Kunshan; Other YRD: Other Yangtze River Delta areas; Other PRD: OtherPearl River Delta areas. Production workers: Blue collar, operator, shift leader, supervisor andplant/production manager.
Shanghai TAI/KUN Beijing Other North Guangzhou
Suzhou Other YRD Tianjin Shenzhen Other PRD
Shanghai TAI/KUN Beijing Other North Guangzhou
Suzhou Other YRD Tianjin Shenzhen Other PRD
Shanghai TAI/KUN Beijing Other North Guangzhou
Suzhou Other YRD Tianjin Shenzhen Other PRD
TAI / KUN: Taicang & Kunshan; Other YRD: Other Yangtze River Delta areas; Other PRD:Other Pearl River Delta areas.
Expected Regional Wage Increases: Junior Positions (%)
2019 20202020 China Production Workers average: 5.60
2019 20202020 China Junior Positions average: 5.78
2019 20202020 China Mid-level Positions average: 5.63
2. Regional Wage Developments
At the regional level, the slowdown is more pronounced in
East China, the region that showed the highest expected
increases last year. Decreases there range from the relatively
moderate 0.49 p.p. deacceleration observed in Shanghai, and
Other Yangtze River Delta (Other YRD), to the more
pronounced reduction in Taicang & Kunshan, and Suzhou:
1.51 p.p. and 1.14 p.p. below their respective expected
increases for 2019. They also represent the highest decreases
gauged in this edition China-wide.
In North China, evolution within the different regions varies in
direction. Beijing predicts a 5.82 percent wage increase next
year, in the vicinity of the 5.75 percent expected for 2019.
Tianjin produces an expected increase of 5.35 percent in
2020, 0.31 p.p. above 2019’s expectation. With such
expected increases, both Beijing and Tianjin recover from the
slowdown experienced in their respective evolution the
previous year. However, Other North continues to
deaccelerate: with an expected wage increase of 5.09
percent, conceding 0.48 p.p. to its 2019’s 5.57 percent mark
– which in turn was already 0.20 p.p. below its expected
increase for 2018.
Similar to North China, the expected wage increases in the
largest municipalities in South China show acceleration.
Shenzhen, with an expected increase of 6.74 percent, and
Guangzhou with 6.63 percent, present the highest increases
recorded in this edition at the regional level. For Shenzhen,
such a mark represents a gain of 0.80 p.p. over last year’s
expectation. For Guangzhou, it is the second year in a row
that wages continue to accelerate: 0.54 p.p. above the
expected increase for 2019.
The evolution of the regions’ expected wage increases, both
in terms of direction and intensity, remains consistent across
different levels of seniority as well as at the production
workers level. Thus, when a region presents an expected
wage increase for next year that is above (or below) that of
the previous one, a similar evolution can mostly be observed
at any given level of seniority within that particular region.
There are, however, a few exceptions to this. The most
notable being that of senior management roles: they are to
see higher expected wage increases than those registered last
year across all regions, except in Taicang & Kunshan, and
Other North, where expected wages will slow down following
the general evolution of these two regions.
In Beijing, although the expected wage increase for next year
is just 0.07 p.p. above that of 2019, the evolution within the
region varies depending on whether the focus is on mid-level
professionals and production workers (0.38 p.p. and 0.32 p.p.
2019 20202020 China average: 5.53

29
In partnership with
Labor Market
2019 | 2020& Salary Report
BR
IEF
5.8
9
5.9
1
6.1
5
6.4
2
5.5
8
4.8
3 5.5
9
5.2
9 5.9
5
5.7
0
5.3
7
4.7
0
4.4
4 5.6
2
5.7
6
5.1
2
5.1
2 6.1
6
6.2
0
5.6
7
TAI / KUN: Taicang & Kunshan; Other YRD: Other Yangtze River Delta areas; Other PRD:Other Pearl River Delta areas.
Shanghai TAI/KUN Beijing Other North Guangzhou
Suzhou Other YRD Tianjin Shenzhen Other PRD
4.4
9
4.0
7 5.1
0
5.0
0
4.0
4
3.6
0
4.8
2 5.5
9
5.1
9
4.0
04.6
0
4.3
8
3.5
3
5.1
4 5.9
1
5.0
0
3.8
3
7.4
4
6.6
4
4.7
1
TAI / KUN: Taicang & Kunshan; Other YRD: Other Yangtze River Delta areas; Other PRD:Other Pearl River Delta areas. Senior Management: combined results from positions CEO/ GM and Deputy GM/ Branch Manager. *Data from Shenzhen: only 9 observations.
Shanghai TAI/KUN Beijing Other North Guangzhou
Suzhou Other YRD Tianjin Shenzhen* Other PRD
Expected Regional Wage Increases: Senior Positions (%)
Expected Regional Wage Increases: Senior Management (%)
2019 20202020 China Senior Positions average: 5.33
2019 20202020 China Sr. Mgt. Positions average: 4.80
decrease respectively) or in junior and senior professionals
(0.22 p.p. and 0.18 p.p increase respectively). In Shenzhen,
despite the pronounced wage acceleration for the region,
production workers’ wage increase drops by 1.84 p.p., to 5.60
percent. Finally, in Other North expected wage increase for
production workers in 2020 remains mostly unchanged (a rise
of 0.02 p.p.) in a context where all the other seniority levels,
including those of senior management, show a slowdown in
expected wage increases for next year.
Evolution of Expected Regional Wage Increases
By Production Workers and Level of Seniority. Data in p.p.*
Shanghai -0.49 -0.81 -0.56 -0.34 -0.52 0.11
Suzhou -1.14 -0.79 -1.51 -1.27 -1.21 0.31
Taicang & Kunshan
-1.51 -1.56 -1.51 -1.28 -1.71 -1.57
Other YRD -0.49 -0.20 -0.27 -0.67 -0.80 0.14
Beijing 0.07 -0.32 0.22 -0.38 0.18 1.87
Tianjin 0.31 0.20 0.48 0.12 0.29 1.40
Other North -0.48 0.02 -0.84 -0.46 -0.47 -0.99
Shenzhen 0.80 -1.84 1.77 1.02 0.87 1.85
Guangzhou 0.54 0.18 0.77 0.42 0.25 1.45
Other PRD -0.20 -0.15 -0.40 -0.38 -0.03 0.71
AL
L
Pro
du
ctio
n W
ork
ers
Jun
ior
Pro
fess
ion
als
Mid
-Le
ve
l P
rofe
ssio
nals
Se
nio
r P
rofe
ssio
nals
Se
nio
r M
anag
em
en
t
*Difference between the expected 2020 and 2019 wage increases for, in p.p.

In partnership with
30
Labor Market
2019 | 2020& Salary Report
BR
IEF
3. Effective Wage Developments
As a new addition to the Labor Market & Salary Report, the
effective wage increases for 2019 reported in this 12th
Edition are compared against the expected wage increases for
2019 as gauged in the previous 11th Edition.
Before addressing such comparison, there is a positive (direct)
relationship between the effective wage increases reported in
2019, and the expected wage increases companies report for
2020. In particular, the correlation coefficient r between
these two data series is +0.60, signaling a moderate to a
strong relationship.1
When companies project their expected wage increases for
next year, such expectations are mediated by the recollection
of their most recent wage developments. Having that in mind,
the comparisons that follow in this section can be better
understood and put into context.
Overall, the 5.87 percent effective increase reported this
edition does not drift that much away from the 5.99 percent
expected increase reported last year. Moreover, German
companies in China have managed to reduce by 0.12 p.p.
their initial estimate, with the corresponding financial savings
this entails.
However, this is only at the aggregate level. A closer look by
industry reveals that only automotive and consumer goods
deliver effective wage increases below the initial
expectation.2 Whereas in 2018, automotive companies
anticipated a wage increase of 6.63 percent, data from this
year points to an effective wage increase of 5.30 percent
(and an expected 5.26 increase in 2020). Consumer goods
companies report an effective increase in 2019 of 4.02
percent, 1.78 p.p. below the expectation from last year.
Among industries presenting effective wage increases above
the initial expectation, consulting / legal services, and
chemicals are the most notable cases. The former delivered
an effective 6.21 percent increase, much higher than the
expected 4.80 percent. As already exposed in the first section
of this chapter, the expected wage increase for 2020 has
been recalibrated to 6.04 percent in consulting / legal
services, more in accordance to the actual evolution
experienced in 2019. Chemicals industry aimed at an increase
of 5.56 percent, but its effective wage increase turned out to
be 6.32 percent (0.77 p.p. above the initial forecast). For
2020, it projects a 5.90 percent increase.
To close on industry comparisons, machinery / industrial
equipment delivering an effective 6.35 percent wage increase
that is 0.46 p.p. above that of the initial expectation, keeps a
projection for 2020 that remains rooted in that expectation: if
6.21
6.32
6.35
6.10
6.34
5.41
5.87
5.30
4.02
4.84
5.56
5.89
5.79
6.14
5.26
5.99
6.63
5.80
Expected and Effective Wage Increases 2019
By Industry (%)
Effective Expected
Note: The forecast increase for a given year is obtained from the previous’ year surveyedition via the variable “Expected salary change for next year”. The effective increase fora given year is obtained at that year’s edition, through the variable “Actual salary change”.
Expected and Effective Wage Increases 2019 (%)
Consulting / Legal Services
Medical Supplies
Electronics
Plastic / Metal Products
Machinery / Industrial Equipment
Chemicals
Automotive
Consumer Goods
ALL
Note: Only illustrated industries with at least 10 companies and 100 observations for twovariables “Expected salary change for next year” and “Total cost per employee” in thisedition.
5.99 5.87
Expected Effective
last year’s expected wage increase was 5.89 percent, in this
edition the forecast is 5.84 percent for 2020.
Producing effective wage increases below the initial
expectation, seems to be a regional phenomenon. More
precisely, an East China phenomenon: Taicang and Kunshan
yield an effective increase that is 0.84 p.p. below its last year
expectation; Shanghai delivers an effective 5.65 percent
increase, 0.41 p.p. lower than initially anticipated; Other YRD,
an effective increase of 0.15 p.p. below its last year forecast.
Beyond eastern China, the only region where the pattern
repeats is in Other North: a 5.07 percent effective increase,

31
In partnership with
Labor Market
2019 | 2020& Salary Report
BR
IEF
2019 Effective China average: 5.87Expected Effective
Expected and Effective Wage Increases
By City Tier and Company Size (%)
6.0
1
6.1
7
5.3
5
5.8
7
5.9
9
6.0
7
6.0
0
5.7
9
5.6
3
6.2
2
6.1
6
5.4
1
Tier 1 Tier 2 Tier 3 Less 50 50-250 More 250
0.50 p.p. below the expected wage increase recorded last
year.
Beijing and Tianjin, as well as Shenzhen and Guangzhou, all
report effective wage increases in 2019 above their
respective expected increases as measured last year.
Variations range from the 0.63 p.p. that Beijing delivered on
top of its 5.75 percent expected wage increase, up to the
1.52 p.p. that Shenzhen added to its initial forecast.
Only Suzhou, in East China, and Other Pearl River Delta areas
(Other PRD), in the South and Southwest, have sustained
effective wage increases at the same level as they were
charted in last year’s edition.
When it comes to comparing expected and effective wage
increases by city tier and company size, one of the most
noticeable comparisons comes from the latter. The largest
companies (more than 250 employees) forecasted a 6.07
percent wage increase for 2019 and ended up delivering an
actual increase of 5.41 percent (0.66 p.p. below the initial
expectation); on the other hand, smaller sized companies,
especially those with less than 50 employees, ended up with
effective wage increases above the initial estimates.
To conclude with the comparisons, the last one is among
differences at the specific role level. Most of the 39 positions
surveyed in this edition register effective wage increases that
are below the initial expectation, though with different
degrees of intensity. There are only a handful of exceptions
recording higher effective than expected wages: junior and
senior admin professionals, mid-level sales professionals,
junior project manager / consultant professionals, deputy GM
/ branch manager, and CEO / GM / managing director.
To explain these results, a reasonable assumption would be
that the higher the level of seniority, the higher the
bargaining power in wage negotiations. In 2019, where the
effective increases are below the expected ones, this would
translate in senior roles’ effective wage increases falling less
than average in comparison with the wage developments of
mid-management and lower roles, or even in some cases
resulting in effective wage increases above the initial
expectations.
To test such assumption a score was assigned to each level of
seniority: blue-collar, operator, shift leader, IT staff, legal staff,
and junior professionals, were given a weight of 1; production
supervisor, and mid-level professionals, 2; senior
professionals, legal and IT managers, 3; production / plant
manager, 4; senior management, 5. The weights of each
position were then compared against the value of the
individual differences, to look for correlation. The actual
coefficient r was 0.29, suggesting only a weak (positive)
relationship, not strong enough to conclude the association is
6.0
6
6.0
4
6.4
2
6.2
9
5.7
5
5.0
4
5.5
7
5.9
4
6.0
9
5.7
5
5.6
5
6.0
2
5.5
8
6.1
4
6.3
8
6.0
8
5.0
7
7.4
6
7.2
5
5.7
4
Shanghai TAI/KUN Beijing Other North Guangzhou
Suzhou Other YRD Tianjin Shenzhen Other PRD
TAI / KUN: Taicang & Kunshan; Other YRD: Other Yangtze River Delta areas; Other PRD:Other Pearl River Delta areas.
Expected and Effective Regional Wage Increases (%)
2019 Effective China average: 5.87Expected Effective
significant.

In partnership with
32
Labor Market
2019 | 2020& Salary Report
BR
IEF
Expected (%) Effective (%) Difference (p.p.)*
1 Production Workers Blue Collar 6.25 5.86 -0.39
1 Production Workers Operator 6.47 5.83 -0.64
1 Production Workers Shift Leader 6.35 5.76 -0.60
2 Production Workers Production Supervisor 6.10 5.91 -0.19
3 Production Workers Production / Plant Manager 5.75 5.75 0.00
1 Admin Junior Admin 6.11 6.24 0.13
2 Admin Mid-Level Admin 6.06 5.97 -0.09
3 Admin Senior Admin 5.31 5.73 0.42
1 Sales Junior Sales 6.27 6.31 0.04
2 Sales Mid-level Sales 6.03 6.22 0.19
3 Sales Senior Sales 5.47 5.45 -0.01
1 Purchasing Junior Purchasing 6.38 5.68 -0.70
2 Purchasing Mid-Level Purchasing 5.99 5.60 -0.39
3 Purchasing Senior Purchasing 6.04 5.89 -0.15
1 Finance Junior Finance 6.34 6.33 -0.01
2 Finance Mid-Level Finance 6.01 6.00 -0.01
3 Finance Senior Finance 5.74 5.73 -0.02
1 HR Junior HR 6.25 6.14 -0.11
2 HR Mid-Level HR 6.10 5.98 -0.11
3 HR Senior HR 6.14 5.93 -0.21
1 Quality Junior Quality 6.09 6.05 -0.04
2 Quality Mid-Level Quality 6.12 5.76 -0.37
3 Quality Senior Quality 5.80 5.54 -0.25
1 Engineering / R&D Junior Engineer / R&D 6.65 6.65 0.00
2 Engineering / R&D Mid-Level Engineer / R&D 6.57 6.33 -0.24
3 Engineering / R&D Senior Engineer / R&D 6.42 6.14 -0.28
1 Logistics Junior Logistics 5.81 5.60 -0.21
2 Logistics Mid-Level Logistics 5.96 5.92 -0.04
3 Logistics Senior Logistics 6.14 5.89 -0.25
1 Project Mgt. / Consultant Junior PM / Consultant 6.48 7.06 0.58
2 Project Mgt. / Consultant Mid-Level PM / Consultant 6.25 6.06 -0.19
3 Project Mgt. / Consultant Senior PM / Consultant 5.95 5.58 -0.37
5 Senior Management Deputy GM / Branch Manager 5.00 5.13 0.13
5 Senior Management CEO / GM / Managing Director 4.30 4.82 0.52
3 Specialists IT Manager 5.97 5.83 -0.13
1 Specialists IT Staff 6.13 6.09 -0.05
1 Specialists Legal Staff 6.00 5.59 -0.41
3 Specialists Legal Manager 5.82 5.49 -0.33
None assigned Specialists Driver 5.53 5.17 -0.36
ALL 5.99 5.87 -0.12
Expected and Effective Wage Increases, 2019
By Position
Seniority Index Functional Area Position
* Difference effective wage increase minus expected wage increase (in percentage points). When the difference falls within the interval [-0.05, +0.05] it has been highlightedWhen the difference is > 0.05, the value has been highlighted . Finally, when the difference is < -0.05, the value has been highlighted .
.

33
In partnership with
Labor Market
2019 | 2020& Salary Report
BR
IEF
4. Wage Levels
In 2019, the total cost per employee (TCE) at member
companies of the German Chamber of Commerce in China
yields a median value of RMB 15,000 / month, RMB 680
above last year's median. If the comparison is made using the
mean (average) the average TCE is RMB 23,569 / month in
2019, versus the RMB 22,775 / month recorded last year.
The main goal of this section is not to run comparisons
between the median and average TCE recorded, but rather to
lay out how does TCE move along the different categories of
the most common segmentation variables that are available
from the survey. The median will be used as the reference
value for comparisons. As in previous editions, introducing
the median and average compensation levels segmented by
regions exposes the degree to which TCE varies among
German companies in China. More striking are the differences
when looking at the medians, since they are less affected by
extreme values and, therefore, represent a more reliable
measure of centrality than averages.
At the regional level, compensation in South China (Shenzhen,
Other PRD), as well as Other North, are the lowest recorded
TCEs in this edition. Guangzhou, Taicang & Kunshan, and
Tianjin reach values close to China’s median TCE of RMB
15,000 / month; Beijing and Shanghai remain at a much
higher level as the highest paying locations.
Only Beijing, Shanghathe level as i, and Tianjin present –
same as it happened last year - median TCE values that are
above China's total value. In 2018, Beijing and Shanghai
shared the top spot in compensation with a median of RMB
18,000 / month. However, in 2019, Beijing's compensation
overtakes Shanghai’s with RMB 21,373 compared to RMB
19,000. Tianjin, on the other hand, presents a median TCE of
RMB 16,000 that is only slightly above China's total median.
The difference between the median TCE for the highest and
lowest paying locations, Beijing and Other Pearl River Delta
(Other PRD) areas respectively, is RMB 9,778.63. That is, the
TCE at Other PRD is only 45.9 percent that of Beijing.
Such a range of variation is not unique to regional analysis. At
the industry level, a similar scale is observed between the
median TCE of the highest and lowest paying industries to
that observed for regions. It should be noted that in this
section, results are presented only for industries with at least
100 observations collected on the variable “Total Cost per
Employee” that come from minimum ten different member
companies. In this year’s edition, IT / telecommunications,
which accounts for 2.90 percent of all contributions, is the
industry with the highest median TCE (RMB 26,000 / month),
a compensation level that is 1.73 times that of China’s TCE.
15
.0 19
.0
15
.0
14
.0
13
.0
21
.4
16
.0
11
.2 12
.9
14
.0
9.8
23
.6
28
.1
23
.2
21
.7
20
.7
29
.7
23
.8
19
.1
19
.9
19
.7
14
.8
Wages at Regional Level in China
Total Cost per Employee / Month. In Thousand RMB
Median Mean
CHINA
TAI / KUN: Taicang and Kunshan; Other YRD: Other Yangtze River Delta areas; OtherPRD: Other Pearl River Delta areas.
Comparison of Wages at Industry Level
Total Cost per Employee / Month. In Thousand RMB. Ranking by
Median Values
Shanghai TAI/KUN Beijing Other North Guangzhou
Suzhou Other YRD Tianjin Shenzhen Other PRD
Median Mean
Note: Only industries with at least 10 companies and 100 observations when combiningall data points collected for the 39 different positions measured in the survey.
26.0
21.8
20.0
18.0
15.4
15.0
15.0
15.0
13.2
13.0
12.3
36.3
34.2
29.3
27.9
26.2
23.6
23.2
22.9
22.1
22.4
18.8
Medical Supplies
IT / Telecommunications
CHINA
Automotive
Chemicals
Consulting / Legal Services
Electronics
Consumer Goods
Plastic / Metal Products
Logistics
Machinery / Industrial Equipment
15
.0
15
.0
9.0 14
.5 30
.0
68
.8
10
7.2
23
.6
15
.3
10
.1
16
.3 33
.9
79
.9
12
2.0
CHINA ProductionWorkers
Junior Mid-Level Senior DeputyGM/BM
CEO/GM
Production Workers, Level of Seniority & Senior Management
Total Cost per Employee / Month. In Thousand RMB
Median Mean

In partnership with
34
Labor Market
2019 | 2020& Salary Report
BR
IEF
15.016.3
14.9 15.0
23.6 24.423.2 23.7
CHINA Less 50 50-250 More 250
15
.0
15
.0
6.5 7.1
9.8
15
.0
34
.5
23
.6
15
.3
6.8 7
.7 10
.7
16
.4
36
.1
CHINA ProductionWorkers
Blue Collar Operator Shift Leader ProductionSupervisor
Production /Plant
Manager
Median Mean
15.0
18.1
13.311.4
23.6
26.9
21.1
18.3
CHINA Tier 1 Tier 2 Tier 3
Comparison of Wages by City Tier
Total Cost per Employee / Month. In Thousand RMB
Median Mean
Median Mean
Comparison of Wages by Company Size (nº of Employees)
Total Cost per Employee / Month. In Thousand RMB
16.3
18.9
13.0
10.5
14.9
18.0
13.2
10.0
15.0
18.1
13.4 12.8
CHINA Tier 1 Tier 2 Tier 3
Comparison of Wages by City Tier & Company Size
Total Cost per Employee / Month. Median Values. In Thousand
RMBMore 25050-250Less 50
At the other end, there is electronics with a median TCE of
RMB 12,300 / month, and 5.80 percent of the sample. The
electronics median TCE amounts to 47.2 percent of the IT /
telecommunications.
Chemicals (6 percent of contributions), automotive (17
percent), and machinery / industrial equipment (33.5 percent)
present a median compensation in the vicinity of China’s TCE
RMB 15,000 / month: the latter two median’s TCE is RMB
15,000 / month, whereas for chemicals it is RMB 15,390 /
month.
A third angle from which to analyze differences in
compensation is by the level of seniority and production-
related positions. It should not come as a surprise that the
higher the seniority level, the higher the salary. Here it is
interesting to look at the differences between the median
and average TCE values. The highest gaps between these
two metrics are for the roles Deputy GM / Branch Manager
role RMB 11,119 (between an average TCE RMB 79,905 /
month and median RMB 68,787 / month); and CEO / GM
with a difference of RMB 14,753 between its average and
median TCE. In relative terms, those gaps are 16.20 percent
and 13.80 percent of the respective role’s median TCE.3
Finally, when looking at the median TCE by company size
(number of employees) and by city tier, it is worth to highlight
that compensation oscillates more when splitting the results
by city tier rather than by company size. The total cost per
employee is apparently more related to the location of a
company (the city tier) than the actual headcount of the
company.
As already mentioned in section 2. Regional Wage
Developments, once a trend had been spotted within a region
(whether an increase or a decrease on the expected wage
increase for next year), it would hold most of the times across
the different levels of seniority within that region.
Production Workers: Break Down Individual Positions
Total Cost per Employee / Month. In Thousand RMB

35
In partnership with
Labor Market
2019 | 2020& Salary Report
BR
IEF
5. Compensation Levels: Perception
An ample majority of the member companies of the German
Chamber of Commerce in China considers the current levels
of compensation are in line with the market’s average,
whether for blue collar workers or white collar professionals.
Around a fourth of the surveyed organizations consider
compensation to be higher than that of the current market
compensations standards: 22.4 percent when the evaluation
concerns blue collars, 25.7 percent when it pertains to white
collars.
When it comes to blue collar workers, Taicang / Kunshan,
and Other PRD are the two regions that perceive salaries are
high for these professionals: 36.6 percent of the contributors
in Taicang / Kunshan; 35.7 percent in Other PRD. By
company size, the largest companies (those with more than
250 employees) tend to perceive salaries as high in much
lower frequency (15.4 percent) compared to smaller sized
companies (less than 50 employees): 26.8 percent. Finally,
looking at industry-based results, the most polarized industry
is plastic / metal products where 39.1 percent of the
companies from this industry contributing to the survey this
year consider salaries are on par with market standards;
another 34.8 percent differ and consider them high, and 26.1
percent find them low.
For white collar professionals, there are no significant
differences across regions with regards to the perception of
compensation being above the market. In Shenzhen and to a
lesser extent in Beijing, contributors consider the wages for
white collar professionals below the market: 16.7 and 10.9
percent, respectively. By company size, once again – as it
happened with blue collar professionals – the smaller
companies (less than 50 employees) consider in a higher
proportion compensation as high (33.1 percent). By industry,
plastic / metal products reproduce a similarly polarized
pattern, and companies in the electronics’ sector perceive in
a higher proportion (10.7 percent) that wages are lower than
the market average.
10.4
14.3
7.3
6.5
14.3
12.0
3.2
23.5
3.6
72.1
61.9
56.1
73.9
60.7
68.0
67.7
64.7
86.7
60.7
17.5
23.8
36.6
19.6
25.0
20.0
29.0
11.8
13.3
35.7
Development
Perceived Salary Level in Comparison to Other
Companies (%)
26.222.0
19.422.6 22.6 21.4 22.4
63.166.5
70.766.0
71.1 71.668.2
10.7 11.4 9.911.4
6.3 7.0 9.4
2013 2014 2015 2016 2017 2018 2019
Blue Collar Workers
HighAverageLow
Results by Company Size
Shanghai
Suzhou
Taicang / Kunshan
Other YRD
Beijing
Tianjin
Other North
Shenzhen
Guangzhou
Other PRD
Other YRD: Other Yangtze River Delta areas; Other PRD: Other Pearl River Delta areas.
Results by Region
Less 50
50-250
More 250
9.8
11.0
6.9
63.4
64.0
77.7
26.8
25.0
15.4
Results by Industry
Chemicals
Plastic/Metal
Products
Automotive
Machinery/Industrial
Equipment
Others
Electronics
HighAverageLow
9.9
4.1
26.1
7.7
11.5
64.2
77.0
39.1
75.0
69.2
72.1
25.8
18.9
34.8
25.0
23.1
16.4
HighAverageLow
HighAverageLow

In partnership with
36
Labor Market
2019 | 2020& Salary Report
BR
IEF
5.1
6.1
16.7
10.7
6.9
8.4
68.8
69.5
50.0
71.4
72.4
64.3
26.1
24.4
33.3
17.9
20.7
27.3
7.8
9.1
4.9
6.1
10.9
7.4
3.0
16.7
5.6
3.6
67.2
63.6
65.9
69.4
60.9
66.7
69.7
55.6
72.2
75.0
25.0
27.3
29.3
24.5
28.3
25.9
27.3
27.8
22.2
21.4
26.5
16.3 17.6
26.023.3 24.2 25.7
64.1
72.5 73.4
65.169.6 69.3 66.9
9.411.1 9.1
8.9 7.1 6.5 7.4
2013 2014 2015 2016 2017 2018 2019
HighAverageLow
Results by Company Size
Less 50
50-250
More 250
Results by Region
Shanghai
Suzhou
Taicang / Kunshan
Other YRD
Beijing
Tianjin
Other North
Shenzhen
Guangzhou
Other PRD
Other YRD: Other Yangtze River Delta areas; Other PRD: Other Pearl River Delta areas.
Results by Industry
Chemicals
Plastic/Metal
Products
Automotive
Machinery/Industrial
Equipment
Others
Electronics
5.7
9.4
6.6
61.1
67.2
73.0
33.1
23.3
20.4
HighAverageLow
HighAverageLow
Perceived Salary Level in Comparison to Other
Companies (%)
White Collar Workers
Development HighAverageLow
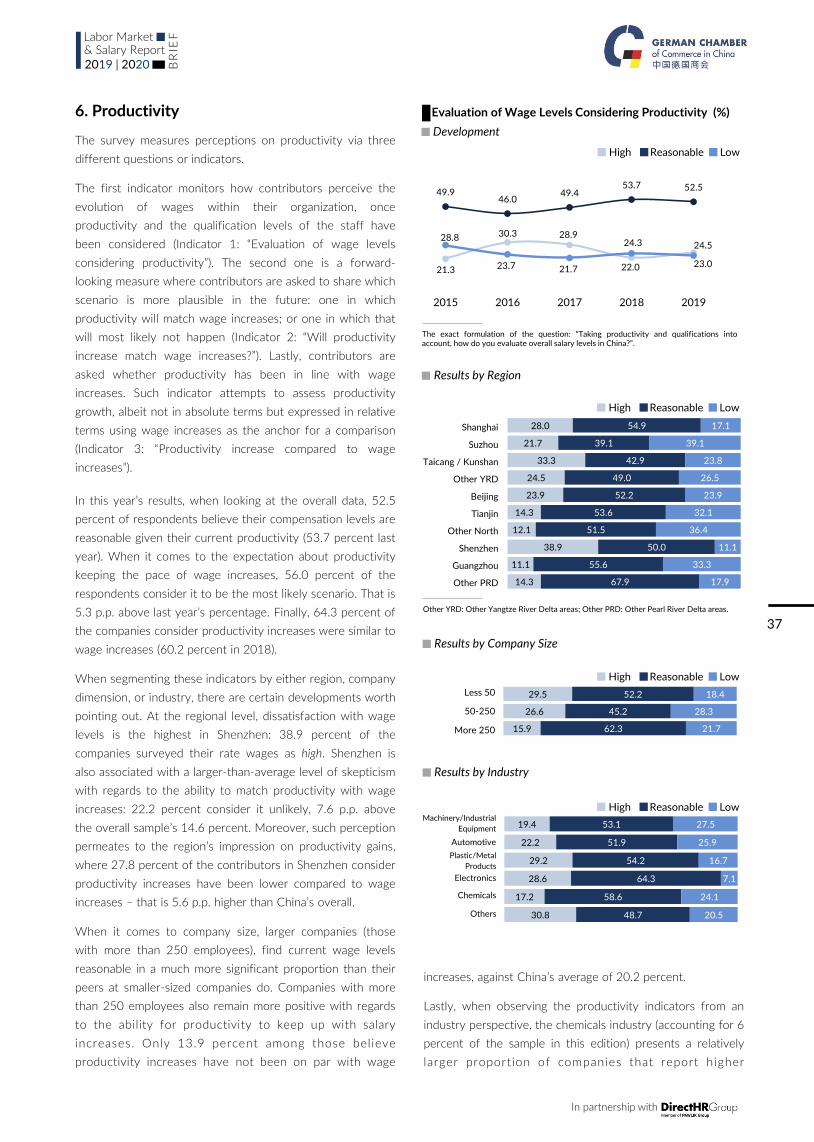
37
In partnership with
Labor Market
2019 | 2020& Salary Report
BR
IEF
6. Productivity
The survey measures perceptions on productivity via three
different questions or indicators.
The first indicator monitors how contributors perceive the
evolution of wages within their organization, once
productivity and the qualification levels of the staff have
been considered (Indicator 1: “Evaluation of wage levels
considering productivity”). The second one is a forward-
looking measure where contributors are asked to share which
scenario is more plausible in the future: one in which
productivity will match wage increases; or one in which that
will most likely not happen (Indicator 2: “Will productivity
increase match wage increases?”). Lastly, contributors are
asked whether productivity has been in line with wage
increases. Such indicator attempts to assess productivity
growth, albeit not in absolute terms but expressed in relative
terms using wage increases as the anchor for a comparison
(Indicator 3: “Productivity increase compared to wage
increases”).
In this year’s results, when looking at the overall data, 52.5
percent of respondents believe their compensation levels are
reasonable given their current productivity (53.7 percent last
year). When it comes to the expectation about productivity
keeping the pace of wage increases, 56.0 percent of the
respondents consider it to be the most likely scenario. That is
5.3 p.p. above last year’s percentage. Finally, 64.3 percent of
the companies consider productivity increases were similar to
wage increases (60.2 percent in 2018).
When segmenting these indicators by either region, company
dimension, or industry, there are certain developments worth
pointing out. At the regional level, dissatisfaction with wage
levels is the highest in Shenzhen: 38.9 percent of the
companies surveyed their rate wages as high. Shenzhen is
also associated with a larger-than-average level of skepticism
with regards to the ability to match productivity with wage
increases: 22.2 percent consider it unlikely, 7.6 p.p. above
the overall sample’s 14.6 percent. Moreover, such perception
permeates to the region’s impression on productivity gains,
where 27.8 percent of the contributors in Shenzhen consider
productivity increases have been lower compared to wage
increases – that is 5.6 p.p. higher than China’s overall.
When it comes to company size, larger companies (those
with more than 250 employees), find current wage levels
reasonable in a much more significant proportion than their
peers at smaller-sized companies do. Companies with more
than 250 employees also remain more positive with regards
to the ability for productivity to keep up with salary
increases. Only 13.9 percent among those believe
productivity increases have not been on par with wage
28.0
21.7
33.3
24.5
23.9
14.3
12.1
38.9
11.1
14.3
54.9
39.1
42.9
49.0
52.2
53.6
51.5
50.0
55.6
67.9
17.1
39.1
23.8
26.5
23.9
32.1
36.4
11.1
33.3
17.9
ReasonableHigh Low
Development
Evaluation of Wage Levels Considering Productivity (%)
Results by Region
Shanghai
Suzhou
Taicang / Kunshan
Other YRD
Beijing
Tianjin
Other North
Shenzhen
Guangzhou
Other PRD
Other YRD: Other Yangtze River Delta areas; Other PRD: Other Pearl River Delta areas.
The exact formulation of the question: “Taking productivity and qualifications intoaccount, how do you evaluate overall salary levels in China?”.
Results by Company Size
Less 50
50-250
More 250
Results by Industry
Chemicals
Plastic/Metal
Products
Automotive
Machinery/Industrial
Equipment
Others
Electronics
ReasonableHigh Low
ReasonableHigh Low
19.4
22.2
29.2
28.6
17.2
30.8
53.1
51.9
54.2
64.3
58.6
48.7
27.5
25.9
16.7
7.1
24.1
20.5
29.5
26.6
15.9
52.2
45.2
62.3
18.4
28.3
21.7
21.3
30.3 28.9
22.0
24.5
49.946.0
49.453.7 52.5
28.8
23.7 21.7
24.3
23.0
2015 2016 2017 2018 2019
ReasonableHigh Low
increases, against China’s average of 20.2 percent.
Lastly, when observing the productivity indicators from an
industry perspective, the chemicals industry (accounting for 6
percent of the sample in this edition) presents a relatively
larger proportion of companies that report higher

In partnership with
38
Labor Market
2019 | 2020& Salary Report
BR
IEF
49.2 49.958.2
50.756.0
32.5 33.828.3
34.829.4
18.4 16.313.5 14.4 14.6
2015 2016 2017 2018 2019
16.8
17.4
9.5
18.8
15.2
10.7
3.0
22.2
17.9
28.1
30.4
38.1
20.8
39.1
25.0
18.2
44.4
33.3
28.6
55.1
52.2
52.4
60.4
45.7
64.3
78.8
33.3
66.7
53.6
Development
Neutral LikelyUnlikely
Will Productivity Increase Match Wage Increases? (%)
Results by Region
Other YRD: Other Yangtze River Delta areas; Other PRD: Other Pearl River Delta areas.
The exact formulation of the question: “Do you believe productivity increase will be ableto match wage increases in the future?”.
Results by Company Size
Less 50
50-250
More 250
16.0
16.1
10.9
33.1
28.9
25.5
50.9
55.0
63.5
Results by Industry
Chemicals
Plastic/Metal
Products
Automotive
Machinery/Industrial
Equipment
Others
Electronics
Neutral LikelyUnlikely
Shanghai
Suzhou
Taicang / Kunshan
Other YRD
Beijing
Tianjin
Other North
Shenzhen
Guangzhou
Other PRD
Neutral LikelyUnlikely
10.6
16.1
16.7
17.9
13.8
17.1
33.1
28.4
20.8
28.6
17.2
29.8
56.3
55.6
62.5
53.6
69.0
53.2
Neutral LikelyUnlikely
21.3 22.7
13.515.9 15.6
42.448.5
64.060.2
64.3
33.5 28.822.5
23.920.2
2015 2016 2017 2018 2019
20.0
21.7
22.0
14.6
23.9
23.1
12.1
27.8
22.2
21.4
60.5
69.6
58.5
64.6
69.6
61.5
78.8
66.7
66.7
67.9
19.5
8.7
19.5
20.8
6.5
15.4
9.1
5.6
11.1
10.7
HigherLower Similar
Development
HigherLower Similar
Productivity Increase Compared to Wage Increases (%)
Results by Company Size
Less 50
50-250
More 250
Results by Region
Shanghai
Suzhou
Taicang / Kunshan
Other YRD
Beijing
Tianjin
Other North
Shenzhen
Guangzhou
Other PRD
Other YRD: Other Yangtze River Delta areas; Other PRD: Other Pearl River Delta areas.
The exact formulation of the question: “Evaluate productivity increase at your companycompared to overall wage increases”.
21.0
24.3
13.9
61.1
63.3
69.3
17.9
12.4
16.8
Results by Industry
21.5
16.0
29.2
21.4
13.8
20.5
63.3
71.6
54.2
64.3
65.5
62.8
15.2
12.3
16.7
14.3
20.7
16.7
Chemicals
Plastic/Metal
Products
Automotive
Machinery/Industrial
Equipment
Others
Electronics
HigherLower Similar
Plastic / metal products industry (5 percent of the sample) is
an interesting case: although 29.2 percent report productivity
gains have been lower than salary increases, the sector
remains undaunted in its confidence towards the future, with
62.5 percent considering likely that productivity will match
productivity increases relative to wage increases (20.7
percent, versus China’s overall 15.6 percent). The industry’s
confidence with the ability for productivity to keep its pace
with salary increases in the future is also the highest across
the set of considered sectors: 69 percent likelihood.
HigherLower Similar

39
In partnership with
Labor Market
2019 | 2020& Salary Report
BR
IEF
83.0
86.1
78.8
78.8
53.9
62.4
69.1
97.1
88.4
89.1
76.8
84.1
73.2
65.9
Main Factors for Productivity Increase (%)
At Companies with Less 50 Employees vs. More 250 Employees
Difference in the Degree of Importance (in p.p.)
Share of Labor Costs over Total Costs (%)
Overall China and by Company Size
More 250Less 50 employees
Very Important + Important (in %) at:
14.1
2.3
10.3
-2.0
10.8
-3.1
30.1
Improved Internal
Processes
Better Internal Training
Better Work Experience
Use of Key Performance Indicators
Increased Automation
Improved Retention
Improved General
Education
wage increases.
To further investigate the productivity, two additional
requests for the contributors are added: First, respondents
are enquired about the share of labor costs over total costs
within their respective organization. Second, they are
enquired on several items they have to evaluate based on the
items’ relative importance as drivers of productivity.
The proportion of labor costs to total costs amounts to 29.9
percent. However, such percentage varies significantly
depending on company size. Thus, smaller companies (less
than 50 employees) present a higher proportion of labor
costs relative to total costs with 38.8 percent, than medium
(50 to 250 employees) with 26.1 percent, or larger (more
than 250 employees) organizations with 23.2 percent.
On the main factors organizations perceive to be critical for
productivity gains, improving internal processes remains by
far the most important: 92.2 percent of contributors consider
it very important or important. Better internal training and the
use of key performance indicators (KPIs) follow: 86.1 percent
and 84.6 percent, respectively, perceive them as very
important or important.
Breaking down the importance of those items by company
size, a comparison between companies with less than 50
employees and companies with more than 250, points out a
significant difference in the way increased automation is
regarded as critical for achieving productivity gains. In the
case of smaller companies, 53.9 percent consider increased
automation as very important or important; at larger entities
that proportion climbs up to 84.1 percent, about 30 p.p. of
difference.
It should be stressed that whereas in 2018 increased
automation was the second factor in order of importance
among companies of more than 250 employees, only behind
improved internal processes, in the present edition such item
has been overtaken by the use of KPIs and better internal
training.
29.2
38.7
25.6
19.3
29.9
38.8
26.123.1
China Less 50 50-250 More 250
2018 2019
Main Factors for Productivity Increase (%)
Ranked by Very Important and Important
43.3
18.8
30.6
16.8
29.2
13.0
14.3
48.9
67.3
54.0
62.5
41.0
55.7
53.8
6.0
10.8
10.8
16.8
17.6
22.6
26.7
10.8
5.0
Very important Important Neutral Not important n/a
Improved Internal
Processes
Better Internal Training
Better Work Experience
Use of Key Performance Indicators
Increased Automation
Improved Retention
Improved General
Education

In partnership with
40
Labor Market
2019 | 2020& Salary Report
BR
IEF
58.3
29.7
6.61.1
4.3
60.1
25.7
7.03.0 4.2
No strategicchangesplanned
Plan toincrease
automation
Relocationwithin China*
Relocation toanothercountry*
Other
Strategic Changes due to Rising Labor Costs (%)
Overall Results for China
Strategic Changes Due to Rising Labor Costs 2019 (%)
Based on How Wages in China are Perceived
Strategic Changes Due to Rising Labor Costs 2019 (%)
Overall Results for China and by Company Size (nº of Employees)
* Relocation to lower labor cost areas.
2018 2019
60
.1
25
.7
7.0
3.0 4.2
76
.1
8.8
7.5
1.9 5.7
55
.3
27
.9
8.4
5.0
3.4
47.8
42.6
4.4
1.5 3.7
No strategicchangesplanned
Plan toincrease
automation
Relocationwithin China*
Relocation toanothercountry*
Other
50-250 More 250China Less 50
* Relocation to lower labor cost areas.
60.1
25.7
7.03.0 4.2
63.1
25.2
4.5 3.6 3.6
49.1
29.3
13.8
3.4 4.3
No strategicchangesplanned
Plan toincrease
automation
Relocationwithin China*
Relocation toanothercountry*
Other
Companies that perceive wages are high, having considered productivity & qualifications
Companies that perceive wages are low, having considered productivity & qualifications
* Relocation to lower labor cost areas.
The section on productivity is concluded with the different
strategic changes companies might be pondering in a context
of rising labor costs. 60.1 percent of all companies
contributing to the survey in 2019 have no strategic changes
planned due to increasing labor costs (1.8 p.p. above last
year’s 58.3 percent).
Whenever there is some change in stock, increasing
automation is the most common path: 25.7 percent of
respondents advocate for this course of action. Differences
on support for increased automation arise by company size:
8.8 percent of companies with less than 50 employees plan
to increase automation. It goes up to 27.9 percent for
companies with 50 to 250 employees and reaches its peak
with 42.7 percent of companies with more than 250
employees planning to increase automation.
Relocation to lower labor cost areas, either within China or
abroad, is considered only by a combined ten percent of
contributors. By company size, mid-sized organizations (50 to
250 employees) are considering such alternatives in the
highest proportion (13.4 percent). The percentage of
respondents who are considering relocating outside China
has gone from one percent last year to three percent in
2019.
Finally, turning back to the productivity topic of this section,
there are some interesting findings when considering
strategic changes based on how companies perceive salaries.
First, when companies consider salaries as high, they are
more likely to have some course of action planned: 50.9
percent, against the 39.9 percent observed for China’s
overall, or 36.9 percent among companies that consider
wages are low.
Second, there is not such a sharp difference between their
plans to increase automation as one might have initially
expected: 25.2 percent, among companies perceiving wages
are low; 29.3 percent when wages are perceived as high.
Lastly, companies that perceive salaries being high are three
times more likely to relocate within China compared to
companies viewing wages being low. Relocating to another
country, however, remains equally unlikely, regardless of how
wages are perceived. Thus, that would suggest relocating
outside China is not an option that is much affected by how
salaries are perceived in comparison with productivity
according to the data, but it does exert a considerable
influence towards considering a move within China.
China

41
In partnership with
Labor Market
2019 | 2020& Salary Report
BR
IEF
52.9
54.8
17.3
9.2
7.4
6.6
3.4
4.4
5.9
6.1
7.2
2.1
43.3
39.7
56.8
56.9
50.6
43.6
41.1
39.8
37.7
28.8
26.1
14.8
2.9
4.6
20.0
27.1
33.5
37.7
48.1
40.5
43.2
36.7
30.3
39.0
4.6
4.4
8.2
6.1
5.9
8.3
9.3
18.0
22.1
25.6
5.9
7.0
10.4
14.3
18.4
28.4
4.8
2.3
2.1
1.2
0.8
42.7
28.8
9.5
9.3
6.4
6.2
ImportantVery important
Individual Negotiations
Department Wide Negotiations
Collective Bargaining
Labor Bureau
Work Council
Official Trade Union
IndividualPerformance
Importance of Factors for Fixing Wage Adjustments (%)
Ranked by Very Important + Important
CompanyPerformance
Inflation Adjustments
Competition with Other Companies
Seniority of Staff
Retention of Staff
Meeting Expectations of Staff
German Chamber Wage Report
Other Wage Reports
Government Wage Guidelines
Minimum Wage Adjustments
Other Government Policies
Most Important Factors for Wage Negotiations (%)
Ranked by Very Important + Important
n/aVery important Important Neutral Not important
7. Wage Determination
Company performance and individual performance are,
among the pool of twelve factors presented to contributors,
the two regarded as most important for wage negotiations.
More than 50 percent of the surveyed organizations see
those as very important: 54.8 percent, in the case of company
performance; 52.9 percent for individual performance.
Compared to last year, both have strengthened their grip on
its relative importance: company performance is labelled as
very important in a proportion that is 6.1 p.p. above that of
2018; individual performance comes with a 2.2 p.p. increase
in the percentage of contributors that regard it as very
important, when compared to last year.
Following the above, next in perceived importance come
adjustments due to inflation, and the pressure exerted from
other companies to remain competitive compensation-wise.
Although less critical factors than the company and individual
performances (fewer mentions to them being very important),
they are nonetheless still seen as important by 56.8 and 56.9
percent of respondents.
Retention of staff, one of the HR challenges regarded as
more impactful in business operations (see section 8. HR
Challenges, in this chapter), presents a moderate importance
when it comes to determining wage adjustments with a
combined 43.6 percent of very important or important
mentions.
Government wage guidelines, minimum wage adjustments,
and other government policies have the lowest perceived
levels of importance in fixing wages. Most likely this is
because compensation at member companies of the German
Chamber of Commerce in China is well above those minimum
thresholds. A comparison between the lowest median
compensation by region in this year’s edition (RMB 9,800 /
month, in Other PRD) and the statutory minimum wage in
Shanghai (RMB 2,480 / month, the highest minimum wage in
China), reveals that the compensation among German
companies in China is at least nearly four times higher than
the minimum wage in Shanghai. Besides, this year’s median
total cost per employee among companies contributing to the
survey is RMB 15,000 / month. That is 2.2 times higher than
the latest official national average compensation in China,
according to the National Bureau of Statistics: RMB 6,872 /
month, in 2018.
Consistent with the perceived importance for wage
adjustments, when the time comes for salary negotiations,
individual discussions are regarded as the most critical: 42.7
percent of contributors consider them important, 28.4
percent very important. Combined that yields a 71.1 percent,
and it is a considerable gap against the second most crucial
factor, department negotiations, at 33.6 percent.
Both in terms of the importance of the different factors
evaluated for salary adjustments and salary negotiations, this
year’s results do not represent a significant difference from
the historical data.

In partnership with
42
Labor Market
2019 | 2020& Salary Report
BR
IEF
38.9
34.8
30.6
17.6
9.5
17.6
3.9
4.6
3.1
13.3
1.2
50.3
53.2
49.9
54.9
49.5
39.3
24.2
16.4
16.8
5.2
12.8
7.2
7.9
12.6
19.0
33.3
26.3
36.9
31.9
26.7
16.6
35.2
1.2
2.5
5.2
6.6
5.2
14.1
31.7
43.5
49.7
61.1
48.0
Rising Labor Costs
Recruiting Qualified Staff
Retaining Qualified Staff
Social Insurance / Housing Fund
High Cost for Training
High Staff Turnover
Union Organization
Dealing with Labor Bureau
Labor Arbitration Cases
Strikes / Unrest
Collective Bargaining
Impact of HR Related Challenges in Business Operations (%)
Ranked by High + Medium impact
Impact of HR Related Challenges in Business Operations (%)
Based on Whether Companies Have Production Activity in China
High Medium Low No impact n/a
Strategies for Retaining Qualified Staff (%)
Ranked by Very Effective + Effective
37.1
33.8
39.2
13.9
21.0
16.4
15.4
11.0
11.4
53.9
54.1
45.2
54.4
42.1
42.1
40.2
42.5
31.5
Very effective Effective
Salary Adjustments
Bonus System
Career Advancement
Additional Annual Leave
Training / Education
International Placements
Paid Overtime
Flexible Working Hours
Work-life Balance Programs
8. HR Challenges
Companies continue to experience rising labor costs,
recruiting, and retaining qualified staff as the most impactful
HR challenges in their business operations.
In comparison to last year, recruiting and retaining qualified
staff have shown a relaxation in the proportions to which
they are regarded as highly impactful. Recruiting qualified
staff today is at 34.8 percent, 5.6 p.p. below 2018; more
moderate is the case on retention, which 30.6 percent of
contributors qualify it as highly impactful (1.1 p.p. below last
year’s mark).
Rising labor costs remain firmly as the top HR challenge: 38.9
percent of the surveyed organizations see them as highly
impactful, 1.3 p.p. above last year.
Rising labor costs are regarded as specially harming to
business operations when respondents’ only activity focus in
China lays in production. Among them, the extent to which
they qualify rising labor costs as highly impactful climbs up to
50.8 percent. That is in high contrast to a much more
conservative 34.3 percent for companies that do not perform
production in China.
Recruiting and retaining qualified staff are, however, more
notorious in their impact on operations to companies that do
not develop any production activity in China. For this cohort,
recruiting qualified staff tops rising labor costs as the most
impactful to business operations. These results point directly
to white collar centered HR challenges.
Although not as impactful as the top three HR challenges,
another triad stands out. Social insurance / housing fund,
cost of training, and staff turnover, they all claim their seat as
challenges to business operations. For 72.5 percent of the
contributors, social insurance / housing fund represents a
challenge, though with varying degrees of intensity: 17.6
percent see it as highly impactful, another 54.9 percent see it
having a medium impact. The cost of training follows, with 59
percent of surveyed organizations defining it as of high or
medium impact. Staff turnover is a challenge to 56.9 percent
of contributors (considering high and medium impact
mentions combined).
Finally, the less impactful HR-related issues are dealing with
union organizations, strikes / unrest, or collective bargaining
negotiations. However, their perceived strain on operations
increases notably when companies only have production
activities in China. Strikes are considered highly impactful to
13.3 percent of all contributors; that percentage rises to 20
percent for production-only companies.
Recruiting Qualified Staff
Rising Labor Costs
Retaining Qualified Staff
High Cost for Training
High Staff Turnover
Social Insurance / Housing Fund
Strikes / Unrest
Dealing with Labor Bureau
Labor Arbitration Cases
Collective Bargaining
Union Organization
Note: Divided by the main focus of operations in China we have created these segments:Companies that only focus in production in China (n=65); companies that do not doproduction in China (n=193); companies with production in China, excluding those thatonly do production (n=225).
50.8
34.3
41.8
33.8
41.6
29.7
24.6
34.8
28.5
18.5
14.0
18.7
15.4
10.7
7.3
20.0
18.5
17.1
3.1
5.1
2.8
3.1
5.1
4.1
3.1
2.2
2.8
20.0
10.1
14.6
1.5
1.6
41.5
52.2
51.2
52.3
46.1
58.5
50.8
44.4
51.6
58.5
51.1
59.8
44.6
46.6
54.1
30.8
36.0
41.1
26.2
18.5
27.6
23.1
12.9
17.1
20.0
13.5
19.5
7.7
2.2
6.1
13.8
8.4
16.7
Companies with NO production activity in China:
Companies focusing ONLY in producing in China:
Companies with production and other activities in China:
High Medium
High Medium
High Medium

43
In partnership with
Labor Market
2019 | 2020& Salary Report
BR
IEF
Evaluation of Local Staff Skills
Information and Communication Technology (ICT) Skills*
36.3
30.6
23.9
48.8
51.5
50.9
14.9
17.9
25.2
Manage Networks
Programming
Development of Apps
Good Fair Poor
* Adapted from OECD’s Digital Economy Paper “Skills for a Digital World”, 2016 Background report on the ministerial meeting on the digital economy. Some ICT skills are new additions tothe survey in 2019; others have been reformulated to better fit the OECD definition. **Managing networks, programming, and developing apps are skills that do not apply to a significantproportion of the companies contributing to the survey. For a clearer understanding on how these skills are perceived the percentages are recalculated against the number of contributionswhen such skills apply: Manage networks, 281 companies; Programming, 235; Developing apps, 218.
Ranked by Good. Total Sample (%)
For any company with production in China, even if that is not
its sole focus of activity, rising labor costs have a higher
impact: 41.8 percent, compared to the 38.9 percent for the
overall sample.
Upon asking participants to evaluate a set of strategies on
their effectiveness to retain qualified staff, two cash-related
benefits claim the top spots: salary adjustments and
implementing a bonus system. Career advancement is
perceived as very effective by 39.2 percent of contributors,
and it is the third most effective tool when looking at the
strategies ranked by their combined percentage of very
effective and effective mentions.
To add further value regarding the information and
communication technology (ICT) skills, in this 2019 edition an
additional set of skills has been integrated. The added skills
needed to perform efficiently in a global digital environment
have been adapted from the Organization for Economic
Cooperation and Development’s (OECD) existing publications
on the digital economy. Compared to previous editions of the
Labor Market and Salary Report, the 2019 edition covers to a
fuller extent the hard and technical IT skills needed.
According to the OECD, ICT skills can be classified into four
categories: ICT generic skills, ICT specialist skills, ICT
complementary skills, and foundation skills. For simplification
purposes, in this report they have been boiled down to three
categories. First, ICT specialist skills (hard, technical skills
required to produce, operate, and maintain ICT products and
services); second, ICT soft skills (ability to use the technology
for professional purposes, and to perform tasks associated
with the use of ICT); and, finally, soft skills (English language
ability, work ethics, and reliability).
Except for technical / domain-specific skills, ICT specialist
skills apply only to a portion of the companies contributing.
The proportion of contributors on particular skills range from
the 45.1 percent of all contributing companies that provide
feedback on the development of applications, to the 58.2
percent that does so for network management. When they
apply, local staff skills are regarded mostly as fair. Managing
networks is perceived as good by 36.3 percent of the
companies that evaluated that skill; programming is assessed
as good by another 30.6 percent; finally, local staff skills with
regards to the development of apps present the most
moderate evaluation: 23.9 percent consider it good, when
such skill applies.
Technical / domain-specific skills, the one ICT specialist skill
that applies to most of the companies surveyed, is the fourth-
Programming (new)
Development of Apps (new)
Manage Networks (new)
Technical/Domain-specific Skills
Data Management and Analysis (new)
Search and Collect Information
Complex Problem-solving (reformulated)
Critical Thinking
Creativity and Innovation (reformulated)
Ability to Learn and Improve (reformulated)
Communication
Ability to Respond to Rapid Changes (new)
Teamwork
Execution/Decision-making (reformulated)
English Language Ability
Work Ethics
Reliability
ICTSpecialist Skills
ICTSoft Skills
Soft Skills
ICT Specialist Skills (Subset). Contributing sample (%)**
73.9
71.0
65.8
63.8
58.0
58.0
57.6
53.0
51.8
44.1
42.9
35.4
33.7
32.5
21.1
14.9
10.8
21.9
22.8
26.9
23.0
37.1
32.3
31.9
36.0
39.8
38.5
42.9
40.2
49.3
47.2
28.4
25.1
23.0
2.7
4.3
5.6
3.1
3.3
7.0
9.3
8.7
7.0
8.5
11.4
10.8
13.7
14.5
8.7
8.7
11.4
10.1
8.9
13.7
3.3
5.8
41.8
51.3
54.9
Reliability
Technical/Domain-specific Skills
Work Ethics
Ability to Learn and Improve
English
Communication
Data Management and Analysis
Creativity and Innovation
Execution/Decision-making
Critical Thinking
Teamwork
Complex Problem-solving
Ability to Respond to Rapid Changes
Search and Collect Information
Manage Networks
Programming
Development of Apps
Good Fair Poor n/a

In partnership with
44
Labor Market
2019 | 2020& Salary Report
BR
IEF
35.0
34.4
22.2
10.8
13.3
6.2
12.6
5.2
53.6
50.3
50.7
51.6
41.4
34.6
26.5
26.7
8.3
12.8
23.2
31.9
29.8
35.8
29.8
50.5
1.2
1.0
2.5
3.7
13.0
20.7
28.2
15.5
20.3
19.2
14.1
13.7
11.3
3.6
4.9
1.7
2.1
1.7
1.5
32.2
32.2
34.0
30.7
32.1
20.2
16.3
12.1
10.5
9.5
6.3
Insufficient Professional Skills
High Salary Expectations
Insufficient English Skills
Insufficient Work Experience
Not Enough Applications
Lack of Experience at Foreign Company
Company is Not Competitive Enough
Company Location
Reasons Why Positions Cannot Be Filled (%)
Ranked by Major Problem + Problem
Most Difficult Positions to Recruit (%)
Ranked by Very Difficult + Difficult
Engineering / R&D
Sales
Technical Sales
Technical Service
Marketing
IT
HR
Finance
Procurement
Administration
Management
Very difficult Difficult
Major problem Problem Small problem No problem n/a
most well-regarded across the board: 63.8 percent of
companies consider local staff skills in this regard as good.
The highest-ranked skills are, in this order: reliability (73.9
percent of contributors qualify their staff as good), work
ethics (71 percent), and teamwork (65.8 percent).
Despite the new additions, the overall ranking bears
significant resemblance to those of previous years. The first
four skills this year (reliability, work ethics, teamwork, and
technical / domain-specific skills) are the same as in 2018,
with the only difference being teamwork and technical /
domain-specific skills trading places in the ranking.
Critical thinking, and creativity and innovation are the skills
least often regarded as good: 32.5 and 33.7 percent,
respectively. Very closely ranked is the newly added ICT soft
skill data management and analysis: 35.4 percent of
contributors evaluate local staff as good in this particular
domain.
In 2019, for the first time the proportion of contributors
considering the effort needed to train staff as high did not
reach 60 percent. With 57.4 percent recorded the
percentage is four p.p. below last year’s mark.
Companies continue to struggle to fill technical positions,
relative to other types of roles: technical sales professionals
are very difficult or difficult to recruit for 52.5 percent of the
contributors; the recruitment of engineers and R&D
professionals is almost equally challenging (51.4 percent).
Management related roles top technical service professionals
as the third type of professionals that is hardest to recruit.
The lack of sufficient professional skills and misalignments on
salary expectations continue to register as the main culprits
companies perceive standing in the way of filling the most
difficult positions to recruit.
Effort Needed to Train Staff (%)
To Reach the Desired Qualification Level
61.5 61.5 63.6 61.457.4
36.131.1 30.9 30.4
36.3
7.77.5 5.6
8.2 6.3
2015 2016 2017 2018 2019
HighNeutralLow
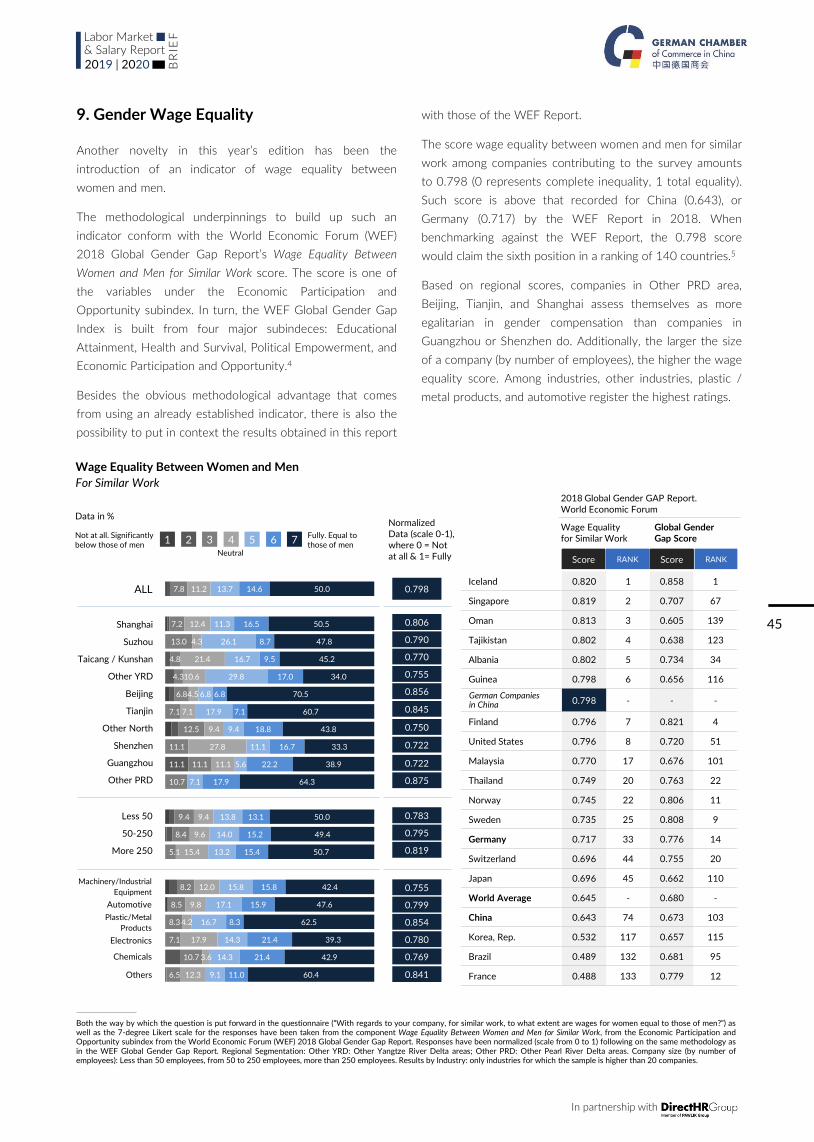
45
In partnership with
Labor Market
2019 | 2020& Salary Report
BR
IEF
Iceland 0.820 1 0.858 1
Singapore 0.819 2 0.707 67
Oman 0.813 3 0.605 139
Tajikistan 0.802 4 0.638 123
Albania 0.802 5 0.734 34
Guinea 0.798 6 0.656 116
0.798 - - -
Finland 0.796 7 0.821 4
United States 0.796 8 0.720 51
Malaysia 0.770 17 0.676 101
Thailand 0.749 20 0.763 22
Norway 0.745 22 0.806 11
Sweden 0.735 25 0.808 9
Germany 0.717 33 0.776 14
Switzerland 0.696 44 0.755 20
Japan 0.696 45 0.662 110
World Average 0.645 - 0.680 -
China 0.643 74 0.673 103
Korea, Rep. 0.532 117 0.657 115
Brazil 0.489 132 0.681 95
France 0.488 133 0.779 12
Wage Equality Between Women and Men
For Similar Work
Not at all. Significantly below those of men
7654321Fully. Equal to those of men
Neutral
Shanghai
Suzhou
Taicang / Kunshan
Other YRD
Beijing
Tianjin
Other North
Shenzhen
Guangzhou
Other PRD
ALL
Less 50
50-250
More 250
German Companiesin China
Both the way by which the question is put forward in the questionnaire (“With regards to your company, for similar work, to what extent are wages for women equal to those of men?”) aswell as the 7-degree Likert scale for the responses have been taken from the component Wage Equality Between Women and Men for Similar Work, from the Economic Participation andOpportunity subindex from the World Economic Forum (WEF) 2018 Global Gender Gap Report. Responses have been normalized (scale from 0 to 1) following on the same methodology asin the WEF Global Gender Gap Report. Regional Segmentation: Other YRD: Other Yangtze River Delta areas; Other PRD: Other Pearl River Delta areas. Company size (by number ofemployees): Less than 50 employees, from 50 to 250 employees, more than 250 employees. Results by Industry: only industries for which the sample is higher than 20 companies.
0.798
0.806
0.790
0.770
0.755
0.856
0.845
0.750
0.722
0.722
0.875
0.783
0.795
0.819
Global Gender Gap Score
Score RANK
Data in %
Chemicals
Plastic/Metal
Products
Automotive
Machinery/Industrial
Equipment
Others
Electronics
0.755
0.799
0.854
0.780
0.769
0.841
9. Gender Wage Equality
Another novelty in this year’s edition has been the
introduction of an indicator of wage equality between
women and men.
The methodological underpinnings to build up such an
indicator conform with the World Economic Forum (WEF)
2018 Global Gender Gap Report’s Wage Equality Between
Women and Men for Similar Work score. The score is one of
the variables under the Economic Participation and
Opportunity subindex. In turn, the WEF Global Gender Gap
Index is built from four major subindeces: Educational
Attainment, Health and Survival, Political Empowerment, and
Economic Participation and Opportunity.4
Besides the obvious methodological advantage that comes
from using an already established indicator, there is also the
possibility to put in context the results obtained in this report
with those of the WEF Report.
The score wage equality between women and men for similar
work among companies contributing to the survey amounts
to 0.798 (0 represents complete inequality, 1 total equality).
Such score is above that recorded for China (0.643), or
Germany (0.717) by the WEF Report in 2018. When
benchmarking against the WEF Report, the 0.798 score
would claim the sixth position in a ranking of 140 countries.5
Based on regional scores, companies in Other PRD area,
Beijing, Tianjin, and Shanghai assess themselves as more
egalitarian in gender compensation than companies in
Guangzhou or Shenzhen do. Additionally, the larger the size
of a company (by number of employees), the higher the wage
equality score. Among industries, other industries, plastic /
metal products, and automotive register the highest ratings.
11.1
7.8
7.2
13.0
4.8
4.3
6.8
7.1
12.5
11.1
11.1
10.7
9.4
8.4
5.1
8.2
8.5
8.3
7.1
10.7
6.5
11.2
12.4
4.3
21.4
10.6
4.5
7.1
9.4
27.8
11.1
9.4
9.6
15.4
12.0
9.8
4.2
17.9
3.6
12.3
13.7
11.3
26.1
16.7
29.8
6.8
17.9
9.4
11.1
5.6
7.1
13.8
14.0
13.2
15.8
17.1
16.7
14.3
14.3
9.1
14.6
16.5
8.7
9.5
17.0
6.8
7.1
18.8
16.7
22.2
17.9
13.1
15.2
15.4
15.8
15.9
8.3
21.4
21.4
11.0
50.0
50.5
47.8
45.2
34.0
70.5
60.7
43.8
33.3
38.9
64.3
50.0
49.4
50.7
42.4
47.6
62.5
39.3
42.9
60.4
Wage Equality for Similar Work
Score RANK
2018 Global Gender GAP Report. World Economic Forum
Normalized Data (scale 0-1), where 0 = Not at all & 1= Fully

In partnership with
46
Labor Market
2019 | 2020& Salary Report
BR
IEF
10. Additional HR Data
Turnover ratios for blue and white collar professionals remain
stable, with just a slight increase of 0.7 p.p. for blue collar
professionals, and 0.3 p.p. for white collar professionals. In
the 2018 edition, the slow, but steady, decline in turnover
ratios for both types of professionals was highlighted. The
decline by only a few tenth of p.p. indicates that such
reduction has been put to a halt.
Although the evolution of the turnover ratios has not been
according to expectations, there is an improvement in the
employment stability recorded in this edition that extends to
both blue collar workers and white collar professionals. In
both instances, the average duration in a company has gone
up approximately four months. As of 2019, companies report
blue collar workers to remain an average of 50.9 months, and
white collar professionals 54.3 months.
No remarkable differences are observed in the evolutions of
annual sick days and annual leave. These two HR metrics
have barely oscillated in the last four years.
13.3
46.6
3.59.8
14.0
50.9
4.010.4
11. Foreigners
Of the 483 organizations contributing to the survey, 76.2
percent employ foreign nationals: one p.p. below the
previous year’s mark. The proportion of companies indicating
they employ foreigners has gone from 83.2 percent in 2015
to the current 76.2 percent.
Small-sized companies (less than 50 employees) report the
largest percentage of foreigners to total employees (16.1
percent). As the size of the organizations increase the relative
weight of foreigners dilutes: companies with 50 to 250
employees report 3.3 percent of their staff are foreign
nationals; two percent at companies higher than 250
employees.
The most general formula to establish a labor relationship
with a foreign national is through the use of a local labor
contract (74.4 percent), whereas expat contracts are less
frequent (45.4 percent). Project-based contracts are used
only by 7.4 percent of contributors on a very common or
common basis.
The perception about the visa application process has
remained relatively stable in comparison with the results
registered in the previous edition. 40.1 percent of
Turnover(in %)
White Collar Workers
Blue Collar Workers
2018 2019
Average duration in company
(months)
Average annual sick days
Average annual leave (in days)
10.3
50.3
3.611.710.6
54.3
3.8
12
Turnover(in %)
2018 2019
Average duration in company
(months)
Average annual sick days
Average annual leave (in days)
77.2 76.263.2 62.4
79.9 77.894.4 90.6
22.8 23.836.8 37.6
20.1 22.25.6 9.4
Share of Companies Employing Foreigners (%)
Overall Results and by Company Size NoYes
20192018 20192018 20182018 20192018
ALL Less 50 50-250 More 250
5.8
12.1
3.42.4
6.3
16.1
3.32.0
All Less 50 50-250 More 250
Average Percentage of Foreign Employees (%)
Overall Results and by Company Size
2018 2019
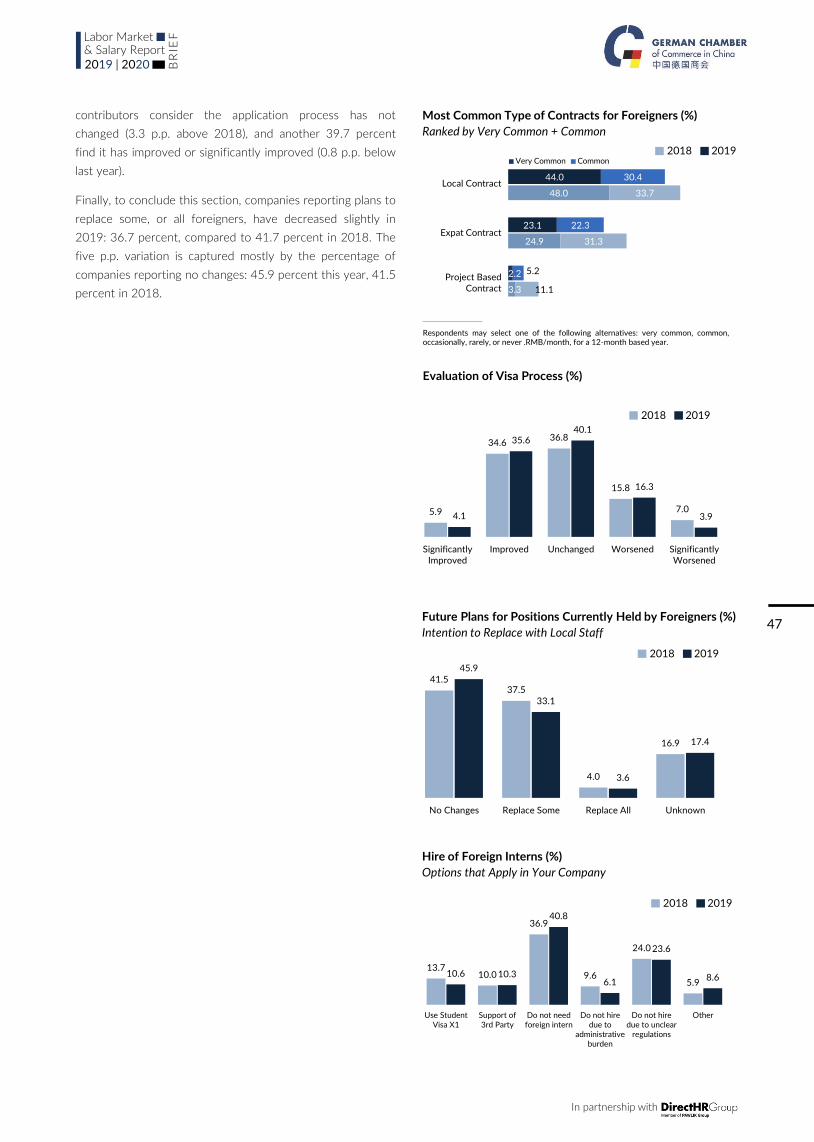
47
In partnership with
Labor Market
2019 | 2020& Salary Report
BR
IEF
contributors consider the application process has not
changed (3.3 p.p. above 2018), and another 39.7 percent
find it has improved or significantly improved (0.8 p.p. below
last year).
Finally, to conclude this section, companies reporting plans to
replace some, or all foreigners, have decreased slightly in
2019: 36.7 percent, compared to 41.7 percent in 2018. The
five p.p. variation is captured mostly by the percentage of
companies reporting no changes: 45.9 percent this year, 41.5
percent in 2018.
Future Plans for Positions Currently Held by Foreigners (%)
Intention to Replace with Local Staff
13.710.0
36.9
9.6
24.0
5.910.6 10.3
40.8
6.1
23.6
8.6
Use StudentVisa X1
Support of3rd Party
Do not needforeign intern
Do not hiredue to
administrativeburden
Do not hiredue to unclear
regulations
Other
Hire of Foreign Interns (%)
Options that Apply in Your Company
Evaluation of Visa Process (%)
5.9
34.636.8
15.8
7.04.1
35.640.1
16.3
3.9
SignificantlyImproved
Improved Unchanged Worsened SignificantlyWorsened
2018 2019
41.537.5
4.0
16.9
45.9
33.1
3.6
17.4
No Changes Replace Some Replace All Unknown
2018 2019
2018 2019
Local Contract
Expat Contract
Project Based Contract
Most Common Type of Contracts for Foreigners (%)
Ranked by Very Common + Common
CommonVery Common
44.0
48.0
23.1
24.9
2.2
3.3
30.4
33.7
22.3
31.3
5.2
11.1
2018 2019
Respondents may select one of the following alternatives: very common, common,occasionally, rarely, or never .RMB/month, for a 12-month based year.

In partnership with
48
Labor Market
2019 | 2020& Salary Report
BR
IEF
12. General Results Overview.
Total Cost per Employee: RMB/month, for a 12-month based year. P25: Percentile 25, compensation level below which 25 percent of the observations concentrate; Median: level ofcompensation that divides the distribution in two equal parts; P75: percentile 75, compensation level below which 75 percent of the observations concentrate. Wage Increases: data inpercentage. * There are 8 companies, that belong to the Other North region (outside Shenyang, Dalian, and Changchun) for which data is not presented due to limited sample size.
P75: 24,411
Median: 12,923
P25: 7,531
SHENZHEN 18 Companies
Total Cost per Employee
Wage Increases
260 data points
5.946.74
7.46
2019 2020
Forecast Effective
P75: 28,408
Median: 14,495
P25: 8,648
TAICANG 34 Companies
Total Cost per Employee
Wage Increases
644 data points
6.97
5.195.50
2019 2020
Forecast Effective
P75: 16,927
Median: 9,800
P25: 6,550
OTHER PRD 28 Companies
Total Cost per Employee
Wage Increases
531 data points
5.75 5.555.74
2019 2020
Forecast Effective
P75: 28,607
Median: 16,000
P25: 10,000
TIANJIN 28 Companies
Total Cost per Employee
Wage Increases
479 data points
5.04 5.356.08
2019 2020
Forecast Effective
MAXmin
Minimum value in a distribution
Maximum value in a distribution
P25 P75
25% of observations
50% of observations
75% of observations
Median
100% of observations
P75: 22,866
Median: 14,000
P25: 9,000
GUANGZHOU 18 Companies
Total Cost per Employee
Wage Increases
303 data points
6.096.63
7.25
2019 2020
Forecast Effective
P75: 20,000
Median: 10,000
P25: 6,500
SHENYANG 14 Companies
Total Cost per Employee
Wage Increases
232 data points
6.035.245.24
2019 2020
Forecast Effective
P75: 34,289
Median: 21,373
P25: 12,620
BEIJING 46 Companies
Total Cost per Employee
Wage Increases
431 data points
5.75 5.826.38
2019 2020
Forecast Effective

49
In partnership with
Labor Market
2019 | 2020& Salary Report
BR
IEF
P75: 21,000
Median: 12,000
P25: 7,900
KUNSHAN 10 Companies
Total Cost per Employee
Wage Increases
161 data points
5.39
3.81
5.92
2019 2020
Forecast Effective
P75: 32,000
Median: 19,000
P25: 11,00
SHANGHAI 196 Companies
Total Cost per Employee
Wage Increases
2,414 data points
6.065.575.65
2019 2020
Forecast Effective
P75: 27,081
Median: 15,000
P25: 9,000
SUZHOU 23 Companies
Total Cost per Employee
Wage Increases
424 data points
6.04
4.90
6.02
2019 2020
Forecast Effective
P75: 25,000
Median: 13,000
P25: 8,900
OTHER YRD 49 Companies
Total Cost per Employee
Wage Increases
837 data points
6.295.80
6.14
2019 2020
Forecast Effective
P75: 28,000
Median: 15,000
P25: 9,028
CHINA 483 Companies*
Total Cost per Employee
Wage Increases
7,128 data points
5.995.53
5.87
2019 2020
Forecast Effective
P75: 20,250
Median: 10,500
P25: 7,075
DALIAN & CHANGCHUN 11Companies
Total Cost per Employee
Wage Increases
248 data points
5.484.90
4.37
2019 2020
Forecast Effective
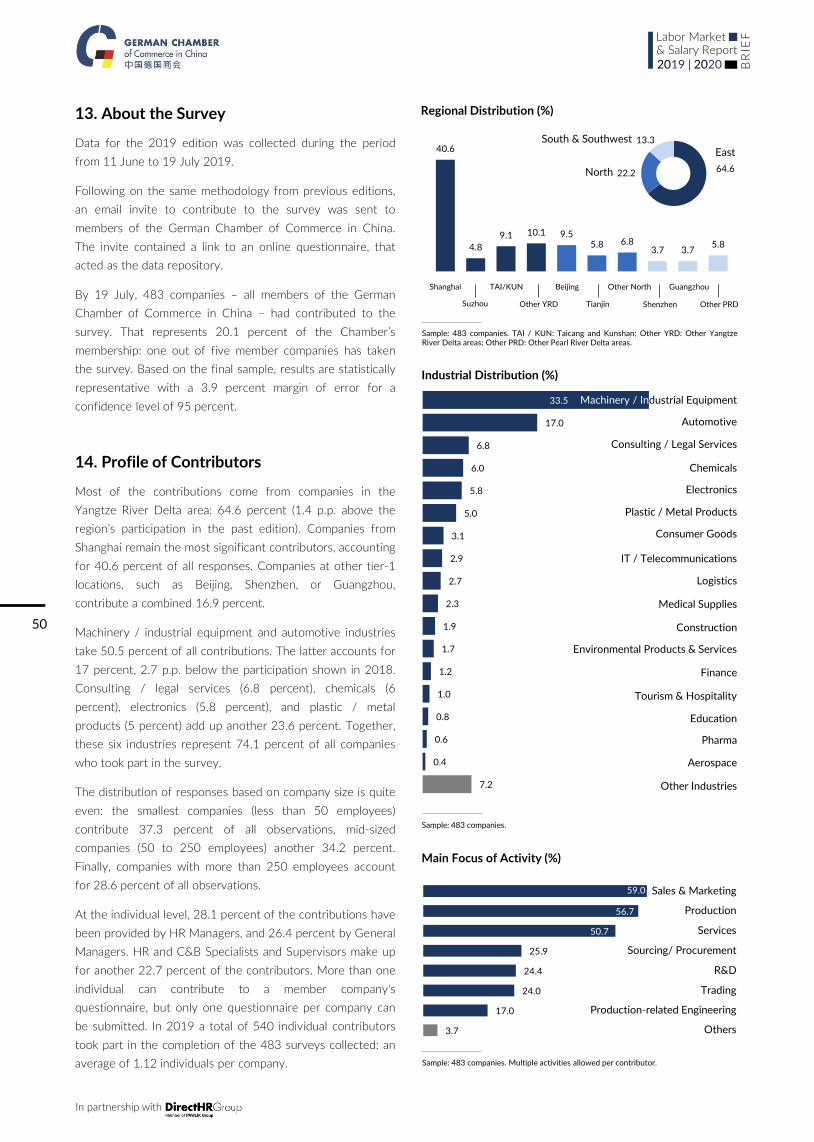
In partnership with
50
Labor Market
2019 | 2020& Salary Report
BR
IEF
Sample: 483 companies.
40.6
4.8
9.1 10.1 9.55.8 6.8
3.7 3.75.8
64.622.2
13.3
East
North
South & Southwest
13. About the Survey
Data for the 2019 edition was collected during the period
from 11 June to 19 July 2019.
Following on the same methodology from previous editions,
an email invite to contribute to the survey was sent to
members of the German Chamber of Commerce in China.
The invite contained a link to an online questionnaire, that
acted as the data repository.
By 19 July, 483 companies – all members of the German
Chamber of Commerce in China – had contributed to the
survey. That represents 20.1 percent of the Chamber’s
membership: one out of five member companies has taken
the survey. Based on the final sample, results are statistically
representative with a 3.9 percent margin of error for a
confidence level of 95 percent.
14. Profile of Contributors
Most of the contributions come from companies in the
Yangtze River Delta area: 64.6 percent (1.4 p.p. above the
region’s participation in the past edition). Companies from
Shanghai remain the most significant contributors, accounting
for 40.6 percent of all responses. Companies at other tier-1
locations, such as Beijing, Shenzhen, or Guangzhou,
contribute a combined 16.9 percent.
Machinery / industrial equipment and automotive industries
take 50.5 percent of all contributions. The latter accounts for
17 percent, 2.7 p.p. below the participation shown in 2018.
Consulting / legal services (6.8 percent), chemicals (6
percent), electronics (5.8 percent), and plastic / metal
products (5 percent) add up another 23.6 percent. Together,
these six industries represent 74.1 percent of all companies
who took part in the survey.
The distribution of responses based on company size is quite
even: the smallest companies (less than 50 employees)
contribute 37.3 percent of all observations, mid-sized
companies (50 to 250 employees) another 34.2 percent.
Finally, companies with more than 250 employees account
for 28.6 percent of all observations.
At the individual level, 28.1 percent of the contributions have
been provided by HR Managers, and 26.4 percent by General
Managers. HR and C&B Specialists and Supervisors make up
for another 22.7 percent of the contributors. More than one
individual can contribute to a member company's
questionnaire, but only one questionnaire per company can
be submitted. In 2019 a total of 540 individual contributors
took part in the completion of the 483 surveys collected: an
average of 1.12 individuals per company.
Industrial Distribution (%)
33.5
17.0
6.8
6.0
5.8
5.0
3.1
2.9
2.7
2.3
1.9
1.7
1.2
1.0
0.8
0.6
0.4
7.2
Regional Distribution (%)
Main Focus of Activity (%)
59.0
56.7
50.7
25.9
24.4
24.0
17.0
3.7
Production
Sales & Marketing
Services
Sourcing/ Procurement
R&D
Production-related Engineering
Trading
Others
Sample: 483 companies. TAI / KUN: Taicang and Kunshan; Other YRD: Other YangtzeRiver Delta areas; Other PRD: Other Pearl River Delta areas.
Shanghai TAI/KUN Beijing Other North Guangzhou
Suzhou Other YRD Tianjin Shenzhen Other PRD
Machinery / Industrial Equipment
Automotive
Electronics
Consulting / Legal Services
Plastic / Metal Products
Chemicals
IT / Telecommunications
Logistics
Consumer Goods
Medical Supplies
Construction
Environmental Products & Services
Finance
Tourism & Hospitality
Education
Pharma
Aerospace
Other Industries
Sample: 483 companies. Multiple activities allowed per contributor.

51
In partnership with
Labor Market
2019 | 2020& Salary Report
BR
IEF
77.8
17.3
4.9
37.334.2
28.6
Less 50 50-250 More 250
Company Size (%)
By Number of Employees
28.1
26.4
12.9
9.8
6.1
6.1
3.96.7
Profile of Contributors (%)
Position of the Company Representatives Participating in the
Survey
General Manager
HR Manager
Other
Profile of Contributors (%)
Nationality of the Company Representatives
Chinese
German
Other Nationality
HR Specialist / Supervisor
C&B Specialist / Supervisor
HR Director
Finance Director / Manager
C&B Manager
Sample: 483 companies & 540 contributors. An organization’s survey might have beencontributed for more than one individual.
Sample: 483 companies & 540 contributors. An organization’s survey might have beencontributed for more than one individual.

In partnership with
52
Labor Market
2019 | 2020& Salary Report
BR
IEF
15. Notes
1. A single number, the Pearson’s correlation coefficient r - often
referred only as the correlation coefficient r - is used to
represent the strength of a correlation between quantitative
variables. The r-value lies between -1 and +1. If r = +1, it
indicates a perfect positive direct correlation. If r = -1, it signals a
perfect negative linear relationship. If r = 0, there is no linear
relationship. See: David J. Hand, Statistics, A Very Short
Introduction (Oxford: Oxford University Press, 2008), page 98.
2. That is, only among the industries with at least 100 observations
at the variable “Expected Wage Increase” in this edition. There are
other industries, such as construction, education, environmental
products and services, logistics, pharma, or tourism and
hospitality where the effective wage increase reported this year
is also below that of their forecast from the previous edition.
However, they are not presented in the report due to insufficient
sample sizes.
3. Although the more frequently used methodologies to assess the
dispersion of a variable (how much a distribution is stretched or
squeezed) is through the use of the variance or the interquartile
range (IQR), the comparison in the relative gap between the
median and the average already signals that the CEO / GM and
the Deputy GM / Branch Manager roles are the ones that
present a more spread distribution. That is, it is among senior
management roles where the most significant differences in
compensation are observed. The IQR is a measure of statistical
dispersion equal to the difference between the 75th and 25th
percentiles of a given distribution. The larger the IQR, the more
stretched is a distribution; the smaller the IQR, the more
squeezed. In the 2019 edition, the IQR for the role CEO / GM
was RMB 93,750; for the Deputy GM / Branch Manager role
was RMB 50,000. They were, by far, the two largest IQRs, with
the next one following being that of Legal Manager (RMB
29.775).
4. The specific formulation of the question, the 7-degree Likert
scale for the responses, and the normalization of the scores
presented in this report are identical to those in the World
Economic Forum (WEF) 2018 Global Gender Gap Report. The
Wage Equality Between Women and Men for Similar Work is one of
the five variables that constitute the subindex Economic
Participation and Opportunity. The other four variables are
ratios: female labor force participation over male value; female
estimated earned income over male value; female legislators,
senior officials and managers over male value; and female
professional and technical workers over male value. In turn, the
Economic Participation and Opportunity subindex, together with
Educational Attainment, Health and Survival, Political
Empowerment, and Economic Participation and Opportunity are
combined to generate the Global Gender Gap Index. To access
the report: http://www3.weforum.org/docs/WEF_GGGR _2018
.pdf, accessed 27 August 2019.
5. The Wage Equality Between Women and Men for Similar Work
scores presented at the WEF 2018 Global Gender Gap Report
have been, in turn, sourced from the WEF Executive Opinion
Survey (EOS), 2017-2018. The study collected, between January
and April of 2018, the views of 16,658 business executives in
140 countries. The average number of contributions per country
was 92.3 with the minimum sample coming from Norway (31
contributions), and the largest samples coming from India (378),
Pakistan (339), and United States (291). The survey was
conducted at the national level by the WEF’s network of Partner
Institutes with the WEF supervising the survey. More information
available: http://reports.weforum.org/global-competitiveness-
report-2018/appendix-b-the-executive-opinion-survey-the-
voice-of-the-business-community, accessed 27 August 2019.

53
In partnership with
Labor Market
2019 | 2020& Salary Report
BR
IEF
Definitions for Job Positions:
PRODUCTION
Blue collar worker: Responsible for line work, packaging, basic
assembly; limited work experience.
Operator: Special but limited skills, operate machinery; some
work experience.
Shift leader: Responsible for managing parts of assembly,
scheduling, training new employees, performing limited
quality control, overviewing safety regulations.
Production Production Supervisor: Project planning, overall
production supervision, resource allocation (e.g. overtime and
material), quality control.
Production manager / Plant manager: Managing production,
planning new production methods, investment and
maintenance issues.
ADMINISTRATION
Junior admin staff: Responsible for basic administrative and
secretarial tasks; 0-3 years of work experience.
Mid-level admin staff: Responsible for administrative tasks,
secretarial and support tasks; 4-7 years of work experience.
Senior admin manager: Responsible for acting as secretary to
GM or similar, assistant to senior management; 8 or more
years of work experience.
SALES
Junior sales staff: Responsible for general sales / marketing,
limited technical knowledge; 0-3 years of work experience.
Mid-level sales staff: Responsible for sales / marketing activity,
basic technical knowledge; 4-7 years of work experience.
Senior sales manager: Responsible for advanced technical
knowledge, managing customers and key accounts /
marketing; 8 or more years of work experience.
PURCHASING
Junior purchasing staff: Responsible for general purchasing,
limited technical knowledge; 0-3 years of work experience.
Mid-level purchasing staff: Responsible for purchasing, some
quality control, some technical knowledge; 4-7 years of work
experience.
Senior purchasing manager: Responsible for advanced
technical knowledge, managing purchasing / quality control; 8
or more years of work experience.
FINANCE
Junior accountant / controller: Responsible for general
accounting, supporting senior accountant; 0-3 years of work
experience.
IV Appendix: Definitions
1. Regions
Regions have been assigned based on the city the company
is located at in accordance to responses in the survey. The
amount of observations (all positions combined) collected for
the variable “2020 Forecast Wage Increase” is: Shanghai 2,564
observations; Other East 2,080; Beijing 425; Other North
1,106; Shenzhen / Guangzhou 533; Other South 535.
Overall, 7,243 observations have been gathered for this
variable.
2. Positions
Production workers include the following individual positions:
Blue Collar, Operator, Shift Leader, Production Supervisor
and Production / Plant Manager. Junior professionals are
those with 0 to 3 years of job experience; Mid-Level
professionals have 4 to 7 years of job experience; Senior
professionals are those with 8 or more years. The overall
wage increase for a specific level of seniority (Junior, Mid-
Level, Senior) is the average of all observations for that level
of seniority in the following functional areas: Administration,
Sales, Purchasing, Finance, HR, Quality Control, Engineering /
R&D, Logistics, and Consultant / Project Manager.
Additionally, the expected increases for IT Staff and Legal
Staff are included in the calculations for Junior Professionals.
IT Manager and Legal Manager forecasted wage increases
are included in Senior Professionals. Finally, two roles
(Deputy GM / Branch Manager and CEO / GM) are
presented individually due to their uniqueness.
3. Industries
The graphic only shows industries with a minimum of 100
observations (all positions combined) for the variable 2020
forecast wage increase.
4. City Tiers
First tier cities are Shanghai, Beijing, Guangzhou, and
Shenzhen. Second tier cities are provincial capitals and cities
in the vicinity of first tier ones, such as Suzhou, Wuxi,
Taicang, Hefei, Nanjing, Dalian, Qingdao, Chongqing and
others. Third tier cities are smaller cities, mainly in the
Yangtze and Pearl River Delta.
Additional Definitions
Work Experience:
Junior: 0-3 years
Mid-Level: 4-7 years
Senior: 8 or more years

In partnership with
54
Labor Market
2019 | 2020& Salary Report
BR
IEF
Mid-level accountant / controller: Responsible for accounting,
writing reports, taxation; 4-7 years of work experience.
Senior finance manager: Responsible for accounting, dealing
with tax bureau, controlling payments and receivables,
preparing financial reports; 8 or more years of work
experience.
HUMAN RESOURCES
Junior HR staff: Responsible for basic administrative HR tasks,
support of HR management; 0-3 years of work experience.
Mid-level HR staff: Responsible for administrative HR tasks,
training, pay-roll, overtime management; 4-7 years of work
experience.
Senior HR manager: Responsible for managing the HR
department, hiring / firing, developing training / bonus
system; 8 or more years of work experience.
QUALITY CONTROL
Junior quality professional: Responsible for basic areas of
quality from inspection and supplier management to auditing
and documentation, support to quality Production
Supervisors and quality managers; 0-3 years of job
experience.
Mid-Level quality professional: Development, application and
maintenance of quality standards, materials and products.
Ensure that the quality team is properly monitoring and
testing processes, materials & products; 4-7 years of job
experience.
Quality manager: Responsible for continual quality
improvement, improve reliability of new products and
processes. Ensure quality management system conforms to
internal, ISO 9001 or regulatory requirements. Lead a team
of quality inspectors, technicians, analysts and Production
Supervisors; 8 or more years of job experience.
ENGINEERING / R&D
Junior engineer / R&D professional: Responsible for basic
technical tasks, support of senior engineers, basic CAD etc.,
simple IT; 0-3 years of job experience.
Mid-level engineer / R&D professional: Responsible for design
tasks, quality inspection, basic technical adjustments and
product development, IT related tasks; 4-7 years of job
experience.
Senior engineer / R&D manager: Responsible for engineering,
R&D tasks, advanced technical adjustments/implementation;
8 or more years of job experience.
LOGISTICS
Junior logistics officer: Responsible for basic shipping
preparation, basic communication with customers and
service providers, supporting more senior staff; 0-3 years of
job experience.
Mid-level logistics officer: Responsible for preparing customs
forms, tracking shipping, account management, contact with
customs officials; 4-7 years of job experience.
Senior logistics officer: Responsible for managing all import
and export activities, negotiations with service providers,
direct communication with upper management, direct contact
with customs officials; 8 or more years of job experience.
CONSULTANT / PROJECT MANAGER
Junior level: Responsible for basic research, assisting on
projects; 0-3 years of work experience.
Mid-level: Responsible for business intelligence, custom
research; 4-7 years of work experience.
Senior level: Responsible for key accounts, acting as senior
analyst; 8 or more years of work experience.
SENIOR MANAGEMENT
Deputy General Manager / Branch Manager: Supports
CEO/GM to oversee day-to-day operations. Analyze and
implement policies and procedures, resolve internal and
external grievances.
CEO / General Manager / Managing Director: Develops
business strategies and plans; align short term with long-term
goals. General supervision of the company as well as the day
to day operations.
SPECIALISTS
IT staff: Responsible for system analysis, SAP, IT
administration; 0-3 years of job experience.
IT manager: Responsible for programming, SAP, senior IT
administrator; 8 or more years of job experience.
Legal staff: Responsible for client counseling, business
development; 0-3 years of job experience.
Legal manager: Responsible for key accounts, legal cases; 8 or
more years of job experience.
Driver: Responsible for transportation of goods and
passengers.

Development Solutions
At Direct HR Group we help our clients manage change. As a group of specialized teams we provide best-of-class solutions in managing your human capital. With a team of 50 professionals across four cities in China – Beijing, Shanghai, Shenzhen, and Ningbo - we are able to speak eye-to-eye with our client partners and execute on the ground.
Your Partner in
Business LeadersManagers & SpecialistsLarge Project Recruitment
Online Assessments ToolsOrganizational DiagnosisOD Interventions
Organizational DiagnosisLeadership ExcellenceSales Force Development
HR Market InformationCompensation & BenefitsPractical Guides
Executive SearchManagement AssessmentChange Management
In today’s world change is a constant and in every organization change starts with its people
At Direct HR Group we help you better:
Tian An Center, Unit 2605
338 West Nanjing Road, 200003
Tel.: +86 21 6010 5000
Email: [email protected]
Shanghai
602, Gate 2, Block 6, Vanke Wonderland
Shunyi, Beijing, 101300
Tel.: +86 156 2498 1224
Email: [email protected]
Beijing
Room 3515, 35/F, Panglin Plaza, No. 2002
Jiabin Rd, Luohu District, Shenzhen, 518001
Tel.: +86 755 2238 5221
Email: [email protected]
Shenzhen
No. 501, Dong Qing Road
Hi-Tech Park Ningbo, 315 103
Tel.: +86 574 8848 7007
Email: [email protected]
Ningbo
Since 2008
www.directhrgroup.com
Leadership Solutions

German Chamber of Commerce
in China | North China
0818 Landmark Tower 2,
8 Dongsanhuan (N) Rd.
Chaoyang, Beijing 100004
Tel. +86 10 6539 6688
German Chamber of Commerce
in China | Shanghai
29F, Gopher Center
No. 757 Mengzi Road
Huangpu District | Shanghai 200023
Tel. +86 21 5081 2266
German Chamber of Commerce
in China | South & Southwest China
Room 1903, Leatop Plaza
32 Zhu Jiang East Road
Tianhe District, Guangzhou 510620
Tel. +86 20 8755 2353
www.china.ahk.de/chamber
Boos t
Your
Bus iness !
The German Chamber of Commerce in China
The German Chamber of Commerce in China supports German companies
in their activities in China. Divided into the regional centers of Beijing,
Shanghai and South & Southwest China, it assists all together about 2,300
companies.
It is thereby one of the largest foreign chambers in China. The Chamber
offers a broad range of seminars, workshops and events to German
companies, in addition to access to an enormous network and assistance
with matters in relation to the local and regional government offices.