
Labor Law - Overtime Wages - Interstate Motor Carriers Can ...
Upload
truongtramCategory
view
221download
0
CESifo Economic Studies, Vol. 51, 1/2005, 47–75
© Ifo Institute for Economic Research, Munich, 2005.
Labor Market Institutions, Wages, and Investment: Review and Implications
Jörn-Steffen Pischke∗
Abstract: Labor market institutions, via their effect on the wage structure, affect the investment decisions of firms in labor markets with frictions. This observation helps explain rising wage inequality in the US, but a relatively stable wage structure in Europe in the 1980s. These different trends are the result of different investment decisions by firms for the jobs typically held by less skilled workers. Firms in Europe have more incentives to invest in less skilled workers, because minimum wages or union contracts mandate that relatively high wages have to be paid to these workers. I report some empirical evidence for investments in training and physical capital across the Atlantic, which is roughly in line with this theoretical reasoning. (JEL E22, E24, J23, J24, J31)
1 Introduction
Labor market institutions affect the outcomes of workers in a variety of ways. Many of these institutions are related to the wage setting process, and hence influence the wages paid to workers directly. But even institutions like unem-ployment insurance or employment protection will affect wages indirectly, because they change workers’ bargaining power in the wage setting process. The wages actually set will in turn influence the hiring decisions of firms, and hence employment outcomes. There is a vast literature studying these issues, both theoretically and empirically.
In this paper, I will focus on a more indirect impact of labor market institu-tions, and of the resulting wage structure, namely their effect on investment decisions made by firms. These decisions to invest in training of the work force and physical capital will change the productivities of workers, and hence also influence wage and employment outcomes. I will focus on a particular ∗ CEP, London School of Economics, Houghton Street, London WC2A 2AE, UK; e-mail:
[email protected]. This paper was prepared for the CESifo Area Conference Employment and Social Protection in Munich on June 11–12, 2004 and draws heavily on my previous work in this area. I thank Daron Acemoglu, Francesco Caselli, Jason Cummins, two anonymous referees and the confer-ence participants for helpful comments and the Economic and Social Research Council (Grant RES-000-22-01-0160) for financial support. This paper was written while I was visiting the NBER in Cambridge, and I thank them for their hospitality. Some of the data used in this paper have been obtained from the German Zentralarchiv für Empirische Sozialforschung at the University of Köln (ZA). Neither the producers of the data nor the ZA bear any responsibility for the analysis and interpretation of the data in this paper.

Jörn Steffen Pischke
CESifo Economic Studies, Vol. 51, 1/2005 48
premise: frictions in the labor market are important, so that these markets deviate from the competitive benchmark. These frictions will lead to rents for the firms. Labor market institutions distort the wage structure, and hence the amount of employment rents firms earn from workers with different productiv-ities. This in turn will influence the decisions of firms as to what investment to make in particular workers or jobs. Because labor market institutions, and hence the wage structure, are so different in Anglo Saxon and continental European countries, this story helps us understand the different evolutions of the labor markets in these countries, as I will argue.
In this paper, I will review some of the previous work in this area, as well as putting this work in a broader perspective and draw out some implications. I start with a reconsideration of some arguments, which Daron Acemoglu and I, as well as others, have made in order to understand the financing of on-the-job training. The traditional framework for human capital investment implies that workers will pay for skills which are transferable between employers, and reap the full rewards of this investment. In a series of papers (Acemoglu and Pischke 1998; 1999a; b), we have shown that this may not be true in frictional labor markets. In the next section, I will review the key theoretical arguments for why frictions and the wage structure matter for human capital investment decisions.
In Section 3, I will argue that a better understanding of the investment behav-ior of firms might help us better understand the differential evolution of labor markets across the Atlantic during the past two decades. In a nutshell, wage inequality has increased dramatically in the US, and to some extent in Canada and the UK. Wage inequality has remained more or less constant in continental Europe but unemployment has risen sharply during this period. The standard explanation for the trend in wage inequality in the US is skill biased technical change, globalization, or some combination of these. However, these same trends should have impacted Europe in a rather similar way. An attractive hypothesis, often labeled the “Krugman hypothesis” (Krugman 1994) links the differential developments to labor market institutions. While both continents were hit by the same shock, labor market institutions in Europe have protected the wages of low skilled workers but led to higher unemployment.
Unfortunately, the empirical evidence does not seem to support the Krugman hypothesis. It implies that employment should have collapsed in Europe for low skilled workers only. Instead the data show employment trends which are far too uniform across skill groups, as has been demonstrated by Nickell and Bell (1995; 1996), Card, Lemieux, and Kramarz (1999) and Krueger and Pischke (1998). However, the model of human capital investment in frictional labor markets has important implications for the evolution of investment choices made by firms. In particular, if workers cannot make their own human
Labor Market Institutions, Wages, and Investment
CESifo Economic Studies, Vol. 51, 1/2005 49
capital investments, it implies that firms will invest less in low skilled workers in the US and more in continental Europe. The same argument can easily be extended to physical capital investment (as is done in Acemoglu 2003). Hence, differential investments by skill group might have altered the relative produc-tivities of workers in different countries in a way to lead to the different labor market outcomes we observe for the 1980s.
This suggests that understanding the investment behavior of firms in the face of labor market imperfections might be an important ingredient in understand-ing the behavior of labor markets. The story I have outlined above also seems like an attractive alternative to the Krugman hypothesis, given the observed employment trends. Nevertheless, this still leaves open the question whether the alternative explanation is of any more relevance empirically.
I will address this issue in Section 4 of the paper. I will first review some of the existing evidence, which links labor market institutions and training out-comes directly. I will then go on and present some evidence for the evolution of training in the US and Germany. However, data on human capital invest-ment is highly imperfect, and no comparable data across countries is available for this exercise. I will therefore also present some new evidence on invest-ment in physical capital and on labor productivity growth. The evidence on investment is more favorable to the story I outlined than the findings on productivity growth.
The big question arising from all this is, of course, what it means for labor market reform in Europe. This is a difficult question, and I believe that we know far too little empirically of what exact model of investment is correct to be able to answer it at this stage. Nevertheless, I offer some suggestions in the conclusion, and point out where more research is needed.
2 Training in imperfect labor markets
The standard neoclassical model of human capital investment due to Becker (1964) assumes that labor markets are perfectly competitive. In this case, workers will be paid according to their marginal product, and firms do not receive any rents from the employment relationship. If skills are general, i.e. perfectly transferable from one employer to the next, then firms cannot finance any of the human capital investment directly because they would never be able to recoup any of their investment. Hence, all investment has to be financed by the worker. This may happen implicitly, through lower wages earned during the training period to reimburse the firm for any outlays. As long as wages are flexible, and workers have the resources to finance the investment, their

Jörn Steffen Pischke
CESifo Economic Studies, Vol. 51, 1/2005 50
training choices should be made optimally, and there is no role for government intervention in the market for human capital.
Things may be different when labor markets are imperfect, as studied in detail in Acemoglu and Pischke (1999a; b). Figure 1 explains the key argu-ment t denotes the level of training or skill of a worker. f(t) denotes produc-tivity (marginal product), which rises with t. In the absence of labor market imperfections, the wage would be equal to f(t). Frictions in the labor market imply that wages are lower than f(t), for example like w(t) in the figure. The firm earns a rent f(t) – w(t) from the employment relationship. The way the figure is drawn, this rent is independent of t. In the absence of any labor market institutions impacting the wage structure, the firm still has no incen-tive to pay for the training of its worker, although it could now possibly finance such training out of the employment rent. Nevertheless, this rent is the same at all skill levels, so the firm will prefer an unskilled worker, which is available at zero training cost.
Figure 1
Training in labor markets with rents and minimum wages
Now suppose there is a government or union imposed minimum wage, denoted wmin in the figure. The wage the firm now has to pay is wmin for all workers with training level below t0, and it is still w(t) for skill levels above that. The way the figure is drawn, the firm would now actually make a loss from a
f(t)
w(t)
f(t ) w(t ) c(t )
c(t)
w min
t00 t

Labor Market Institutions, Wages, and Investment
CESifo Economic Studies, Vol. 51, 1/2005 51
worker who is completely unskilled (t = 0) because the minimum wage is above the productivity level of this worker. In a competitive labor market the firm would have no choice but to lay off the worker. In a frictional labor market, the firm has another choice, however. By giving the workers some training, it can restore its employment rent. This is the case for any training level of t0 and above. Of course, training is costly for the firm, and the training cost is denoted by c(t) in the figure. Hence, the firm will choose the lowest level of training which gives it f(t) – w(t), which is t0, and the firm will now earn f(t0) – w(t0) – c(t0).
This demonstrates how labor market institutions can create an incentive for firms to invest in the skills of their workers. Strictly speaking, labor market institutions are not really necessary for this argument, although the example of a minimum wage highlights the workings of the model nicely. However, what is necessary for firms to invest is simply that the wage structure w(t) is com-pressed, i.e. that w(t) is flatter than f(t). If this is the case, then the rents the firm can earn from more skilled workers will be greater than the rents earned from less skilled workers. Hence, it may invest in training. Such a compression of the wage structure may come about for a variety of reasons, many linked to the natural operation of the labor market, like search and bargaining, informa-tion asymmetries, complementarities with firm specific skills, etc. (see Acemoglu and Pischke 1999a; b for the details).
So far, I have only demonstrated that firms have an incentive to invest in the training of their workers, even when the skill is easily transferable to another employer. However, workers may also want to invest in their own skills: the traditional Becker mechanism. Hence, depending on the contract between the worker and firm, it could be either the worker or the firm, who makes the investment, or the investment could be shared by both parties. All we can say is that firms will bear the full investment cost when workers cannot contribute to the investment at all. This may happen if workers are credit constrained so they are unable to bear the upfront costs, or if it is impossible to write contracts over the training to be provided by the firm, if the worker pays the firm up-front. These considerations are likely to be important for at least some workers, and hence at least some human capital investments should be made by firms in practice.
If this is the case, the implication of the theory is that training investments should go up when wage compression, the slope of w(t) relative to f(t), decreases. This can easily be seen in Figure 1 again by returning to the exam-ple of a minimum wage. If the minimum wage is higher, it will intersect w(t) at a higher training level, which will be the training level chosen by the firm (as long as c(t) < f(t) – w(t)).

Jörn Steffen Pischke
CESifo Economic Studies, Vol. 51, 1/2005 52
3 The evolution of wage inequality, employment, and the role of investment
I will now turn to the question whether the framework outlined in the previous section can help us understand the evolution of labor markets in the US and Europe in the past two decades. Wage inequality has increased sharply in the US during this period. This increase was concentrated in the 1980s, while wage inequality in the 1990s remained relatively stable (see Card and DiNardo 2002; Lemieux 2003). Table 1 presents some data on the evolution of wage inequality in a number of selected OECD countries, focusing on the period from 1980 to 1990. The data are taken from the OECD Employment Outlook 1996 (OECD 1996) and refer to the change in the ratio of the 90th and 10th percentile of the wage distribution during the decade. The table shows that wage inequality increased dramatically in the US but remained stable or fell in continental European countries. Canada and the UK also saw rising wage inequality in these data, but by less than the US.
The standard explanation for increasing wage inequality in the US is skill biased technical change (see Acemoglu 2002 for a recent survey, and Card and DiNardo 2002 for a critical view). According to this hypothesis, technological developments (or deliberate decisions by firms) lead to investments which were complementary with more skilled workers (or more so than in previous decades). This raised the wages of more skilled workers, while depressing the wages of less skilled workers.
A challenge for this hypothesis is to explain why trends in wage inequality were so different in Europe, when technological developments should be fairly similar across most OECD countries. Labor market institutions are a possible explanation, as first noted by Krugman (1984), Freeman (1995) and others. Figure 2 illustrates the argument. This is a standard labor supply–labor demand diagram with relative wages of more and less skilled workers on the vertical axis and relative employment of more and less skilled workers on the horizon-tal axis. The downward sloping line is relative labor demand. Relative labor supply is probably comparatively inelastic in the short run, and is hence drawn as a vertical line. The intersection yields relative wages and employment at the beginning of the period, i.e. around 1980. Skill biased technical change implies that relative labor demand shifted out. In the US, this implies an increase in wage differentials and little change in relative employment. In Europe, in contrast, labor market institutions prevent wage inequality from rising. This is denoted by the flat wage setting schedule in the graph. It implies that there is a gap between relative supply and demand in Europe at the prevailing relative wage, denoting relative unemployment. In a simple version of this story there would be full employment of skilled workers and the relative unemployment

Labor Market Institutions, Wages, and Investment
CESifo Economic Studies, Vol. 51, 1/2005 53
would imply unemployment among unskilled workers in Europe. Unemploy-ment has indeed increased dramatically in Europe during this period, and table 1 provides some data for the selected countries.
Table 1
Labor market trends and investment in selected OECD countries
Standardized Unemployment Rate (%)
Country
Change in Wage
Inequality 1980–90
1973–79
1980–87
1988–95
1996–99
Regression Coefficient of
Investment Growth on
Skill
United States 0.73 6.4 7.6 6.1 4.8 0.35 (0.10)
United Kingdom 0.50 4.8 10.5 8.8 6.9 ---
Canada 0.44 6.9 9.7 9.5 8.7 0.23 (0.11)
Japan 0.15 1.8 2.5 2.5 3.9 ---
Austria 0.06 1.4 3.1 3.6 4.3 -0.00 (0.13)
Finland 0.04 4.1 5.1 9.9 12.2 0.12 (0.11)
Denmark 0.02 4.1 7.0 8.1 5.3 ---
France 0.00 4.3 8.9 10.5 11.9 -0.02 (0.13)
Australia -0.03 4.6 7.7 8.7 7.8 0.14 (0.15)
Norway -0.07 1.8 2.4 5.2 3.9 0.19 (0.10)
Italy -0.20 4.5 6.7 8.1 9.9 0.16 (0.06)
Belgium -0.22 5.8 11.2 8.4 9.2 -0.32 (0.25)
West Germany -0.26 2.9 6.1 5.6 7.l 0.03
(0.06) Notes: The changes in wages inequality refers to the change in the ratio of the 90th and 10th percentile of the wage distribution for all workers. These are calculated from the data in table 3.1 in the 1996 OECD Employment Outlook. Where possible changes are calculated for the period 1980–90 except for the following: Belgium (1986–90), Canada (1981–90), West Germany (1983–90), and Italy and Norway (1980 – 91). In those cases, the changes were rescaled to correspond to a ten year period. Data on unemployment rates are taken from Nickell (2003) and refer to the OECD standardized unemployment rate, with some adjustments. The regression coefficient of investment growth on skill refers to the coefficients βc as described in the text for investment growth from 1980–90, standard errors are in parentheses.

Jörn Steffen Pischke
CESifo Economic Studies, Vol. 51, 1/2005 54
Figure 2
Relative labor demand and supply over the 1980s
Relative wage
Relative employment
Relative Labor Demand
1980
1990Relative Labor Supply
Wage setting schedule in Europe
wUS-90
wUS-80
wEurope
Rel. unempl. in Europe
While this hypothesis is simple and appealing, the problem is that it implies a gap in relative unemployment or employment rates in Europe, not simply an increase in unemployment. Nickell and Bell (1995; 1996) first demonstrated that relative unemployment rates by skill increased far too uniformly in Europe to be consistent with this story. The problem with looking at unemployment rates is that it is not completely clear whether one should look ratios or differ-ences of unemployment rates by skill group. Unfortunately, which way the analysis is done often matters because unemployment rates for the skilled are relatively low and unemployment rates for the unskilled are much higher. This problem can be avoided by looking at employment rates, an exercise first undertaken by Card, Kramarz, and Lemieux (1999) for the US, Canada, and France. If the Krugman hypothesis is correct, employment trends for different skill groups should be roughly the same in the US, while employment of the unskilled should have fallen (or risen less) in France. Canada should occupy an intermediate position. Instead, employment trends are virtually indistinguish-able across the three countries.
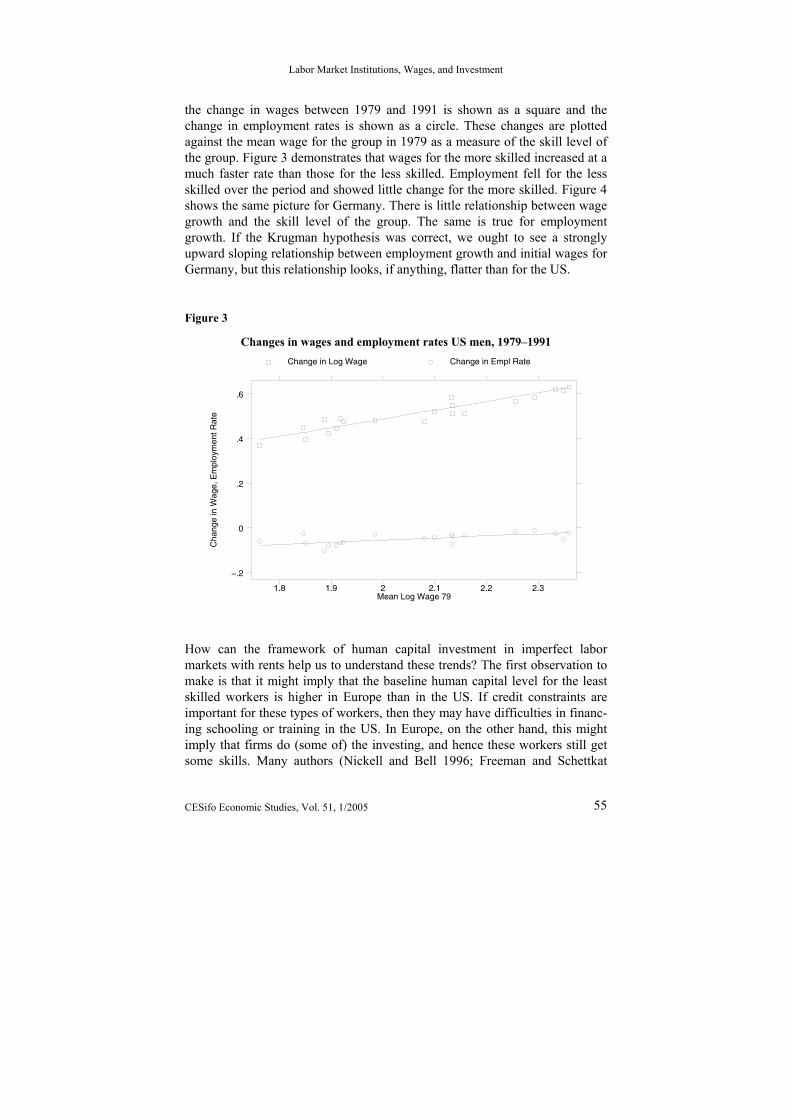
Krueger and Pischke (1998) have repeated this exercise for the US and Ger-many, and I present our results in Figures 3 and 4. For this analysis, individu-als have been grouped into 20 groups by age and education. For each group,
Labor Market Institutions, Wages, and Investment
CESifo Economic Studies, Vol. 51, 1/2005 55
the change in wages between 1979 and 1991 is shown as a square and the change in employment rates is shown as a circle. These changes are plotted against the mean wage for the group in 1979 as a measure of the skill level of the group. Figure 3 demonstrates that wages for the more skilled increased at a much faster rate than those for the less skilled. Employment fell for the less skilled over the period and showed little change for the more skilled. Figure 4 shows the same picture for Germany. There is little relationship between wage growth and the skill level of the group. The same is true for employment growth. If the Krugman hypothesis was correct, we ought to see a strongly upward sloping relationship between employment growth and initial wages for Germany, but this relationship looks, if anything, flatter than for the US.
Figure 3
Changes in wages and employment rates US men, 1979–1991
Cha
nge
in W
age,
Em
ploy
men
t Rat
e
Mean Log Wage 79
Change in Log Wage Change in Empl Rate
1.8 1.9 2 2.1 2.2 2.3
−.2
0
.2
.4
.6
How can the framework of human capital investment in imperfect labor markets with rents help us to understand these trends? The first observation to make is that it might imply that the baseline human capital level for the least skilled workers is higher in Europe than in the US. If credit constraints are important for these types of workers, then they may have difficulties in financ-ing schooling or training in the US. In Europe, on the other hand, this might imply that firms do (some of) the investing, and hence these workers still get some skills. Many authors (Nickell and Bell 1996; Freeman and Schettkat

Jörn Steffen Pischke
CESifo Economic Studies, Vol. 51, 1/2005 56
2001; Blau and Kahn 2001) have noted that low skilled workers in Europe tend to be more skilled than low skilled workers in the US, although some of these differences may stem from differences in the school systems. If the US and Europe are now hit by the same relative labor demand shock, which is unfavorable to low skilled workers, this will imply that there is a much larger mass of workers to be affected in the US than in Europe. Hence, we ought to see much less in terms of an increase in relative wage inequality in Europe in response to the same shock.
Figure 4
Changes in wages and employment rates German men, 1979–1991
Cha
nge
in W
age,
Em
ploy
men
t Rat
e
Mean Log Wage 79
Change in Log Wage Change in Empl Rate
2.4 2.6 2.8 3
−.2
0
.2
.4
.6
In order to see this more formally, return to the setup in Figure 1 which is reproduced in Figure 5. Skill biased technical change implies that the schedule f(t), which denotes the worker’s productivity level, becomes steeper. This is depicted by the two schedules labeled “1980” and “1990” in the figure. If there is a minimum wage in Europe but labor markets are otherwise perfect, this shift may imply some additional loss of employment for relatively low skilled workers. If there are employment rents on the other hand, firms have an incentive to provide enough training for workers to have at least skill level t0. There will be no workers in Europe with skills below this level, and hence we may not see any relative employment declines for this group.

Labor Market Institutions, Wages, and Investment
CESifo Economic Studies, Vol. 51, 1/2005 57
Figure 5
Training with skill biased technical change
f(t) 1980
w(t)
f(t)w(t)c(t)
wmin
t00t
f(t) 1990
The second point is that skill biased technical change coupled with relative wage rigidity in Europe may imply changes in relative investment incentives. In order to see this, consult Figure 5 again. Our assumption is that labor markets in the US are relatively flexible. For simplicity, assume that wages in the US are equal to f(t). In Europe, wages are given by w(t), possibly coupled with a minimum wage but the wage schedule is the same in 1990 as in 1980. As skill biased technical change takes place, wages change accord-ing to the rotation of the f(t) schedule in the US. Because workers make all the investment in the US labor market, their incentive to invest has now increased. But if workers are credit constraint, they may not be able to make additional investments. In Europe, the change in productivities is also given by the two f(t)-schedules. Because the wage schedule is unchanged, this means that the incentives for the firm to invest in training have increased in Europe. Hence, if workers are credit constrained, investment in training in Europe may have increased.
Note that this argument only works if workers are credit constraint, and hence firms make the investment. The same reasoning can therefore be more straight-forwardly applied to physical capital investment, where it is easier to argue that the costs are solely born by the firm. This argument has been laid out in
Jörn Steffen Pischke
CESifo Economic Studies, Vol. 51, 1/2005 58
Acemoglu (2003), and can be illustrated most clearly with a numerical example adapted from that paper. Assume that a worker’s productivity is 10 in the absence of investment, and 20 after investment. Investment costs 6, and the costs are paid by the firm. Rents are shared in a way so that wages are half of productivity. This means that the firm obtains a profit of 5 without investment, but only 4 if it made the investment (20 – 10 – 6 = 4). Hence it will not under-take the investment for this type of worker.
Now assume there is a minimum wage of 7 in place. It is easy to see how this changes the picture. Without the investment, the firm makes a profit of 3 because it has to pay a wage of 7 to a worker with a productivity of 10. If it invests, the minimum wage will no longer bind, and it will still make a profit of 4 as before. Hence, investing is more profitable. The intuition for the result is the exact same as in the training case discussed above: it is the interaction of employment rents and wage compression through the minimum wage which give the firm an incentive to invest.
It is easy to see how this mechanism will modify the outcomes if both the US and Europe are subject to skill biased technological change. Skill biased technical change should be thought of here as a change in the world technol-ogy frontier. Firms in each country will then decide which technologies to adopt and which investments to make. Suppose, the costs of investing were only 4 initially, rather than 6. In this case it would always pay for firms to invest in low skilled workers. Now suppose that the 1980s were characterized by technologies which were more costly to implement, and the investment costs now rise to 6. Firms in the US will not adopt the new technologies with low skilled workers anymore, following the reasoning above.
Think of high skilled workers as workers with productivities of 20 without investment and 40 with investment, so that investing is always profitable, and the minimum wage does not affect these workers. In Europe, where minimum wages are in place, firms will make the investment with both high and low skilled workers, before and after the increase in investment costs. Hence, the observed technical change in Europe will be less skill biased than in the US.
This model generates sharply rising wage inequality in the US. In the numerical example, the wages of high skilled relative to low skilled workers will rise from 2 before the new technology is available to 4 after it is available. In Europe, wage differentials will remain constant at 2. The model has other attractive features. Acemoglu (2003) embeds this in a matching model of unemployment. The rising investment costs in the 1980s imply that profits will fall in both the US and Europe, which will reduce job creation and hence raise unemployment. However, profits will fall less in the US (because the European minimum wage leads firms to make suboptimal investment decisions in low
Labor Market Institutions, Wages, and Investment
CESifo Economic Studies, Vol. 51, 1/2005 59
skilled workers) than in Europe, so unemployment will rise more in Europe. Moreover, unemployment may rise across the board, rather than just for less skilled workers, if there are some complementarities in the creation of skilled and unskilled jobs.
4 What is the empirical evidence?
I have argued above that the wage structure, and hence labor market institu-tions, affect the investment behavior of firms. Understanding how wages affect the investment behavior of firms, in turn, helps us understand the evolutions of relative wages and employment in Europe and the US during the past two decades. The story is attractive, because it fits the facts on wage inequality and employment or unemployment better than previous explanations. However, the question remains: is this the correct explanation?
In order to take a stab at answering this question, we need some direct empirical evidence on the investment behavior of firms in the US and Europe, and how this investment behavior changed during the 1980s. In this section, I will present a few pieces of evidence. I will start by reviewing some direct tests of the model of training investment presented in Section 2. I will then go on and present some evidence on changes in training levels during the 1980s. How-ever, comparable data on training levels over time and across countries are difficult to obtain, so this comparison will be limited to the US and Germany. In order to present some evidence for a variety of countries, I will close with some results on investment in physical capital. Neither piece of evidence by itself is necessarily very conclusive, but taken together the evidence does support the story outlined above.
In order to test the model of training in imperfect labor markets with wage compression against the more standard human capital theory, it is necessary to observe a change in the wage structure while marginal products are un-changed, or vice versa. This is a difficult task. In Acemoglu and Pischke (2003), we have argued that changes in the minimum wage provide a suitable example: there is no reason to expect that a change in a government mandated minimum wage coincides with changes in relative productivities. The starkest versions of the standard human capital model and the imperfect labor markets model with credit constrained workers have opposite implications in this case: in the former case an increase of the minimum wage should lead to less train-ing, in the latter case to more training. Moreover, the effects of minimum wages on training are also of direct policy interest.
In Acemoglu and Pischke (2003), we estimate the effect of changes in state and federal minimum wages on training during the period 1987 to 1992 in the

Jörn Steffen Pischke
CESifo Economic Studies, Vol. 51, 1/2005 60
US by comparing workers in different states. We find very little effect. We attribute this result to the possibility that training investments may be governed by a hybrid model where some training is financed by workers, and some is financed by firms. We find some weak support for this idea by linking the response of training to minimum wages to differences in labor market rents across industries. Arulampalam, Booth, and Bryan (2002) carry out a similar exercise for Britain, studying the impact of the introduction of the national minimum wage in 1999. They compare lower and higher wage workers before and after the introduction of the minimum wage and find positive effects on training. They also try to link the response of training to labor market rents, but do not find the same relationship across industries as we did for the US. However, they find the expected relationship when comparing labor markets of different sizes.
While these results provide some support for the imperfect labor market model of training, there are other studies, which find more negative results. Neumark and Wascher (2001) also analyze state and federal minimum wage changes in the US using different data and a somewhat different methodology and find strongly negative effects of minimum wages on training. Other studies have used a different methodology, and compared cross sections of workers rather than differences over time. It is difficult to argue that the precondition for testing the model, holding marginal products constant across the treatment and control groups, are satisfied in this case.
Other approaches to testing training models with imperfect labor markets have relied on more explicit mechanisms for wage compression. Dustmann and Schönberg (2004) focus on union wage setting, and study how this explains the incidence of apprenticeship training by firms in Germany. They find more training in firms subject to union wage setting, a relationship that holds up when looking at changes in union status of the firm. They also find some evidence for more wage compression in unionized firms. In Acemoglu and Pischke (1998) we also study workers, who went through the German appren-ticeship system. We tested a model where wage compression resulted from superior information of training firms about the ability of their trainees com-pared to other firms in the market. We also found some support for implica-tions of this model.
In summary, there is some, although not unequivocal, support for the idea that labor market institutions may induce training investments by firms. Does this mean the model helps us understand the evolution of wage inequality during the 1980s? In order to address this question, I have assembled some data on on-the-job training in the US and Germany during this decade in Pischke (1998). The results are reproduced in Table 2. The table shows the incidence of training in firms at the beginning and at the end of the decade. The training

Labor Market Institutions, Wages, and Investment
CESifo Economic Studies, Vol. 51, 1/2005 61
incidence across countries is not directly comparable, because the relevant questions in the respective surveys differ. Training may also differ across countries for a number of factors, like industrial composition, previous educa-tion levels, etc.
Table 2
Incidence of participation in on-the-job training (in percent)
USA Germany
1983 1991 1979 1991
Training Courses by Firms
Less Skilled 4.2 (0.3)
3.8 (0.3)
3.6 (0.3)
4.6 (0.4)
Skilled 13.6 (0.2)
14.5 (0.4)
10.6 (0.2)
14.1 (0.3)
Job Related Training Including Informal Training
Less Skilled 15.4 (0.5)
10.7 (0.4)
--- ---
Skilled 26.9 (0.3)
24.0 (0.2)
--- ---
Notes: Standard errors are shown in parentheses. The data for the US are calculated from the Training Supplements to the January CPS. The data for Germany are calculated from the BIBB/IAB Qualification and Career Survey. The samples include men and women age 20 to 59, working in the private sector. Less skilled workers in the US are those with less than 12 years of schooling. Less skilled workers in Germany are those with less than 12 years of schooling and no com-pleted apprenticeship or similar vocational qualification. The questions about participation in training differ between the US and German surveys, and incidence should not be compared directly across countries. Training in the US refers to the training in the current job. Training in Germany refers to all job related training within the last 5 years.
There is little evidence from the data in Table 2 that training incidence has risen over the 1980s in the US, although there might have been a slight in-crease of some types of training for more educated workers. However, training incidence seems to have fallen for the least educated. This is inconsistent with the standard human capital model in the face of skill biased technical change. The data therefore suggest that credit constraints of low education workers may play some role, and prevent these workers from paying for some training.

Jörn Steffen Pischke
CESifo Economic Studies, Vol. 51, 1/2005 62
The picture is different for Germany, where training of both low and high education workers increased. This is consistent with the model of training in imperfect labor markets if firms invest.1 One complication with this cross-country comparison is that the data for Germany are measured late in a boom period, while the 1983 data for the US are from the end of a recession, and the 1991 data from the beginning of a recession. These differences in the business cycles may affect the interpretation, although we know relatively little about the cyclical properties of workplace training. Nevertheless, even taken at face value, these differences in training are unlikely to be large enough to explain the differential evolution in wages across the US and Europe by themselves.
I therefore turn to investment in physical capital. Recall from the discussion in the previous section that the model suggests that investment complementary to low skill jobs fell in the US compared to Europe during the 1980s. Investment in high skilled jobs, on the other hand, should have grown at similar rates. It is difficult to link investment data directly to the skill level of workers. In order to do this, I utilize data on investment by industry from the OECD STAN database for Industrial Analysis (OECD 2004). I use 18 industries, and assign them the average skill level of the workers. I do this based on the education level of workers in the US, assuming that skill levels are similar in the same industry in different countries. Later, I will also check the results using the skill levels in German industries. The skill levels computed for the two coun-tries are very similar; the raw correlation is 0.89.
The industry mix and the capital intensity of industries will differ across countries even in the 1970s. Hence, there is little point in comparing the levels of investment. Instead, using the real investment series from the STAN data-base, I calculate investment growth from 1980 to 1990 by industry. This is appealing, because there is no need to convert the investment series to a common currency.
In order to relate the evolution of investment to the skill levels of workers, I regress the growth in investment on the skill level in the industry for each country according to the model:
(1) ginv8090ic = αc + βcaveduc80iUS + εic
where ginv8090ic is the growth in investment from 1980 to 1990 in industry i and country c, aveduc80iUS is the average education level of workers in the industry in the US, εic is a random term, and αc and βc are coefficients to be estimated for each country. A similar exercise has been previously performed
1 For skilled workers, it is difficult to tell whether training increased because of standard Becker
self-financing, or because of firm-financing because there is compression of the returns to training throughout the wage distribution.

Labor Market Institutions, Wages, and Investment
CESifo Economic Studies, Vol. 51, 1/2005 63
for US industries by Caselli (1999). The interesting aspect of this exercise is, however, to extend it to multiple countries with different wage setting institu-tions. For the 1980 to 1990 period, this can be done for 10 countries (see the data appendix for more details). The coefficients βc reflect the strength of the association of the skill level in the industry and investment growth.
Investment growth should have been higher for more skilled workers in coun-tries where wage inequality increased a lot, like in the US. Hence, we would expect βc to be positive in these countries. On the other hand, investment growth should have been more similar across skill groups, and therefore industries, in countries where wage inequality did not rise, as in continental Europe. Hence we would expect to βc to be close to zero in these countries, or in any case smaller than for the US. Table 1 reports the resulting βc coeffi-cients and Figure 6 plots them against the change in wage inequality in the respective countries over the period. It can be seen that the US and Canada, the countries with the largest changes in wage inequality, had the strongest rela-tionship between investment growth and skills. For the US, the estimate of βc is statistically significant, and for Canada marginally so, while these estimates are insignificant for the European countries including Belgium, which is a bit of an outlier. This suggests that there are basically three distinct data points in the figure: The US, Canada, and the European countries.
An alternative way to carry out this empirical exercise is to pool the data for all the countries and industries, and run the following regression:
(2) ginv8090ic = αc + βaveduc80iUS*wineq8090c + εic
where wineq8090c is the change in wage inequality from 1980 to 1990. This regression combines the two steps of the previous exercise, the country level regressions to derive the coefficients βc, and the regression of these coeffi-cients on the change in wage inequality, which is implicit in Figure 6. The coefficient β now tells us directly the strength of the association of the two variables in Figure 6, and is analogous to passing a regression line through this scatter plot. Results for this and related regressions are displayed in the first row of Table 3. The coefficient estimate for β is 0.42 with a standard error of 0.11. 2
2 The regression coefficient is 0.36 with a standard error of 0.12 if Belgium is omitted.

Jörn Steffen Pischke
CESifo Economic Studies, Vol. 51, 1/2005 64
Figure 6
The association of investment growth 1980–1990 and skill versus changes in wage inequality
Australia
Austria
Belgium
Canada
Finland
France
ItalyNorway
US
Germany
-.4-.2
0.2
.4In
vest
men
t Gro
wth
Ski
ll A
ssoc
iatio
n 19
80 -
90
-.2 0 .2 .4 .6 .8Change 90/10 Wage Differential 1980 - 90
One danger in interpreting these results is that the association between invest-ment growth and skill level of the industry may reflect other features of the industries in the different countries, and the association with changes in wage inequality across countries may be purely incidental. There are various ways to probe the previous result. One is to also include a set of industry dummies in the regression (2), as is done in column (2) in Table 3. The result is not changed much. The second check is to repeat the same exercise for the 1970s, a period when wage inequality changed much less in the US and Canada. Figure 7 plots the results again against the change in wage inequality in the 1980s. We would not expect the points to line up in an upward sloping manner in this case. While Canada still has a somewhat higher association between investment growth and skills than the European countries, this is no longer true for the US. Investment grew at about the same rate in US industries as in Belgium, Norway, and Germany in the 1970s.3 The estimate from the regres-sion in equation (2) is now lower and no longer significant, as can be seen in
3 Caselli (1999) finds the same result for the US when comparing the change in capital-labor
ratios between 1960–1975 and 1975–1990.

Labor Market Institutions, Wages, and Investment
CESifo Economic Studies, Vol. 51, 1/2005 65
columns (3) and (4) of Table 3.4 Another caveat is that the result may be special to using the skill levels in US industries. Particularly low skilled industries may have a different composition in Europe (in fact, this would be implied by the theory). The second row in Table 3 demonstrates that all the results are robust to using the German skill distribution instead.
Table 3
Regression results
Dependent Variable
Investment Growth 1980–1990
Investment Growth 1970–1980
Productivity Growth 1980–1990
Independent variable (1) (2) (3) (4) (5) (6)
Avg. education in the industry in the US*change in wage inequality
0.42 (0.11)
0.39 (0.13)
0.22 (0.15)
0.15 (0.12)
0.09 (0.14)
-0.01 (0.08)
Avg. education in the industry in Germany* change in wage inequality
0.68 (0.14)
0.64 (0.19)
0.09 (0.13)
0.05 (0.13)
0.26 (0.27)
0.02 (0.13)
Country effects
Industry effects
Number of countries 10 10 7 7 9 9
Number of observa-tions 168 168 116 116 141 141
Notes: OLS regression models corresponding to equation (2) in the text. Each entry corresponds to a separate regression. Countries in columns (1) and (2) are the US, Canada, Australia, Norway, Italy, Belgium, and West Germany, Austria, Finland, France. The countries in columns (3) and (4) are the same, except for Austria, Finland, France. The countries in column (5) and (6) are Austria, Denmark, Finland, France, Italy, Japan, Norway, the US, and West Germany. Standard errors, which are shown in parentheses, are adjusted for clustering at the country level.
4 The result for the 1980s holds up if the sample is limited to the 7 countries for which data are
available for the 1970s.

Jörn Steffen Pischke
CESifo Economic Studies, Vol. 51, 1/2005 66
Figure 7
The association of investment growth 1970–1980 and skill versus changes in wage inequality
Australia
Belgium
Canada
Italy
Norway USGermany
-.4-.2
0.2
.4In
vest
men
t Gro
wth
Ski
ll A
ssoc
iatio
n 19
70 -
80
-.2 0 .2 .4 .6 .8Change 90/10 Wage Differential 1980 - 90
These results suggest that the pattern found for the 1980s is indeed special. US investment shifted more towards high skilled industries during this period, while a similar shift did not happen in European countries. This is exactly what we would expect if labor market institutions and the wage structure affect the investment decisions of firms. Of course, it is possible that other forces lead to these results. For example, deregulation might have lead to more growth and investment in some sectors in the US (and to some degree in Canada) and if these sectors had above average skill levels, we will find the same pattern of results. Much more research is necessary to distinguish this and other explana-tions from the interpretation I suggest.
Even physical capital investment does not fully capture all the implications of the theory. For example, skill biased technical change may take the form of workplace reorganization, and this may not be associated directly with actual investment. In order to capture effects of this type, it is possible to look at changes in labor productivity by industry. In fact, the evolution of labor productivity will reflect the combined influence of investment in human capital, physical capital, and intangible investments, like workplace reorgani-zation, which also affect productivity. Running regression (2) above with the

Labor Market Institutions, Wages, and Investment
CESifo Economic Studies, Vol. 51, 1/2005 67
growth in output per worker as the dependent variable is possible for a set of 9 countries, but the set of countries and available industries is somewhat different from the one above. Unfortunately, the result in that sample is not as supportive of the theory in this case: the association is much weaker than in the case of investment growth, and not significant as can be seen in columns (5) and (6) in Table 3. There is no association if industry fixed effects are added.
One possibility why this does not work better with the productivity data is that hours have remained constant in the US, while they have declined in the low skill sectors in European countries. However, hours data is only available for very few countries in the STAN database. But the samples for investment growth and productivity growth are also different, and it is worthwhile explor-ing these differences.
Table 4 compares the results for investment growth and productivity growth from Table 3 to those obtained in a consistent sample for both variables. The first row repeats the investment growth result from Table 3. There are seven countries in common between the samples for the two variables. Restricting the sample to those seven countries, the investment growth result becomes slightly weaker, but remains significant. However, the productivity growth variable is not available for all industries, even within those seven countries. Eliminating the industries missing from the productivity growth sample reduces the coefficients in the investment growth regressions to close to zero. There is not much difference in the productivity growth results once the additional two countries are added.
Figure 8 sheds further light on what is going on in the different samples. This figure plots the residuals after removing country effects, distinguishing the original investment growth sample, and the sample of countries and industries, which is common between the two variables. The figure highlights that there are four observations, which are highly influential for the original investment growth results: these are the two highest skilled service industries (finance, insurance, business services, and personal, community, professional services) in the US and Canada. It is not surprising that these industries and countries are important for the result, and maybe it would be too much to expect a different result. On the other hand, it is disappointing that the relationship does not hold, for example, just within manufacturing industries. This leaves us with a somewhat mixed bag of results: some limited support for the theory from the training and investment data, but also some open questions.

Jörn Steffen Pischke
CESifo Economic Studies, Vol. 51, 1/2005 68
Table 4
Comparison of results for consistent samples
Dependent Variable
Investment Growth 1980-1990
Productivity Growth 1980-1990
Sample (1) (2) (3) (4) No. of Obs.
10 original countries, Investment growth sample
0.42 (0.11)
0.39 (0.13)
--- --- 168
7 common countries 0.32 (0.18)
0.27 (0.08)
--- --- 124
7 common countries, prod. growth industries
0.11 (0.22)
0.02 (0.11)
0.10 (0.15)
-0.01 (0.07)
107
9 original countries, prod. growth sample
--- --- 0.09 (0.14)
-0.01 (0.08)
141
Country effects
Industry effects
Notes: OLS regression models corresponding to equation (2) in the text. Coeffi-cients on average education in the industry in the US*change in wage inequality shown. Each entry corresponds to a separate regression. The 7 common countries are Austria, Finland, France Norway, Italy, the US, and West Germany. The 10 original countries (row 1 and columns 1 and 2 in Table 3) also include Australia, Belgium, and Canada. The 9 original countries (row 4 and columns 5 and 6 in Table 3) also include Denmark, and Japan. Standard errors, which are shown in parenthe-ses, are adjusted for clustering at the country level.

Labor Market Institutions, Wages, and Investment
CESifo Economic Studies, Vol. 51, 1/2005 69
Figure 8
The correlation of investment growth 1980–1990 with the industry skill - changes in wage inequality interaction
Be, Prof Serv
Be, FIBS
Ca, Prof Serv
Ca, FIBS
US, FIBS
US, Prof Serv
-2-1
01
2
-1 -.5 0 .5 1Industry Skill Level*Change in Wage Inequality Residual
Common Sample Add'l Inv SampleFitted values Fitted values
Inve
stm
ent G
row
th R
esid
ual
Note: Be refers to Belgium, Ca refers to Canada, US refers to United States, FIBS refers to Finance, Insurance and Business Services, Prof Serv refers to Personal, Community and Professional Services.
5 Conclusion
I have argued in this paper that understanding the role of labor market institu-tions for the investment decisions of firms is important to help us understand the differential evolution of labor markets across continents in the past two decades. Labor market frictions, the resulting rents, and wage compression together imply that firms have an incentive to invest more in the training of low skilled workers, and in the physical capital with which these workers work. This is turn has implications for how investment decisions evolve as an outside shock, like skill biased technical change, affects the economy. Economies, where labor market institutions, and hence wage compression, is more important, will generally see relatively more investment by firms in low skilled workers. Economies, where wage compression is absent, will tend to shift investment more towards high skilled workers. I have presented some

Jörn Steffen Pischke
CESifo Economic Studies, Vol. 51, 1/2005 70
empirical evidence that this is indeed the case for both on-the-job training and for investment in physical capital.
The investment decisions of firms will feed back into the wage and employ-ment outcomes of workers. Labor market institutions, like unions and mini-mum wages, which raise the wages of less skilled workers, are generally thought to imply employment losses for the affected groups, as these workers are priced out of the market. This may not be the case if firms make invest-ments to raise the productivity level of these workers to be commensurate with the required wage. Once an exogenous shock arrives, which threatens the position of less skilled workers, these workers will be much more insulated from the shock in Europe than in the US. Cheaper garments from Malaysia or Mexico becoming available because of increased globalization may have impacted the wages and jobs of textile workers in the US in the 1980s. The impact on textile workers in Europe would have been much less, because the textile industry in Europe was already much more capital and skill intensive, and focusing on higher end apparel. In addition, the shift of investment to-wards more skilled workers in the US in the 1980s drove the productivities and hence the wages of workers apart. European firms chose different investment patterns during this period, raising the productivities of different types of workers more equally, and hence avoiding large changes in wage inequality.
The story I have told in this paper suggests that European countries have reacted in some ways more favorable to a period of adverse shocks than has the US labor market. Are the institutions, which have been much decried for making the European labor markets sclerotic, possibly a good thing? Drawing this conclusion based on the evidence I have provided would certainly be short sighted. Institutions, like minimum wages and unions, which redistribute incomes from firms to workers, will lower the profits of firms. This decreases job creation and therefore raises unemployment. Not surprisingly, high unem-ployment is the central reason for the attempt of making labor markets more flexible in many European countries.
Labor market institutions redistribute incomes and provide insurance to workers. Labor market reforms therefore face the traditional conundrum: efficiency enhancing reforms will tend to increase inequality. If continental European countries desire a certain level of redistribution, and there is much evidence that they do, they may want to undo the effects of labor market deregulation through other mechanisms, like a more progressive tax structure. This, of course, also has efficiency costs. The optimal package of redistribution may therefore well include some degree of labor market regulation. The difficult question is which institutions and how much labor market regulation should European countries retain. This is a question the research literature is just beginning to provide some answers to.

Labor Market Institutions, Wages, and Investment
CESifo Economic Studies, Vol. 51, 1/2005 71
The current paper contributes to this debate, because realizing that institutions affect investment behavior alters the equity-efficiency tradeoff. The possibility of investments by firms will tend to undo some, but not all, of the undesirable effects of regulations. Hence, incorporating the investment channel is likely to be an important ingredient in the theoretical modeling when we are trying to address these issues. On the other hand, the empirical evidence on the invest-ment channel is still very sketchy and ambiguous, and we need a much better understanding as to how and why firms make their investment decisions.
Data Appendix
This appendix describes the construction of the data shown in Table 1, and used in the empirical analysis. Data for wage inequality refer to all workers and are taken from table 3.1 in the 1996 OECD Employment Outlook. That table reports the ratios of the 90th and 50th as well as the 50th and 10th percentile of the wage distribution, which are used to calculate the ratio of the 90th and 10th percentile. The change in the wage distribution was calculated as the difference in these ratios for 1990 and for 1980. Where data for these years were not available, data for the nearest available year were used; in particular for Belgium: 1986–90, Canada: 1981–90, West Germany: 1983–90, and Italy and Norway: 1980–91. In those cases where the period does not refer to exactly ten years, the difference was multiplied by 10/(end year – beginning year). Data for the US are not reported for all workers, but only for males and females separately. Therefore, I regressed the change in wage inequality for all workers on the change for males for those countries were both statistics are reported. The change in wage inequality for the US is the predicted value from this regression using the US change for males.
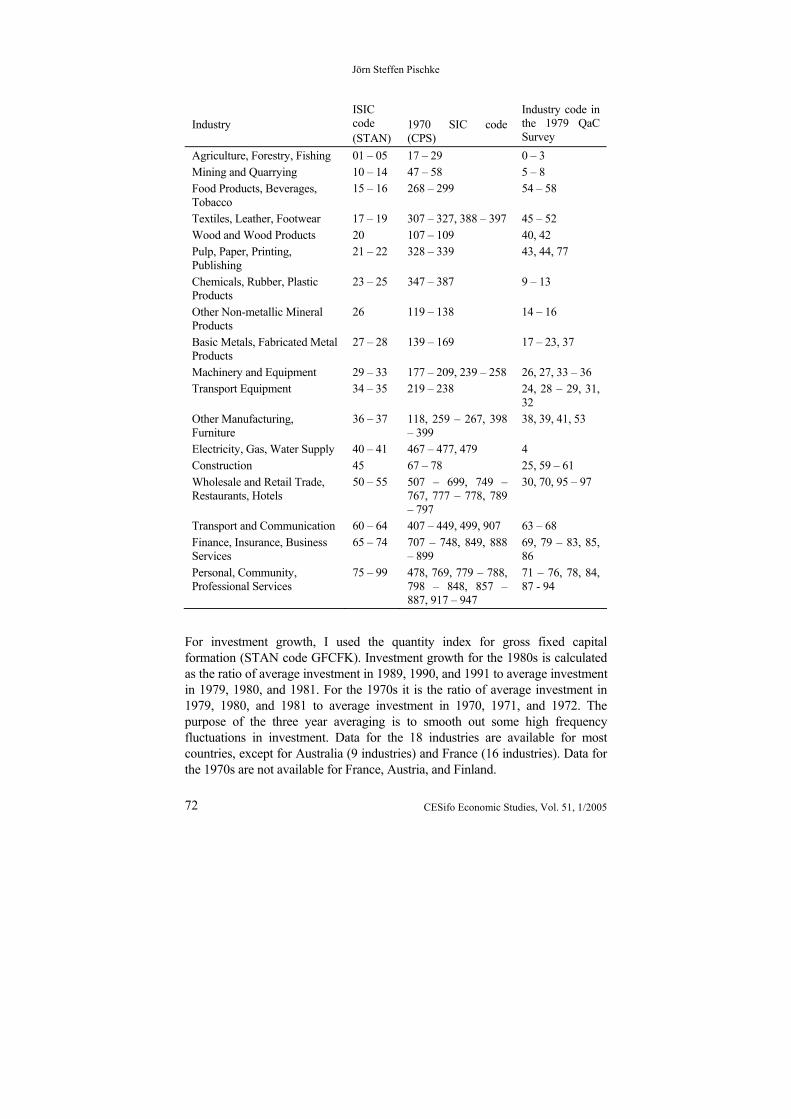
Changes in investment growth and labor productivity were calculated using data from the OECD STAN database for Industrial Analysis (OECD 2004). I used data for 18 industries, which are classified in STAN according to the ISIC (Rev. 3) classification. I matched these industries to 1970 US SIC codes, and industry codes in the German 1979 Qualification and Career Survey, in order to match the data with information on skill levels. The 18 industries are the following:
Jörn Steffen Pischke
CESifo Economic Studies, Vol. 51, 1/2005 72
Industry
ISIC code (STAN)
1970 SIC code (CPS)
Industry code in the 1979 QaC Survey
Agriculture, Forestry, Fishing 01 – 05 17 – 29 0 – 3 Mining and Quarrying 10 – 14 47 – 58 5 – 8 Food Products, Beverages, Tobacco
15 – 16 268 – 299 54 – 58
Textiles, Leather, Footwear 17 – 19 307 – 327, 388 – 397 45 – 52 Wood and Wood Products 20 107 – 109 40, 42 Pulp, Paper, Printing, Publishing
21 – 22 328 – 339 43, 44, 77
Chemicals, Rubber, Plastic Products
23 – 25 347 – 387 9 – 13
Other Non-metallic Mineral Products
26 119 – 138 14 – 16
Basic Metals, Fabricated Metal Products
27 – 28 139 – 169 17 – 23, 37
Machinery and Equipment 29 – 33 177 – 209, 239 – 258 26, 27, 33 – 36 Transport Equipment 34 – 35 219 – 238 24, 28 – 29, 31,
32 Other Manufacturing, Furniture
36 – 37 118, 259 – 267, 398 – 399
38, 39, 41, 53
Electricity, Gas, Water Supply 40 – 41 467 – 477, 479 4 Construction 45 67 – 78 25, 59 – 61 Wholesale and Retail Trade, Restaurants, Hotels
50 – 55 507 – 699, 749 – 767, 777 – 778, 789 – 797
30, 70, 95 – 97
Transport and Communication 60 – 64 407 – 449, 499, 907 63 – 68 Finance, Insurance, Business Services
65 – 74 707 – 748, 849, 888 – 899
69, 79 – 83, 85, 86
Personal, Community, Professional Services
75 – 99 478, 769, 779 – 788, 798 – 848, 857 – 887, 917 – 947
71 – 76, 78, 84, 87 - 94
For investment growth, I used the quantity index for gross fixed capital formation (STAN code GFCFK). Investment growth for the 1980s is calculated as the ratio of average investment in 1989, 1990, and 1991 to average investment in 1979, 1980, and 1981. For the 1970s it is the ratio of average investment in 1979, 1980, and 1981 to average investment in 1970, 1971, and 1972. The purpose of the three year averaging is to smooth out some high frequency fluctuations in investment. Data for the 18 industries are available for most countries, except for Australia (9 industries) and France (16 industries). Data for the 1970s are not available for France, Austria, and Finland.

Labor Market Institutions, Wages, and Investment
CESifo Economic Studies, Vol. 51, 1/2005 73
For labor productivity, I used gross output (STAN code PRODK) divided by total employment (STAN code EMPN). The growth rate is calculated as above, using three year averages at the beginning and end of the period. Data are available for Austria, Denmark, Finland, France (12 industries), Italy, Japan (16 industries) Norway, the US (15 industries) and Germany (8 industries); 18 industries are available where nothing else is indicated.
As the skill level in an industry I use the average number of grades completed in the industry for workers in the US. Data are taken from the merged outgoing rotation group samples of the Current Population Surveys for 1979, 1980, and 1981. The sample consists of all workers with labor force status recodes 1 and 2, and industries have been assigned as shown above. Alternatively, I use the average education levels from the German 1979 Qualification and Career Survey.
The coefficients βc are coefficients from an OLS regression of growth in investment on the average education in the US across the 18 industries. Separate regressions were run for each country to estimate the country specific coefficients.
References
Acemoglu, D. (2002), “Technical Change, Inequality, and the Labor Market”, Journal of Economic Literature 40, 7–72.
Acemoglu, D. (2003), “Cross-Country Inequality Trends”, Economic Journal 113, F121–F149.
Acemoglu, D. and J.-S. Pischke (1998), “Why Do Firms Train? Theory and Evidence”, Quarterly Journal of Economics 113, 79–119.
Acemoglu, D. and J.-S. Pischke (1999a), “Beyond Becker: Training in Imper-fect Labor Markets”, Economic Journal 109, F112–F142.
Acemoglu, D. and J.-S. Pischke (1999b), “The Structure of Wages and In-vestment in General Training”, Journal of Political Economy 107, 539–572.
Acemoglu, D. and J.-S. Pischke (2003), “Minimum Wages and On-the-job Training”, Research in Labor Economics 22, 159–202.
Arulampalam, W., A.L. Booth and M.L. Bryan (2002), “Work-Related Training and the New National Minimum Wage in Britain”, IZA Discus-sion Paper No. 595.

Jörn Steffen Pischke
CESifo Economic Studies, Vol. 51, 1/2005 74
Becker, G. (1964), Human capital, The University of Chicago Press, Chicago.
Blau, F. and L.M. Kahn (2001), “Do Cognitive Test Scores Explain Higher US Wage Inequality?”, National Bureau of Economic Research Working Paper No. 8210.
Card, D. and J. DiNardo (2002), “Skill-Biased Technological Change and Rising Wage Inequality: Some Problems and Puzzles”, Journal of Labor Economics 20, 733–783.
Card, D., F. Kramarz, and T. Lemieux (1999) “Changes in the Relative Struc-ture of Wages and Employment: A Comparison of the United States, Can-ada, and France”, Canadian Journal of Economics 32, 843–877.
Caselli, F. (1999) “Technological Revolutions”, American Economic Review 89, 78–102.
Dustmann, C. and U. Schönberg (2004) “Training and Unions”, mimeo-graphed, University College London.
Freeman, R.B. (1995), “Are Your Wages Set in Bejing?”, Journal of Economic Perspectives 9, 15–32.
Freeman, R.B. and R. Schettkat (2001), “Skill Compression, Wage Differen-tials, and Employment: Germany vs the US”, Oxford Economic Papers 53, 582–603.
Krueger, A. and J.-S. Pischke (1998), “Observations and Conjectures on the U.S. Employment Miracle”, in: Third Public GAAC Symposium: Labor Markets in the USA and Germany, German-American Academic Council, Bonn, 99–126.
Krugman, P. (1994), “Past and Prospective Causes of High Unemployment”, in: Reducing Unemployment: Current Issues and Policy Options, A Sympo-sium Sponsored by the Federal Reserve Bank of Kansas City, August 25-27, Jackson Hole, Wyoming, 49–80.
Lemieux, T. (2003), “Composition Effects, Wage Measures, and the Growth in Within-Group Wage Inequality”, mimeographed, University of British Columbia.
Neumark, D. and W. Wascher (2001), “Minimum Wages and Training Revis-ited”, Journal of Labor Economics 19, 563–595.
Nickell, S. (2003) “A Picture of European Unemployment: Success and Failure”, CEP Discussion Paper No. 577.

Labor Market Institutions, Wages, and Investment
CESifo Economic Studies, Vol. 51, 1/2005 75
Nickell, S. and B. Bell (1995), “The Collapse in Demand for the Unskilled and Unemployment Across the OECD”, Oxford Review of Economic Policy 11, 40–62.
Nickell, S. and B. Bell (1996), “Changes in the Distribution of Wages and Unem-ployment in OECD Countries”, American Economic Review, Papers and Pro-ceedings 82, 302–308.
OECD (1996), “Earnings Inequality, Low Paid Employment and Earnings Mobility”, Employment Outlook 1996, OECD, Paris, 59–108.
OECD (2004), STAN Database, OECD, Paris.
Pischke, J.-S. (1998) “Ausbildung und Lohnstruktur: Deutschland und die USA in den 80er Jahren”, in: B. Gahlen, H. Hesse and H.J. Ramser (eds), Verteilung-sprobleme der Gegenwart. Diagnose und Therapie, Schriftenreihe des Wirt-schaftswissenschaftlichen Seminars Ottobeuren 27, Verlag Mohr Siebeck, Tü-bingen, 95–117.