Labor. Chapter Outline ©2015 McGraw-Hill Education. All Rights Reserved. 2 The Perfectly...
36
Chapter 14 Labor
-
Upload
gwendolyn-hardy -
Category
Documents
-
view
214 -
download
0
Transcript of Labor. Chapter Outline ©2015 McGraw-Hill Education. All Rights Reserved. 2 The Perfectly...

Chapter 14
Labor

©2015 McGraw-Hill Education. All Rights Reserved. 2
Chapter Outline• The Perfectly Competitive Firm’s Short-Run Demand for Labor• The Perfectly Competitive Firm’s Long-Run Demand for Labor• The Market Demand Curve for Labor• An Imperfect Competitor’s Demand for Labor• The Supply of Labor• The Noneconomist’s Reaction to the Labor Supply Model• The Market Supply Curve• Monopsony• Minimum Wage Laws• Labor Unions• Discrimination in the Labor Market• Statistical Discrimination• The Internal Wage Structure• Winner-Take-All Markets

©2015 McGraw-Hill Education. All Rights Reserved. 3
A Perfectly Competitive Firm’s Demand for Labor
• Value of marginal product (VMP): the value, at current market price, of the extra output produced by an additional unit of input.
• The hiring rule for the firm is to choose that amount of labor for which the wage rate is equal to the VMP

©2015 McGraw-Hill Education. All Rights Reserved. 4
Figure 14.1: The Competitive Firm’s Short-Run Demand for Labor

©2015 McGraw-Hill Education. All Rights Reserved. 5
Labor Demand in the Long-Run• The firm’s demand for labor will tend to be
more elastic the more elastic the demand is for its product.
• The firm’s demand for labor will tend to be more elastic the more it is able to substitute the services of labor for those of other inputs.

©2015 McGraw-Hill Education. All Rights Reserved. 6
Figure 14.2: Short and Long-Run Demand Curves for Labor

©2015 McGraw-Hill Education. All Rights Reserved. 7
Figure 14.3: The Market DemandCurve for Labor

©2015 McGraw-Hill Education. All Rights Reserved. 8
An Imperfect Competitor’s Demand for Labor
• Marginal revenue product (MRP): the amount by which total revenue increases with the employment of an additional unit of input.
• The firm will hire that quantity for which the wage rate and MRPL are equal.

©2015 McGraw-Hill Education. All Rights Reserved. 9
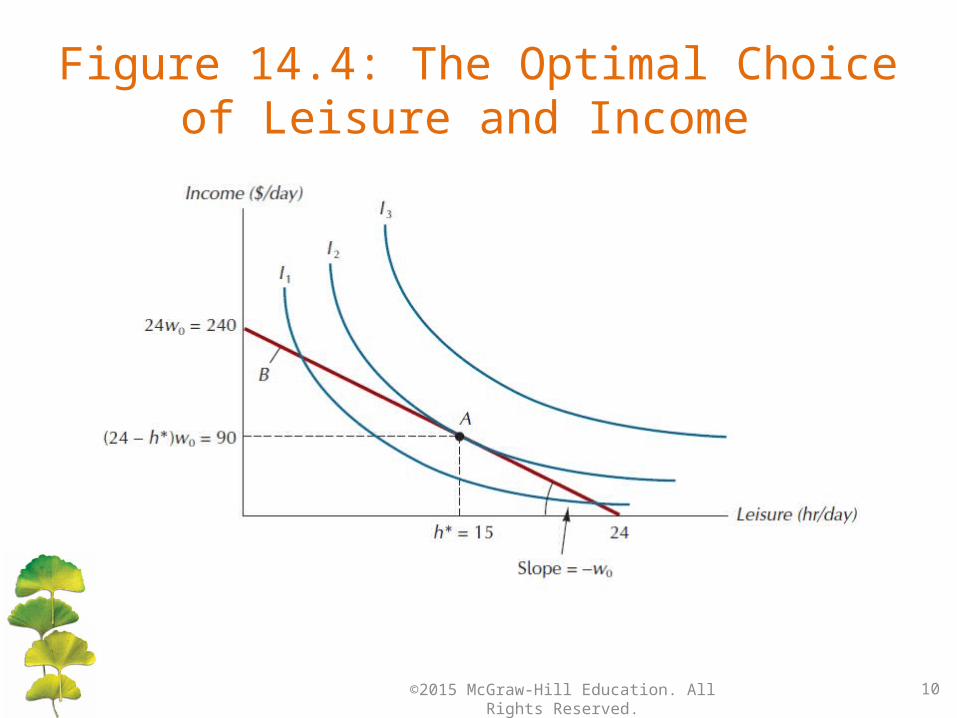
The Supply Of Labor• Leisure activities: which here include play, sleep,
eating, and any other activity besides paid work in the labor market.
• The choice is between two goods we may call “income” and “leisure.” As in the standard consumer choice problem, the individual is assumed to have preferences over the two goods that can be summarized in the form of an indifference map.
©2015 McGraw-Hill Education. All Rights Reserved. 10
Figure 14.4: The Optimal Choiceof Leisure and Income

©2015 McGraw-Hill Education. All Rights Reserved. 11
Figure 14.5: Optimal Leisure Choicesfor Different Wage Rates

©2015 McGraw-Hill Education. All Rights Reserved. 12
Figure 14.6: The Labor Supply Curve for the ith Worker

©2015 McGraw-Hill Education. All Rights Reserved. 13
Figure 14.7: The Labor Supply Curve for a Worker Seeking a Target Level of Income

©2015 McGraw-Hill Education. All Rights Reserved. 14
Figure 14.8: When Leisure and Income are Perfect Complements

©2015 McGraw-Hill Education. All Rights Reserved. 15
Figure 14.9: An Increase in Demandby One Category of Employer

©2015 McGraw-Hill Education. All Rights Reserved. 16
Monopsony• Average factor cost (AFC): another name for the
supply curve for an input.
• Total factor cost (TFC): the product of the employment level of an input and its average factor cost.
• Marginal factor cost (MFC): the amount by which total factor cost changes with the employment of an additional unit of input.

©2015 McGraw-Hill Education. All Rights Reserved. 17
Monopsony
• The optimal level of employment for a monopsonist is the level for which MFC and the demand for labor are equal.– For the monopsony firm wages will be lower
than under competition.

©2015 McGraw-Hill Education. All Rights Reserved. 18
Figure 14.10: Average and Marginal Factor Cost

©2015 McGraw-Hill Education. All Rights Reserved. 19
Figure 14.11: The Profit-Maximizing Wage and Employment Levels for a Monopsonist

©2015 McGraw-Hill Education. All Rights Reserved. 20
Figure 14.12: Comparing Monopsony and Competition in the Labor Market

©2015 McGraw-Hill Education. All Rights Reserved. 21
Minimum Wage Laws• In 1938 Congress passed the Fair Labor Standards
Act.– One of whose provisions established a minimum wage
for all covered employees.
• Whether the net effect of the minimum wage is to increase the amount of income earned by unskilled workers depends on the elasticity of demand for that category of labor.

©2015 McGraw-Hill Education. All Rights Reserved. 22
Figure 14.13: A Statutory Minimum Wage

©2015 McGraw-Hill Education. All Rights Reserved. 23
Figure 14.14: The Minimum Wage Lawin the Case of Monopsony

©2015 McGraw-Hill Education. All Rights Reserved. 24
Labor Unions• About one in six workers in the nonfarm
sector of the U.S. economy is a member of a labor union.– Unionized workers bargain collectively over the
terms and conditions of employment.– Unions may also facilitate communication
between labor and management.

©2015 McGraw-Hill Education. All Rights Reserved. 25
Figure 14.15: The Allocative Effectsof Collective Bargaining

©2015 McGraw-Hill Education. All Rights Reserved. 26
Discrimination In The Labor Market• From any individual employer’s point of view
examples of different wages across various population groups are examples of nonmarket discrimination— effects that lower productivity before job applicants even make contact with the employer.

©2015 McGraw-Hill Education. All Rights Reserved. 27
Discrimination In The Labor Market• Customer discrimination: the firm’s customers do not wish
to deal with minority employees.
• Coworker discrimination: when some type of worker (i.e white workers) feel uneasy about working with other type of workers (i.e. blacks) and may prefer employment in firms that hire only their type.
• Employer discrimination: wage differentials that arise from an arbitrary preference by the employer for one group of worker over another.

©2015 McGraw-Hill Education. All Rights Reserved. 28
Statistical Discrimination
• Statistical discrimination is the result, not the cause, of average productivity differences between groups. Its sole effect is to reduce wage variation within each group.

©2015 McGraw-Hill Education. All Rights Reserved. 29
Figure 14.16: A Hypothetical Uniform Productivity Distribution

©2015 McGraw-Hill Education. All Rights Reserved. 30
Figure 14.17: Productivity Distributions for Two Groups
©2015 McGraw-Hill Education. All Rights Reserved. 31
The Internal Wage Structure• The wage structure within many private
firms seems much more egalitarian than would be warranted under our marginal productivity theory of wages.
1. Most people prefer high-ranked to low-ranked positions among their coworkers;
2. No one can be forced to remain in a firm against his wishes.

©2015 McGraw-Hill Education. All Rights Reserved. 32
Figure 14.18: The Wage Structurewhen Local Status Matters

©2015 McGraw-Hill Education. All Rights Reserved. 33
Figure 14.19: Wage Schedules andthe Intensity of Interaction

©2015 McGraw-Hill Education. All Rights Reserved. 34
Figure A14.1: The Optimal Wage-Safety Combination

©2015 McGraw-Hill Education. All Rights Reserved. 35
Figure A14.2: The Effect of Productivity on the Optimal Safety Choice

©2015 McGraw-Hill Education. All Rights Reserved. 36
Figure A14.3: A Safety Requirementthat Reduces Utility