Labeling: Student Self-Esteem and the Stigma of a Label
55
Marshall University Marshall Digital Scholar eses, Dissertations and Capstones 2015 Labeling: Student Self-Esteem and the Stigma of a Label Amanda Kay Sowards [email protected] Follow this and additional works at: hp://mds.marshall.edu/etd Part of the Disability and Equity in Education Commons , and the Special Education and Teaching Commons is Research Paper is brought to you for free and open access by Marshall Digital Scholar. It has been accepted for inclusion in eses, Dissertations and Capstones by an authorized administrator of Marshall Digital Scholar. For more information, please contact [email protected], [email protected]. Recommended Citation Sowards, Amanda Kay, "Labeling: Student Self-Esteem and the Stigma of a Label" (2015). eses, Dissertations and Capstones. Paper 976.
Transcript of Labeling: Student Self-Esteem and the Stigma of a Label

Marshall UniversityMarshall Digital Scholar
Theses, Dissertations and Capstones
2015
Labeling: Student Self-Esteem and the Stigma of aLabelAmanda Kay [email protected]
Follow this and additional works at: http://mds.marshall.edu/etd
Part of the Disability and Equity in Education Commons, and the Special Education andTeaching Commons
This Research Paper is brought to you for free and open access by Marshall Digital Scholar. It has been accepted for inclusion in Theses, Dissertationsand Capstones by an authorized administrator of Marshall Digital Scholar. For more information, please contact [email protected],[email protected].
Recommended CitationSowards, Amanda Kay, "Labeling: Student Self-Esteem and the Stigma of a Label" (2015). Theses, Dissertations and Capstones. Paper976.

Labeling: Student Self-Esteem and the Stigma of a Label
A Research Paper
Submitted to the Special Education Faculty of the
Marshall University Graduate College
In Partial Fulfillment
Of the Requirements for the Degree of Master of Arts
By
Amanda Kay Sowards
April 30, 2015

ii
Abstract
Labels help to provide educational support to students who struggle academically, physically,
emotionally and socially. The decision to use a label should be carefully considered due to the
possibility of negative connotations regarding social relationships, personal preferences and the
effects on self-esteem. The author discusses a study that examines the effects of labeling in regard
to the impact on the self-esteem of students with disabilities and will scrutinizes if students with
disabilities are negatively perceived by their peers. Current research of labeling, self-esteem and
social disadvantage is discussed. Due to the overwhelming number of students being labeled and
a lack of research concerning the self-efficacy of students with disabilities, reasons are given as to
why further research should be conducted on the topic of labeling. Implications for students,
parents, teachers and society are provided.
Keywords: labeling, self-esteem, special education
iii
Acknowledgements
This research project would not have been possible without the support of many people.
The author wishes to express her gratitude to Midway Elementary staff, students and families for
their involvement in the study. Special thanks to Jessie Thompson, Midway Elementary Parent
Coordinator, for so willingly contacting parents and assisting with consent form collection. The
author also wishes to express her love and gratitude to her beloved families; for their
understanding, love and encouragement through the duration of her studies. A most grateful
thanks is extended to Ellen Sowards who was abundantly helpful and offered invaluable
assistance, support and guidance throughout the writing process. Additionally, the author is
sincerely appreciative of her sister-in-law, Chelsea Howell, for providing technical assistance in
the creation and formatting of this final document.

TABLE OF CONTENTS
Abstract ..................................................................................................................................... ii
Acknowledgements ................................................................................................................... iii
List of Tables and Figures .......................................................................................................... iv
CHAPTER I STATEMENT ON THE PROBLEM ....................................................................................... 1
Rationale ......................................................................................................................... 2
Purpose............................................................................................................................ 4
Hypotheses and Research Questions ................................................................................ 4
CHAPTER II
REVIEW OF THE LITERATURE .......................................................................................... 5
Pros and Cons of Labeling ............................................................................................... 6
Self-esteem ...................................................................................................................... 7
Social Disadvantage ........................................................................................................ 8
Conclusion ...................................................................................................................... 9
CHAPTER III
RESEARCH DESIGN AND METHODOLGY ..................................................................... 11
Subjects ......................................................................................................................... 11
Procedures ..................................................................................................................... 11
Instrumentation.............................................................................................................. 12
Data Analysis ................................................................................................................ 13
CHAPTER IV
RESULTS ................................................................................................................................ 15
Hypotheses and Research Questions .............................................................................. 15
Research Question 1 ...................................................................................................... 19
Research Question 2 ...................................................................................................... 22
Research Question 3 ...................................................................................................... 24
Research Question 4 ...................................................................................................... 26
Research Question 5 ...................................................................................................... 27
Research Question 6 ...................................................................................................... 29
CHAPTER V
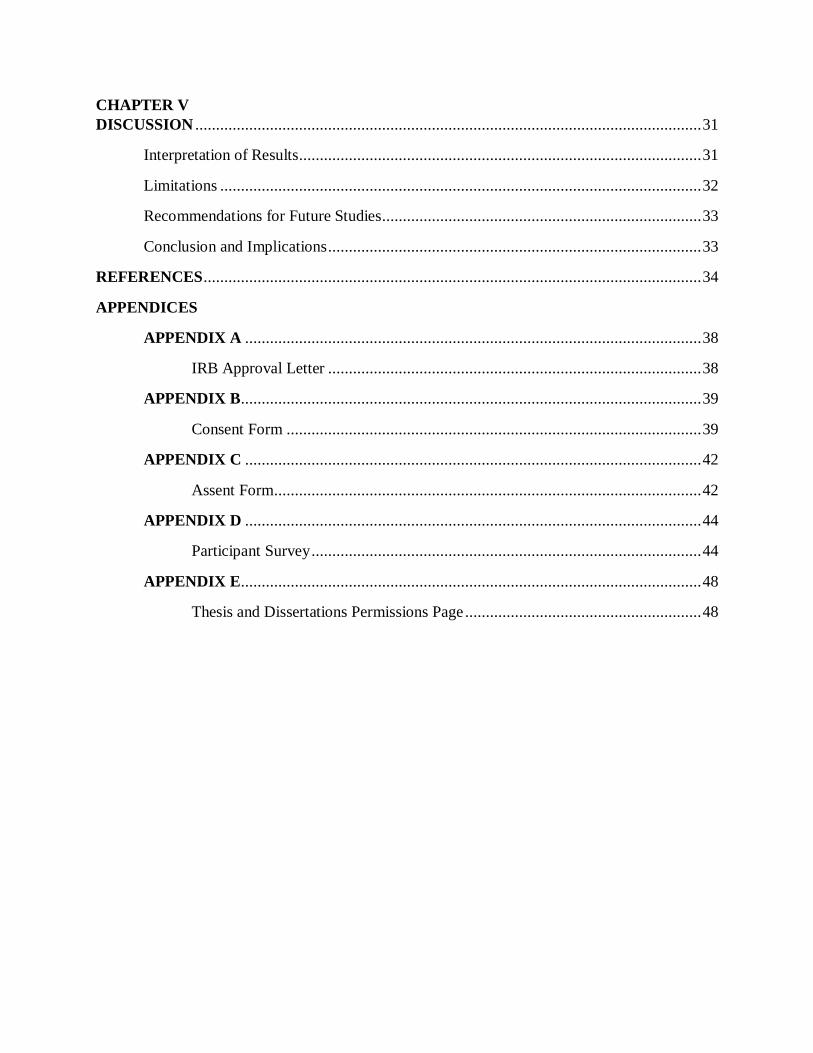
DISCUSSION .......................................................................................................................... 31
Interpretation of Results................................................................................................. 31
Limitations .................................................................................................................... 32
Recommendations for Future Studies............................................................................. 33
Conclusion and Implications .......................................................................................... 33
REFERENCES ........................................................................................................................ 34
APPENDICES
APPENDIX A .............................................................................................................. 38
IRB Approval Letter .......................................................................................... 38
APPENDIX B............................................................................................................... 39
Consent Form .................................................................................................... 39
APPENDIX C .............................................................................................................. 42
Assent Form ....................................................................................................... 42
APPENDIX D .............................................................................................................. 44
Participant Survey .............................................................................................. 44
APPENDIX E............................................................................................................... 48
Thesis and Dissertations Permissions Page ......................................................... 48

iv
List of Tables and Figures
Table
1. PARTICPANT DEMOGRAPHICS ......................................................................... 16
2. STUDENT RESPONSES REGARDING INVOLVEMENT IN SPECIAL
EDUCATION .......................................................................................................... 17
Figure
4.1 AVERAGE RESULTS OF ROSENBERG SELF-ESTEEM SCORES ORGANIZED
BY GRADE AND GENDER ................................................................................... 20
4.2 AVERAGE RESULTS OF ROSENBERG SELF-ESTEEM SCORES ACCORDING
TO EDUCATIONAL SETTING ........................................................................... 21
4.3 AVERAGE RESULTS OF ROSENBERG SELF-ESTEEM SCORES ACCORDING
TO GRADE, GENDER AND EDUCATIONAL PLACEMENT ............................. 21
4.4 SPECIAL EDUCATION STUDENTS’ RESPONSES ABOUT INTELLIGENCE AS
NOTED BY SURVEY QUESTION 26 ................................................................... 23
4.5 GENERAL EDUCATION STUDENTS’ RESPONSES ABOUT INTELLIGENCE
AS NOTED BY SURVEY QUESTION 28 .............................................................. 24
4.6 FRIENDSHIP ACCORDING TO STUDENTS IN SPECIAL EDUCATION AS
NOTED BY SURVEY QUESTION 24 ................................................................... 25
4.7 FRIENDSHIP ACCORDING TO STUDENTS IN GENERAL EDUCATION AS
NOTED BY SURVEY QUESTION 24 ................................................................... 26
4.8 GENERAL EDUCATION STUDENTS’ RESPONSES ABOUT THE LIKELINESS
OF FRIENDSHIP AS NOTED BY SURVEY QUESTION 30................................. 27
4.9 SPECIAL EDUCATION STUDENTS’ RESPONSES ABOUT BULLYING AS
NOTED BY SURVEY QUESTION 32 ................................................................... 28
4.10 STUDENTS ABILITY TO MAKE FRIENDS ACCORDING TO EDUCATIONAL
PLACEMENT AND GRADE LEVEL .................................................................... 29

1
Chapter I: Statement of the Problem
The need to label people, things and events has been around since the beginning of time.
History has proven that labeling has occupied the minds of many influential people. In a seminal
sociology book, Erving Goffman (1959) demonstrated the ways in which others perceive an
individual as being crucially important to how that individual outwardly presents him-or herself.
Goffman (1959) believed that even the most basic connotations of labeling could influence the
way a person interacts in any given situation and could lead to being stigmatized for life.
Sociologist Howard Becker is credited with the most influential design of labeling theory.
According to labeling theory (Becker, 1963), deviance is not an intrinsic feature of behavior.
Individuals are not naturally deviant in their actions and behaviors until a social group defines
them that way. Essentially, labeling theory suggests that people define and construct their
identities based upon society's perceptions of them.
Rosenthal and Jacobson (1968) investigated the Pygmalion effect which demonstrated the
potential of teachers in influencing the performance of students based on the teachers’ perception
of the students. In their experimental study, elementary students participated in intelligence pre-
tests to identify the academically high achievers. Teachers were explicitly informed of which
students were expected to have the greatest potential to be successful in the school setting.
However, the identified students were chosen randomly and not according to test results. All
students were retested at the end of the year. At the conclusion of the study, the students labeled
as the potentially highest achievers were the most successful with the highest scores. This study
proves that labeling students creates a self-fulfilling prophecy and reveals a direct correlation
between teacher expectation and student performance. This can be detrimental to students who are
labeled as a “slow learner” or having a disability.

2
Students who struggle academically in school face two potential labeling possibilities. The
first possibility consists of being officially evaluated by a professional to determine if the student
meets eligibility criteria in order to qualify for special education services through Individuals with
Disabilities Education Act (IDEA) (U.S. Department of Education, 2004). If the student meets
eligibility criteria, the student will be classified as belonging to one of the 13 specific disability
categories outlined by federal education regulations. Assigning a student a categorical name
implies the school will have more knowledge about the characteristics of the student's
exceptionality and will be able to better educate the child.
The second labeling possibility is to be unofficially labeled with negative and artificial
labels such as "lazy," "slow," or "unable to learn." Unfortunately, it does not matter if the student
was labeled by a professional or unofficially because all labels are the carriers of assumptions.
When people are identified by a label, society is often judgmental through the sharing of opinions
and beliefs. Too often, people willingly accept statements without evidence of validity. Such
assumptions could become stereotypes leading to stigmatization. “When we expect certain
behaviors of others, we are likely to act in ways that make the expected behavior more likely to
occur” (Rosenthal & Babad, 1985, p. 36).
When it comes to labeling, society seems to put on blinders and recognizes only a narrow
portion of a complicated human being. This leads to a society engaged in name-calling and verbal
abuse. Regrettably, it is human nature to be emotionally affected by society’s negative words and
actions regarding labels.
Rationale
This study is significant because along with the label comes the stigma of being considered
deficient. For this reason, assigning a student to a category for special education purposes and

3
formally labeling them for life is a momentous step that should be heavily considered. Labeling
should be the last resort after all other options to assist the child have been proven unsuccessful. It
is the responsibility of educators and parents to be advocates for students. This responsibility
surpasses more than just academic growth. Students must be given social guidance and emotional
support so they can thrive in the ever-changing world.
Students with disabilities have made significant gains in public schools because of IDEA.
Such advances were made possible due to the services provided when someone was designated as
having a disability. Once a child is categorized with an intellectual disability, an emotional
disturbance, or a learning disability, accommodation information will be forwarded to every new
teacher through the child's cumulative folder (Henley, Ramsey, & Algozzine, 2009).
Negative perceptions of a student can be damaging if a label influences the perceptions of
other attributes the student possesses. This could inadvertently influence the way the student is
treated at school and hinder the opportunities made available to the student (Gates, 2010).
Research findings could be used to develop emotional and social support programs at school to
help students cope with their label. Perhaps counselors or school psychologists could lead
counseling sessions among students with disabilities and their peers that facilitate conversations
about what it means to be labeled with a disability.
This study’s findings may have implications for students, parents, teachers and the
community in general. Together, society can overcome negative labeling by cultivating
unconditional acceptance, compassion, and understanding. Students, parents and teachers who
understand the power of labels and words can avoid using them to diminish others and instead use
labels and words as a means to educate, encourage and inspire others.

4
Purpose
The purpose of this study is to determine if labeling has an impact on the self- esteem of
students with exceptionalities in grades three through five and to determine how the students with
exceptionalities are perceived by their peers. The researcher will utilize a survey with multiple
choice questions and rating scales to gather data from elementary students with and without
disabilities in third through fifth grade.
Hypotheses and Research Questions
The hypotheses and primary research questions guiding the study include the following:
1.) Students with exceptionalities will have a self-esteem rating similar to their peers without
exceptionalities.
a. Do students with disabilities have lower self-esteem compared to their peers
without disabilities?
b. Do students with labels perceive themselves as being less intelligent than their
peers?
2.) Students in the general education setting will demonstrate negative perceptions of their
peers with labels.
a. Do students with disabilities feel as if they have less friends than their peers without
disabilities?
b. Are students in general education classes likely to be friends with students who
attend special education classes?
c. Does labeling of children with special needs increase the risk of facing peer
rejection?
d. How do general education students perceive their peers with exceptionalities?
5
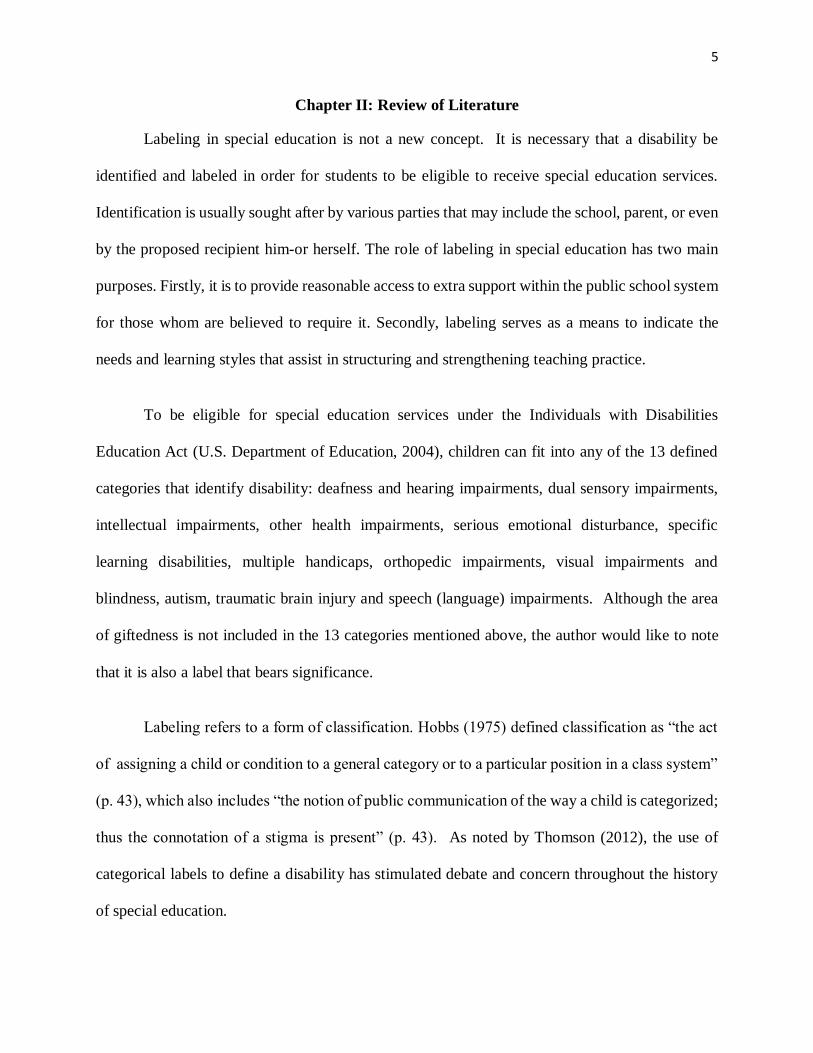
Chapter II: Review of Literature
Labeling in special education is not a new concept. It is necessary that a disability be
identified and labeled in order for students to be eligible to receive special education services.
Identification is usually sought after by various parties that may include the school, parent, or even
by the proposed recipient him-or herself. The role of labeling in special education has two main
purposes. Firstly, it is to provide reasonable access to extra support within the public school system
for those whom are believed to require it. Secondly, labeling serves as a means to indicate the
needs and learning styles that assist in structuring and strengthening teaching practice.
To be eligible for special education services under the Individuals with Disabilities
Education Act (U.S. Department of Education, 2004), children can fit into any of the 13 defined
categories that identify disability: deafness and hearing impairments, dual sensory impairments,
intellectual impairments, other health impairments, serious emotional disturbance, specific
learning disabilities, multiple handicaps, orthopedic impairments, visual impairments and
blindness, autism, traumatic brain injury and speech (language) impairments. Although the area
of giftedness is not included in the 13 categories mentioned above, the author would like to note
that it is also a label that bears significance.
Labeling refers to a form of classification. Hobbs (1975) defined classification as “the act
of assigning a child or condition to a general category or to a particular position in a class system”
(p. 43), which also includes “the notion of public communication of the way a child is categorized;
thus the connotation of a stigma is present” (p. 43). As noted by Thomson (2012), the use of
categorical labels to define a disability has stimulated debate and concern throughout the history
of special education.
6
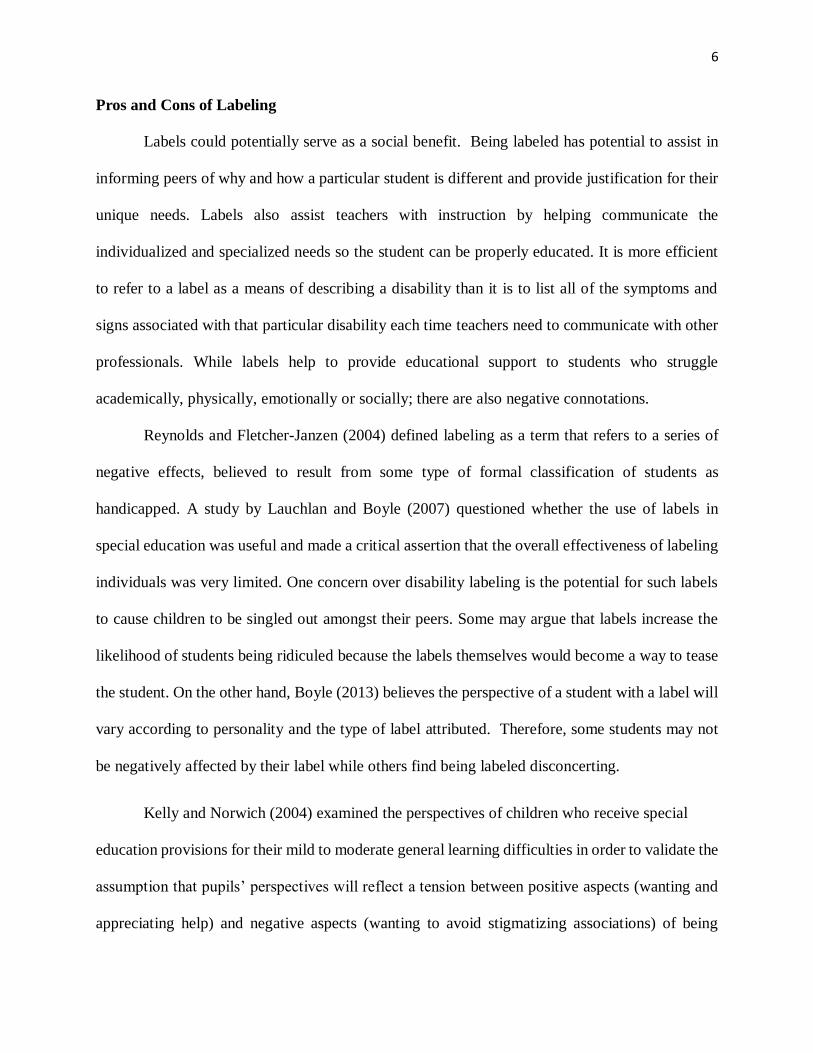
Pros and Cons of Labeling
Labels could potentially serve as a social benefit. Being labeled has potential to assist in
informing peers of why and how a particular student is different and provide justification for their
unique needs. Labels also assist teachers with instruction by helping communicate the
individualized and specialized needs so the student can be properly educated. It is more efficient
to refer to a label as a means of describing a disability than it is to list all of the symptoms and
signs associated with that particular disability each time teachers need to communicate with other
professionals. While labels help to provide educational support to students who struggle
academically, physically, emotionally or socially; there are also negative connotations.
Reynolds and Fletcher-Janzen (2004) defined labeling as a term that refers to a series of
negative effects, believed to result from some type of formal classification of students as
handicapped. A study by Lauchlan and Boyle (2007) questioned whether the use of labels in
special education was useful and made a critical assertion that the overall effectiveness of labeling
individuals was very limited. One concern over disability labeling is the potential for such labels
to cause children to be singled out amongst their peers. Some may argue that labels increase the
likelihood of students being ridiculed because the labels themselves would become a way to tease
the student. On the other hand, Boyle (2013) believes the perspective of a student with a label will
vary according to personality and the type of label attributed. Therefore, some students may not
be negatively affected by their label while others find being labeled disconcerting.
Kelly and Norwich (2004) examined the perspectives of children who receive special
education provisions for their mild to moderate general learning difficulties in order to validate the
assumption that pupils’ perspectives will reflect a tension between positive aspects (wanting and
appreciating help) and negative aspects (wanting to avoid stigmatizing associations) of being

7
labeled. Their findings show that the pupils in both mainstream and special schools are sensitive
to the negative connotations associated with some of the labels applied to them.
Self-esteem
According to Banks and Woolfson (2008), depression and low self-esteem have both been
found to have higher incidence rates in students with learning difficulties compared to students
without learning difficulties. While many common disabilities do not demonstrate any external
physical attributes, the tools and educational modifications an individual uses clearly prove a need
for assistance. The practice of inclusion places individuals with exceptionalities in the same
environment as their peers where their vulnerability is visible. Recognition of a child being
perceived as different sometimes makes peer acceptance difficult.
A lack of peer acceptance and feeling of rejection could contribute to the development of
emotional problems (Georgiadi, Kalyva, Kourkoutas, & Tsakiris, 2012). Adding an emotional
disorder along with being identified as having a learning difficulty only further burdens the
individual and hinders their academic growth and social development.
Conley, Ghavami, VonOhlen and Foulkes (2007) conducted a study that examined the self-
esteem of students who are emotionally disturbed, students who are learning disabled, and students
who are in regular education classrooms. Conley et al. found that students who were emotionally
disturbed or learning disabled had lower self-esteem than did students in regular education classes.
In a similar study, Little and Kobak (2003) revealed results suggesting that students with
exceptionalities perceive common interpersonal stressors as a greater emotional challenge than
students with exceptionalities. With such findings, it is likely that increased stressful experiences
of interpersonal events creates excessive demands on the coping abilities of students with

8
exceptionalities. Such stressful experiences and demands have the potential to hinder students with
exceptionalities ability to make friends.
Social Disadvantage
In 1959, Canadian Sociologist Erving Goffman demonstrated the viewpoint in which
people perceive you is crucially important to how you outwardly present yourself. This viewpoint
suggests that labeling has an influence on how one interacts in any given situation. For instance,
Goffman (1959) believed that having the label of a mental illness meant that you were stigmatized
for life, and this had a bearing on how you would be treated throughout your life.
According to Gillman, Heyman and Swain (2000), a label can lead to social disadvantage
and exclusion from society. Therefore, labeling defeats the purpose of special education
progressing from a pull-out model to an inclusion model in an effort to ensure that students with
disabilities are fully engaged with their peers without handicaps. Placing students in the general
education setting may help them academically, but it does not always benefit them socially or
emotionally.
DiGennaro Reed, McIntyre, Dusek, & Quintero (2011) found that the use of sociometric
ratings suggests that students with disabilities were less likely to be nominated as a first choice for
sitting with at lunch, playing with at recess, or working with in a small instructional group. While
this may seem petty to an adult, it is important to note that such social interactions and feelings of
acceptance are an essential component of children developing a sense of belonging. Students with
exceptionalities are already at an academic disadvantage and to add social disadvantage further
hinders their educational performance and attitude toward life.

9
Research on a sense of community and feelings of belonging conducted by Bramston,
Bruggerman and Pretty (2002) found that individuals with disabilities reported a significantly
lower feeling of social belonging and empowerment than their matched nondisabled peers.
A conflicting study examining attitudes towards peers with intellectual disabilities by
Georgiadi et al. (2012) found that typically developing children express overall neutral attitudes
towards their peers with intellectual disabilities, with children from inclusive settings being more
accepting than children from non-inclusive settings.
Conclusion
There is a scarcity of research regarding what children understand about being given a label
and how they view themselves (Banks & Woolfson, 2008). Due to the overwhelming number of
students being labeled and a lack of research concerning the self-efficacy of students with
disabilities, further research is needed.
The purpose of this study is to determine if labeling has a negative impact on the self-
esteem of students with exceptionalities in grades three through five and to determine how the
students are perceived by their peers.
For the purpose of this study, the following terms have been defined as follows:
Labeling: a classifying phrase or name applied to a person, especially one that is
inaccurate or restrictive.
Self-esteem: confidence in one’s own worth or abilities; self-respect.
Social disadvantage: an unfavorable circumstance that reduces the chances of success
or effectiveness of making and maintaining social relationships
If there truly is a negative correlation among labeled students’ self-esteem, ability to make
friends or an overall negative perception by their peers, future studies would need to address a
10
means for combating such problems. Teachers and students should be provided with various
strategies and instructional techniques that support positive interactions and acceptance of
individuals with exceptionalities. Knowing the negative aspects associated with labeling can help
students with special needs as well as their parents and teachers to help combat the negative stigma.
They can keep a watchful eye on their child or student’s experiences with other children and stress
that each child is an individual with unique needs, strengths, and qualities.
Frederickson (2010) reviewed a study in which social interaction between students with
disabilities and students without disabilities participated in preplanned social activities. The
outcome of the mentioned activities provided positive evidence of the effectiveness of increasing
positive interactions and reciprocal levels of acceptance between students with special needs and
their peers. DiGennaro Reed et al. (2011) argued that social skill instruction should be emphasized
to focus on friendship making skills (e.g., joining in, asking someone to play, sharing, and offering
help) and emotional regulation.
Labels may stay with an individual throughout their entire life (Lauchlan & Boyle, 2007).
In conclusion, the decision to use a label should be carefully considered due to the possibility of
negative connotations regarding social relationships, personal preferences and the effects on self-
esteem.

11
Chapter III: Research Design and Methodology
In an effort to determine if having a label affects self-esteem, the researcher conducted a
survey to discover if students with exceptionalities have a self-esteem rating similar to their peers
without exceptionalities and if students in the general education setting demonstrate negative
perceptions of their peers with labels. The researcher will also ask questions related to socialization
and the ability to make friends. From the survey, the hope is to increase awareness of various
strategies and instructional techniques that support positive interactions and acceptance of
individuals with exceptionalities in order to combat any negative stigma.
Subjects
Subjects selected for the study consisted of a candidate pool of 127 third-, fourth-, and
fifth-grade students enrolled at Midway Elementary School in rural Lincoln County, West
Virginia. Both male and female students with and without disabilities between the ages of nine
and 13 could participate. A total of 93 students participated in the study.
Demographics of the 93 students in this research study include 30 third-graders, 32 fourth-
graders and 31 fifth-graders. There were 43 male students and 50 female students who participated
in the study. Students with exceptionalities and disabilities made up 27% of the participants—17
male and 8 female.
Procedures
First, the researcher reviewed journal articles on current research regarding labeling, self-
esteem and social disadvantage. Permission was then obtained from the principal of Midway
Elementary to conduct the research project and survey. Permission for the research study was
obtained from Marshall University’s International Review Board (IRB).
After gaining IRB approval, the co-investigator sent home parent consent forms to all third,
fourth and fifth grade students with and without disabilities enrolled at Midway Elementary
12
School. A total of 127 subjects were the most that would be able to enter the study since that is the
maximum number of subjects in the candidate pool of third, fourth and fifth grade students.
All students had one week to return the consent form. Students who returned the consent
form with a parent or guardian signature then attended a brief informational meeting regarding the
study. The meeting was led by the co-investigator and detailed the purpose and procedure for the
study.
During the meeting, students were provided the opportunity to ask any questions they may
have had about the survey and their involvement. Students who agreed to participate in the survey
signed a child assent form and returned it to the co-investigator during the meeting. One week
later, participating students used the school’s computer lab to complete the survey.
The lab was utilized in groups of approximately 15-20 students per grade level in order to
efficiently supervise and provide support to students. There were a total of six classrooms brought
into the lab—two classes of each third-, fourth- and fifth-grade. Prior to initiating the survey, all
computers were logged on to the internet and the kwiksurveys.com website. Participants were
reminded that they may discontinue the survey at any time if they so choose. The survey took
approximately 20 minutes to complete. Any participant needing or requesting to have the survey
read aloud to them did so with the assistance of a teacher. After completion students were thanked
for their participation, and they returned to their classroom. The next grade level group was then
brought in to complete the survey.
Instrumentation
The assessment tool for this study was an online survey created by the co-investigator using
the kwiksurveys.com website. The complete survey consisted of 33 questions in a mixed format
of multiple choice, Likert scale and drop-down menus. The first page of the survey contained 13

13
questions focused on student demographics. Questions specifically pertained to gender, age, grade
and involvement in educational services such as occupational therapy, speech therapy, reading or
math interventions and other aspects of special education. Survey questions can be found in
Appendix B.
The second page contained 10 statements from the Rosenberg Self-Esteem Scale—a 10-
item scale that measures global self-worth through assessing positive and negative feelings about
the self (Rosenberg, 1979). Students were asked to rate each statement as “Strongly Agree”,
“Agree”, “Disagree” or “Strongly Disagree”.
The final page and last nine questions of the survey focused on the concepts of socialization
and labels. Students were to choose a statement from a drop down menu based on how easy or
difficult it is to make friends. Five questions referred to students’ personal perspectives of their
intelligence compared to their peers. Students were given the choice of “Much Smarter”, “Just as
Smart”, and “Not as Smart” using a drop-down menu. One question required students to rate how
likely they were to be friends with a peer in special education classes using “Very Likely”,
“Likely” or “Not Likely”. The remaining questions pertained to bullying and being bullied.
Students had to select “Yes” or “No” according to how the statement related to them personally.
No personal identifying information was on the survey.
Data Analysis
After completing the survey, results were automatically saved to the kwiksurveys.com
website where the co-investigator could access them. Data was then analyzed to establish
relationships among labels and self-esteem as well as labels and socialization.

14
First, demographic information was cross referenced with the Rosenberg Self-esteem scale
to determine if students with labels in special education classes have lower self-esteem compared
to their peers without disabilities.
Next, demographic information was cross referenced with the 9 survey questions regarding
socialization to determine the following:
1. Do students with disabilities feel as if they have less friends than their peers without
disabilities?
2. Do students with labels perceive themselves as being less intelligent than their peers?
3. Are students in general education classes likely to be friends with students who attend
special education classes?
4. How do general education students perceive their peers with exceptionalities?
Then the co-investigator looked for a predominant theme in order to determine if labeling has
a negative impact on the self- esteem of students with exceptionalities in grades three through five
and to determine how students with disabilities are perceived by their peers.

15
Chapter IV: Results
The purpose of this study was to determine if labeling has an impact on the self-esteem of
students with exceptionalities in grades three through five and to determine how the students with
exceptionalities are perceived by their peers.
The data analyses were guided by the research questions posed. This study used a survey
to provide answers to the questions. Each research question will be answered in this chapter. A
description of the data used and the analyses done will be given. The results of the analyses will
then be presented and the researcher’s conclusion of the hypotheses will be determined by the
evidence. Hypothesis one is statistically driven and hypothesis two is inferentially-based on
student responses to survey questions.
Hypotheses and Research Questions
1.) Students with exceptionalities will have a self-esteem rating similar to their peers without
exceptionalities.
a. Research Question 1: Do students with disabilities have lower self-esteem
compared to their peers without disabilities?
b. Research Question 2: Do students with labels perceive themselves as being less
intelligent than their peers?
2.) Students in the general education setting will demonstrate negative perceptions of their
peers with labels.
a. Research Question 3: Do students with disabilities feel as if they have fewer friends
than their peers without disabilities?
b. Research Question 4: Are students in general education classes likely to be friends
with students who attend special education classes?
16
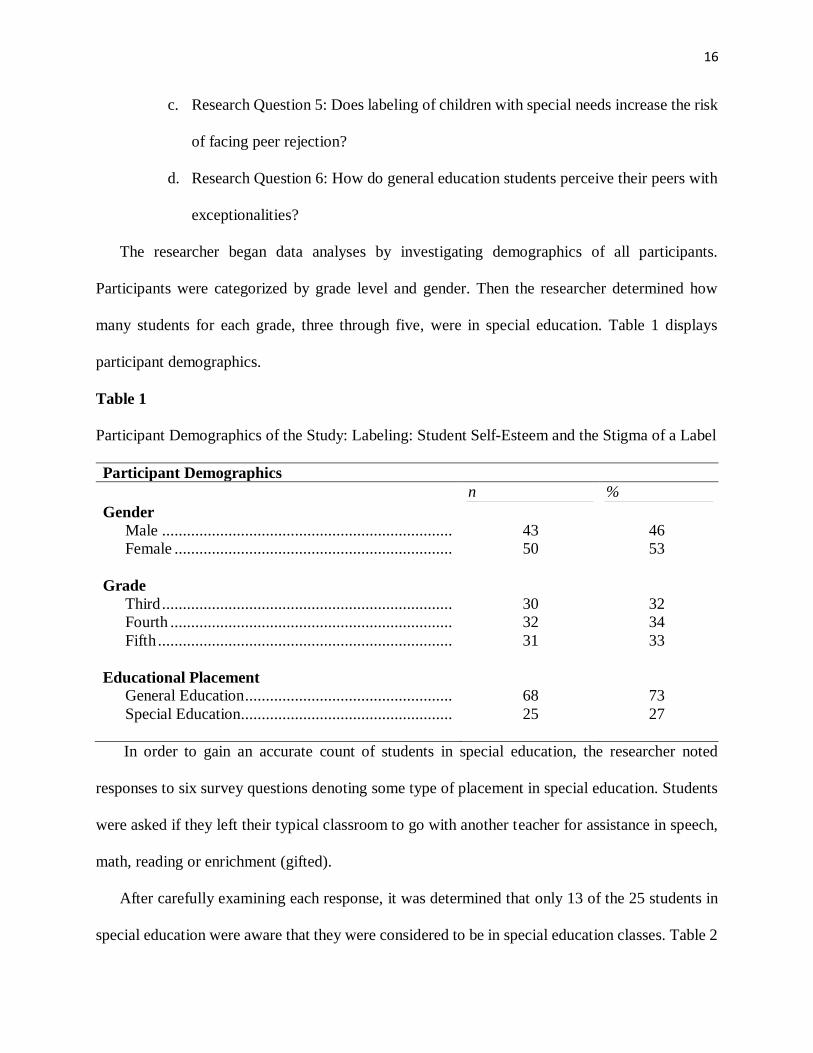
c. Research Question 5: Does labeling of children with special needs increase the risk
of facing peer rejection?
d. Research Question 6: How do general education students perceive their peers with
exceptionalities?
The researcher began data analyses by investigating demographics of all participants.
Participants were categorized by grade level and gender. Then the researcher determined how
many students for each grade, three through five, were in special education. Table 1 displays
participant demographics.
Table 1
Participant Demographics of the Study: Labeling: Student Self-Esteem and the Stigma of a Label
Participant Demographics
n %
Gender
Male ...................................................................... 43 46
Female ................................................................... 50 53
Grade
Third ...................................................................... 30 32
Fourth .................................................................... 32 34
Fifth ....................................................................... 31 33
Educational Placement
General Education .................................................. 68 73
Special Education................................................... 25 27
In order to gain an accurate count of students in special education, the researcher noted
responses to six survey questions denoting some type of placement in special education. Students
were asked if they left their typical classroom to go with another teacher for assistance in speech,
math, reading or enrichment (gifted).
After carefully examining each response, it was determined that only 13 of the 25 students in
special education were aware that they were considered to be in special education classes. Table 2

17
displays all students’ responses to questions pertaining to their involvement in special education
classes.
Table 2
Student Responses Regarding Involvement in Special Education Classes
Student Gender Grade Special Education
Speech Ms.White For Math (Special Ed.)
Ms. White For RLA (Special Ed.)
Mrs. Browning (Gifted)
1 Male Fourth No No No No No
2 Female Fourth No No No No No
3 Female Fourth No No No No No
4 Female Fourth No No No No No
5 Male Fourth No No No No No
6 Female Fourth No No No No No
7 Female Fourth Yes Yes No No No
8 Male Fourth No No No No No
9 Male Fourth No Yes No No No
10 Male Fourth Yes Yes No No No
11 Male Fourth Yes No No No No
12 Male Fourth No No No No No
13 Female Fourth No No No No No
14 Male Fourth No No No No No
15 Male Fourth Yes No No Yes No
16 Female Fourth Yes Yes Yes No No
17 Male Fourth No No No No No
18 Female Fifth No No No No No
19 Female Fourth No No No No No
20 Female Fourth No No No No No
21 Female Fourth No No No No No
22 Female Fourth No No No No No
23 Male Fourth No No No No No
24 Female Fourth No Yes No No No
25 Male Fourth No No No No No
26 Male Fourth No No Yes No No
27 Female Fourth No No No No No
28 Female Fourth No No No No No
29 Male Fourth No No No No No
30 Male Fourth No No No No No
31 Male Fourth Yes Yes No No No
32 Female Fifth No No No No No

18
Student Gender Grade Special Education
Speech Ms.White For Math (Special Ed.)
Ms. White For RLA (Special Ed.)
Mrs. Browning (Gifted)
33 Male Fifth No No No No No
34 Female Fifth No No No No No
35 Female Fifth No No No No No
36 Female Fifth No No No No No
37 Male Fifth No No No No No
38 Female Fifth No No No No No
39 Male Fifth No No No No No
40 Female Fifth No No No No No
41 Female Fifth No No No No No
42 Female Fifth No Yes No No No
43 Male Fifth No No No No No
44 Male Fifth No No No No No
45 Female Fifth No No No No No
46 Female Fifth No No No No No
47 Male Fourth Yes No No Yes No
48 Female Fifth No No No No No
49 Female Fifth Yes Yes No No No
50 Female Fifth No No No No No
51 Female Fifth No No No No No
52 Female Fifth No No No No No
53 Female Fifth No No No No No
54 Female Fifth No No No No No
55 Female Fourth No No No No No
56 Male Third No Yes No No No
57 Female Third No Yes No No No
58 Female Fifth No No No No No
59 Female Third No No No No No
60 Female Third No No No No No
61 Male Fifth No Yes No No No
62 Male Fifth No No No No No
63 Female Third No No No No No
64 Male Third No Yes No No No
65 Male Third No No Yes No No
66 Female Fifth Yes Yes Yes Yes No
67 Male Third No No No No No
68 Female Fifth No No No No No
69 Female Third No No No No No
70 Male Third No No No No No
71 Male Third No No No No No

19
Student Gender Grade Special Education
Speech Ms.White For Math (Special Ed.)
Ms. White For RLA (Special Ed.)
Mrs. Browning (Gifted)
72 Male Third No No No No No
73 Female Third No No No No No
74 Male Third No No No No No
75 Male Third No Yes No No No
76 Male Third No No No No No
77 Male Third Yes No No No No
78 Female Third No No No No No
79 Female Third No No No No Yes
80 Female Third No No No No No
81 Female Fifth No No No No No
82 Male Third No No No No No
83 Male Third No No No No No
84 Female Third No No No No No
85 Male Third Yes Yes No No No
86 Female Third No No No No No
87 Male Third No No No No No
88 Male Third No No No No No
89 Male Fifth No No No No Yes
90 Female Fifth No No No No No
91 Male Third Yes Yes No Yes No
92 Male Third Yes No Yes Yes No
93 Female Third No No No No No
Note. The survey asked students if they left the room to attend class with another teacher for
Special Education, Speech or the Gifted Program. The table lists their “Yes” and “No” responses.
Research Question 1: Do students with disabilities have lower self-esteem compared to their
peers without disabilities?
Survey items 14-23 consisted of statements from the Rosenberg Self-Esteem Scale
(Rosenberg, 1979). This scale was used to measure students’ self-worth using a Likert scale to rate
positive and negative feelings. Students completed the survey by rating each item, and then the co-
investigator scored each item. The scale ranged from zero to 30. Scores between 15 and 25 were
within normal range; scores below 15 suggested low self-esteem.

20
The researcher exported each of the 10 items to an excel spreadsheet and then scored items
accordingly before establishing a total. Items 14, 15, 17, 19 and 20 were scored on a scale of three
to zero with three being “Strongly Agree” and zero being “Strongly Disagree”. Items 16, 18, 21,
22, and 23 were scored reversed in valence with zero being “Strongly Agree” and three being
“Strongly Disagree”.
Once all student scores were determined, the researcher created three graphs to represent
the data. Figure 4.1 shows average results organized by grade and gender. Figure 4.2 depicts
average results according to educational setting. Figure 4.3 displays the average scores according
to grade, gender, and educational placement.
Figure 4.1: Average Results of the Rosenberg Self-Esteem Scale Organized by Grade and Gender

21
Figure 4.2: Average Results of the Rosenberg Self-Esteem Scale According to Educational Setting
Figure 4.3: Average Results of the Rosenberg Self-Esteem Scale According to Grade, Gender,
and Educational Placement

22
The results showed that participants in general education achieved a mean raw score of
20.35 on the Rosenberg Self-Esteem Scale compared to a mean score of 20.84 for participants in
special education (Rosenberg, 1979). To determine the probability that the difference between
these means was significant (beyond chance), a t-test for independent samples was obtained.
These results, shown in Table 2, indicate that participants in general education did not score
significantly greater than did those in special education (t,0.72, df40, p<0.05). Based upon the
results of the data analysis, hypothesis one is accepted that there are not significant differences in
self-esteem scores among general education students versus special education students.
Table 2
t-Test Analysis of Self-Esteem Scores of General and Special Education Students
t-Test: Two Sample Assuming Unequal Variances
General Ed. Special Ed.
Mean .......................................................................... 20.35 20.84
Variance ..................................................................... 30.83 35.39
Observations .............................................................. 68.00 25.00
Hypothesized Mean Difference................................... 0.00
df................................................................................ 40.00
t Stat ........................................................................... -0.36
P(T<=t) one-tail .......................................................... 0.36
t Critical one-tail......................................................... 1.68
P(T<=t) two-tail ......................................................... 0.72
t Critical two-tail ........................................................ 2.02
Research Question 2: Do students with labels perceive themselves as being less intelligent
than their peers?
Participants were asked, “How smart are you compared to your peers?” Figure 4.4
illustrates results in a pie chart. Results showed 24% of special education students believe they are
“Not as Smart” as their peers. On the other hand, 56 % of special education students believe they
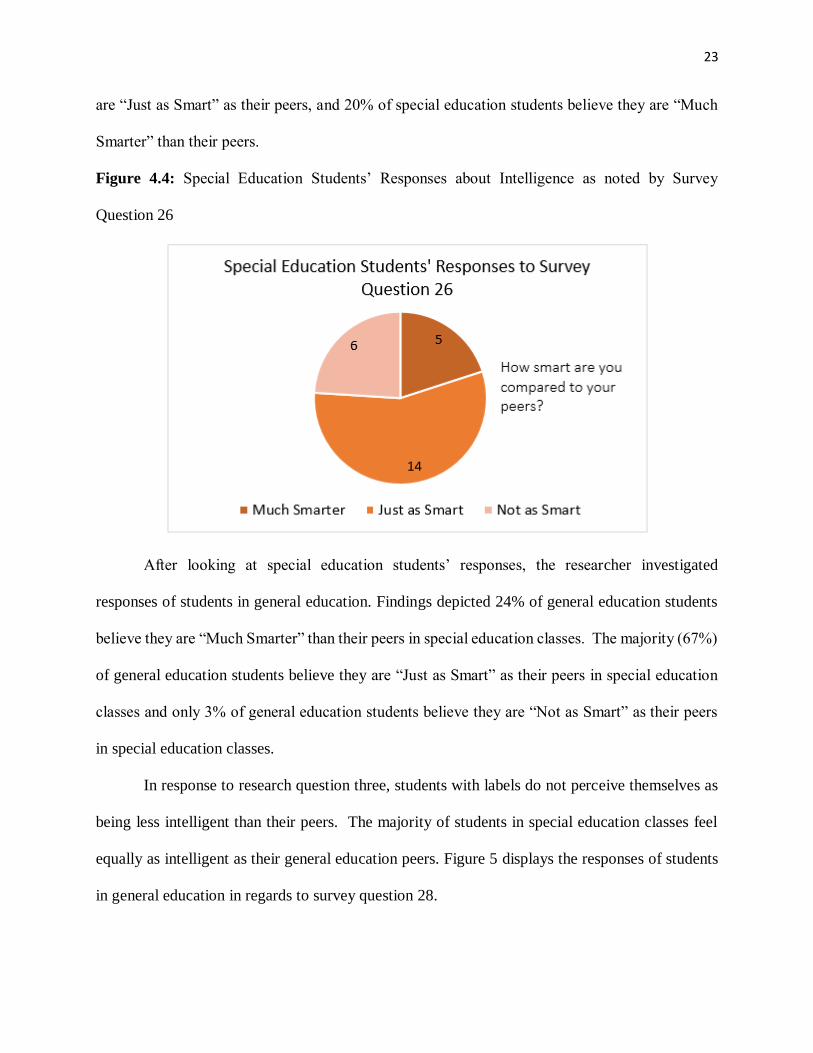
23
are “Just as Smart” as their peers, and 20% of special education students believe they are “Much
Smarter” than their peers.
Figure 4.4: Special Education Students’ Responses about Intelligence as noted by Survey
Question 26
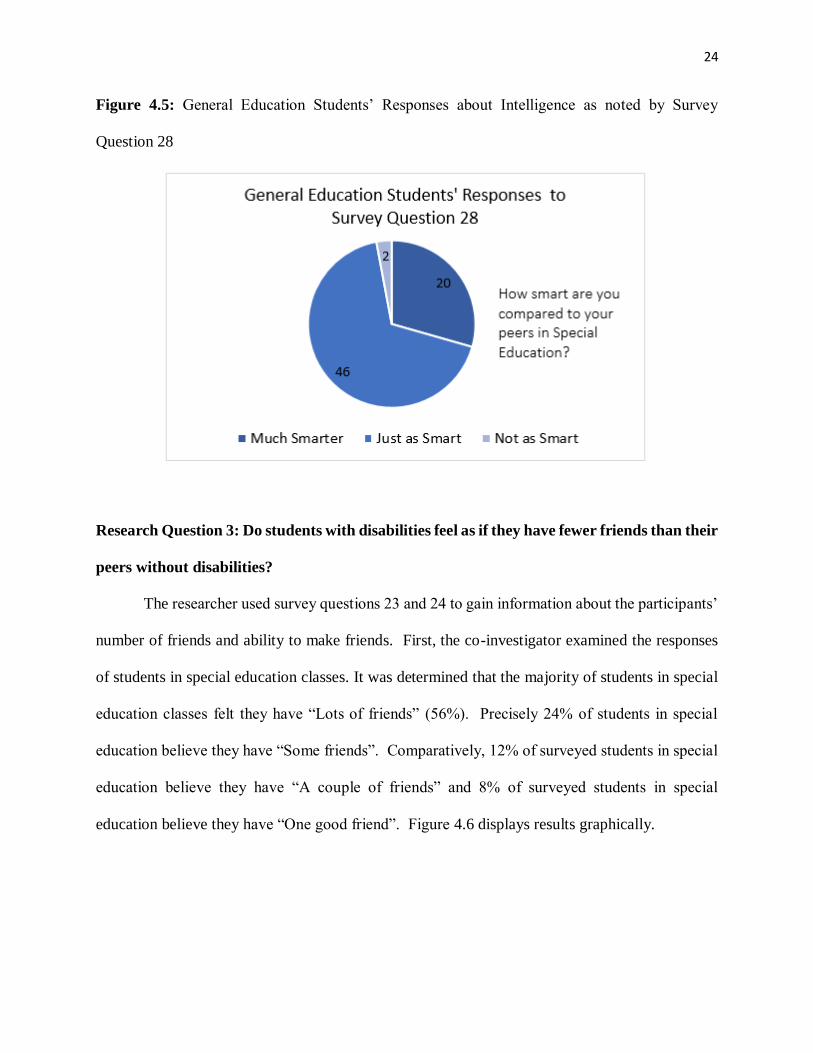
After looking at special education students’ responses, the researcher investigated
responses of students in general education. Findings depicted 24% of general education students
believe they are “Much Smarter” than their peers in special education classes. The majority (67%)
of general education students believe they are “Just as Smart” as their peers in special education
classes and only 3% of general education students believe they are “Not as Smart” as their peers
in special education classes.
In response to research question three, students with labels do not perceive themselves as
being less intelligent than their peers. The majority of students in special education classes feel
equally as intelligent as their general education peers. Figure 5 displays the responses of students
in general education in regards to survey question 28.
24
Figure 4.5: General Education Students’ Responses about Intelligence as noted by Survey
Question 28
Research Question 3: Do students with disabilities feel as if they have fewer friends than their
peers without disabilities?
The researcher used survey questions 23 and 24 to gain information about the participants’
number of friends and ability to make friends. First, the co-investigator examined the responses
of students in special education classes. It was determined that the majority of students in special
education classes felt they have “Lots of friends” (56%). Precisely 24% of students in special
education believe they have “Some friends”. Comparatively, 12% of surveyed students in special
education believe they have “A couple of friends” and 8% of surveyed students in special
education believe they have “One good friend”. Figure 4.6 displays results graphically.

25
Figure 4.6: Friendship according to Students in Special Education as noted by Survey Question
24
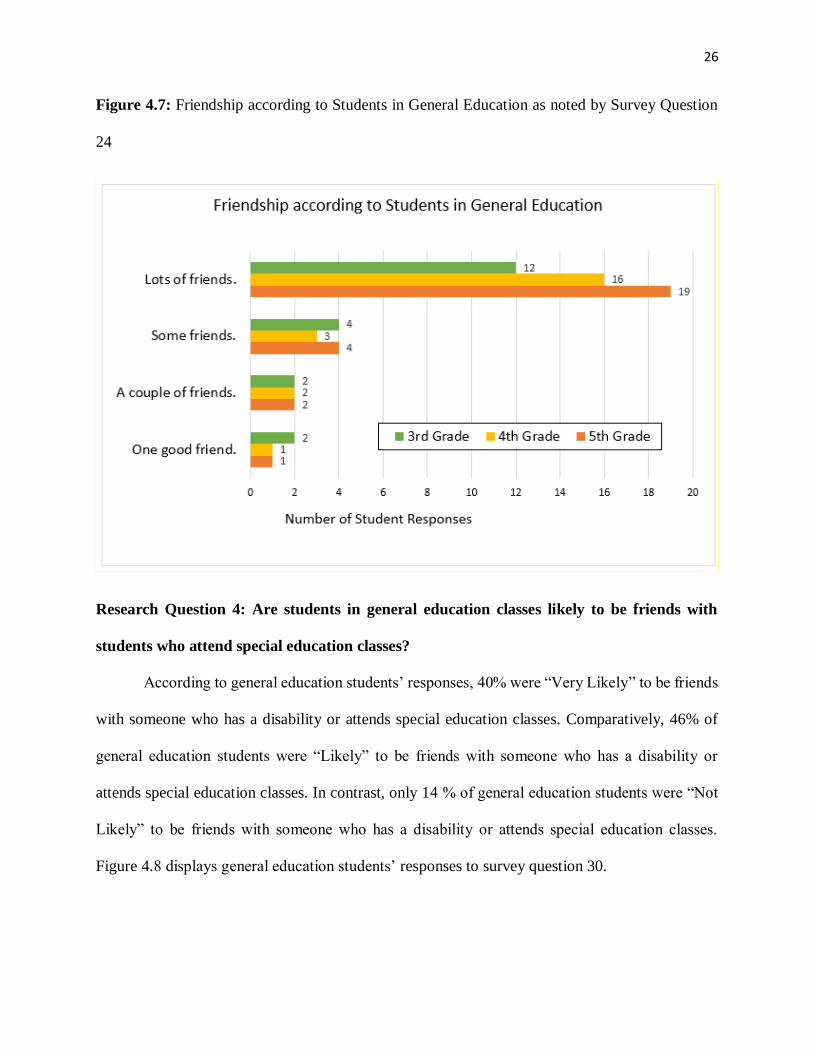
Next, the co-investigator reviewed the responses from students in the general education
setting. Student responses showed 69% of students in general education believe they have “Lots
of friends”. Survey results revealed that 16% of students in special education believe they have
“Some friends”, 9% of students in general education believe they have “A couple of friends” and
6% of students in general education believe they have “One good friend”. See Figure 4.7.
The co-investigator’s findings yield a very similar relationship among special education
students and general education students’ number of friends. This leads to the conjecture that
students with disabilities do not feel as if they have less friends compared to their peers without
disabilities.
26
Figure 4.7: Friendship according to Students in General Education as noted by Survey Question
24
Research Question 4: Are students in general education classes likely to be friends with
students who attend special education classes?
According to general education students’ responses, 40% were “Very Likely” to be friends
with someone who has a disability or attends special education classes. Comparatively, 46% of
general education students were “Likely” to be friends with someone who has a disability or
attends special education classes. In contrast, only 14 % of general education students were “Not
Likely” to be friends with someone who has a disability or attends special education classes.
Figure 4.8 displays general education students’ responses to survey question 30.

27
Figure 4.8: General Education Students’ Responses about the Likeliness of Friendship as noted
by Survey Question 30
A large percentage (86%) of general education students chose “Very Likely” and “Likely”
in regard to being friends with a student in special education classes. These findings provide
evidence that positive relationships are being developed among all students regardless of being
associated with a label. It seems as if general education students do not have a problem being
friends with students in special education.
Research Question 5: Does labeling of children with special needs increase the risk of
facing peer rejection?
In order to determine if students with special needs faced peer rejection, the researcher
considered all nine socialization and labeling questions on the survey and gave particular attention
to questions 32 and 24.
The researcher used survey question 32 to ask participants, “Have you ever been teased or
bullied by another person because you have a disability?” The co-investigator focused on

28
responses from students in special education classes in order to conclude if the majority of students
in special education classes felt they had ever been teased or bullied. Results are displayed in
Figure 4.9. Out of the 25 students in special education, six (24%) responded that they had been
teased or bullied because of their disability and 19 (76%) responded that they had not been teased
or bullied because of their disability.
Figure 4.9: Special Education Students’ Responses About Bullying as Noted by Survey Question
32.
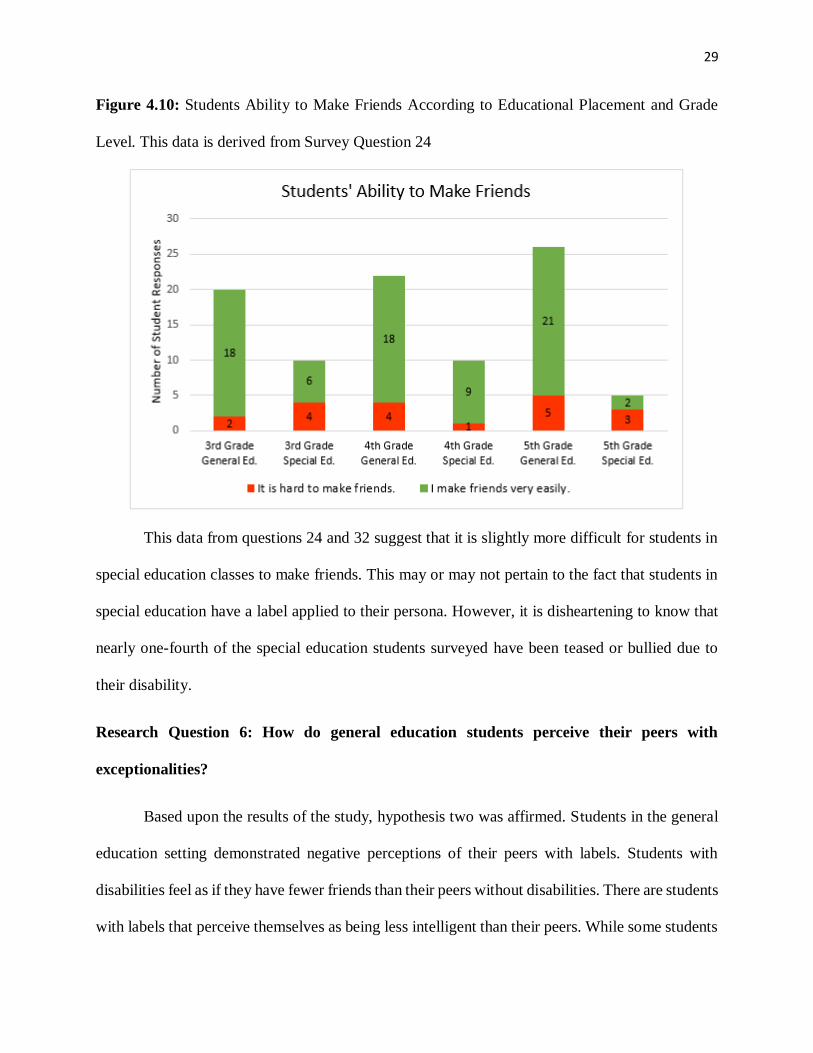
Then the researcher examined survey question 24 to compare the ability of making friends
between students in special education and students in general education. Results are depicted in
Figure 4.10. Results showed that 32% of students in special education classes find it hard to make
friends and 68% of students in special education classes feel as if they make friends very easily.
The results from general education students showed that 16% of students find it hard to make
friends and 84% of general education students feel as if they make friends very easily.
29
Figure 4.10: Students Ability to Make Friends According to Educational Placement and Grade
Level. This data is derived from Survey Question 24
This data from questions 24 and 32 suggest that it is slightly more difficult for students in
special education classes to make friends. This may or may not pertain to the fact that students in
special education have a label applied to their persona. However, it is disheartening to know that
nearly one-fourth of the special education students surveyed have been teased or bullied due to
their disability.
Research Question 6: How do general education students perceive their peers with
exceptionalities?
Based upon the results of the study, hypothesis two was affirmed. Students in the general
education setting demonstrated negative perceptions of their peers with labels. Students with
disabilities feel as if they have fewer friends than their peers without disabilities. There are students
with labels that perceive themselves as being less intelligent than their peers. While some students

30
in general education classes are likely to be friends with students who attend special education
classes, there is a portion that is not likely. Students with special needs and labels are at risk of
facing peer rejection through the use of teasing and bullying. The ideas that the students with
exceptionalities feel it is difficult to make friends and the belief that they have been bullied due to
having a disability, proves a negative stigma exists. While the results did not indicate an
overwhelming difference, there appears to be areas that could be further investigated.

31
Chapter V: Discussion
The purpose of this study is to determine if labeling has an impact on the self- esteem of
students with exceptionalities in grades three through five and to determine how the students with
exceptionalities are perceived by their peers. This chapter presents: (a) interpretation of results, (b)
limitations of the study, (c) recommendations for future research and (d) conclusion and
implications.
Interpretation of Results
A study by Banks and Woolfson (2008) indicated that depression and low self-esteem have
both been found to have higher incidence rates in students with learning difficulties compared to
students without learning difficulties. A similar study by Conley, Ghavami, VonOhlen and Foulkes
(2007) examined the self-esteem of students who are emotionally disturbed, students who are
learning disabled, and students who are in regular education classrooms. Conley et al. found that
students who were emotionally disturbed or learning disabled had lower self-esteem than did
students in regular (general) education classes.
In contrast, this study’s findings showed there was not significant differences in self-esteem scores
among general education students and special education students in grades three through five.
Scores for both groups of students averaged between 20 and 21 which is considered to be within
normal range.
A study by Georgiadi et al. (2012), found that typically developing children express overall
neutral attitudes towards their peers with intellectual disabilities. These findings are comparable
to this study in that the co-investigator’s findings yield a very similar relationship among special
education students and general education students’ number of friends, ability to make friends, and
the likeliness of general and special education students being friends.
32
Limitations
While this study had a positive participation rate (73%) and results suggest there is not a
major difference in the self-esteem among general and special education students, there are several
limitations that need be considered.
First of all, Midway Elementary School is in a rural area with very limited diversity and
the participant pool was a small sample of students in only grades three through five. Out of a total
of 93 participants, 25 were in special education and 68 were in general education. Surprisingly, a
significant portion of participants in special education (52%) were not even aware that they
participate in special education classes. For this study’s purpose, it was necessary that students be
aware of their involvement in special education as well as their perception of being labeled.
According to Boyle (2013), the perspective of a student with a label will vary according to
personality and the type of label attributed. Due to this, the perspective of students in special
education may not have been adequately depicted considering over half of the students were
unaware of their placement in special education.
A second possible limitation is that students participating in the study completed the survey
in the school’s computer lab, which was not a private setting. Participants were surrounded by
their peers and may have been influenced to respond in a way that was inconsistent with how they
would have responded if in a more private setting.
Finally, there was a slight time restraint. The survey was completed during the school day
on the co-investigator’s planning time. This resulted in students having a limited amount of time
to complete the survey. Allowing students more time to think may have yielded different
responses.
33
Recommendations for Future Studies
Based on the limitations noted above, the following recommendations are suggested for
future studies:
Utilize a more urban district with diverse participants.
Include participants in middle and high school.
The study should require a larger pool of participants in special education.
Survey completion should be conducted in a more private setting.
Participants should have an unlimited amount of time to complete the survey.
Conclusion and Implications
Based on the results of the study, hypothesis one is accepted that there are not significant
differences in the self-esteem scores among general education students versus special education
students. Hypothesis two was affirmed that students in the general education setting demonstrated
negative perceptions of their peers with labels.
DiGennaro Reed et al. (2011) argued that social skill instruction should be emphasized to
focus on friendship making skills between students with disabilities and their non-disabled peers.
The co-investigator agrees that more instruction in the general curriculum should focus on
friendship and how to prevent bullying. Students could also benefit from instruction on acceptance
of disabilities. The author suggests screening students in general and special education for low
self-esteem as well as providing counseling services for all students.

34
References
Banks, M., & Woolfson, L. (2008). Why do students think they fail? The relationship between
attributions and academic self-perceptions. British Journal of Special Education,35(1),
49-56. doi:10.1111/j.1467-8578.2008.00369.x
Becker, H.S. (1963). Outsiders: Studies in the sociology of deviance. New York: Free Press of
Glencoe.
Boyle C., (2013). Labeling in special education: Where do the benefits lie? In A.Holliman (Ed.)
Educational Psychology: An International Perspective. London:Routledge.
Bramston, P., Bruggerman, K., & Pretty, G. (2002). Community perspectives and subjective
quality of life. International Journal of Disability, Development & Education, 49(4),
385-397. doi:10.1080/1034912022000028358
Conley, T. D., Ghavami, N., VonOhlen, J., & Foulkes, P. (2007). General and domain-specific
self-esteem among regular education and special education students. Journal of
Applied Social Psychology, 37(4), 775-789. doi:10.1111/j.1559-1816.2007.00185.x
DiGennaro Reed, F., McIntyre, L., Dusek, J., & Quintero, N. (2011). Preliminary assessment of
friendship, problem behavior, and social adjustment in children with disabilities in an
inclusive education setting. Journal of Developmental & Physical Disabilities, 23(6),
477-489. doi:10.1007/s10882-011-9236-2
Frederickson, N. (2010). Bullying or befriending? Children's responses to classmates with
special needs. British Journal of Special Education, 37(1), 4-12. doi:10.1111/j.1467-
8578.2009.00452.x
Gates, J. (2010). Children with gifts and talents: Looking beyond traditional labels. Roeper
Review, 32(3), 200-206. doi:10.1080/02783193.2010.485308

35
Georgiadi, M., Kalyva, E., Kourkoutas, E., & Tsakiris, V. (2012). Young children's attitudes
toward peers with intellectual disabilities: Effect of the type of school. Journal of
Applied Research in Intellectual Disabilities, 25(6), 531-541. doi:10.1111/j.1468-
3148.2012.00699.x
Gillman, M., Heyman, B., & Swain, J., (2000). What’s in a name? The implications of diagnosis
for people with learning difficulties and their family carers. Disability and Society, 15(3),
389-409.
Goffman, E. (1959). The presentation of the self in everyday life. London: Penguin.
Henley, M., Ramsey, R., & Algozzine, R. (2009). Characteristics of and strategies for teaching
students with mild disabilities (6th ed., pp. 32-34). Boston: Pearson Allyn Bacon
Prentice Hall.
Hobbs, N. (1975) Ed. The future of children. San Francisco: Jossey Bass.
Kelly, N., & Norwich, B. (2004). Pupils' perceptions of self and of labels: Moderate learning
difficulties in mainstream and special schools. British Journal of Educational
Psychology, 74(3), 411-435.
Lauchlan, F., & Boyle, C. (2007). Is the use of labels in special education helpful? Support for
Learning, 22(1), 36-42. doi:10.1111/j.1467-9604.2007.00443.x
Little, M., & Kobak, R. (2003). Emotional security with teachers and children’s stress reactivity:
A comparison of special education and regular classrooms. Journal of Clinical Child and
Adolescent Psychology, 32: 127-138.
Reynolds, C., & Fletcher-Janzen, E. (Eds.). (2004). Labeling. In Concise Encyclopedia of
Special Education: A Reference for the Education of the Handicapped and Other
Exceptional Children and Adults (2nd ed., p. 559). New York: Wiley.
36
Rosenberg, M. (1979). Conceiving the Self. New York: Basic Books.
Rosenthal, R., & Babad, E. Y. (1985). Pygmalion in the gymnasium. Educational Leadership,
43(1), 36–39.
Rosenthal, R., & Jacobson, L. (1968). Pygmalion in the classroom: Teacher expectation and
pupils’ intellectual development. New York: Rinehart and Winston.
Thomson, M. (2012). Labeling and self-esteem: Does labeling exceptional students impact their
self-esteem? Support for Learning, 27(4), 158-165. doi:10.1111/1467-9604.12004
U. S. Department of Education. (2004). Individuals with Disabilities Education Act. Retrieved
from http://idea.ed.gov
37
APPENDICES

38
Appendix A. IRB Approval

39
Appendix B. Consent
Parental Consent/Permission
Labeling: Student Self-Esteem and the Stigma of a Label
Amanda Sowards, B.A., Co-investigator
Jane Bogan, PhD, Principal Investigator
Introduction
Your child is invited (with your permission) to be in a research study. Research studies are designed to
gain scientific knowledge that may help other people in the future. Your child may or may not receive any benefit from being part of the study. There may also be risks associated with being part of research studies.
If there are any risks involved in this study then they will be described in this consent. Participation is
voluntary so please take your time to make your decision, and ask your research investigator or research staff to explain any words or information that you do not understand.
Why Is This Study Being Done?
The purpose of this study is to determine if labeling has an impact on the self- esteem of students with
exceptionalities in grades three through five and to determine how the students with exceptionalities are perceived by their peers. The researcher will utilize surveys and questionnaires with rating scales to gather
data from elementary students with and without disabilities in third through fifth grade. If there truly is a
negative correlation among labeled students’ self-esteem, ability to make friends or an overall negative perception by their peers, future studies would need to address a means for combating such problems.
Teachers and students could be provided with various strategies and instructional techniques that support
positive interactions and acceptance of individuals with exceptionalities. Knowing the negative aspects associated with labeling can help students with special needs as well as their parents and teachers to help
combat the negative stigma.
How Many Will Take Part In The Study?
It is anticipated that 70 children will take part in this study. A total of 128 subjects are the most that would
be able to enter the study since that is the maximum number of subjects in the candidate pool of third, fourth and fifth graders enrolled at Midway Elementary.
What Is Involved In This Research Study?
In order to participate in the study, your child will complete an online survey in the computer lab during
the school day. The survey consists of three parts: Demographic, Rosenberg Self-esteem Scale and
Socialization and Labels.
Initial ______

40
How Long Will Your Child Be In The Study?
Your child will be in the study for the length of time it takes to complete the survey (about 15 minutes).
You or your child can decide to stop participation at any time. If you decide to stop your child’s
participation in the study we encourage you to talk to the study investigator or study staff as soon as
possible.
The study investigator may stop your child from taking part in this study at any time if he/she believes it is
in your child’s best interest; if your child does not follow the study rules; or if the study is stopped.
What Are The Risks Of The Study?
There are no known risks to those who take part in this study.
Are There Benefits To Taking Part In The Study?
If you agree to allow your child to take part in this study, there may or may not be direct benefit to them.
We hope the information learned from this study will benefit other people in the future. The benefits of
participating in this study may be: an increase in social and self-awareness stemming from the self-reflective nature of the survey questions.
What About Confidentiality?
We will do our best to make sure that your child’s personal information is kept confidential. However, we
cannot guarantee absolute confidentiality. Federal law says we must keep your child’s study records private. Nevertheless, under unforeseen and rare circumstances, we may be required by law to allow certain
agencies to view your child’s records. Those agencies would include the Marshall University IRB, Office
of Research Integrity (ORI) and the federal Office of Human Research Protection (OHRP). This is to make sure that we are protecting your child’s rights and safety. If we publish the information we learn from this
study, your child will not be identified by name or in any other way.
What Are The Costs Of Taking Part In This Study?
There are no costs to you for allowing your child to take part in this study. All the study costs, including any study tests, supplies and procedures related directly to the study, will be paid for by the study.
Will You Be Paid For Participation?
You will receive no payment or other compensation for your child’s participation in this study.
Initial ______
41
What Are Your Rights As A Research Study Participant?
Taking part in this study is voluntary. You may choose not to allow your child to take part or you may
withdraw them from the study at any time. Refusing to participate or leaving the study will not result in
any penalty or loss of benefits to which you or your child are entitled. If you decide to stop your child’s
participation in the study we encourage you to talk to the investigators or study staff first.
Whom Do You Call If You Have Questions Or Problems?
For questions about the study, contact the study investigators:
Principal Investigator, Jane Bogan at (304) 746-1957 Co-investigator, Amanda Sowards at (304)756-3121.
You should also call the investigator if you have a concern or complaint about the research.
For questions about your rights as a research participant, contact the Marshall University IRB#2 Chairman Dr. Stephen Cooper at (304) 696-7320. You may also call this number if:
o You have concerns or complaints about the research.
o The research staff cannot be reached. o You want to talk to someone other than the research staff.
You will be given a signed and dated copy of this consent form.
SIGNATURES
You grant permission for your child ___________________________________ to take part in this study.
You have had a chance to ask questions about this study and have had those questions answered. By signing
this consent form you are stating that you are not giving up any legal rights to which you or your child are entitled.
________________________________________________
Parent Name (Printed)
________________________________________________ _________________
Parent Signature Date
________________________________________________
Person Obtaining Consent (Printed)
________________________________________________ _________________
Person Obtaining Consent Signature Date
Initial ______

42
Appendix C. Assent
Marshall University
Child’s Assent for Being in a Research Study
Title: Labeling: How Students Feel About Themselves and Others.
Why are you here?
I am asking you to take part in a research study because I am trying to learn more about how
students feel about being given a label for Special Education classes. I also want to know about what
students in regular classrooms think about students who go to other classrooms for help.
I am inviting you to be in the study because you are easy to get in contact with and you are old
enough to complete the survey.
Why am I doing this study?
I want to make sure all students feel good about themselves and understand that everyone is special
in their own way. With your help, I might be able to encourage parents, teachers, students and people in
the community to better accept people with disabilities.
What will happen to you?
You will go to the computer lab and take an online survey. The survey will only take about fifteen
minutes. You will read 32 questions and answer them honestly by selecting a multiple choice answer.
Will the study help you?
Some of the questions in the survey will make you think about your feelings and the feelings of
others. This will help you to reflect on how you think, feel and act as a person.
What if you have any questions?
You can ask any questions that you have about the study. If you have a question later that you
didn’t think of now, you can come to my room and talk to me before or after school hours.
Do your parents know about this?
This study was explained to your parents and they said that you could be in it if you want. You can
talk this over with them before you decide. Initial ______

43
Do you have to be in the study?
You do not have to be in the study. No one will be upset if you don’t want to do this. If you don’t
want to be in this study, you just have to tell your parents and your teacher. It's up to you.
Putting a checkmark by the word YES and writing your name after that means you agree to be in
the study, and know what will happen to you.
You have talked to your parents and Mrs. Sowards about the study. You have had all of your
questions answered. You understand that you can stop being in this study at any time and no one will be
angry or upset with you. Indicate your choice below:
(Check One)
____YES, I want to be in the study. ____NO, I do not want to be in the study.
____________________________ ___________
Name of Child (Print) Date
____________________________ ___________________________ ___________ Name of Witness (Print) Signature of Witness Date
____________________________ ___________________________ ___________ Name of Researcher (Print) Signature of Researcher Date
Initial ______
44
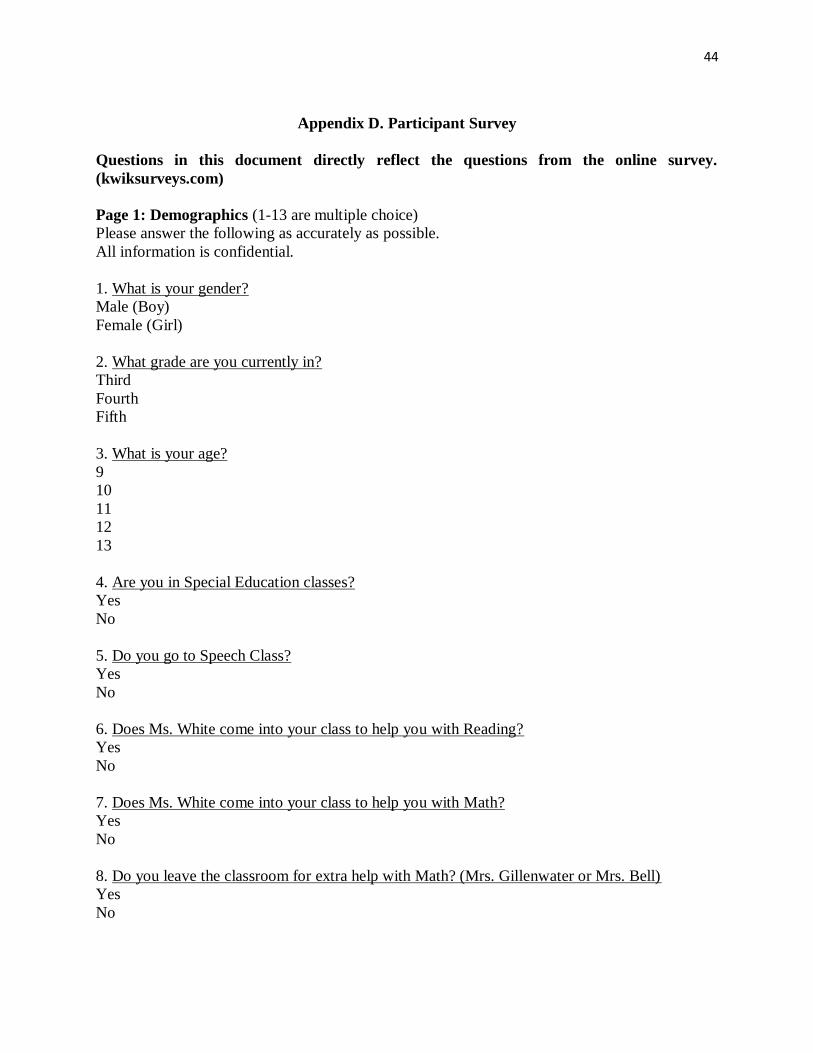
Appendix D. Participant Survey
Questions in this document directly reflect the questions from the online survey.
(kwiksurveys.com)
Page 1: Demographics (1-13 are multiple choice)
Please answer the following as accurately as possible.
All information is confidential.
1. What is your gender?
Male (Boy)
Female (Girl)
2. What grade are you currently in?
Third
Fourth
Fifth
3. What is your age?
9
10
11
12
13
4. Are you in Special Education classes?
Yes
No
5. Do you go to Speech Class?
Yes
No
6. Does Ms. White come into your class to help you with Reading?
Yes
No
7. Does Ms. White come into your class to help you with Math?
Yes
No
8. Do you leave the classroom for extra help with Math? (Mrs. Gillenwater or Mrs. Bell)
Yes
No

45
9. Do you leave the classroom for extra help with Reading? (Mrs. Gillenwater or Mrs. Bell)
Yes
No
10. Do you go to Mrs. Fraley's room for Math?
Yes
No
11. Do you go to the Gifted Program? (Mrs. Browning)
Yes
No
12. Do you go to Mrs. Fraley's room for Reading?
Yes
No
13. Do you receive OT (Occupational Therapy) or PT (Physical Therapy) services?
Yes
No
Page 2: Rosenberg Self-Esteem Scale (14-23 use a Likert Scale)
*Questions 14-23 were taken from:
Rosenberg, M. (1965). Society and the adolescent self-image. Princeton, NJ: Princeton
University Press.
14. On the whole, I am satisfied with myself.
Strongly Agree Agree Disagree Strongly Disagree
15. At times I think I am no good at all.
Strongly Agree Agree Disagree Strongly Disagree
16. I feel that I have a number of good qualities.
Strongly Agree Agree Disagree Strongly Disagree
17. I am able to do things as well as most other people.
Strongly Agree Agree Disagree Strongly Disagree
18. I feel I do not have much to be proud of.
Strongly Agree Agree Disagree Strongly Disagree

46
19. I certainly feel useless at times.
Strongly Agree Agree Disagree Strongly Disagree
20. I feel that I'm a person of worth, at least on an equal plane with others.
Strongly Agree Agree Disagree Strongly Disagree
21. I wish I could have more respect for myself.
Strongly Agree Agree Disagree Strongly Disagree
22. All in all, I am inclined to feel that I am a failure.
Strongly Agree Agree Disagree Strongly Disagree
23. I take a positive attitude toward myself.
Strongly Agree Agree Disagree Strongly Disagree
Page 3: Socialization and Labels (24-32 use a drop-down menu, 31-33 are multiple choice.)
Please answer the following honestly.
24. How do you feel about your ability to make friends?
I make friends very easily.
It’s hard to make friends.
25. How many friends do you have? (Friends meaning people you trust, care about and spend time
with often because you choose to.)
Much Smarter
Just as Smart
Not as Smart
26. How smart are you compared to your peers?
Much Smarter
Just as Smart
Not as Smart
27. How smart are you compared to your peers who go to Speech class?
Much Smarter
Just as Smart
Not as Smart

47
28. How smart are you compared to your peers who go to Special Education classes?
Much Smarter
Just as Smart
Not as Smart
29. How smart are you compared to your peers who get extra help from another teacher? (Ms.
White, Mrs. Bell or Mrs. Gillenwater)
Much Smarter
Just as Smart
Not as Smart
30. How likely are you to be friends with someone who has a disability or attends Special
Education Classes?
Very Likely
Likely
Not Likely
31. Have you ever teased or bullied another person because they had a disability?
Yes
No
32. Have you ever been teased or bullied by another person because you have a disability?
Yes
No
48
Appendix E. Thesis and Dissertation Permissions Page