Label-free, Native Analyte Screening via the RapidFire High
60
1 Label-free, Native Analyte Screening via the RapidFire™ High-throughput Mass Spectrometry Platform William LaMarr, Ph.D. Senior R&D Manager, RapidFire™ Agilent Technologies, Inc. November 9, 2011
Transcript of Label-free, Native Analyte Screening via the RapidFire High

1
Label-free, Native Analyte
Screening via the RapidFire™
High-throughput Mass
Spectrometry Platform
William LaMarr, Ph.D.
Senior R&D Manager, RapidFire™
Agilent Technologies, Inc.
November 9, 2011

Label-free, Native Analyte Screening via the RapidFire
High-throughput Mass Spectrometry Platform
Turning
mass spectrometers
into plate readers
Enabling intractable
screening targets
in challenging
therapeutic areas
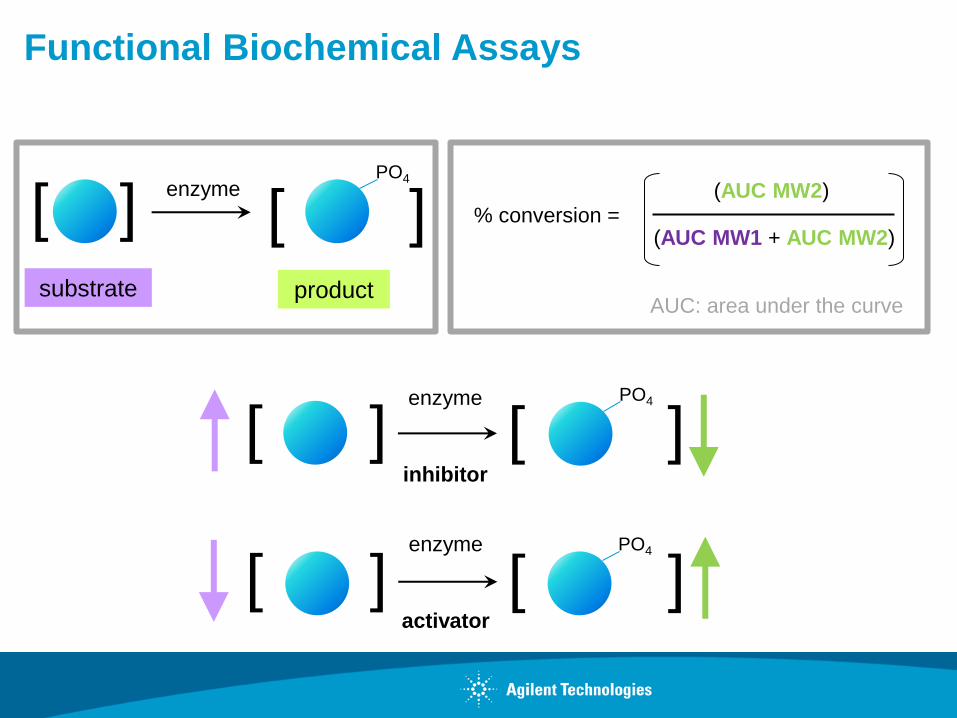
Functional Biochemical Assays
[ ] [ ] product substrate
enzyme (AUC MW2)
(AUC MW1 + AUC MW2) % conversion =
AUC: area under the curve
[ ] [ ] enzyme
inhibitor
[ ] [ ] enzyme
activator
PO4
PO4
PO4

Advantages of mass spectrometry
• True label-free detection
• Direct, quantitative measurements
• Native reaction substrates & products
– (no radioactivity, no surrogate analytes,
no indirect or secondary components)
• Functional biochemical assays
– (rather than target binding assays)
• How to bring innovation while maintaining automation?
instead of :
PO4
PO4

Limitations of MS
Molecules must be charged
Desalting step required
Sample purification is
– Serial
– slow
Instrumentation is expensive,
– not easily scalable
– to meet demand
• How to bring innovation while maintaining automation?

From HPLC … (high performance liquid chromatography)
6
product
(1’OH-midazolam)
internal standard
(D4-1’OH-midazolam)
Well A1
Well A1

internal standard
(d4-1’OH-midazolam)
product
(1’OH-midazolam)
… to RapidFire

RapidFire Mass Spectrometry Fast sample purification system
• Integrated, automated, micro-
scale solid-phase extraction
(mSPE)
• Replaces LC in LC/MS
• cycle time: 6–10s/sample
Compatible with many
biological matrices
• Microsomal preparation
• Cell culture supernatant
• Tissue extract
• Plasma, whole blood, urine

SPE-MS/MS Analysis
Aqueous
wash
Organic
reverse
elution
waste
Mass spec
9

…..To RapidFire
10
Internal standard:
(D4-a-hydroxymidazolam)
Product:
(a-hydroxymidazolam)
A1 H12

Applications of the RapidFire Platform
1) Native Analyte Detection
- surrogate substrates can introduce confounding factors, effect enzyme kinetics, and produce data artifacts
2) Replace Intractable Assays
- assays may present challenges in workflow, may be resource intensive, may be cost prohibitive, may present regulatory issues (radioactivity)
3) Enable Target Classes
- multiple modification events on the same substrate are impossible to track by many common optical and radioactive methodlogies

1) Native Analyte Detection
Native Analyte
Detection
Example 1

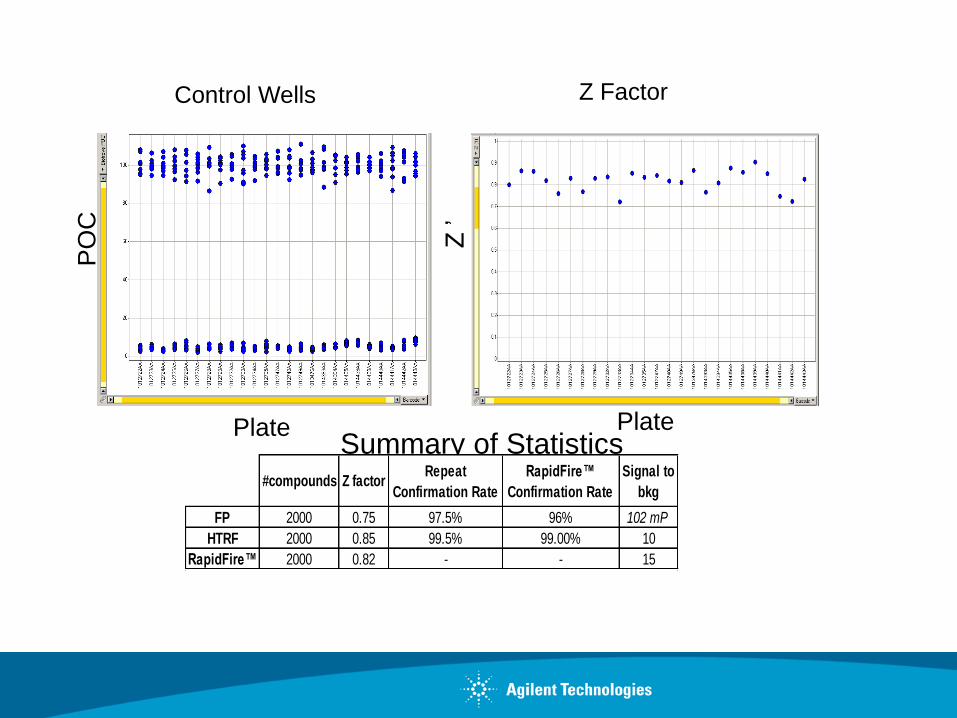
Example 1a: Amgen – Lck Kinase Introducing Confounding Factors
Barcode
Summary of Statistics #compounds Z factor
Repeat
Confirmation Rate
RapidFire™
Confirmation Rate
Signal to
bkg
FP 2000 0.75 97.5% 96% 102 mP
HTRF 2000 0.85 99.5% 99.00% 10
RapidFire™ 2000 0.82 - - 15
Plate Plate Z
’’
PO
C
Z Factor Control Wells


• Rank SAR was preserved when IC50s from RapidFire
were compared to either HTRF and FP-IMAP
RapidFire IC50 (uM) RapidFire IC50 (uM) F
P-I
MA
P IC
50
(u
M)
HT
RF
IC
50
(uM
) IC50 SAR Rank Order Correlation Analysis


Cellular Activity of Hits “Uniquely” Identified by RapidFire

Example 1b: Schering Plough - LpxC Assay Affecting Enzyme Kinetics
O
O
HO
O
NH
O
O P O P O
O O
OH OH
O
HO OH
N
HN
O
O
HO
OH
LpxC
acetate Formula Weight
833.709 amu
Formula Weight
791.672 amu
O
O
HO
O
NH2
O P O P O
O O
OH OH
O
HO OH
N
HN
O
O
HO
OH

N
N H
O
O
O
O H O H
O P O P O
O
O H
O
O H
O
O H
O H
O N H
C H 3
O H C H 3
O
N H
N
NH
O
O
O
OHOH
OPOPO
O
OH
O
OH
O
OH
OH
O NH
CH3
O
OH
CH3
O
UDP-3-O-(R-3-hydroxymyristoyl)-
N-acetylglucosamine
Literature Km = 2.0 mM*
BioTrove Km = 0.9 to 1.2 mM
UDP-3-O-(N-hexyl-
propionamide)-
N-acetylglucosamine
Literature Km = 367 mM*
* A Fluorescence-Based Homogeneous Assay for Measuring Activity of UDP-3-O-
(R-3-Hydroxymyristoyl)-N-acetylglucosamine Deacetylase
Wen Wang, Mita Maniar, Rakesh Jain, Jeff Jacobs, Joaquim Trias, Zhengyu Yuan
Analytical Biochemistry 290, 338-346 (2001)

0
5000
10000
15000
20000
25000
30000
35000
% Inhibition
Distribution of % Inhibition values
(>250,000 wells)

0 1 2 3 4 50
10
20
30
40
75
125
5 7 9 11 13 15
Nu
mb
er
of
hit
s
Average IC50 (µg/ml)
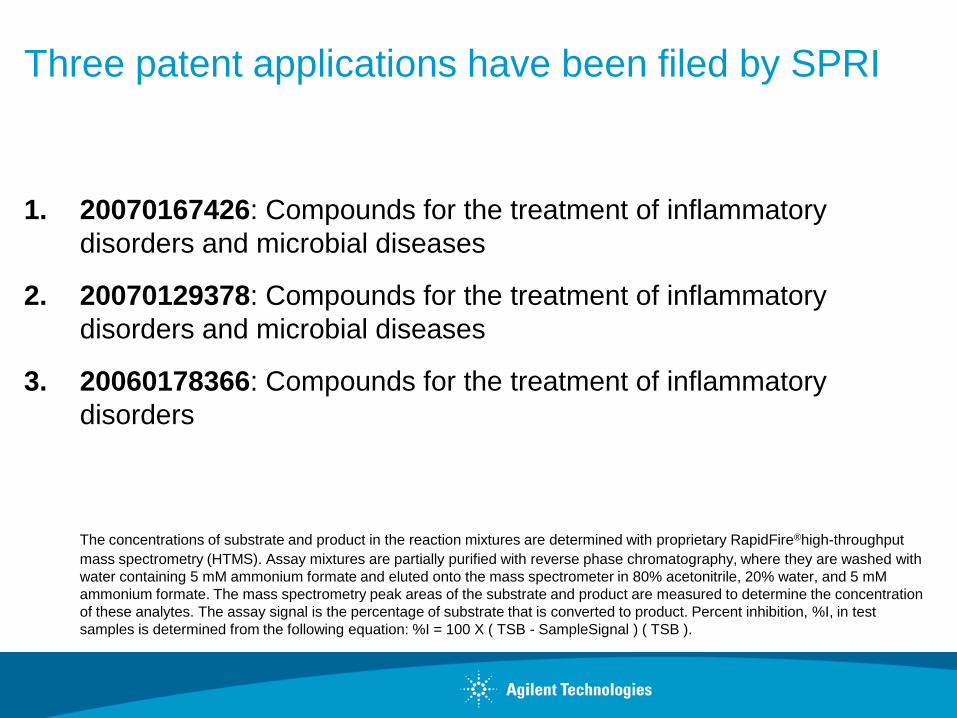
Three patent applications have been filed by SPRI
1. 20070167426: Compounds for the treatment of inflammatory
disorders and microbial diseases
2. 20070129378: Compounds for the treatment of inflammatory
disorders and microbial diseases
3. 20060178366: Compounds for the treatment of inflammatory
disorders
The concentrations of substrate and product in the reaction mixtures are determined with proprietary RapidFire®high-throughput
mass spectrometry (HTMS). Assay mixtures are partially purified with reverse phase chromatography, where they are washed with
water containing 5 mM ammonium formate and eluted onto the mass spectrometer in 80% acetonitrile, 20% water, and 5 mM
ammonium formate. The mass spectrometry peak areas of the substrate and product are measured to determine the concentration
of these analytes. The assay signal is the percentage of substrate that is converted to product. Percent inhibition, %I, in test
samples is determined from the following equation: %I = 100 X ( TSB - SampleSignal ) ( TSB ).

Example 1c: Sirtris – SIRT1 Assay Introducing Data Artifacts

The Resveratrol Saga
“Pfizer scientists have thrown down the gauntlet…claim that the reported Sirtris
compounds do not do what they are claimed to do… suggest that Sirtris' earlier
findings are due to an experimental artifact…almost certainly the case that there
are problems with the Sirtris compounds”

Fluor de Lys Assay From Enzo

Labeled vs. Un-labeled Sirtuin Assay
HN CH C
CH2
O
O
CH2
CH2
CH2
HN
ProteinProtein
O
H2N CH C
CH2
O
O
CH2
CH2
CH2
NH2
Protein
SIRT1/Chymotrypsin
“Labeled”
Acetylated
Protein
De-Acetylated Peptide
Resveratrol
Free fluorophore
Reaction
Activation
HN CH C
CH2
O
O
CH2
CH2
CH2
HN
ProteinProtein
O
HN CH C
CH2
O
O
CH2
CH2
CH2
NH2
ProteinProtein
“Unlabeled”
Acetylated
Peptide
De-Acetylated Peptide
Resveratrol
X No
Reaction
Activation
SIRT1/Chymotrypsin
Howitz et. al., Nature (2003) 425:191-196
Kaeberlein et. al., J. Biol. Chem. (2005) 280:17038-17045
Beher et. al., Chem. Biol. Rug Des. (2009) 74:619-624
Pacholec et. al., J. Biol. Chem. (2010) 285:8340-8351

SIRT1 - Enzyme Titration Timecourse
Reaction Conditions:
50 mM Tris pH 7.5
137 mM NaCl
2.7 mM KCl
1 mM MgCl2
0.05% BSA
5 mM DTT
100 mM NAD+
10 mM p53 peptide (Anaspec cat # 62121)
~12.5 minute analysis time
0 minutes
240 minutes
180 minutes 120 minutes
60 minutes
45 minutes
30 minutes
15 minutes Enzyme
Deacetylated Peptide
Acetylated Peptide

SIRT1 - Enzymatic Parameters (Km, IC50, etc…)
Km = 25 ± 6 mM
Km = 38 ± 4 mM
IC50 = 62 ± 1 mM
Literature IC50 value ~ 50 mM Bitterman et. al., J. Biol. Chem. (2002) 277: 45099-45107
Marcotte et. al., Anal. Biochem. (2005) 332:90-99
R² = 0.9999
0
0.05
0.1
0.15
0.2
0.25
0.3
0.35
0.4
0 0.001 0.002 0.003
Init
ial V
elo
cit
y (
V0)
Enzyme Dilution

SIRT1 - Substrate Dependant Activation by Resveratrol
“Labeled” Peptide “Unlabeled” Peptide
Milne et. al., Nature (2007) 450:712-716

2) Replace Intractable Assays
Replace Intractable
Assays
Example 2

Example 2a: Pfizer – Stearoyl-Coenzyme A Desaturase
OH
O-O-
HHN
O
HN
O
OP
OO
O OP
O
O-
P O OH
O
N
N
NH2
N
N
NH4+ NH4
+
NH4+
HO
O
S3H
3H
OH
O-O-
HHN
O
HN
O
OP
OO
O OP
O
O-
P O OH
O
N
N
NH2
N
N
NH4+ NH4
+
NH4+
HO
S
O
3H
O3H
+
SCD Enzyme

Stearoyl-Coenzyme A
Oleoyl-Coenzyme A

0.00
0.20
0.40
0.60
0.80
1.00
0 50 100 150 200 250 300 350 400 450 500 550
Plate Number
Z' S
co
re
> 200,000 wells screened


Example 2b: Amgen – 2-Oxoglutarate Oxygenase Enzymes
Protein Hydroxylases
• i.e. Factor inhibiting HIF-1a (FIH)
Small Molecule Hydroxylases
• i.e. Phytanoyl-CoA hydroxylase
DNA Demethylases
• i.e. AlkB


3) Enable Target Classes
Enable Target Classes
Example 3

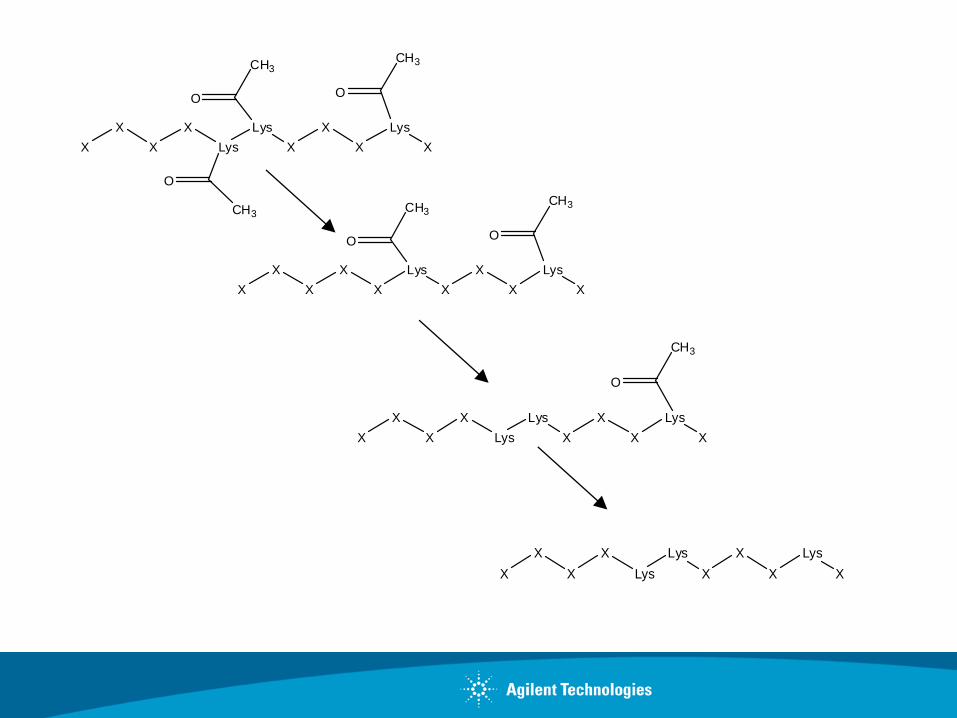
Example 3a: Sirtris – SIRT1 Assay
Coumarin +
360 nM
460 nM
SIRT-1
Chymotrypsin
Arg
His
Lys
Lys
Coumarin
Arg
His
Lys
Lys
(p53, 379-382)
Arg
His
Lys
Lys
Coumarin
CH3
O
X
X
X
X
Lys
Lys
X
X
X
Lys
X
CH3
CH3CH3
O O
O
X
X
X
X
X
Lys
X
X
X
Lys
X
CH3CH3
O O
X
X
X
X
Lys
Lys
X
X
X
Lys
X
CH3
O
X
X
X
X
Lys
Lys
X
X
X
Lys
X

0
10
20
30
40
50
60
70
80
90
100
0 20 40 60 80 100 120
Pe
rce
nt
of
tota
l
Incubation Time (min)
Triacetylated
Diacetylated
Monacetylated
Bare Peptide

10 -1 10 0 10 1 10 2 10 3 10 4 10 5 10 6
0
10
20
30
40
Monoacetylated
Diacetylated
Tricetylated
[inhibitor] (nM)
% c
on
vers
ion
• Monoacetylated IC50= 46.3 nM
• Diacetylated IC50= 127.4 nM
• Triacetylated IC50= 735.6 nM

Example 3b: Glaxo SmithKline – Whole Protein Kinase
Triple Quadrupole (QqQ)
Mass Spectrometry
Time of Flight (TOF)
Mass Spectrometry

Unphosphorylated Peptide
Phosphorylated Peptide

0 minutes
30 minutes
90 minutes
180 minutes
300 minutes
420 minutes

0
50
100
150
200
250
300
0 50 100 150 200
Time (min)
Ph
osp
hate
In
co
rpo
rati
on
(p
Mo
les)
800n
400n
200n
100n
50n
25n
12.5n
0n
0
50
100
150
200
250
0 50 100 150 200 250
[Kinase], nM
Ph
osp
hate
In
co
rpo
rati
on
(p
Mo
les)
Avg
0.43
0.82
0.57
0.82
0.86
Z'
0
10
20
30
40
50
60
70
80
90
100
0 500 1000 1500 2000
[ATP], uM
Ph
osp
hate
In
co
rpo
rati
on
(p
Mo
les)
No E
200 nM E
0
20
40
60
80
100
120
0 200 400 600 800 1000 1200
[Substrate], uM
Ph
osp
hate
In
co
rpo
rati
on
(p
Mo
les)
Avg

0
10
20
30
40
50
60
70
80
0.01 0.1 1 10 100 1000 10000
[Compound], nM
Ph
osp
hate
In
co
rpo
rati
on
(p
Mo
les)
DMSO
Inhibitor

RapidFire Publications & Presentations
PROTEIN MODIFICATION
• Protein kinases (ATK1/PKBa, Lck Kinase)
• Protein hydroxylases (FIH)
• Diubiquitinase
ONCOLOGY
• Farnesyltransferase
• Phosphatidylserine decarboxylase
• Sphingosine Kinase
INFLAMMATION/PAIN
• Prostaglandin-E2 synthase
• Fatty acid amide hydrolase
• Lipoxygenases (5-LOX, 15-LOX)
ANTI-INFECTIVES
• UDP-3-O(R-3-hydroxymyristoyl)-deacetylase [LpxC]
NEUROLOGY
• Phytanoyl-CoA hydroxylase
• Acetylcholinesterase
EPIGENETICS Histone acetylases/deacetylases (sirtuins, HDACs,
HATs)
Protein methylases/demethylases (LSD-1, JMJD2)
DNA demethylases
METABOLIC DISORDER/DIABETES 11b-hydroxysteroid dehydrogenase
Diacylglycerol acyltransferase
Stearoyl-CoA desaturase
GM3 synthase
Acetyl -CoA carboxylase
Serine palmitoyltransferase
ATP citrate lyase
CARDIOVASCULAR DISEASE Phosphatidylethanolamine N-methyltransferase
Phospholipase A2
Cystathionine synthase
*Assays have been demonstrated in whole cells, biological fluids or animal tissues

RapidFire 300 applications for in vitro ADME (absorption-distribution-metabolism-excretion)

AbsorptionDistributionMetabolismExcretion
T½ = 63 minutes
Metabolic Stability Permeability (PAMPA/Caco-2)
Plasma Protein Binding
0
20
40
60
80
100
Levofloxacin Warfarin
Free Fraction
P-Glycoprotein Inhibition
0.001
0.01
0.1
1
10
100
1000
0.001 0.01 0.1 1 10 100 1000
IC50 (uM) by Traditional LCMS @BD Gentest
IC50 (
uM
) by R
apid
Fire @
Bio
Tro
ve
CYP1A2
CYP2B6
CYP2C8
CYP2C9
CYP2C19
CYP2D6
CYP3A4
R2 = 0.986
CYP450 Inhibiton

Pharmacokinetics
0
500
1000
1500
2000
2500
0 5 10 15 20 25 30
[ng/
mL]
Time (h)
Plasma concentration-time curve Dog 1 - Low Dose
LC-MS/MS
RapidFire-MS/MS
J&J Compound #1
0
100
200
300
400
500
600
700
800
900
0.00 1.00 2.00 3.00 4.00 5.00 6.00
Pa
ren
t d
rug
pla
sma
co
nc.
[n
g/
mL
]
Time (h)
Plasma concentraion-time curve
LC-MS/MS
RapidFire-MS/MS Optimized for AG (low DP)RapidFire-MS/MS Optimized for Parent (high DP)
J&J Compound #2
Bioanalytical and Biotransformation Challenges in Meeting
Global Regulatory Expectations & New Technologies for
Drug Discovery Challenges
Applied Pharmaceutical Analysis 2010
September 19 – 22, 2010, Baltimore, MD
Plasma concentration-time curve
Human

Drug Discovery with RapidFire
106 103 101 1 Number of test
compounds:
Target
selection
Label-free
HTS using
native substrate
Preclinical
testing IND
Secondary
screen
HT
ADME/tox
Selectivity
screen
Med Chem
/ SAR
ADME/Tox
• Genomics
• Proteomics
• Metabolomics
• Lipidomics
• Animal models
• Knockouts
• DDI
• Met Stab
• Caco-2, PAMPA
• Protein binding
• GSH binding
• logP, solubility
Cell & Animal Testing:
• PK/PD
• Toxicology
High-throughput
screening
(HTS)

RapidFire resolves bottlenecks…
Improved data quality:
• Throughput allows for
– multiple concentrations: run full IC50s
– multiple time points
• Avoids surrogate substrates, indirect and coupled assays
Maximal productivity:
• Fastest data turnaround
– 10x data generated per FTE compared to LC-MS
• Rapid assay development in HTS faster time to answer
Strong correlation with traditional technologies:
• LC-MS/MS: CYP450 inhibition, metabolic stability, etc
• Optical-probe or radioactivity-based detectors

Advantages of RapidFire
Lower operational costs:
• Solvents: 6 s @3.0 mL/min = 0.25 mL (~2¢/sample)
• Cartridge: $200/cartridge or
~ 3000 samples/cartridge (~7¢/sample)
Minimal reagent & disposal cost in HTS:
• Only native substrate & enzyme are required
• No antibodies, luminescent or radioactive reagents, kits
Fits existing workflows
• Designed to operate similar to a plate reader

RapidFire Customer Solutions
Instrument Sales
Assay Development And Screening
Services
Contract Research Group
• Assay Development
• HTS Screening
• In vitro ADME assay screening
RapidFire Instrument Group
• RF 360 (TOF, QQQ compatible)
• RF 300 (QQQ compatible)
• RF 200 (QQQ compatible)

Customers & Collaborators who have published
or presented RapidFire data
- Glaxo SmithKline
- Amgen
- Astra Zeneca
- Genzyme
- Becton Dickinson
- Merck
- Roche
- Pfizer
- Takeda
- Sirtris
- Bayer
- Exelixis
- Boehringer Ingelheim
- Schering-Plough
- OSI Pharmaceuticals
- Johnson & Johnson
- Bristol-Myers Squibb
- Novartis
- Biogen Idec
- MIT

Please Contact Us with
RapidFire Application
Questions
William A. LaMarr, Ph.D.
Senior Manager, R&D
RapidFire
(781)928-2718
http://www.chem.agilent.com/en-US/Products/Instruments/ms/rapidfire/pages/default.aspx